A receptor-like kinase mutant with absent endodermal diffusion barrier displays selective nutrient homeostasis defects
- University of Lausanne, Switzerland
- CNRS/INRA/SupAgro/Université Montpellier, France
- Hokkaido University, Japan
- University of Aberdeen, United Kingdom
Figures
Figure 1 with 2 supplements
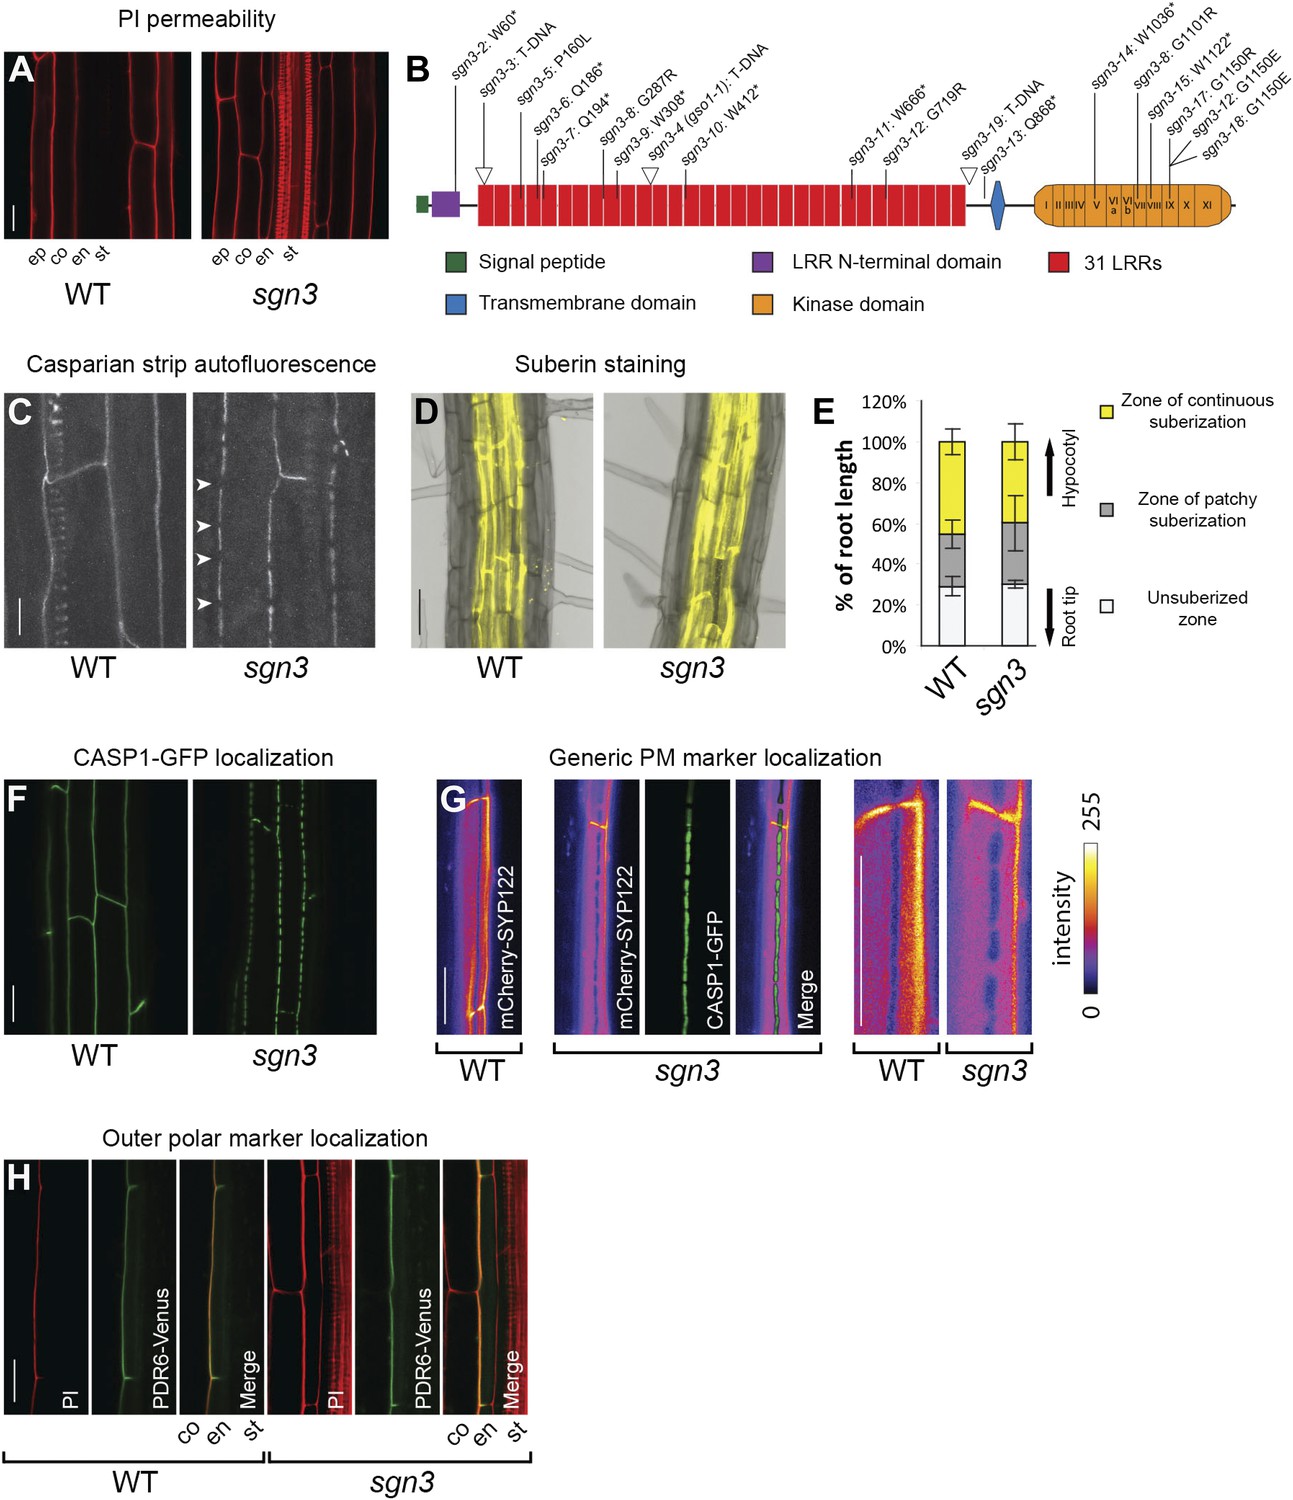
SGN3 receptor-like kinase is important to establish a functional endodermal barrier.
(A) Lack of endodermal diffusion barrier in sgn3-3 visualized by presence of propidium iodide (PI) in stele. (B) Diagram of the SGN3 protein showing the different domains, T-DNA insertion lines (indicated with triangles) and the ethyl methanesulfonate (EMS)-induced mutations (see also Figure 1—figure supplement 2). (C) Surface view of Casparian strip, visualized by autofluorescence after clearing. Note discontinuous lignin deposition in sgn3-3. Pictures are maximum projections of confocal z-stacks. Arrowheads indicate discontinuities in sgn3. Spiral-like signal in WT is from deeper-lying xylem vessel. (D) Fluorol yellow staining of suberin lamellae deposition in sgn3-3 and WT. Pictures are overlays of transmitted light image (gray) with fluorescent signal from suberin dye (yellow). (E) Occurrence of suberin deposition along the root is not altered in sgn3-3. Suberin lamellae deposition was quantified considering three different zones: non-suberized zone, zone of patchy suberization, and zone of continuous suberization (n = 5, one representative experiment presented). (F) Surface view of CSD network visualized with CASP1-GFP expressed under CASP1 promoter showing the net-like structure with discontinuities in sgn3-3. Projections as in C. (G) Absence of a lateral diffusion barrier in sgn3-3 visualized with plasma membrane marker line CASP1::mCherry-SYP122 (intensity color coded). Confocal pictures were taken at the surface of an endodermal cell. Note the mutually exclusive localization with the CSD marker CASP1-GFP (green). Two right images are magnification of the two leftmost images. (H) Localization of the outer marker PDR6-Venus expressed under CASP1 promoter is still polar in sgn3-3. Pictures are median longitudinal sections of endodermal cells. Scale bars: A, C, F, G, H = 20 μm; D = 50 μm. ep, epidermis; co, cortex; en, endodermis; st, stele; LRR, Leucine-rich repeat.
-
Figure 1—source data 1
Detail of SGN3 T-DNA and EMS mutants.
Detail of SGN3 mutations. sgn3-1 EMS mutant was lost during the screen and is not available anymore.
- https://doi.org/10.7554/eLife.03115.004
Figure 1—figure supplement 1
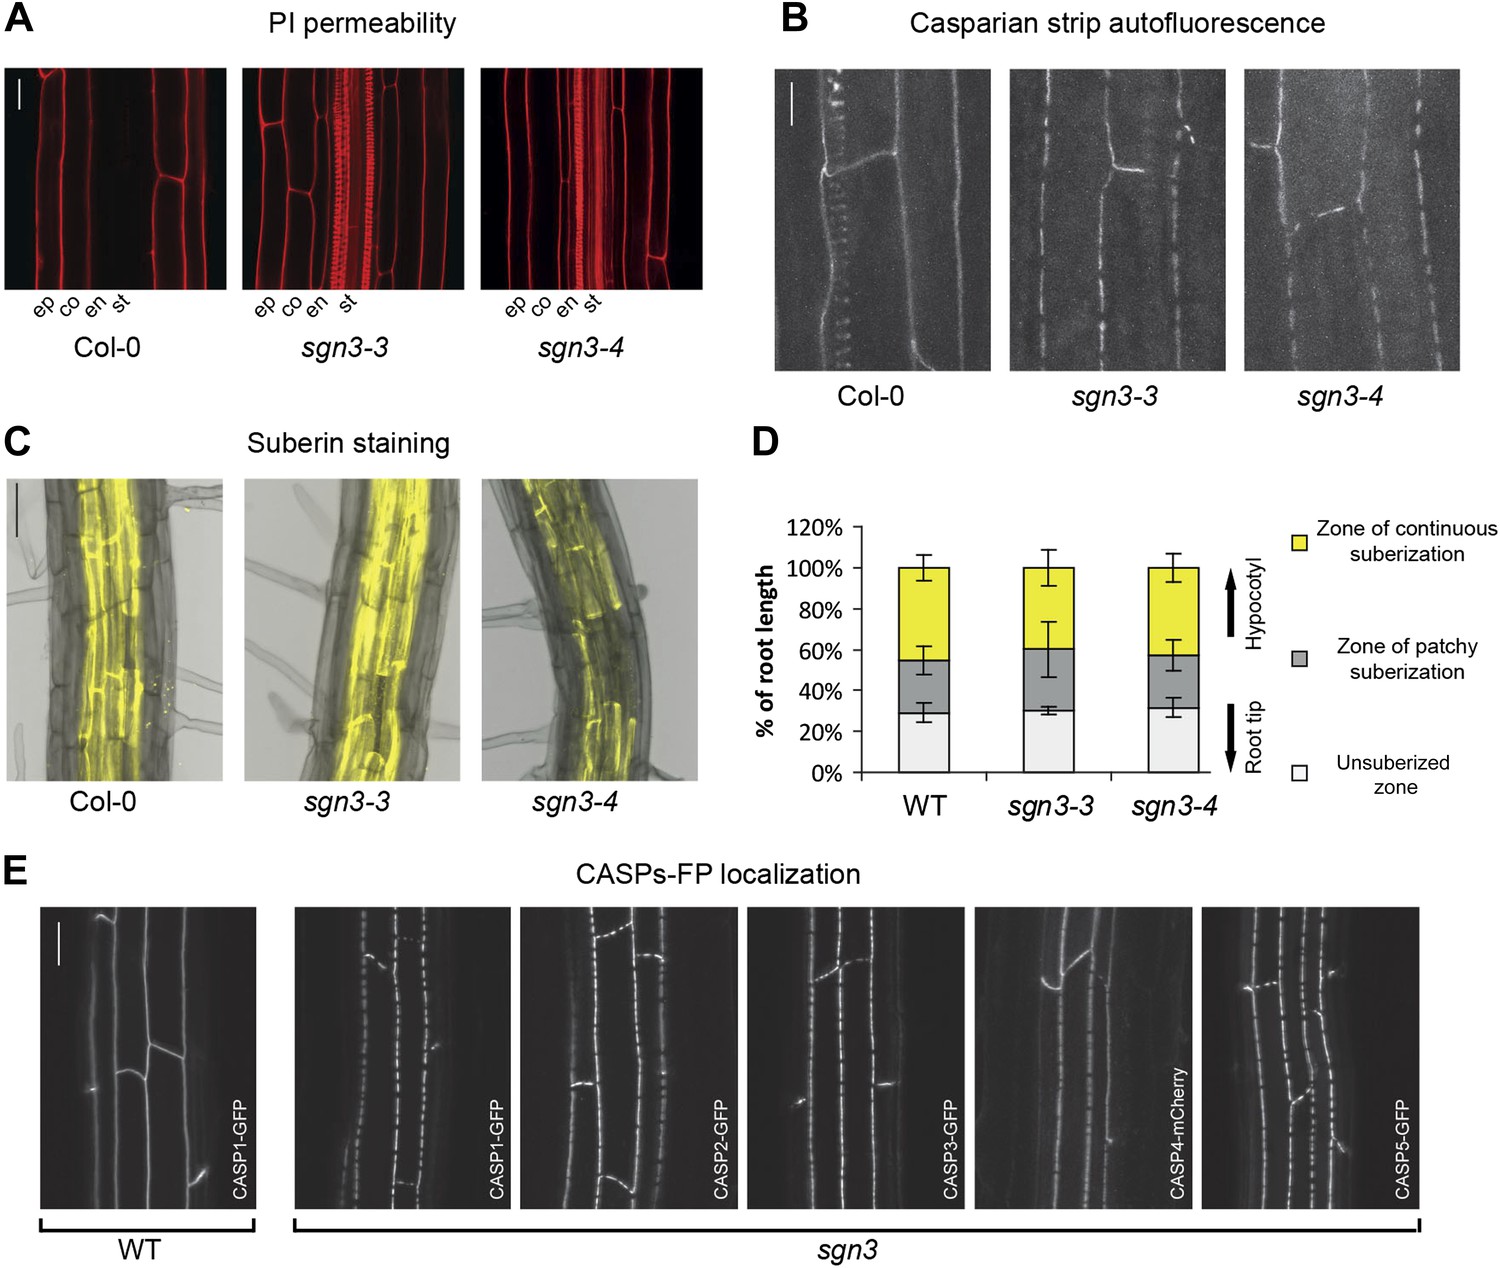
Both Casparian strip domain and Casparian strip but not the suberin are affected in sgn3.
(A) Lack of endodermal diffusion barrier in sgn3-3 and sgn3-4 visualized by free diffusion of propidium iodide (PI) into stele. (B) Surface view of Casparian strips by autofluorescence after clearing shows discontinuous lignin deposition in sgn3-3 and sgn3-4. Pictures are maximum projections of confocal z-stacks. (C) Fluorol yellow staining in WT, sgn3-3, and sgn3-4. (D) Suberin deposition along the root is not altered in sgn3-3 and sgn3-4. Suberin lamellae deposition was quantified as in Figure 1E (n = 5, one representative experiment shown). (E) Surface view of CSD network visualized with CASP1-GFP, CASP2-GFP, CASP3-GFP, CASP4-mCherry, and CASP5-GFP under CASP1 promoter showing the discontinuous net-like structures in sgn3-3. Projections as in B. Scale bars: A, B, E, 20 μm; C, 50 μm. ep, epidermis; co, cortex; en, endodermis; st, stele.
Figure 1—figure supplement 2
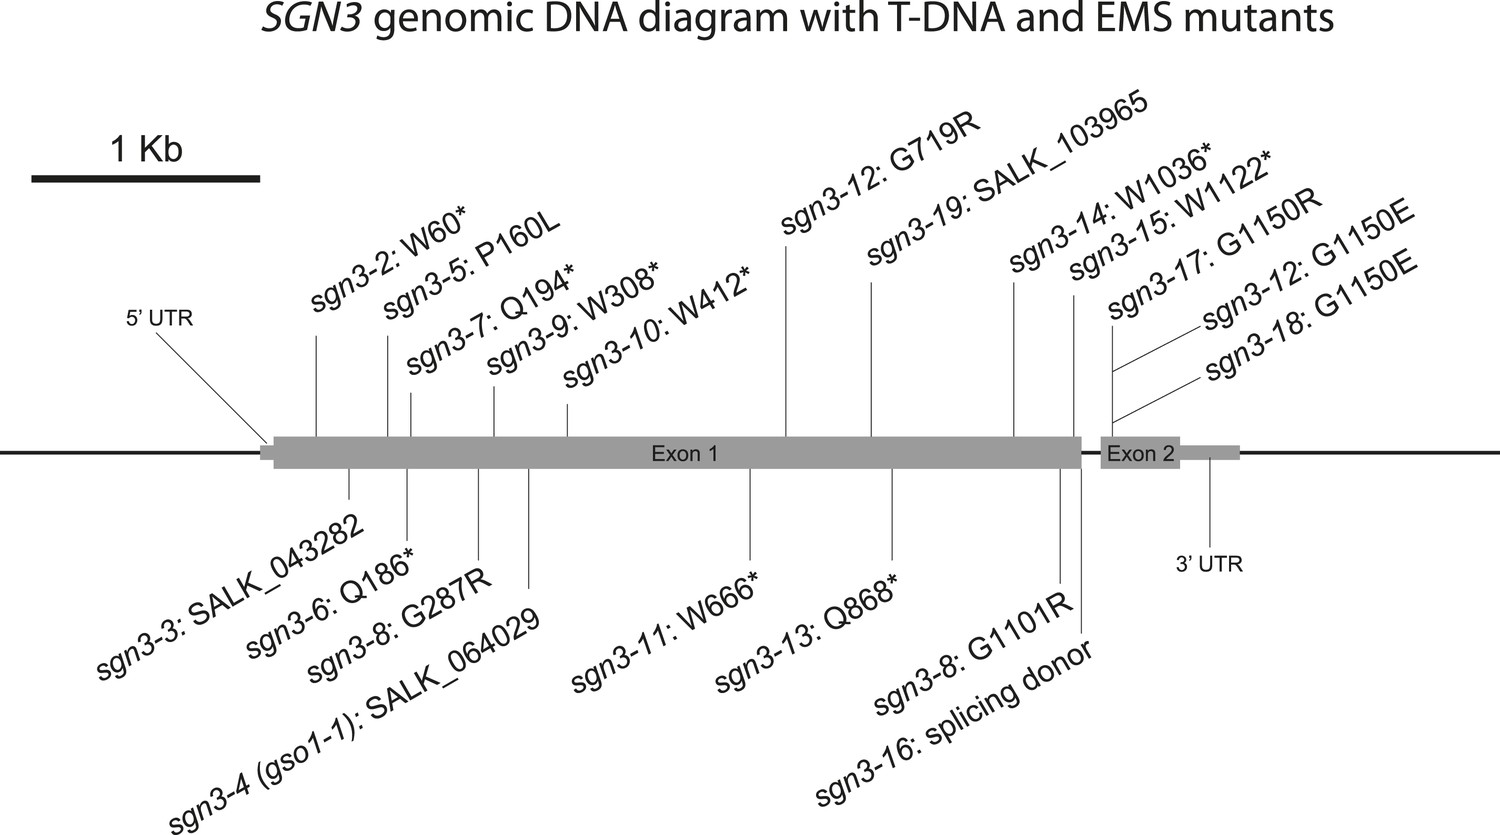
Diagram of SGN3 genomic DNA with T-DNA and EMS mutants.
Schematic of SGN3 genomic region showing the insertions sites of the three T-DNA mutants and the EMS mutants. sgn3-2 was found in a forward genetic, GUS-based screen (Alassimone et al., unpublished), sgn3-5 to sgn3-18 were found in additional forward genetic screen (Kalmbach et al., unpublished). sgn3-3, sgn3-4, and sgn3-19 are T-DNA insertion mutants in the first exon of SGN3.
Figure 2 with 3 supplements
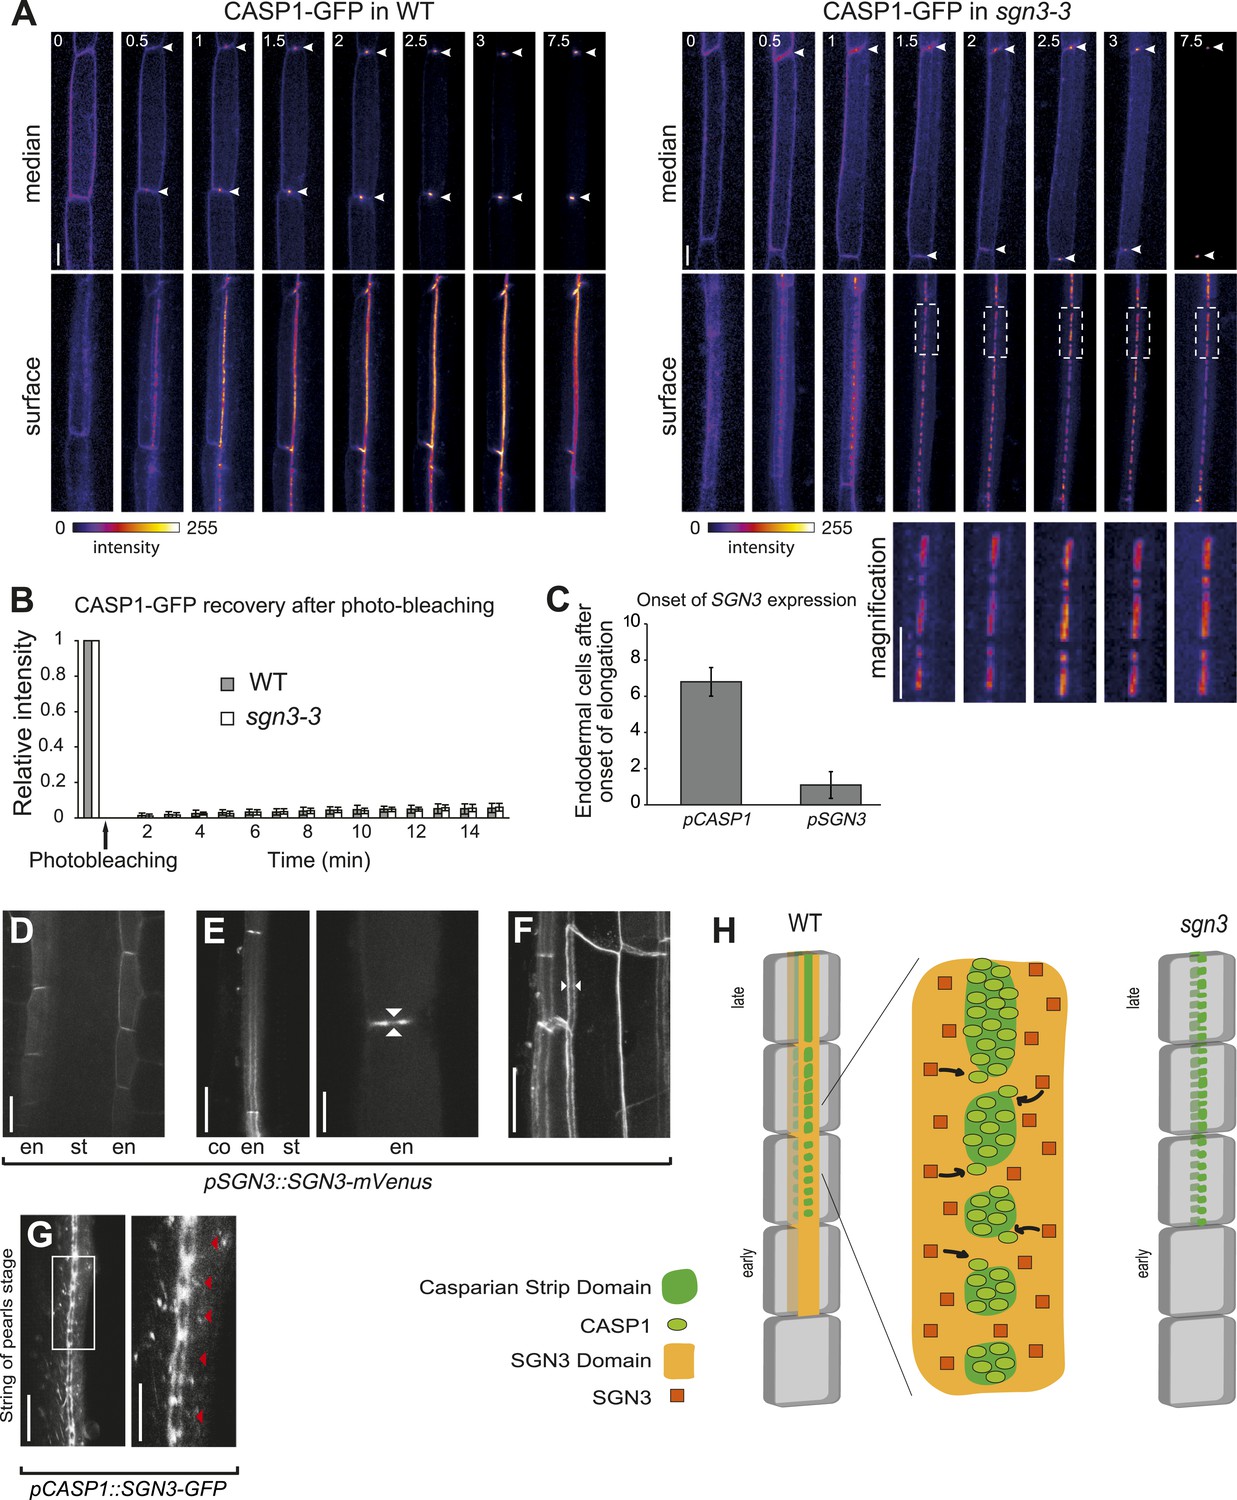
SGN3 localizes on both sides of the Casparian strip domain and is important for the CASP1-GFP patches to fuse into a contiguous band.
(A) 3D-confocal time lapse imaging of CASP1::CASP1-GFP in Col-0 and sgn3-3 background reveals problems with progression of CASP1-GFP localization in sgn3-3. Images show median and surface image of endodermal cells of the same root. Arrowhead indicates CSD, dotted box in sgn3-3 shows immobility of CSD islands. Time in hours. (B) Fluorescence recovery after photobleaching (FRAP) with pCASP1::CASP1–GFP in WT (gray) and sgn3-3 (white). The fifth cell after the onset of CASP1 expression was used. Similar very low recoveries are observed in both genotypes after 15 min. n = 8 independent assays for each series, error bars = s.d. (C) SGN3 is expressed before the onset of CASP1 expression in the endodermis. Quantification was done using pSGN3::SGN3-mVenus and pCASP1::CASP1-GFP. The onset of expression corresponds to the first cell in the endodermis file with a clear fluorescent signal not visible in WT. n = 10. Error bars = s.d. (D) Localization of SGN3-mVenus under its own promoter in elongating endodermal cells. (E) In differentiated endodermal cells, SGN3-mVenus accumulates in the transversal and anticlinal sides of the plasma membrane, but is depleted from the CSD. Left panel shows a transition from a median (top) to a surface (bottom) view of an endodermal cell. Right panel shows a close-up of a median view with SGN3 surrounding the CSD. Arrowheads indicate the CSD. (F) Maximum projection of a z-stack showing the localization of SGN3 on both sides of the CSD. Note the CSD surrounded by two SGN3-mVenus ‘lines’ (white arrowheads). (G) Localization of SGN3-GFP under CASP1 promoter in the ‘string of pearls’ stage. SGN3 surrounds individual CSD patches preceding their fusion (left panel). Close-up showing the CSD patches (red arrowhead) surrounded by SGN3-GFP (right panel). (H) Schematic of SGN3 putative mode of action. The SGN3 kinase might promote addition of new CASP units to already formed CASP microdomains. Scale bars: A, G (left panel), 10 μm; D, E (left panel), F, 20 μm; E (right panel), G (right panel), 5 μm. Ep, epidermis; co, cortex; en, endodermis; st, stele.
Figure 2—figure supplement 1
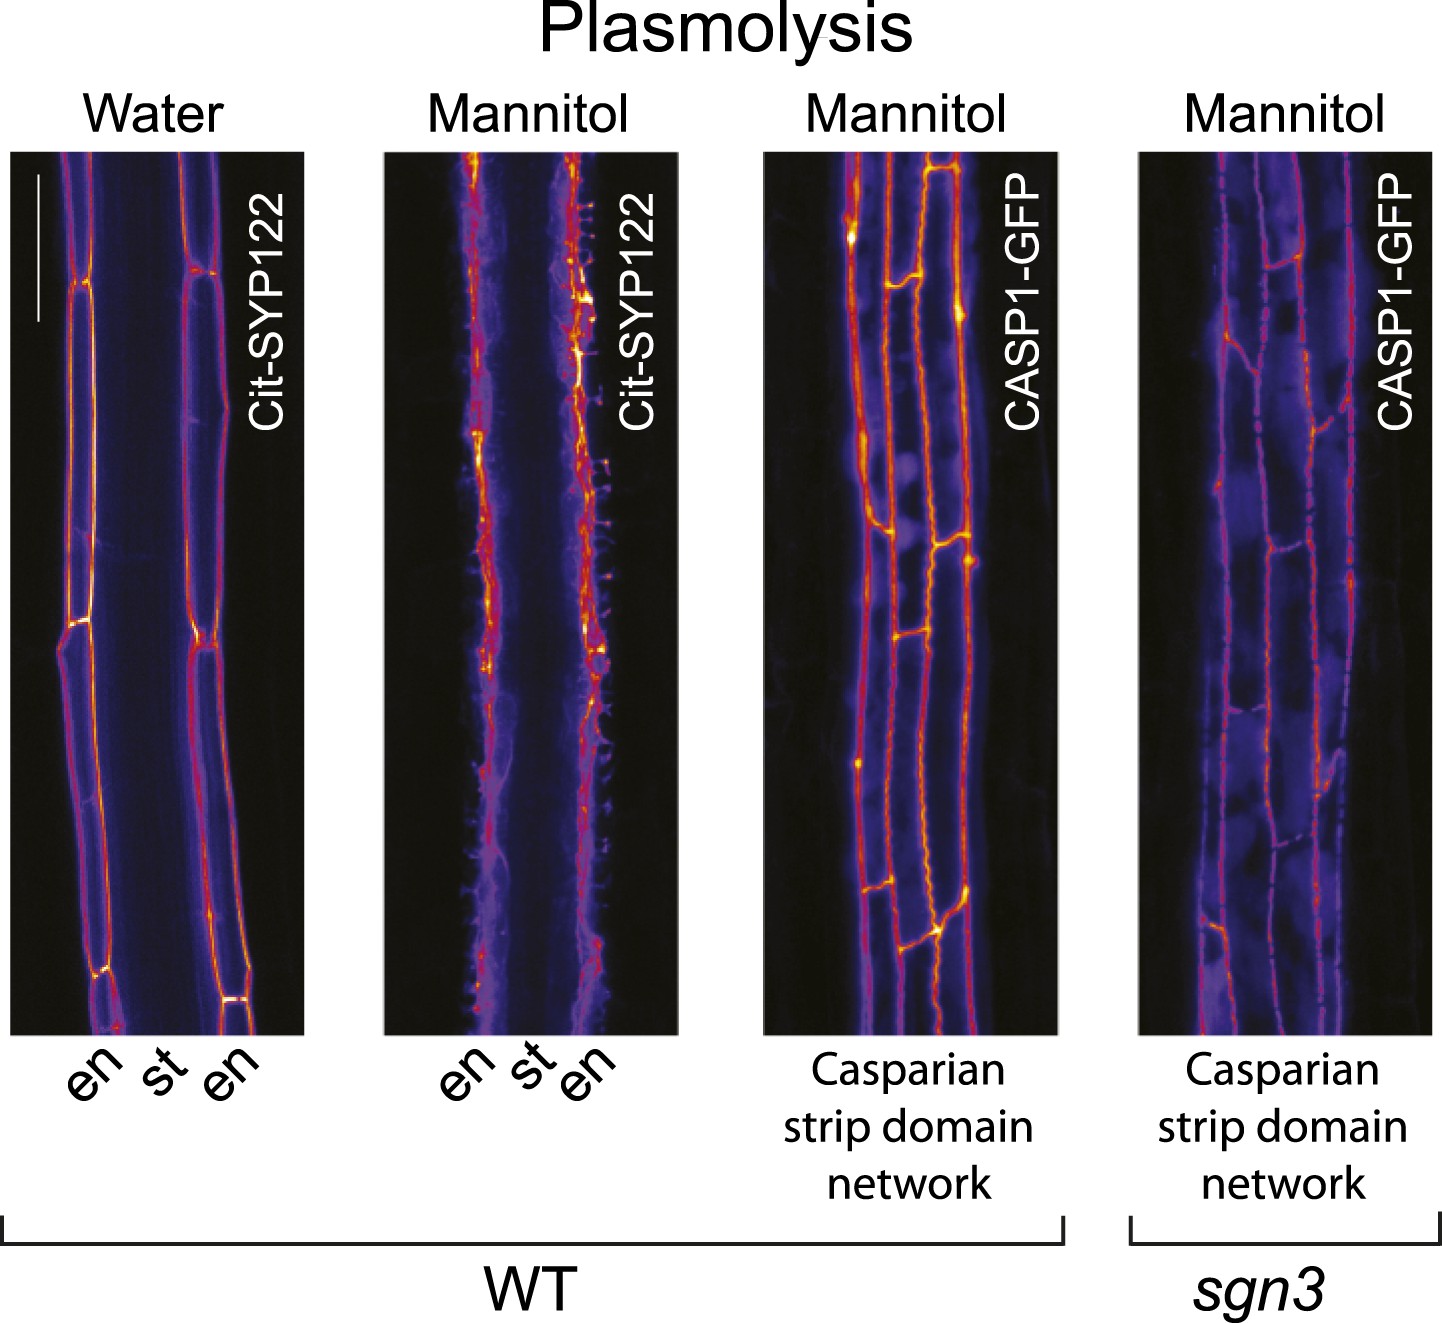
Plasma membrane-to-cell wall attachment remains intact in sgn3 upon plasmolysis.
The CSD highlighted by CASP1-GFP is still attached to the cell wall in sgn3-3 upon plasmolysis. Localization of the generic plasma membrane marker Cit-SYP122 expressed under CASP1 promoter in water and in 0.8 M mannitol (panel 1 and 2, respectively). CASP1-GFP network still attached to the cell wall upon plasmolysis both in WT (panel 3) and sgn3-3 (panel 4). Pictures were taken 15 endodermal cells after the onset of CASP1 expression. Scale bars: 20 μm.
Figure 2—figure supplement 2
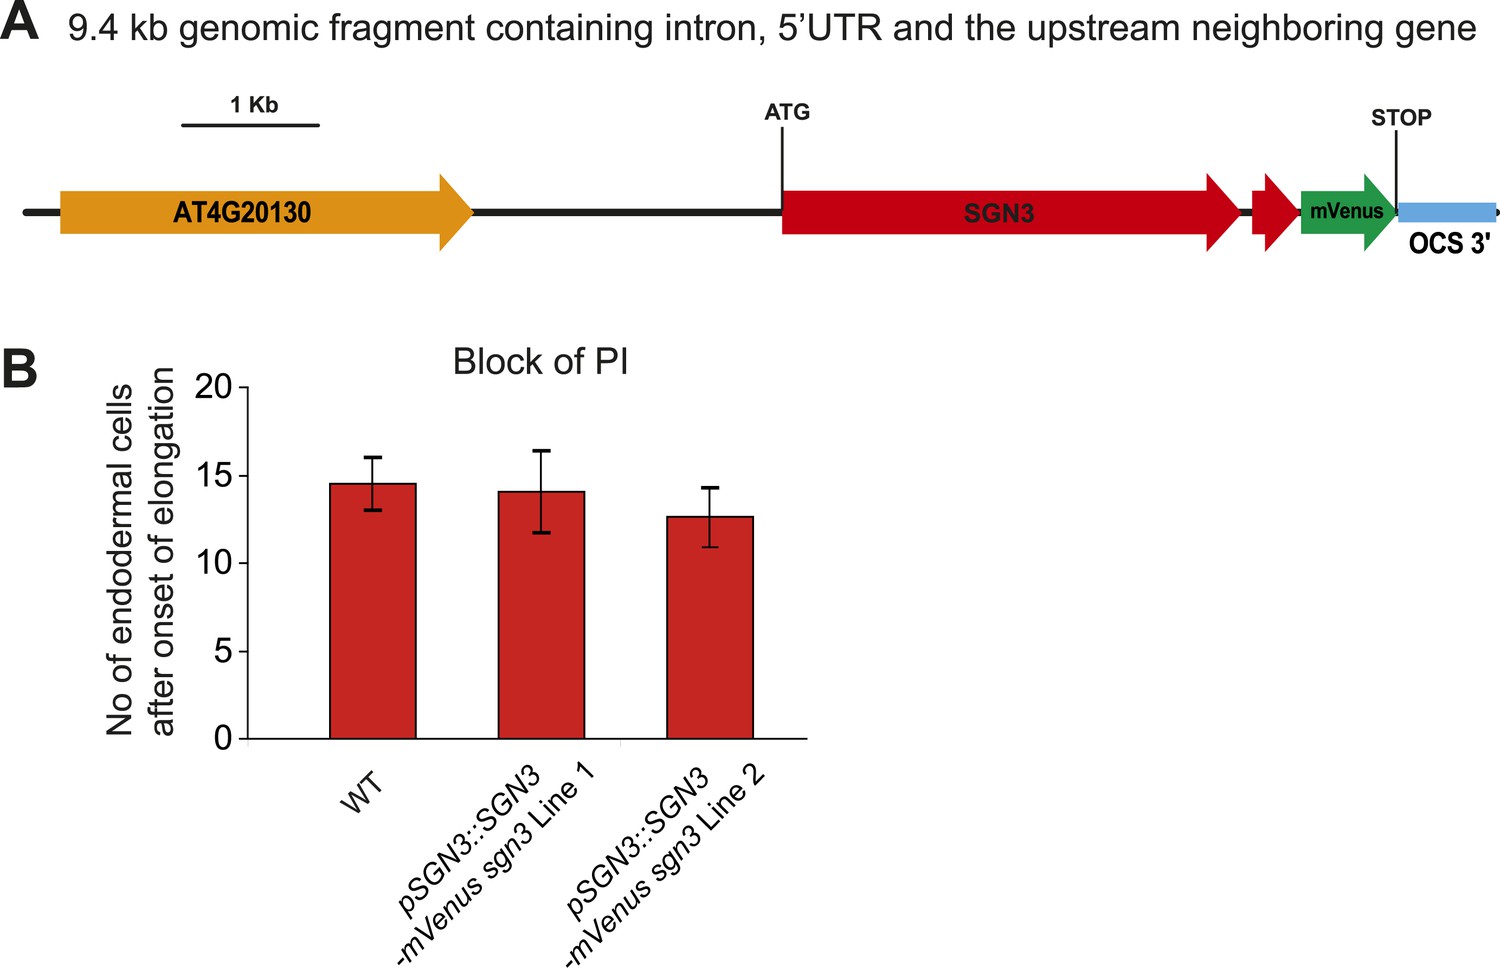
SGN3 genomic construct and sgn3 PI phenotype complementation.
(A) C-terminal mVenus fusion with a 9.4-Kb genomic fragment including intron, 5′UTR, and the upstream neighboring gene used to complement sgn3. (B) Complementation of the sgn3-3 PI phenotype in two independent T2 lines containing the pSGN3::SGN3-mVenus construct shown in A (n ≥ 10), no PI block was observed in sgn3-3.
Figure 2—figure supplement 3
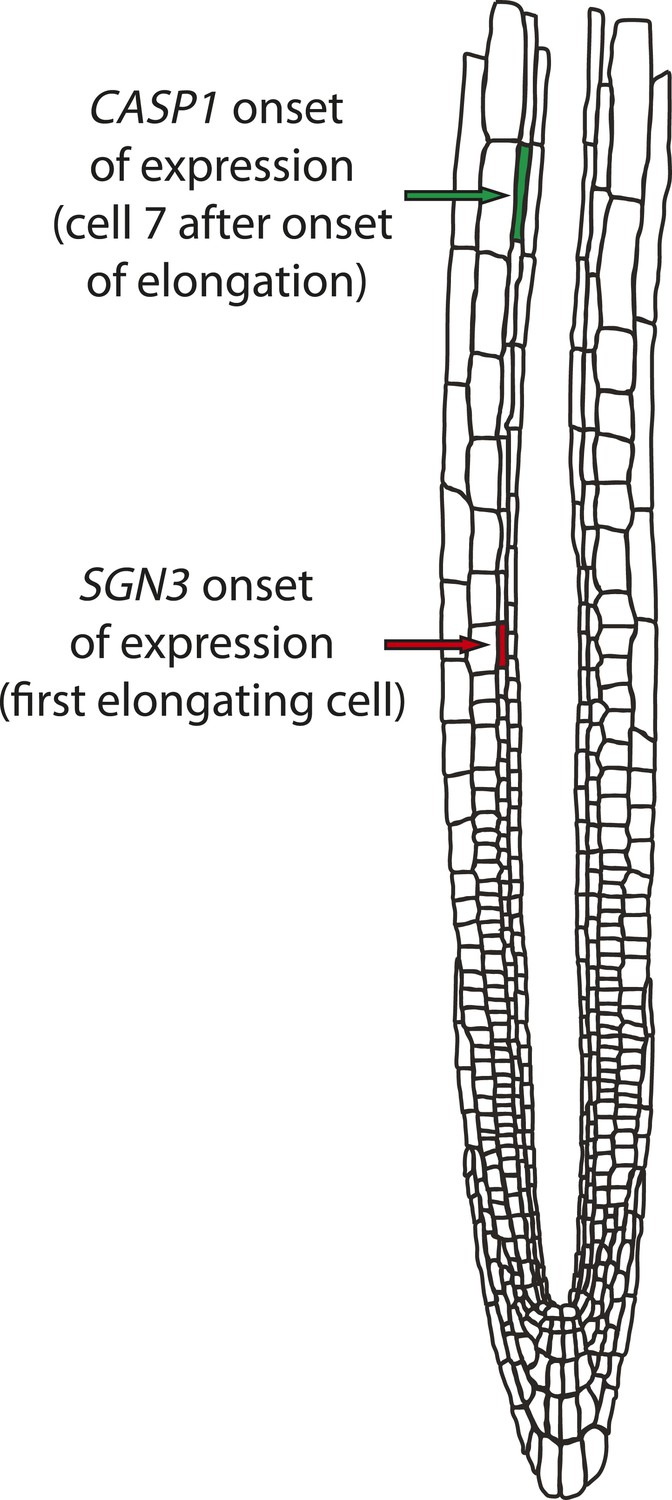
Schematic illustrating quantification of onset of expression along the root.
Counting in Figure 2C (‘cells after the onset of elongation’) was done as described in Alassimone et al. (2010). The onset of elongation was determined as the point where an endodermal cell in a median, longitudinal section reached a length more than twice its width. At this point, cells were counted in order to quantitate relative timing of expression between CASP1 and SGN3, as illustrated on the schematic.
Figure 3
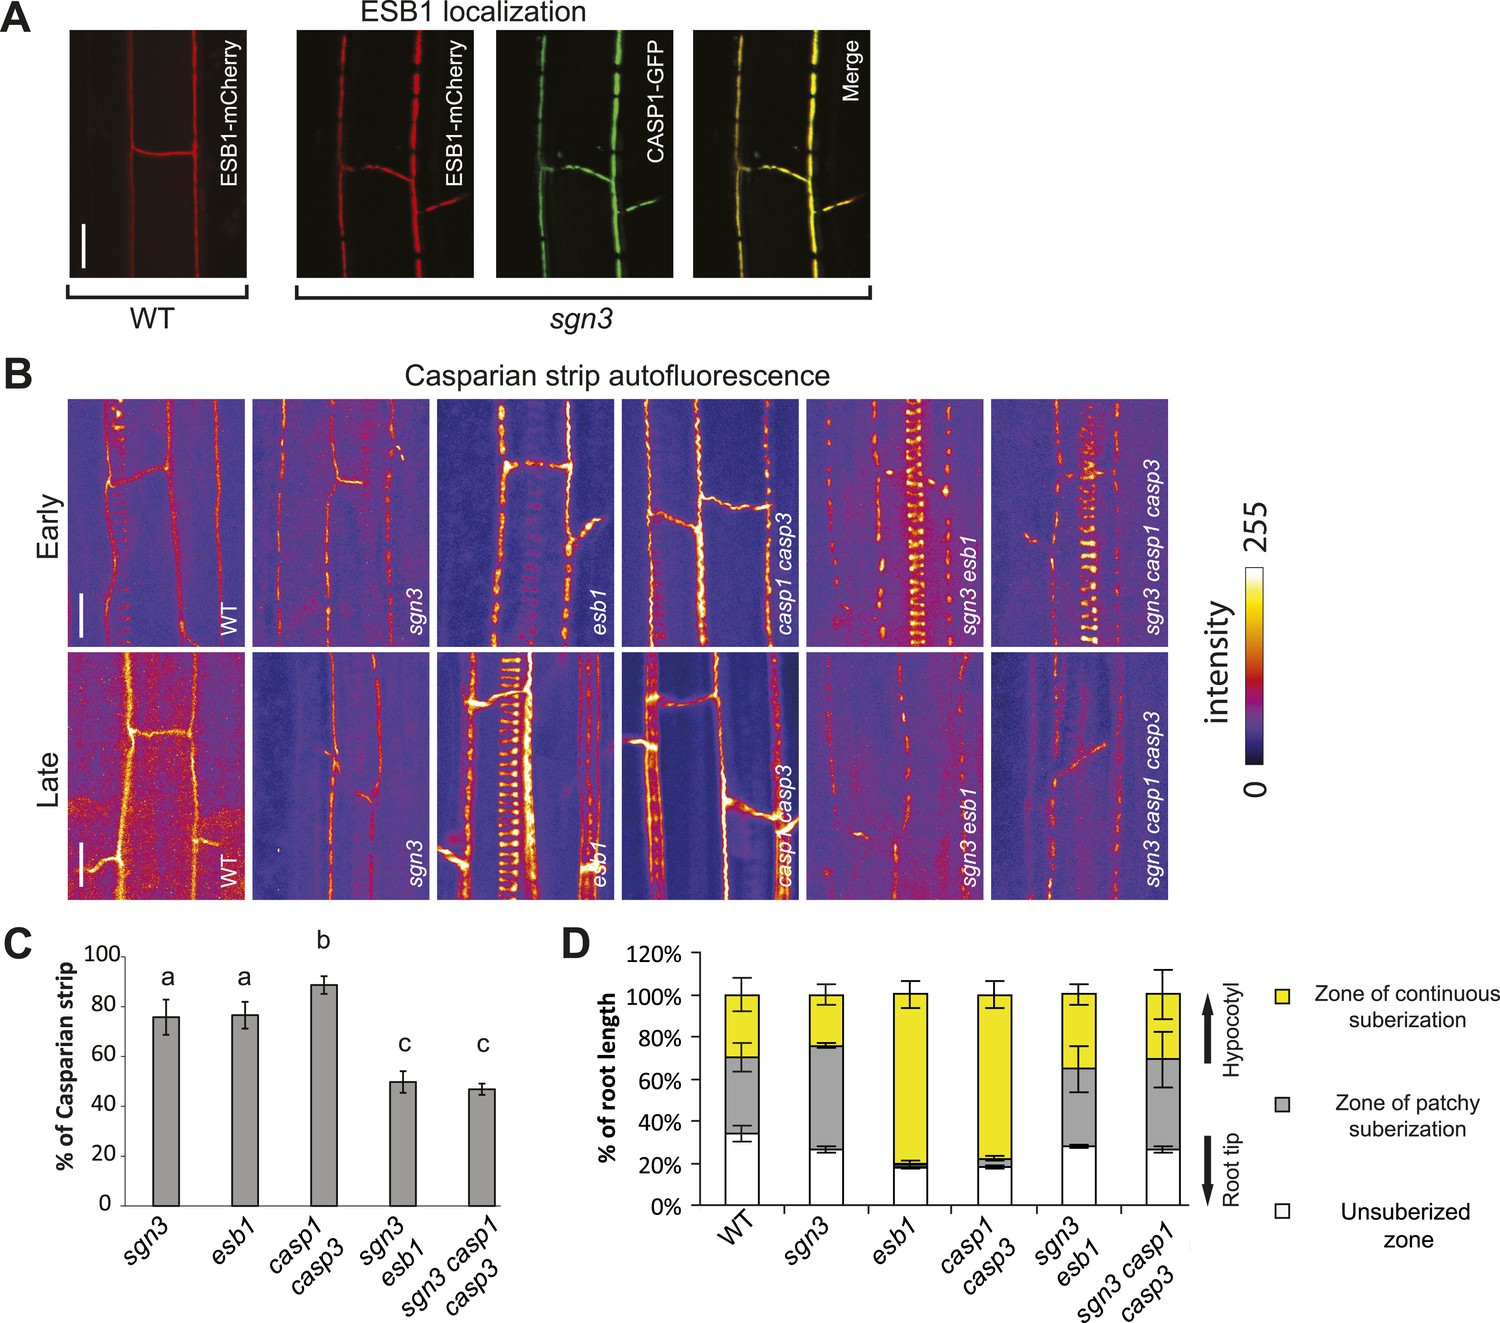
Relations between sgn3 and molecular players in Casparian strip formation.
(A) ESB1-mCherry localizes to the CASP1-GFP microdomains in sgn3. ESB1-mCherry and CASP1-GFP are expressed under their own promoters. Pictures are maximum projections of confocal z-stacks. (B) Surface view of Casparian strip, visualized by autofluorescence after clearing. Top and bottom panels correspond to the early and late stages of endodermal differentiation, 15 and 30 cells after onset of elongation, respectively. When sgn3 is crossed to casp1 casp3 or esb1, note the additive effect of these mutants concerning the CS patches (quantified in C). Note also the absence of enhance/ectopic deposition of lignin in sgn3 esb1 and sgn3 casp1 casp3. Pictures are maximum projections as in A. Strong spiral-like signals are from protoxylem cells. (C) Quantification of Casparian strip presence shows an additive effect in sgn3 esb1 and sgn3 casp1 casp3. Casparian strips were quantified as the percentage of cell wall showing autofluorescence along a line of Casparian strip signal of a given length. n = 10. (D) sgn3 is epistatic to esb1 and casp1 casp3 for ectopic suberin deposition. 5-day-old seedlings were stained with Fluorol Yellow. Quantification was done as in Figure 1E. Bars represent the percentage for each zone along the root (n = 5, one representative experiment). C, Error bars = s.d., different letters indicate significant differences between genotypes, determined by analysis of variance (ANOVA) and Tukey test as post hoc analyses (p < 0.05). Scale bars: A, B, 10 µm. sgn3 is sgn3-3, esb1 is esb1-1, casp1 is casp1-1 and casp3 is casp3-1.
Figure 4 with 1 supplement
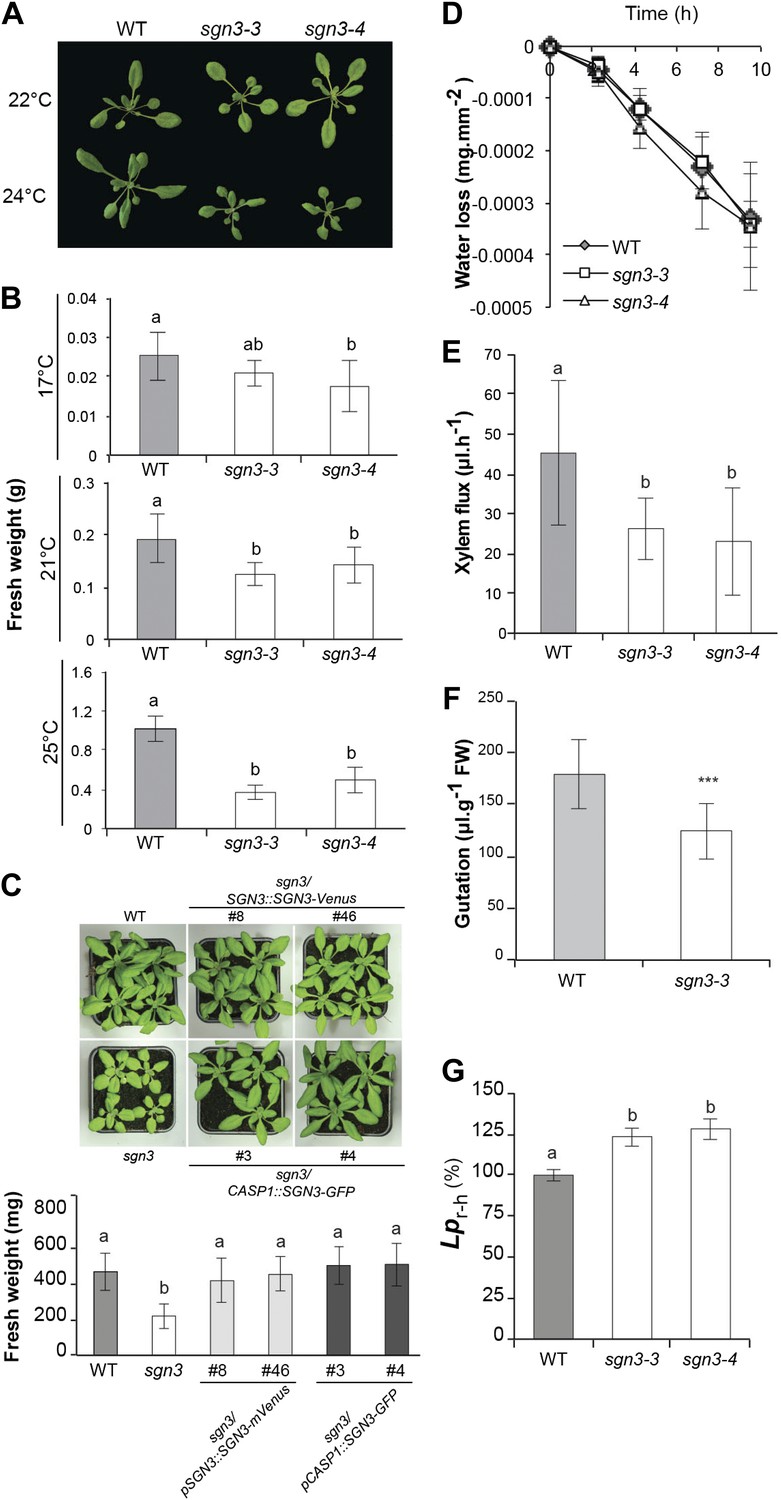
sgn3 is sensitive to environmental conditions and displays an altered water transport and root pressure.
(A) Phenotype of 3-week-old WT, sgn3-3, and sgn3-4 plants grown at 22 or 24°C in long days. Representative pictures are presented. (B) Analysis of shoots fresh weight of WT, sgn3-3, and sgn3-4 plants (n = 15) grown 3 weeks at different temperatures (17, 21, or 25°C). (C) Phenotype of 4-week-old WT, sgn3-3, sgn3-3/pSGN3::SGN3-mVenus (lines 8 and 46), and sgn3-3/pCASP1::SGN3-GFP (lines 3 and 4) grown at 24°C in long days. Representative pictures are presented. Fresh weight average from n > 8 plants. (D) Transpiration of WT, sgn3-3, and sgn3-4 plants determined as water loss from 3-week-old plants. Error bars = s.d. (n = 10). (E) Root pressure analysis determined as the volume of xylem sap released in 30 min from decapitated WT, sgn3-3, and sgn3-4 plants grown in short day condition (n = 7). (F) Guttation was collected from WT and sgn3-3 plants grown for 6 weeks in short day conditions (n = 15). (G) Mean hydrostatic hydraulic conductivity of roots (Lpr-h) from WT, sgn3-3, and sgn3-4 plants. Lpr-h was measured during the daytime. Values correspond to means ± SD (n > 14). B, C, E, F, G. Error bars = s.d. For multiple comparison, different letters indicate significant differences between genotypes, determined by analysis of variance (ANOVA) and Tukey test as post hoc analyses; (B, p < 0.01) (E, G, p < 0.05). For single comparison in F, stars (***) indicate significant difference determined by Student test (p < 0.001).
Figure 4—figure supplement 1
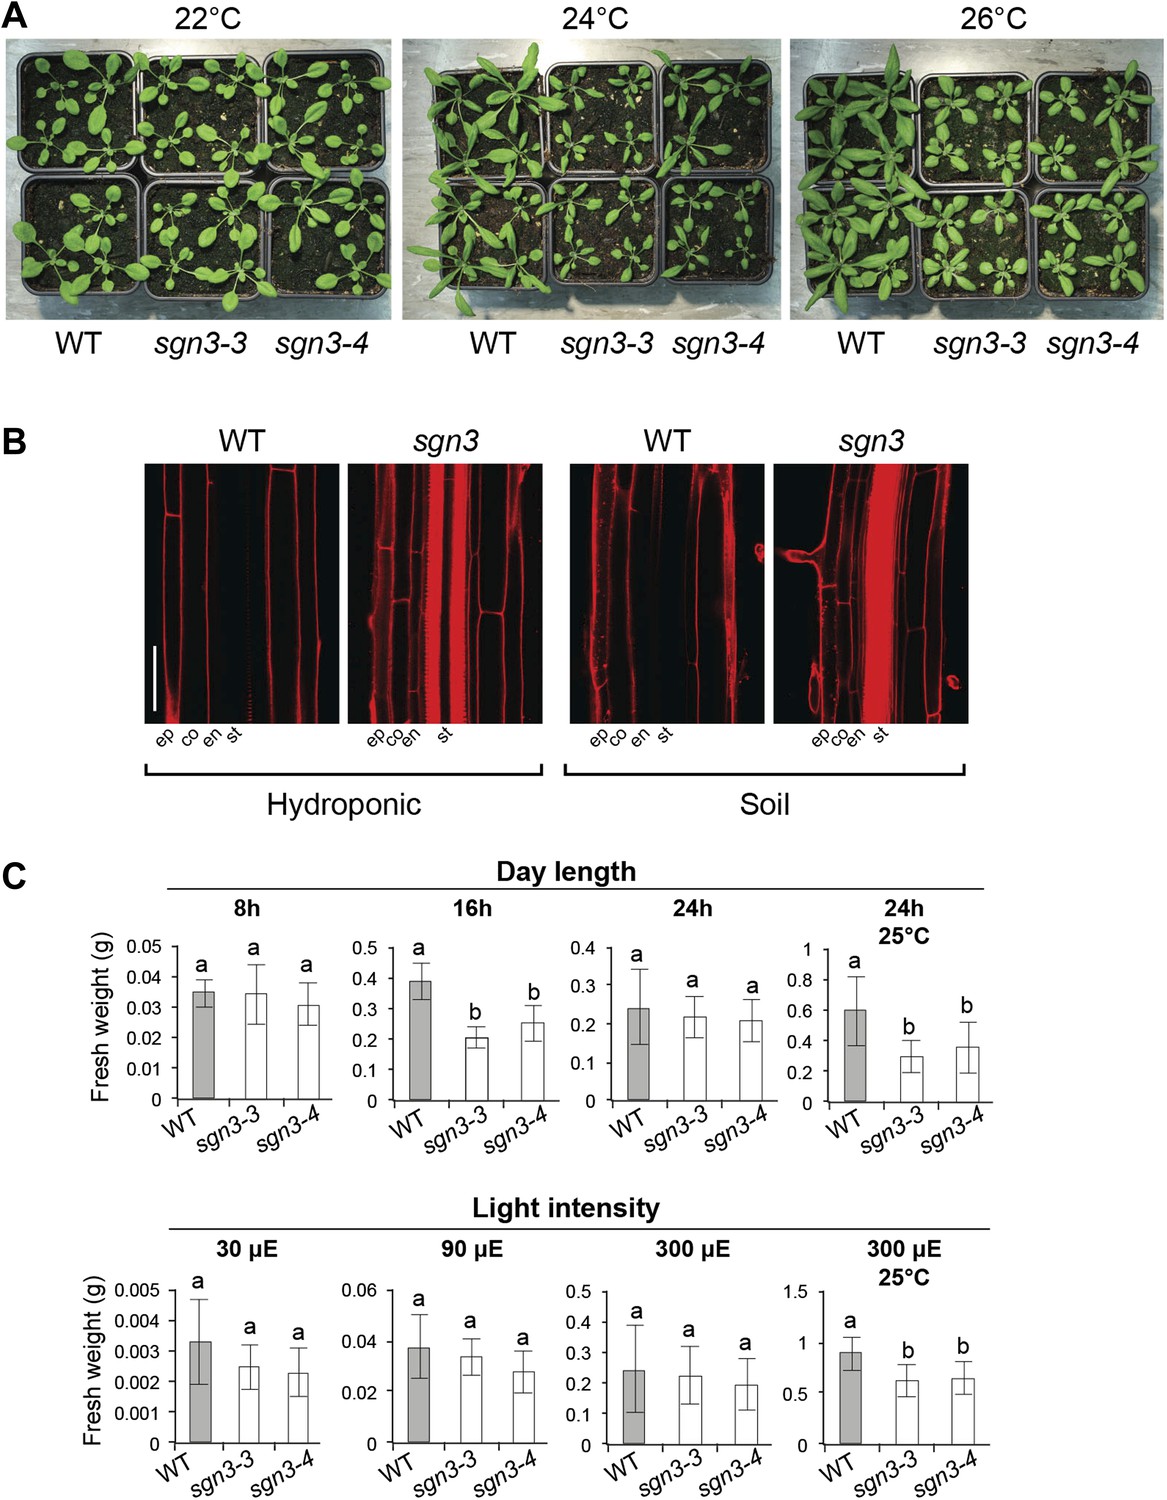
Impact of environmental conditions on growth of sgn3 mutant.
Growth conditions considered as ‘standard condition’ are: temperature 21°C, day length 16 hr, and light intensity of 150 μE. Modification of one of those parameters is indicated, the other parameters remaining unchanged. (A) Phenotype of 3-week-old WT, sgn3-3, and sgn3-4 plants grown at 22, 24, or 26°C. (B) Lack of the apoplastic endodermal diffusion barrier in sgn3-3 visualized with PI is still present when plants were grown in hydroponics or in soil. (C) Analysis of shoot fresh weight of WT, sgn3-3, and sgn3-4 plants (n = 15) grown 3 weeks at different day length (8 hr, 16 hr or 24 hr), light intensity (30 μE, 90 μE or 300 μE) or in combination with higher temperature (25°C). Error bars = s.d.; different letters indicate significant differences between genotypes, determined by analysis of variance (ANOVA) and Tukey test as post hoc analyses (p < 0.01). Scale bars: B, 50 μm. ep, epidermis; co, cortex; en, endodermis; st, stele.
Figure 5 with 1 supplement
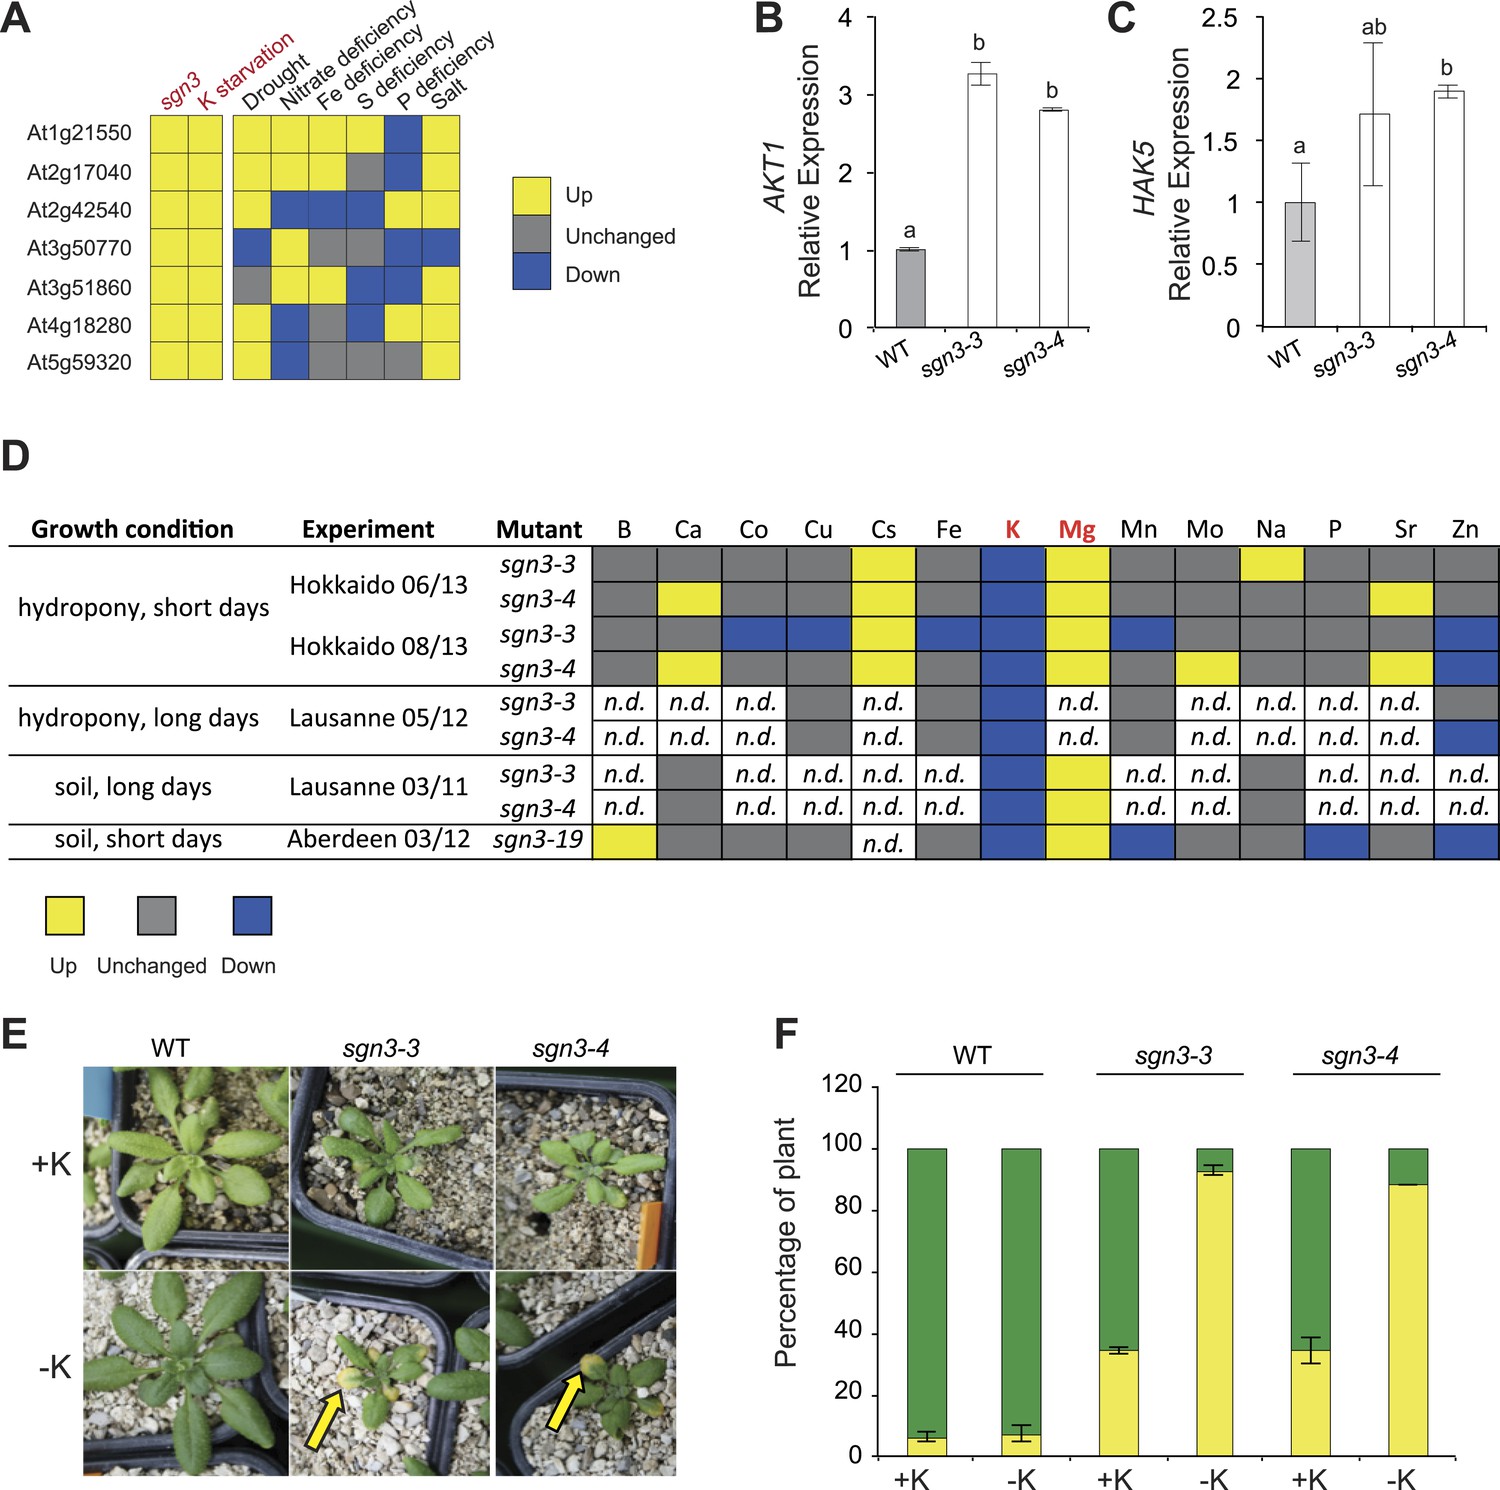
Potassium homeostasis is affected in sgn3.
(A) Expression of genes upregulated in 4 week-old sgn3 leaves. The seven genes presented here are the ones whose expression level was significantly increased in sgn3 (p < 0.15). Those genes were investigated in Genevestigator for responses in leaves to nutritional stresses such as potassium starvation, drought, nitrate deficiency, Fe deficiency, S deficiency, P deficiency, and salt stress. Color-code indicates the effect of growth condition to their expression level (yellow up, gray unchanged, blue down). For numerical values see Figure 5—source data 1. (B and C) Quantitative RT-PCR analysis of AKT1 (B) and HAK5 (C) transcript levels in WT, sgn3-3, and sgn3-4 roots (n = 3). Error bars = s.d, different letters indicate significant differences between genotypes, determined by analysis of variance (ANOVA) and Tukey test as post hoc analyses (p < 0.05). (D) Overview of ionomic analysis performed in sgn3 leaves (sgn3-3, sgn3-4, and sgn3-19 alleles) in three independent laboratories (Hokkaido, Lausanne, Aberdeen), using 2 growth systems (hydroponics or soil) and 2 day-length conditions (short or long days). Elements were determined by ICP-MS (Hokkaido, Lausanne 05/12 and Aberdeen) or ion chromatography (Lausanne 03/11). Color-code indicates significant changes of accumulation in sgn3 mutants compared to WT (p < 0.05; yellow up, gray unchanged, blue down). For the numerical values, see Figure 5—source data 2. (E and F) Phenotype of 3-week-old WT, sgn3-3, and sgn3-4 plants grown in potassium (K) deficiency. Plants were watered from germination with a nutritive solution with or without 1.5 mM KNO3 (+K or −K). Representative picture are presented. Arrow indicates a chlorotic leave. (F) Occurrence of K deficiency phenotype determined as the percentage of plants displaying at least one yellow leaf (yellow) vs percentage of plants displaying only green leaves (green). Error bars = s.d.; data correspond to the mean of two independent experiments with a total of n ≥ 50 plants.
-
Figure 5—source data 1
Transcriptional differences between wild type and sgn3 shoots.
Genes affected in sgn3-3 transcriptomic analysis in leaves (p < 0.15) and responses of those genes to abiotic stress. Fold change and p-value marked by asterisk were obtained in Genevestigator for K starvation, drought, nitrate starvation, Fe deficiency, S deficiency, P deficiency, and salt (Hruz et al., 2008).
- https://doi.org/10.7554/eLife.03115.015
-
Figure 5—source data 2
Overview of ionomic experiments.
Ionomic analysis performed on sgn3 leaves (sgn3-3, sgn3-4, and sgn3-19 T-DNA insertion lines) in three different labs (Hokkaido, Lausanne and Aberdeen), two growth systems (hydroponic and soil) and two growth conditions (short days and long days). Values are presented as mean ± SD. t-tests were performed to determine the significant differences to WT (corresponding p-values are indicated).
- https://doi.org/10.7554/eLife.03115.016
Figure 5—figure supplement 1
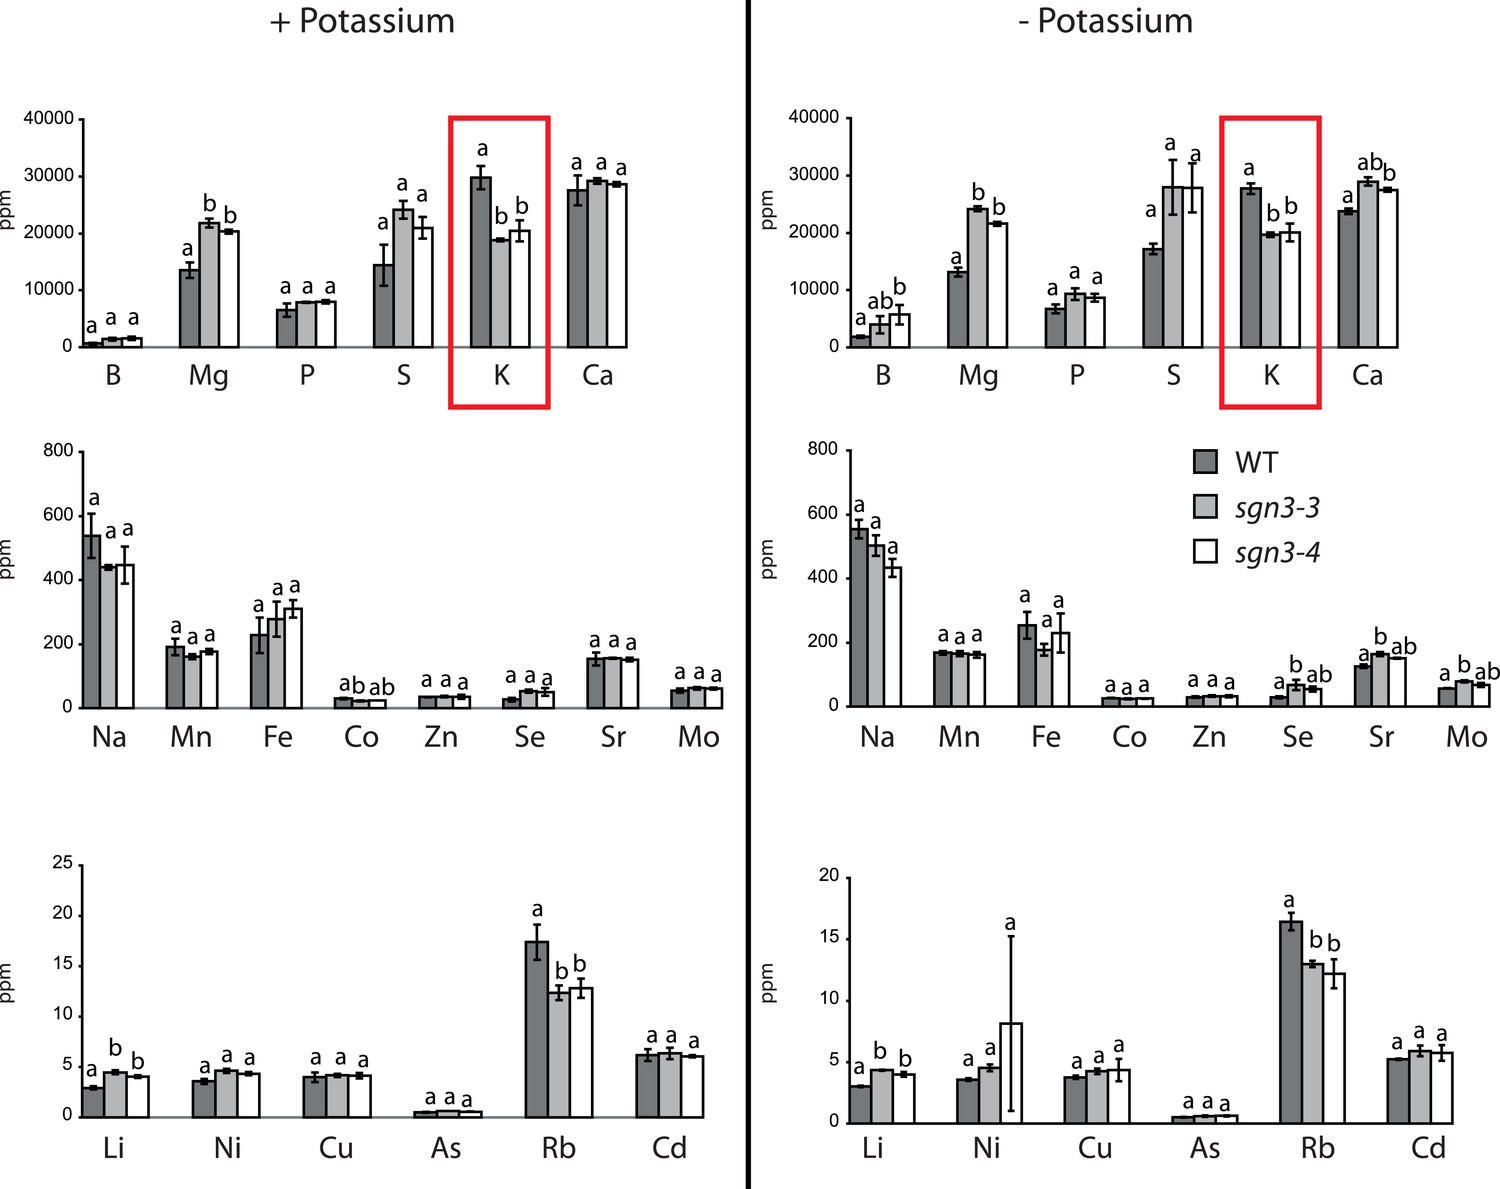
Ionomic comparision of WT and sgn3 grown under low potassium.
Ionomic analysis performed on WT, sgn3-3, and sgn3-4 plants grown in a poor gravel-like substrate and watered from germination with a nutritive solution with potassium (+K) or without (−K). The different elements were analyzed by ICP-MS (Aberdeen) with a NexION 300D. Each bar represents the mean ± SD of three biological replicates with n ≥ 17 plants. Different letters indicate significant differences between genotype for a given element, determined by analysis of variance (ANOVA) and Tukey test as post hoc analysis (p < 0.01).
Tables
Table 1
Details of knockout mutants
| Gene number | Accession | Mutant number | Mutant name | Genotyping primer sequence | References |
|---|---|---|---|---|---|
| AT4G20140 | Col-0 | SALK_043282 | sgn3-3 | LP: ATTCTACGAGCCTTCCCATTC RP: CGCAGTGAACACAGTGAGATC | Present work |
| AT4G20140 | Col-0 | SALK_064029 | sgn3-4 or gso1-1 | LP: CTCGGCTCCCTCGTTAATATC RP: GTTACCTAAACTGGCGGGAAG | Tsuwamoto et al. (2008) The Plant Journal |
| AT4G20140 | Col-0 | SALK_103965 | sgn3-19 | LP: TCCATTATGTGGTTCGAGCTC RP: CTTGTAAACCTTCCCAGAGCC | Present work |
| AT2G28670 | Col-0 | n.a. | esb1-1 | n.a. | Baxter I et al. (2009) PLOS Genet, Lahner B et al. (2003) Nat Biotechnol |
| AT2G36100 | Col-0 | SAIL_265_H05 | casp1-1 | LP: GCGTTTCAGTACGTCCCTTC RP: CACGTGAGGGAAGTGAGTCTC | Roppolo et al. (2011) Nature |
| AT2G27370 | Col-0 | SALK_011092 | casp3-1 | LP: GACTCTTCCTTTCTTCACTC RP: GACCAACACAACCGTACGAAC | Roppolo et al. (2011) Nature |
Download links
A two-part list of links to download the article, or parts of the article, in various formats.
Downloads (link to download the article as PDF)
Open citations (links to open the citations from this article in various online reference manager services)
Cite this article (links to download the citations from this article in formats compatible with various reference manager tools)
A receptor-like kinase mutant with absent endodermal diffusion barrier displays selective nutrient homeostasis defects
eLife 3:e03115.
https://doi.org/10.7554/eLife.03115


