Dynamic recruitment of the curvature-sensitive protein ArhGAP44 to nanoscale membrane deformations limits exploratory filopodia initiation in neurons
- Stanford University, United States
Figures
Figure 1 with 6 supplements
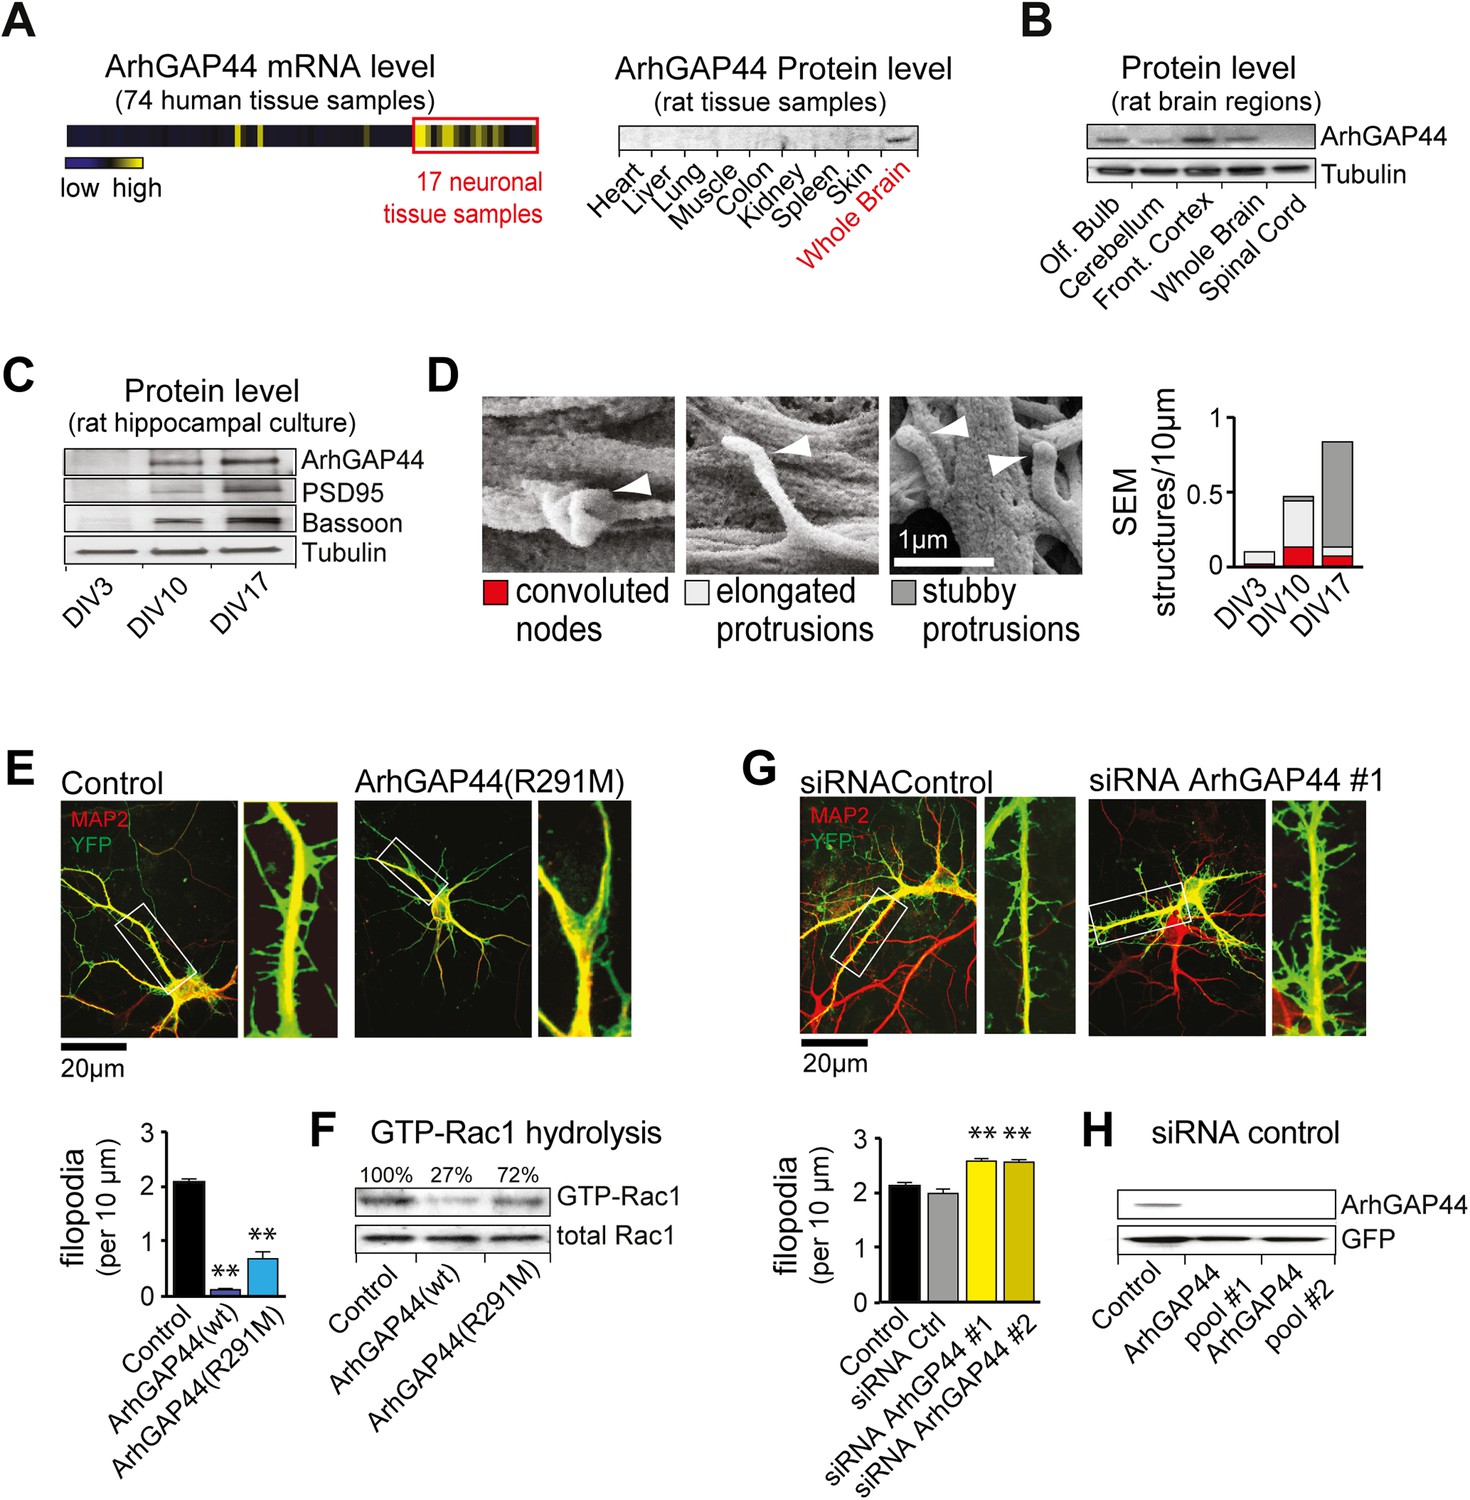
The brain-enriched ArhGAP44 regulates exploratory dendritic filopodia formation.
(A) Microarray data for ArhGAP44 across 74 tissue samples show predominant expression in neuronal tissues (red box). Immunoblot to the right shows ArhGAP44 expressed in the brain while being below detection level in other tissues. Note that individual tissue samples are likely composed of a variety of different cell types. (B) Total extracts of individual brain regions probed with an antibody directed against ArhGAP44 (top) and tubulin (bottom). (C) Expression of ArhGAP44 in cultured hippocampal neurons. Total extracts of individual neuronal samples were isolated at DIV3, DIV10, and DIV17 and probed with an antibody directed against ArhGAP44 (top), the synaptic proteins PSD95 and Bassoon (middle lanes), and tubulin (bottom). (D) Scanning electron micrographs of cultured neurons. Dendritic surface structures are classified based on morphology as convoluted nodes (red), elongated protrusion without contact (light gray), or stubby protrusions that contact adjacent neurites (dark gray). Analysis is shown for DIV3 (n = 10 neurons, 2 independent experiments), DIV10 (n = 10 neurons, 2 independent experiments), and DIV17 (n = 9 neurons, 2 independent experiments). (E) Overexpression of ArhGAP44 decreases filopodia density. Representative examples of neurons (green) stained with anti-MAP2 antibody (red) are shown. Analysis of filopodia density upon overexpression of control (black; n = 67 neurons, 3 independent experiments), ArhGAP44(wt) (dark blue; n = 73 neurons, 3 independent experiments), and mutant ArhGAP44(R291M) (light blue; n = 53 neurons, 3 independent experiments) is shown below. (F) Rac-GAP activity of individual ArhGAP44 mutants. Note that ArhGAP44(R291M) shows higher GTP-Rac1 hydrolysis than control. (G) Knockdown of ArhGAP44 increases filopodia density. Analysis of filopodia density upon expression of control (black; n = 67 neurons, 3 independent experiments), control siRNA (gray; n = 67 neurons, 3 independent experiments), and knockdown of ArhGAP44 (siRNA #1, light yellow; n = 83 neurons; siRNA #2, dark yellow; n = 85 neurons; both 3 independent experiments) is shown below. (H) Control western blot analysis testing the effectiveness of individual siRNA pools. Scale bars (D), 1 µm; (E and F), 20 µm.
Figure 1—figure supplement 1
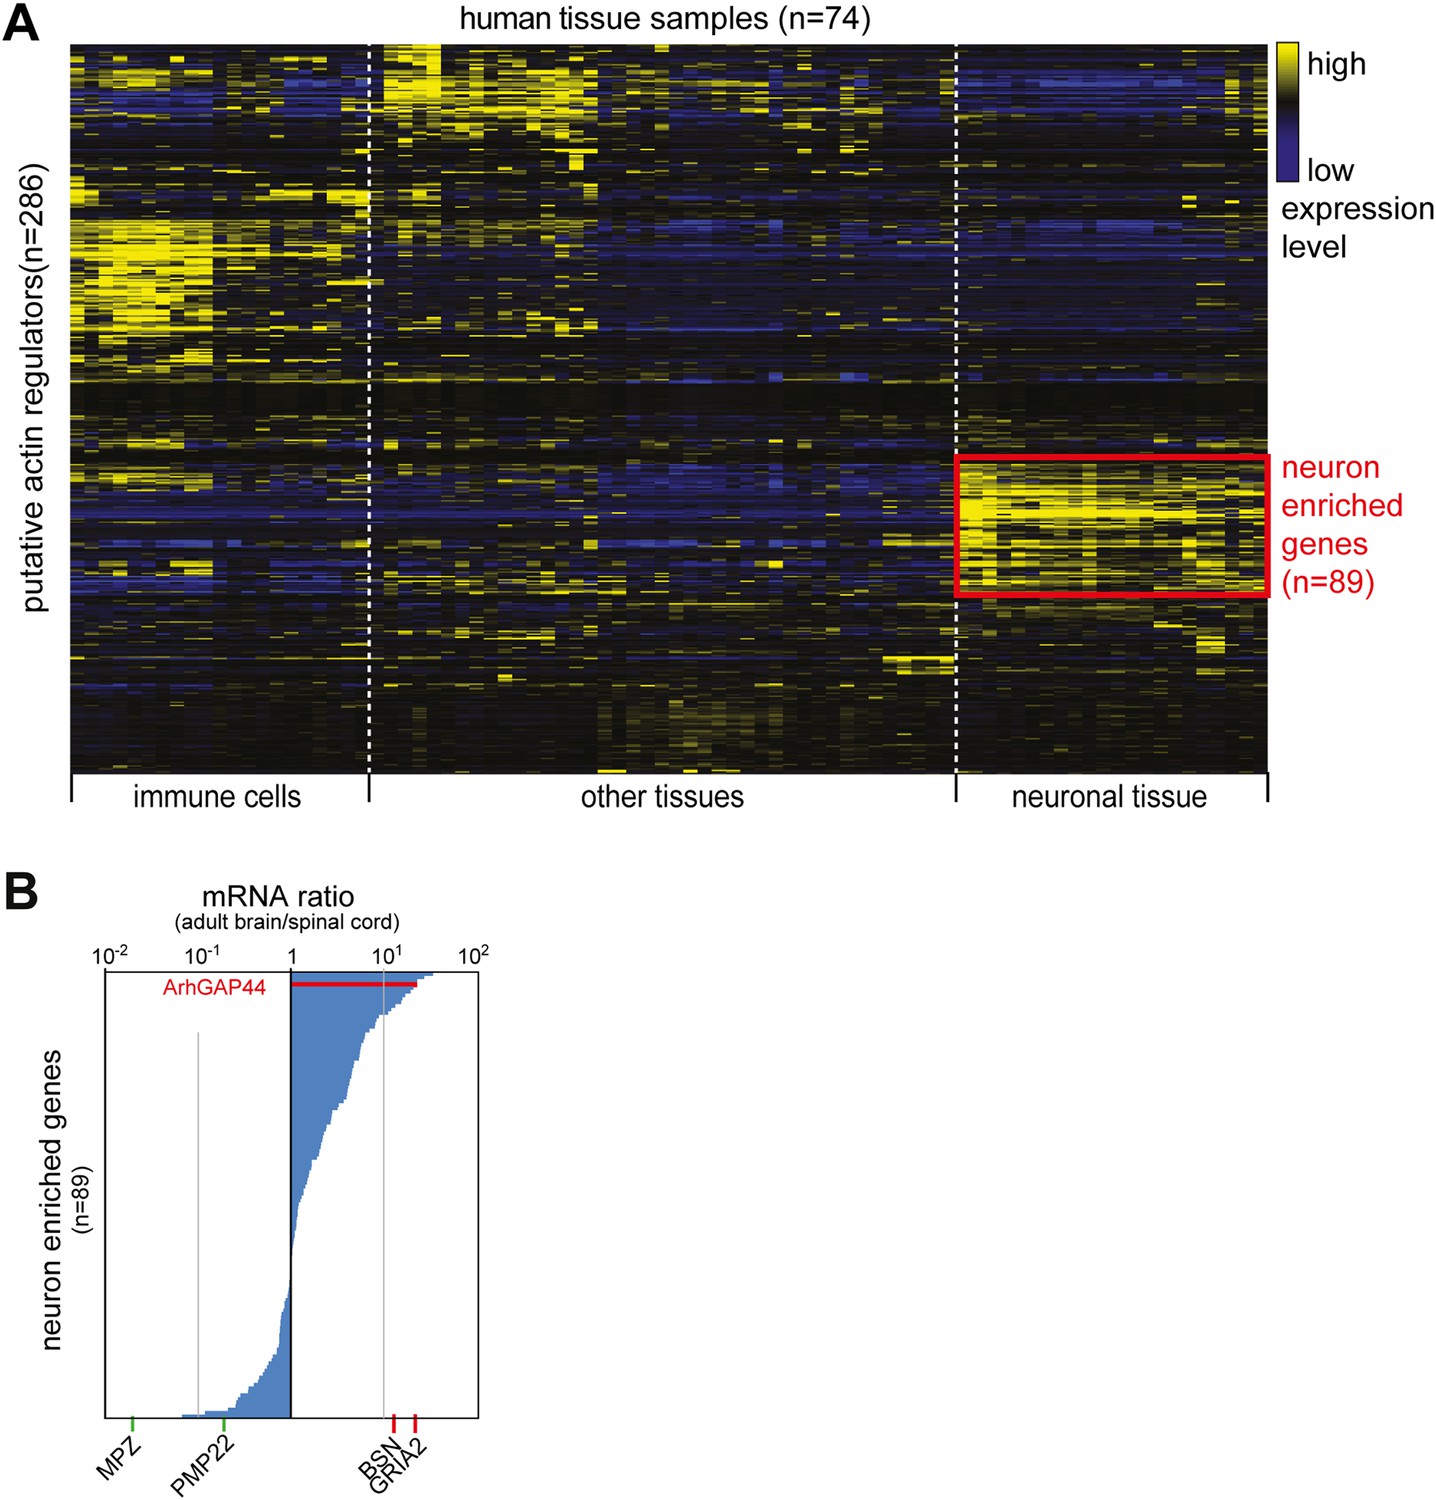
Cluster analysis of putative actin-regulating genes.
(A) Identification of neuron-enriched putative regulators of actin dynamics. 286 genes identified in a NCBI data-search (see ‘Materials and methods’) were clustered according to expression pattern across 74 different tissue samples. A group of 89 genes enriched in neuronal tissue is highlighted in red. (B) ArhGAP44 is enriched in the whole brain but not the spinal cord. The 89 genes identified to be enriched in neuronal tissues were sorted according to their relative whole brain vs. spinal cord expression ratio. Reference genes (Table 1) expressed selectively in Schwann cells (green) or the brain (red) is shown below the ranked list.
Figure 1—figure supplement 2
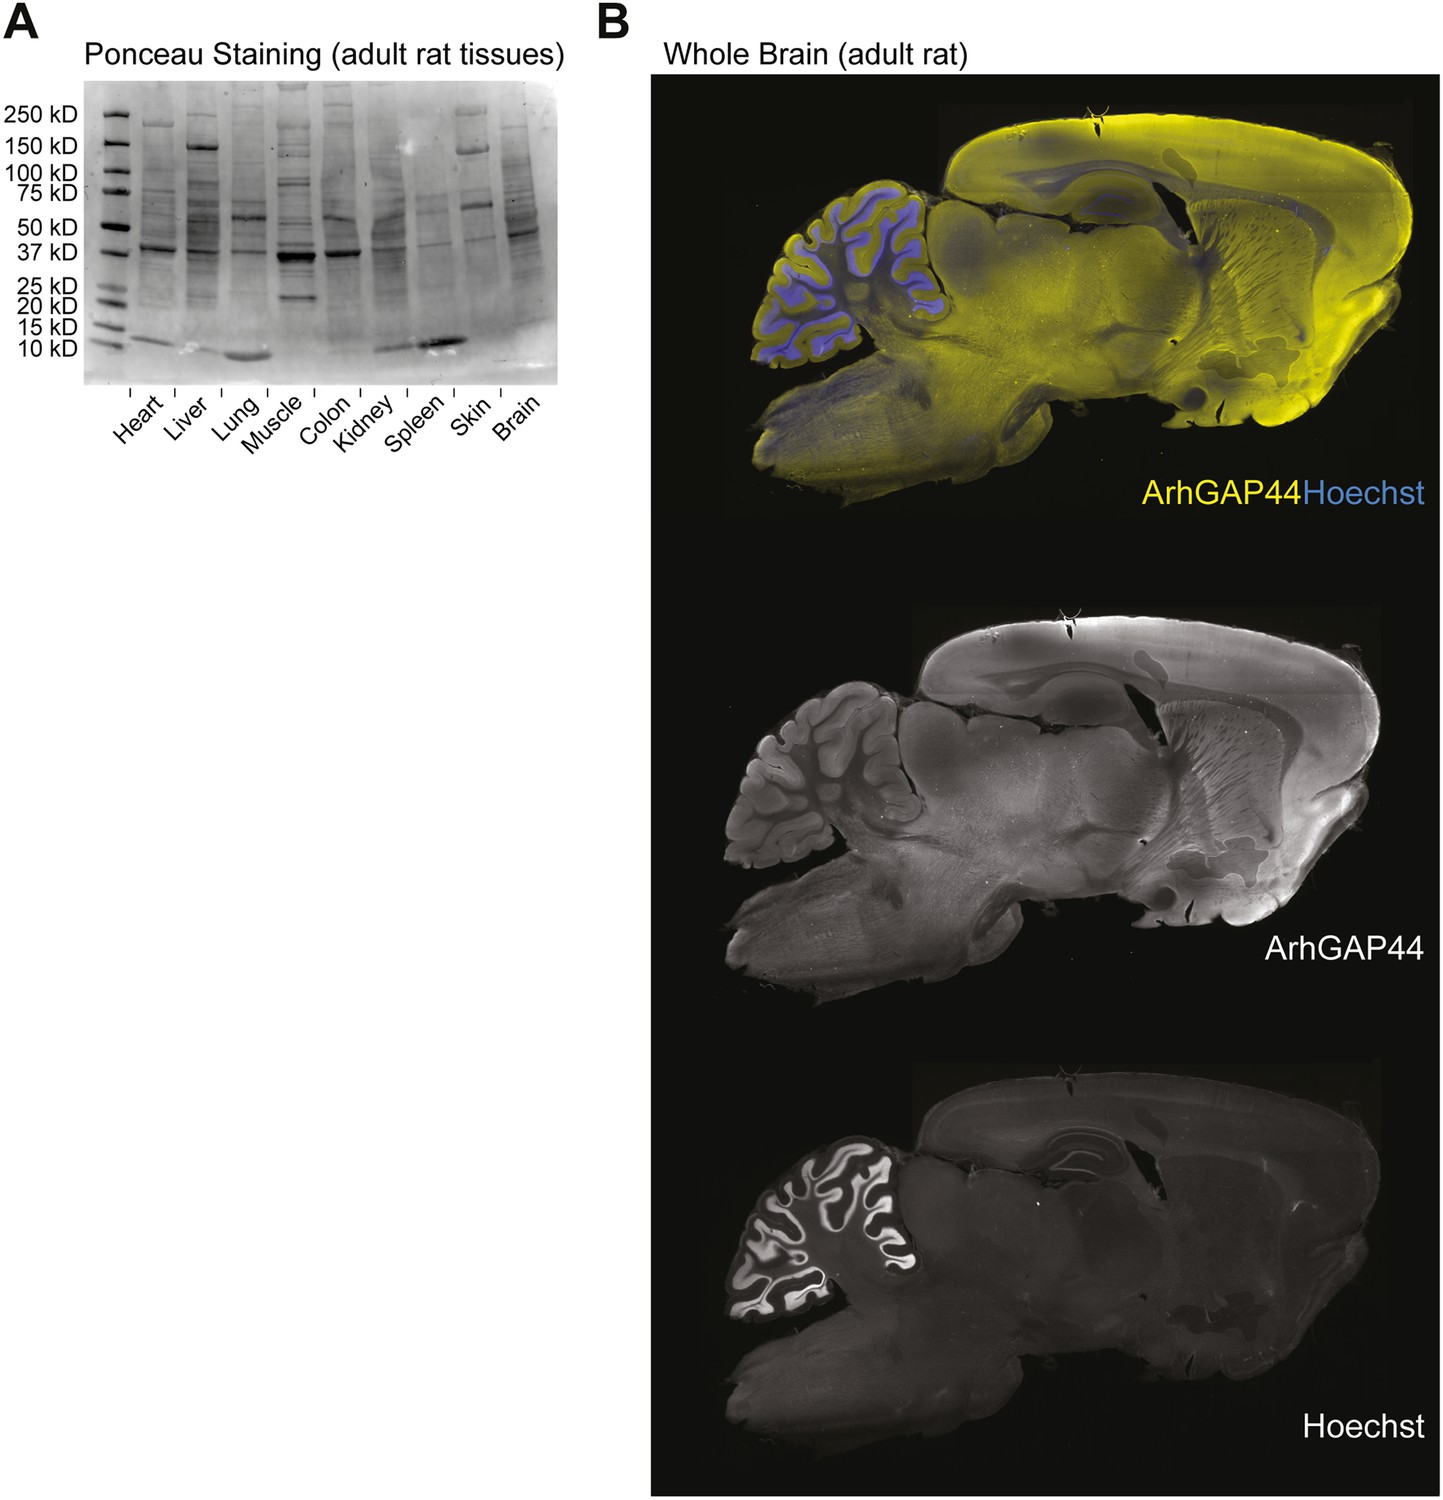
Ponceau loading control of various tissues and ArhGAP44 protein expression in the brain.
(A) Loading control of tissues used in Figure 1A. Same amounts of total protein were loaded into the different lanes. Note the non-uniform protein composition. (B) ArhGAP44 is enriched in the cerebral cortex and olfactory bulb. Adult rat brain was sectioned and stained with DAPI (blue) and an antibody directed against ArhGAP44 (yellow).
Figure 1—figure supplement 3
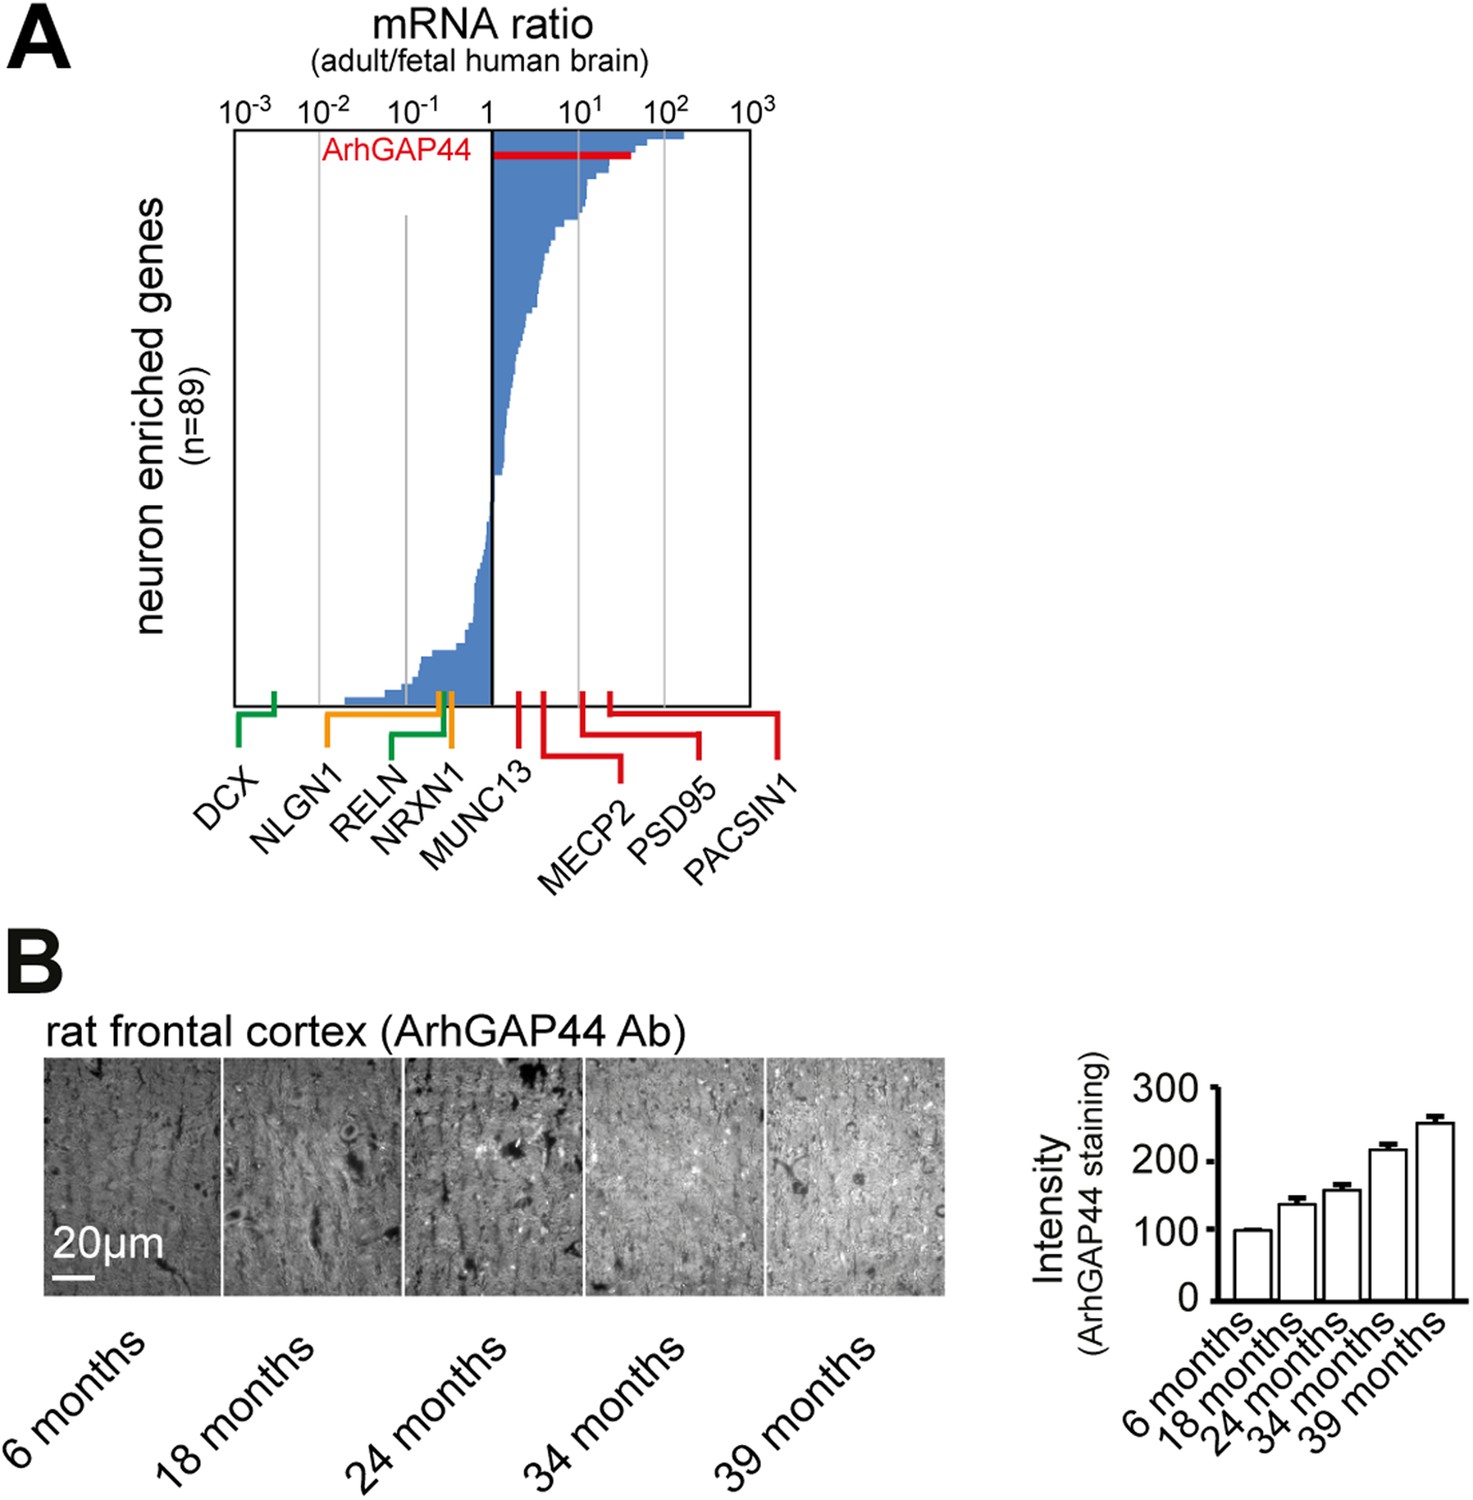
ArhGAP44 expression increases over time.
(A) ArhGAP44 is expressed in the adult but not the fetal human brain. The 89 genes previously identified to be enriched in neuronal tissues were sorted for strong expression in the adult brain vs. fetal brain. Reference genes (Table 2) expressed during neuronal migration (green), trans-synaptic contact formation (yellow), and synapse maturation (red) are shown along the x-axis. Note that ArhGAP44 (red) is expressed 20-fold higher in the adult compared to the fetal brain. (B) Expression levels of ArhGAP44 in the prefrontal cortex increase with age. Individual samples from rat prefrontal cortex were fixed at the age of 6, 18, 24, 34, and 39 months and stained against ArhGAP44. Scale bar (B), 20 µm.
Figure 1—figure supplement 4
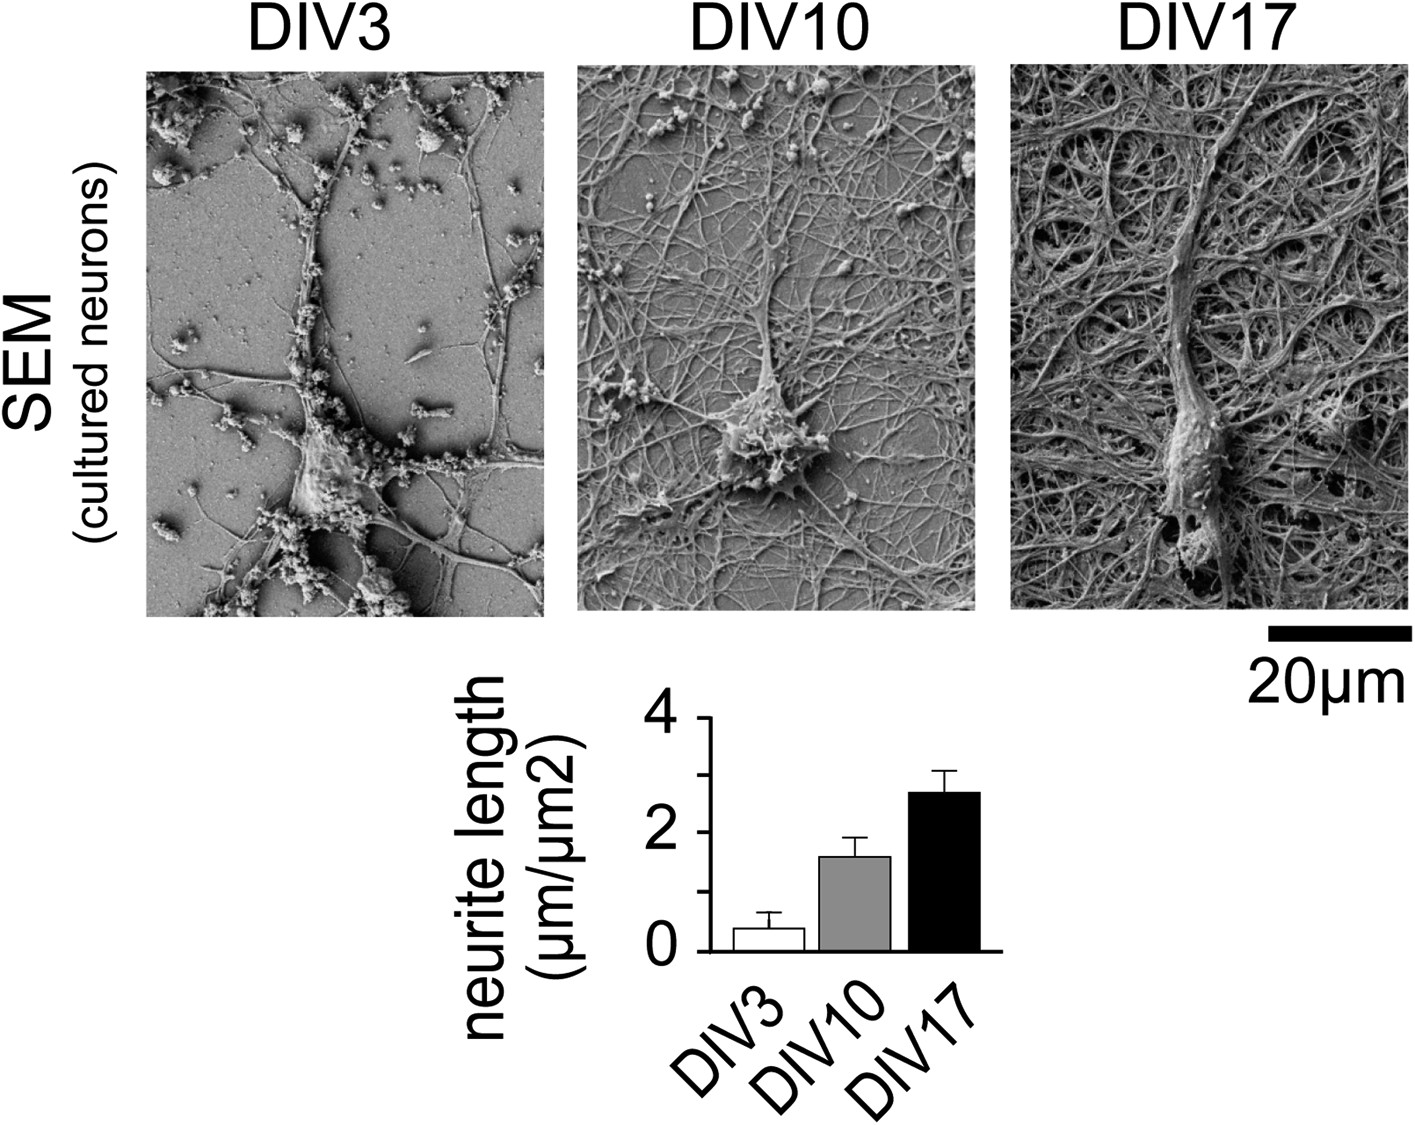
Neuronal complexity increases over time.
Scanning Electron Micrographs of neurons fixed at DIV3 (n = 10 images, 2 independent experiments), DIV10 (n = 10 images, 2 independent experiments), and DIV17 (n = 9 images, 2 independent experiments) as well as quantification of total dendrite length are shown. Scale bar, 20 µm.
Figure 1—figure supplement 5
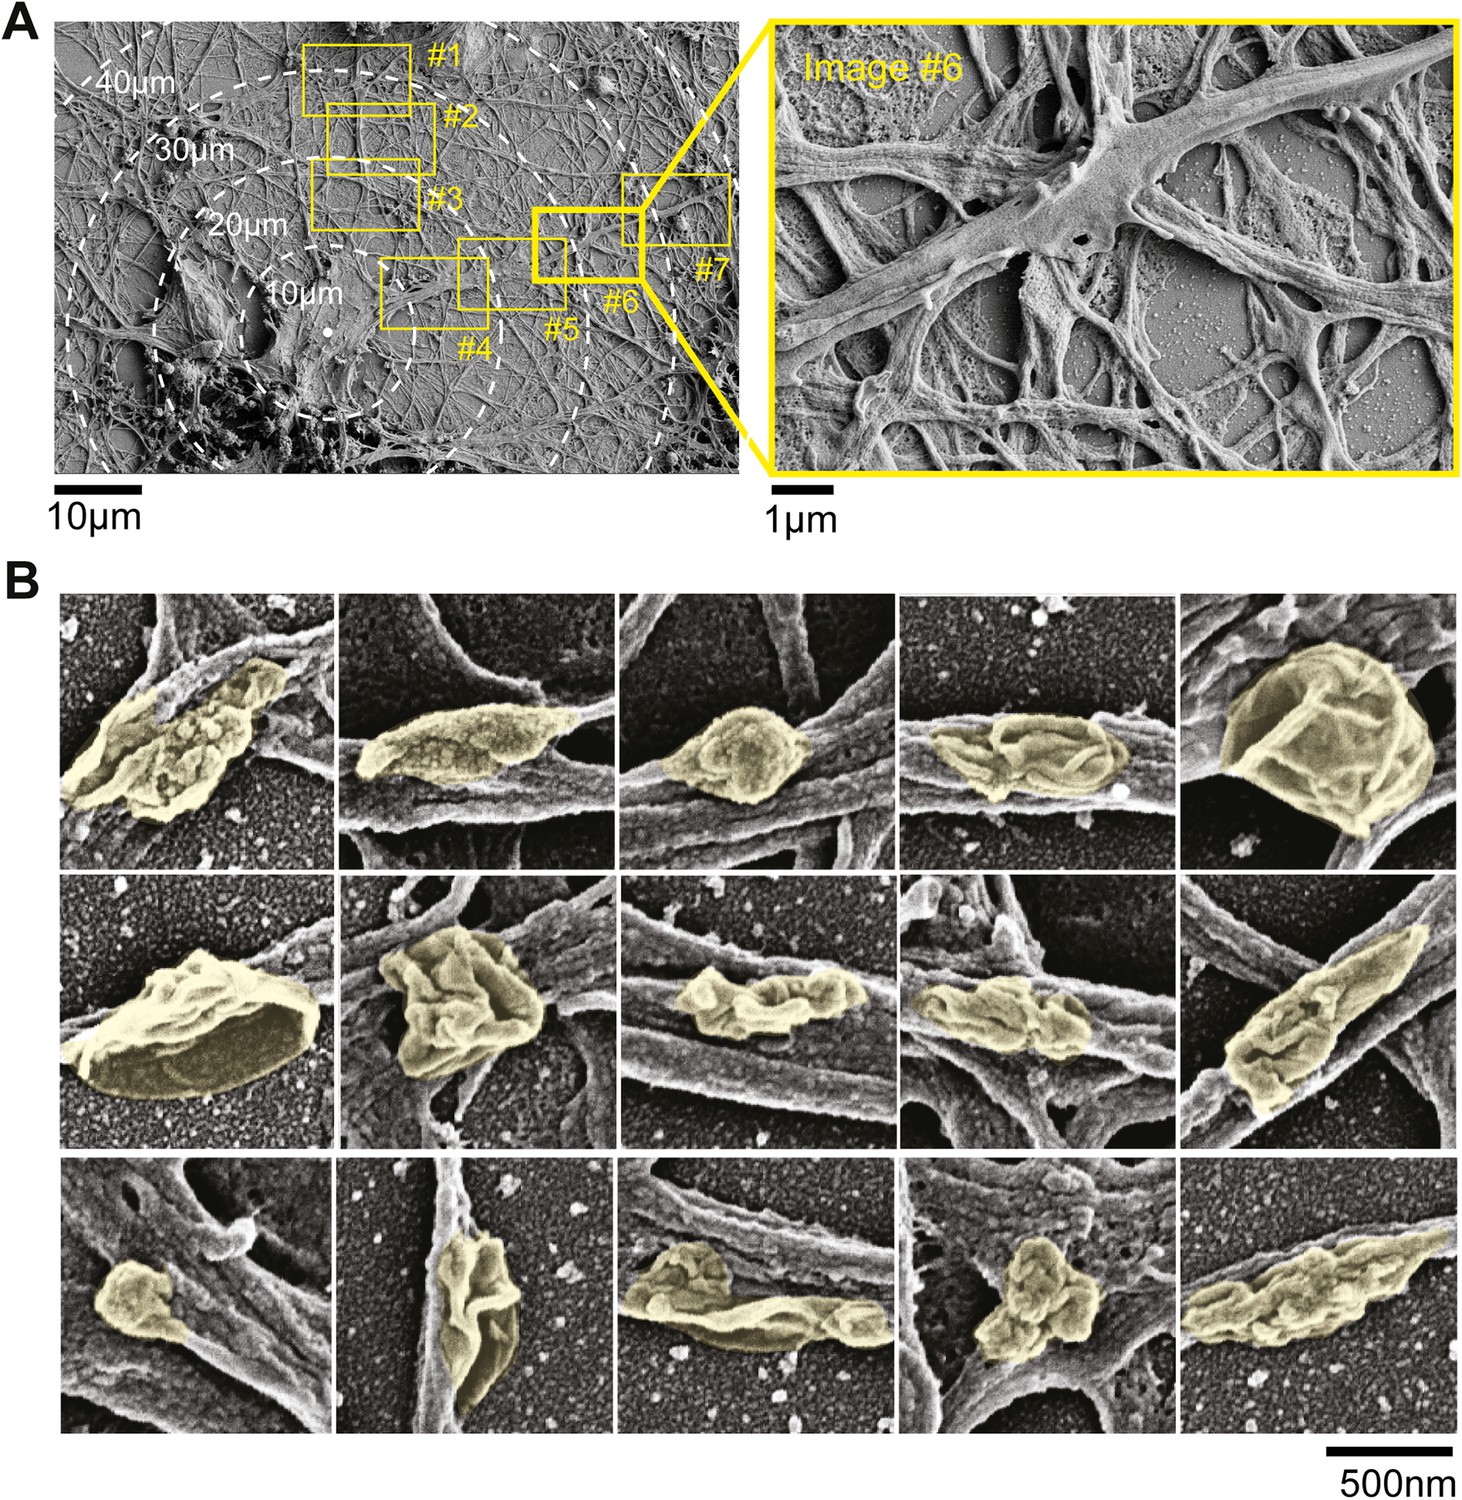
Electron micrographs of neurons.
(A) Dendritic surface analysis. Neurons were imaged at low resolution and individual neurons were identified. The proximal 100 µm of dendritic arbors were then imaged at high resolution (boxes #1–#7) and surface structures in high resolution images were then grouped as nodes, elongated protrusions, and stubby protrusions. Note in image #6 (red box) protrusion emerging from the dendritic surface. (B) Examples of nodes that form on the dendritic surface. Scanning electron micrographs of neurons that were fixed on DIV11. Individual nodes are highlighted in yellow. Scale bar, 500 nm.
Figure 1—figure supplement 6
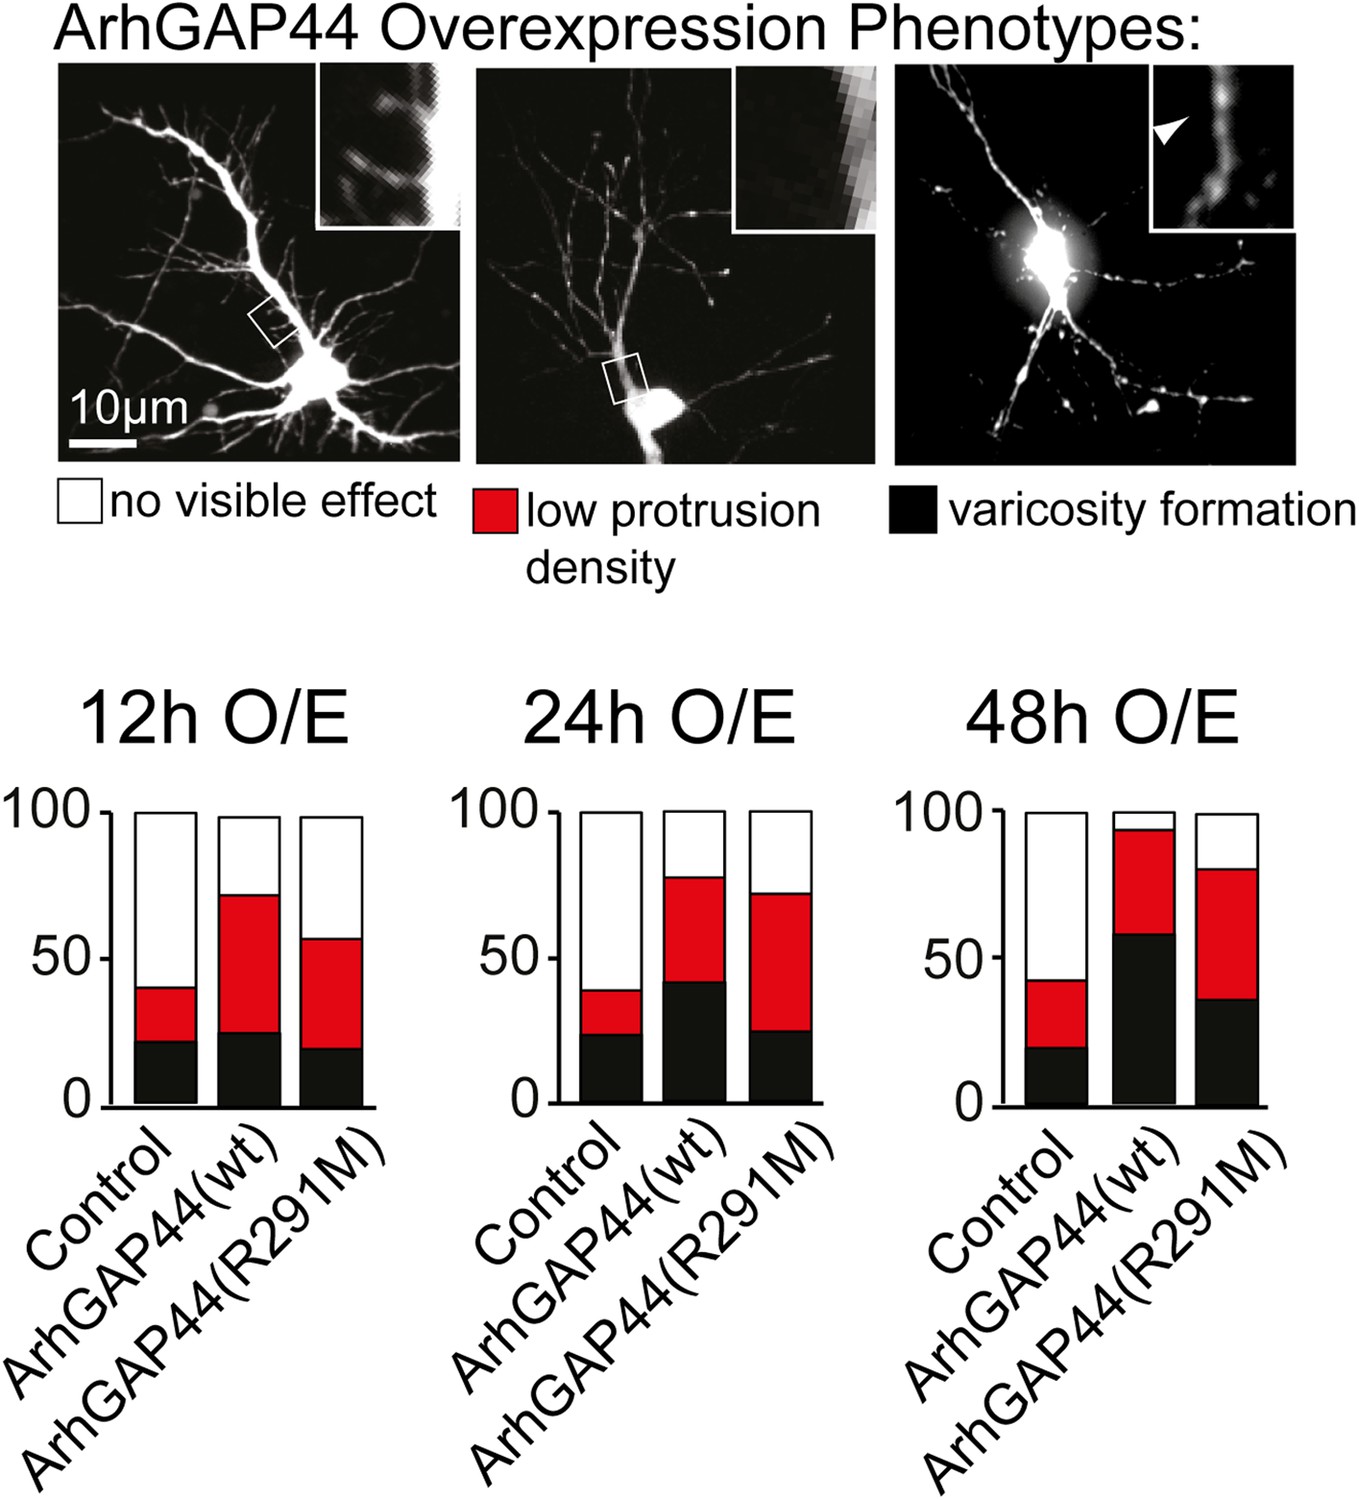
Overexpression phenotypes of ArhGAP44 in cultured neurons.
Cells were transfected with control plasmid, ArhGAP44(wt) and ArhGAP44(291), respectively, and cell morphology was assessed 12 hr (n = 161 neurons, 3 independent experiments), 24 hr (n = 112 neurons, 3 independent experiments), and 48 hr (n = 160 neurons, 3 independent experiments) after transfection. Neurons were classified based on cell morphology showing no effect (white), reduced protrusion density (red), and varicosity formation (black). Scale bar, 10 µm.
Figure 2 with 5 supplements
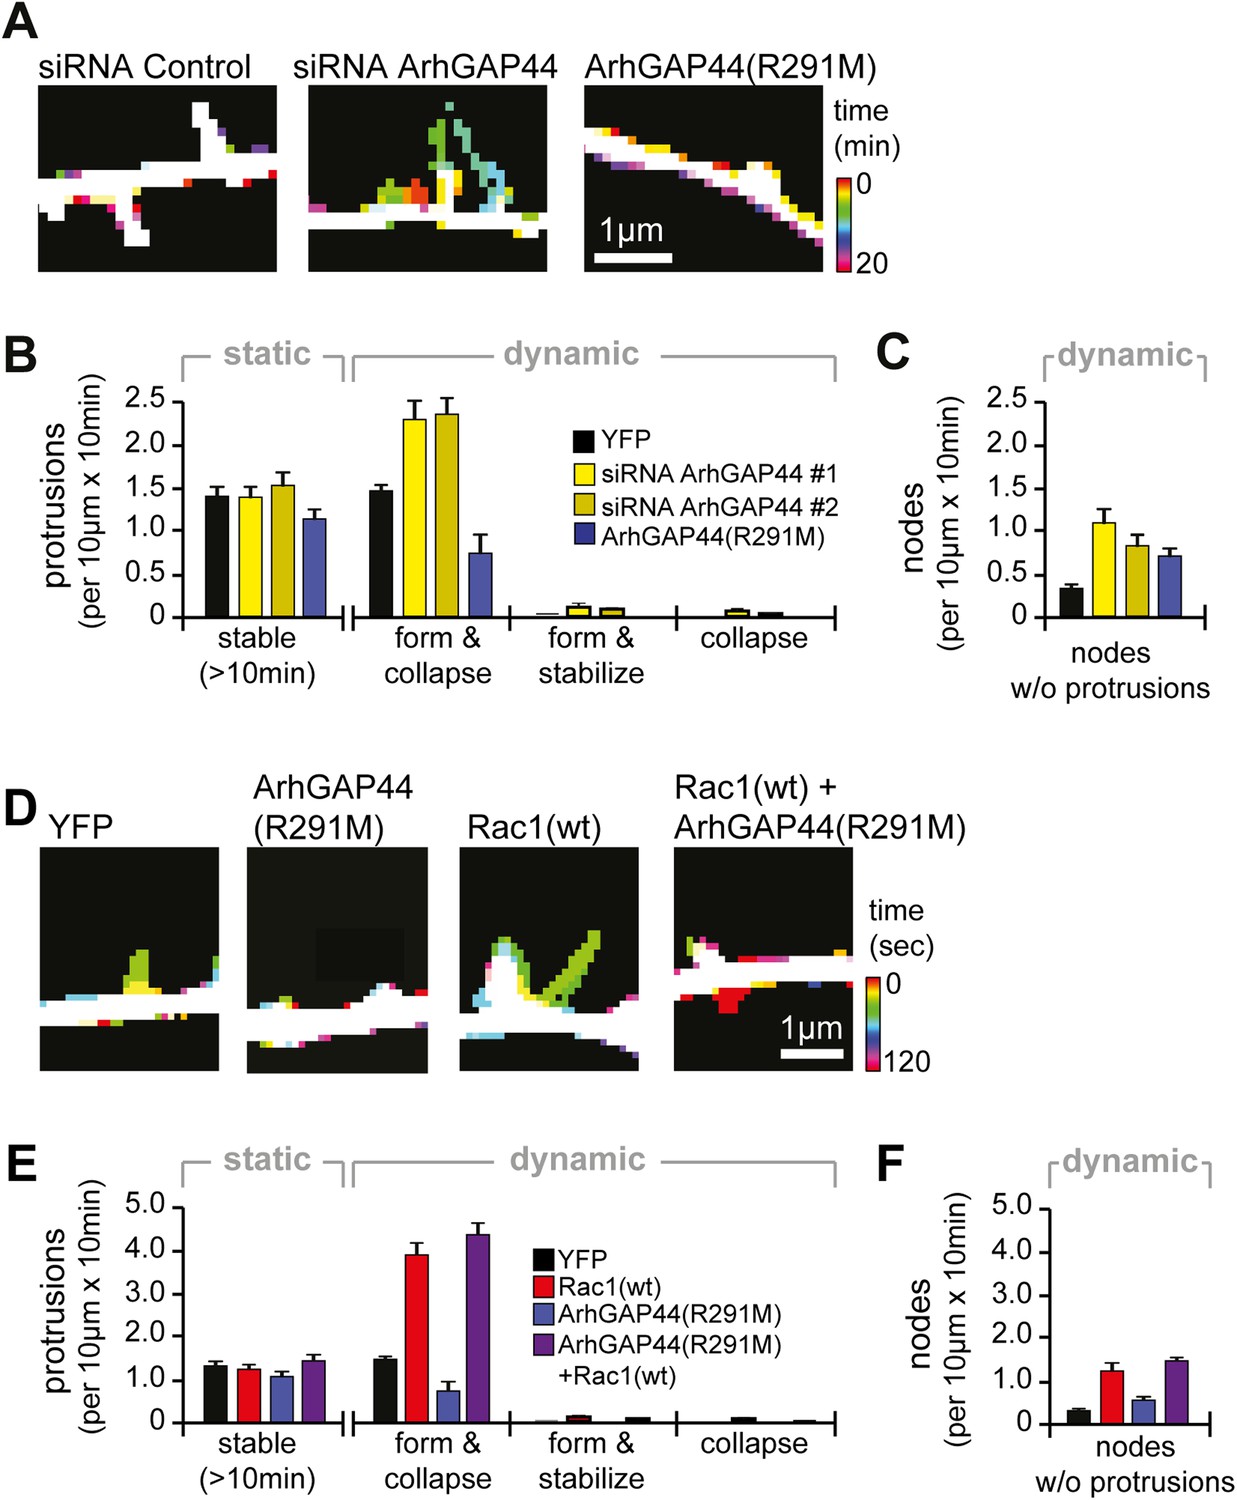
Knockdown of ArhGAP44 and overexpression of Rac both increase de novo filopodia formation.
(A) Color-coded overlay of image-series. Note increased protrusion dynamics upon knockdown of ArhGAP44. (B and C) ArhGAP44 negatively regulates de novo protrusions. Analysis of protrusion dynamics in neurons transfected with control (black; n = 85 protrusions, 10 neurons, 3 independent experiments), ArhGAP44(R291M) (blue; n = 106 protrusions, 11 neurons, 3 independent experiments), and upon knockdown of ArhGAP44 (yellow; siRNA #1 = 131 protrusions, 12 neurons, 3 independent experiments; siRNA #2 = 215 protrusions, 15 neurons, 3 independent experiments). Compared to controls, overexpression of ArhGAP44(R291M) reduces while knockdown of ArhGAP44 increases formation of transient protrusion (B). Both increase node formation (C). (D) Color-coded overlay of image-series. Note increased protrusion dynamics upon overexpression of Rac1. (E and F) Co-expression of Rac1 reverses ArhGAP44-dependent reduction in protrusion dynamics. Compared to control (black; n = 85 protrusions, 10 neurons, 3 independent experiments), overexpression of Rac1 (red, n = 123 protrusions, 9 neurons, 3 independent experiments) increases the formation of transient protrusion (E) and nodes (F). For both parameters, co-expression of Rac1 with ArhGAP44(R291M) (purple, n = 126 protrusions, 12 neurons, 3 independent experiments) can compensate for the reduction observed for ArhGAP44(R291M) alone (blue, n = 106 protrusions, 11 neurons, 3 independent experiments). Scale bars (A and D), 1 µm.
Figure 2—figure supplement 1
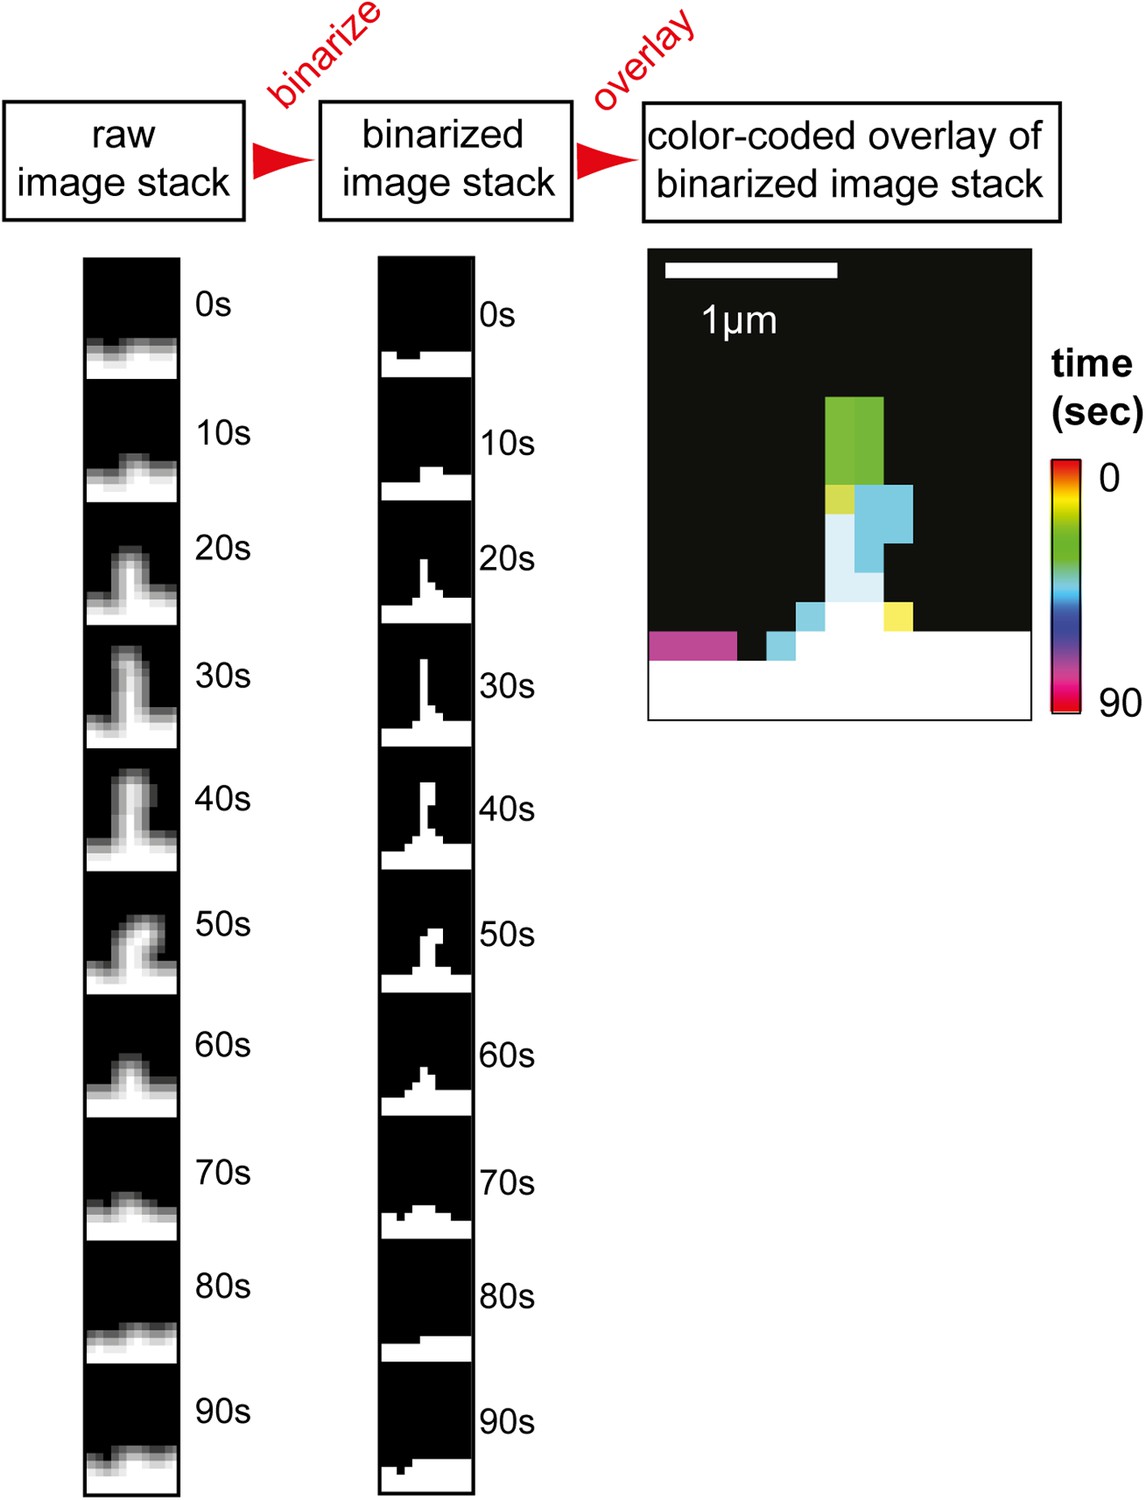
Filopodia analysis tool and GTPase overexpression control.
Analysis method used to measure filopodia kinetics. A set of images (left column) was binarized (middle column) and individual images were super-imposed to create a color-coded overlay of the image-series (right image). Scale bar, 1 µm.
Figure 2—figure supplement 2
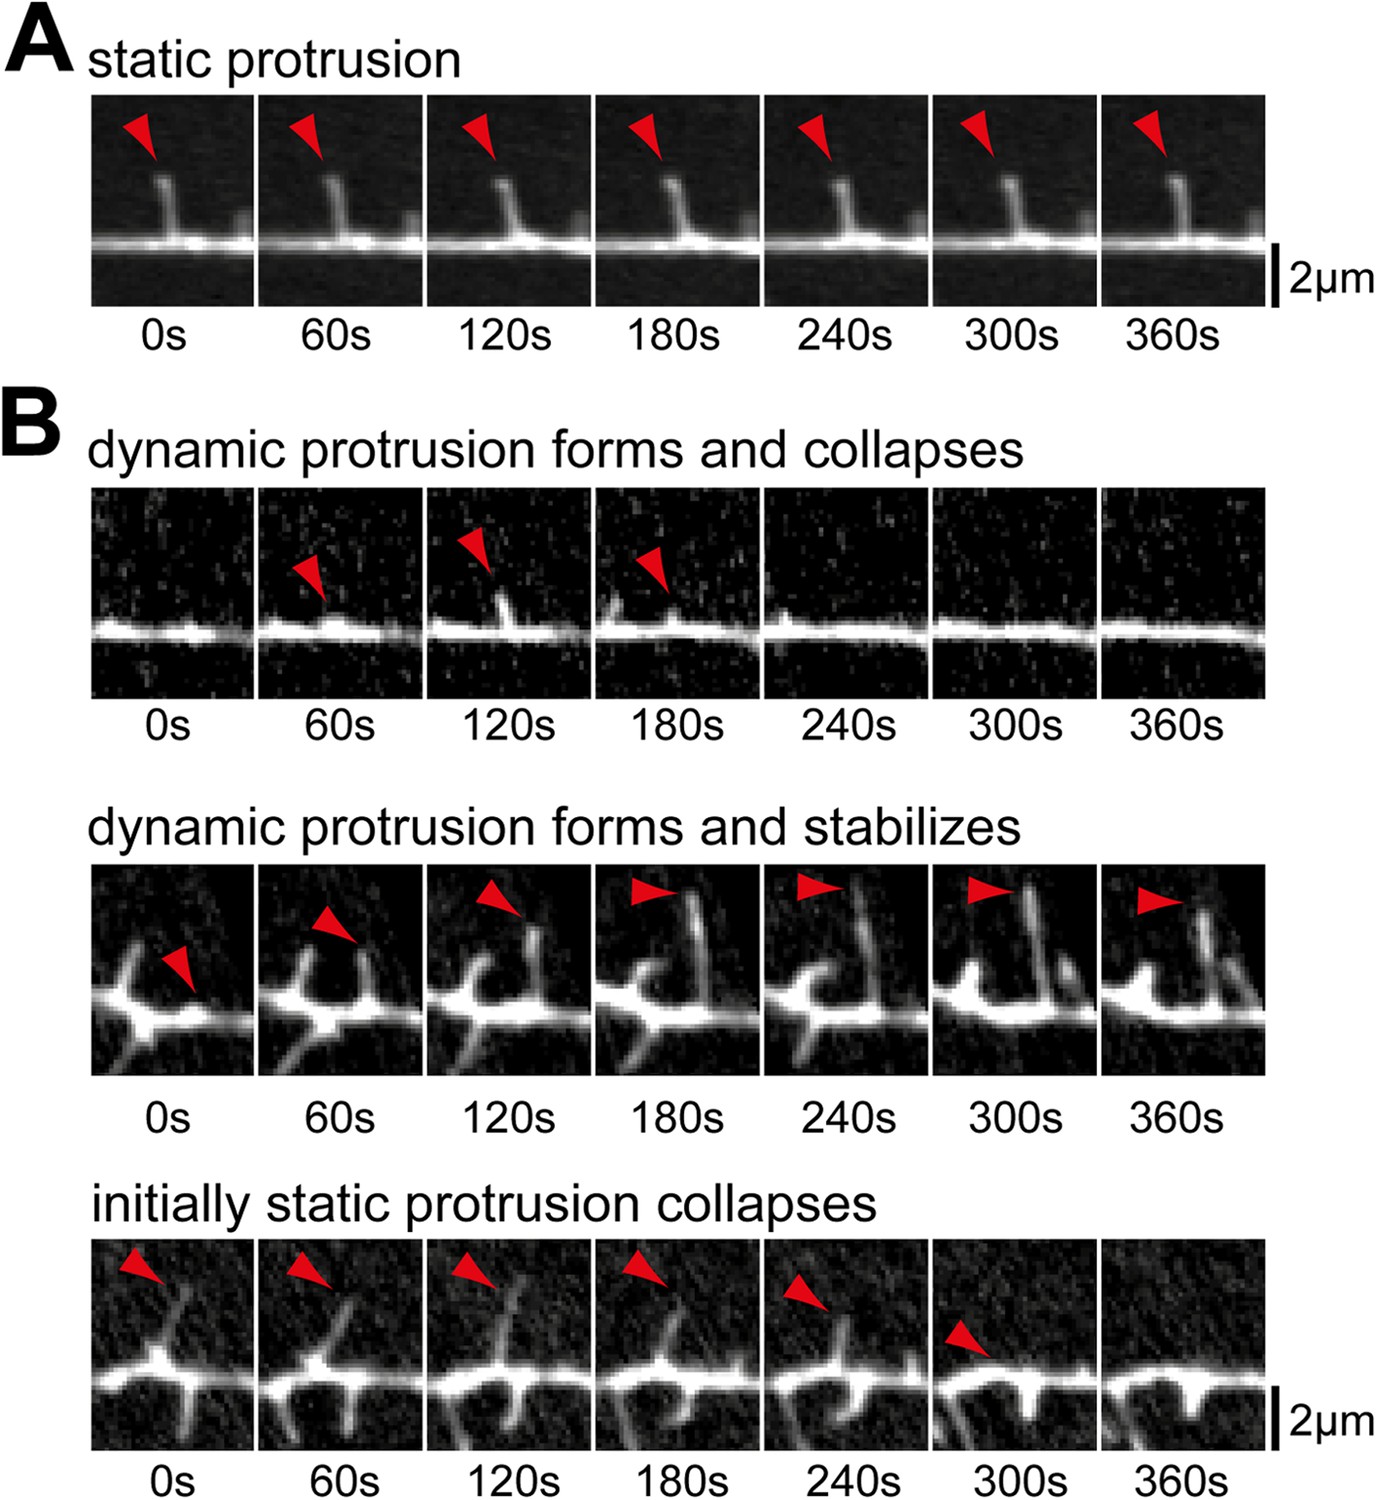
Examples of prototypic dendritic protrusions.
(A) Protrusions that persist throughout the acquisition interval were considered static. (B) Dynamic protrusions were divided into three groups: protrusions that extend and retract during acquisition (top panel); protrusions that extend and remain extended for at least 3 min (middle panel); and protrusions that persisted for at least 3 min before collapsing (bottom panel). Scale bars (A and B), 2 µm.
Figure 2—figure supplement 3
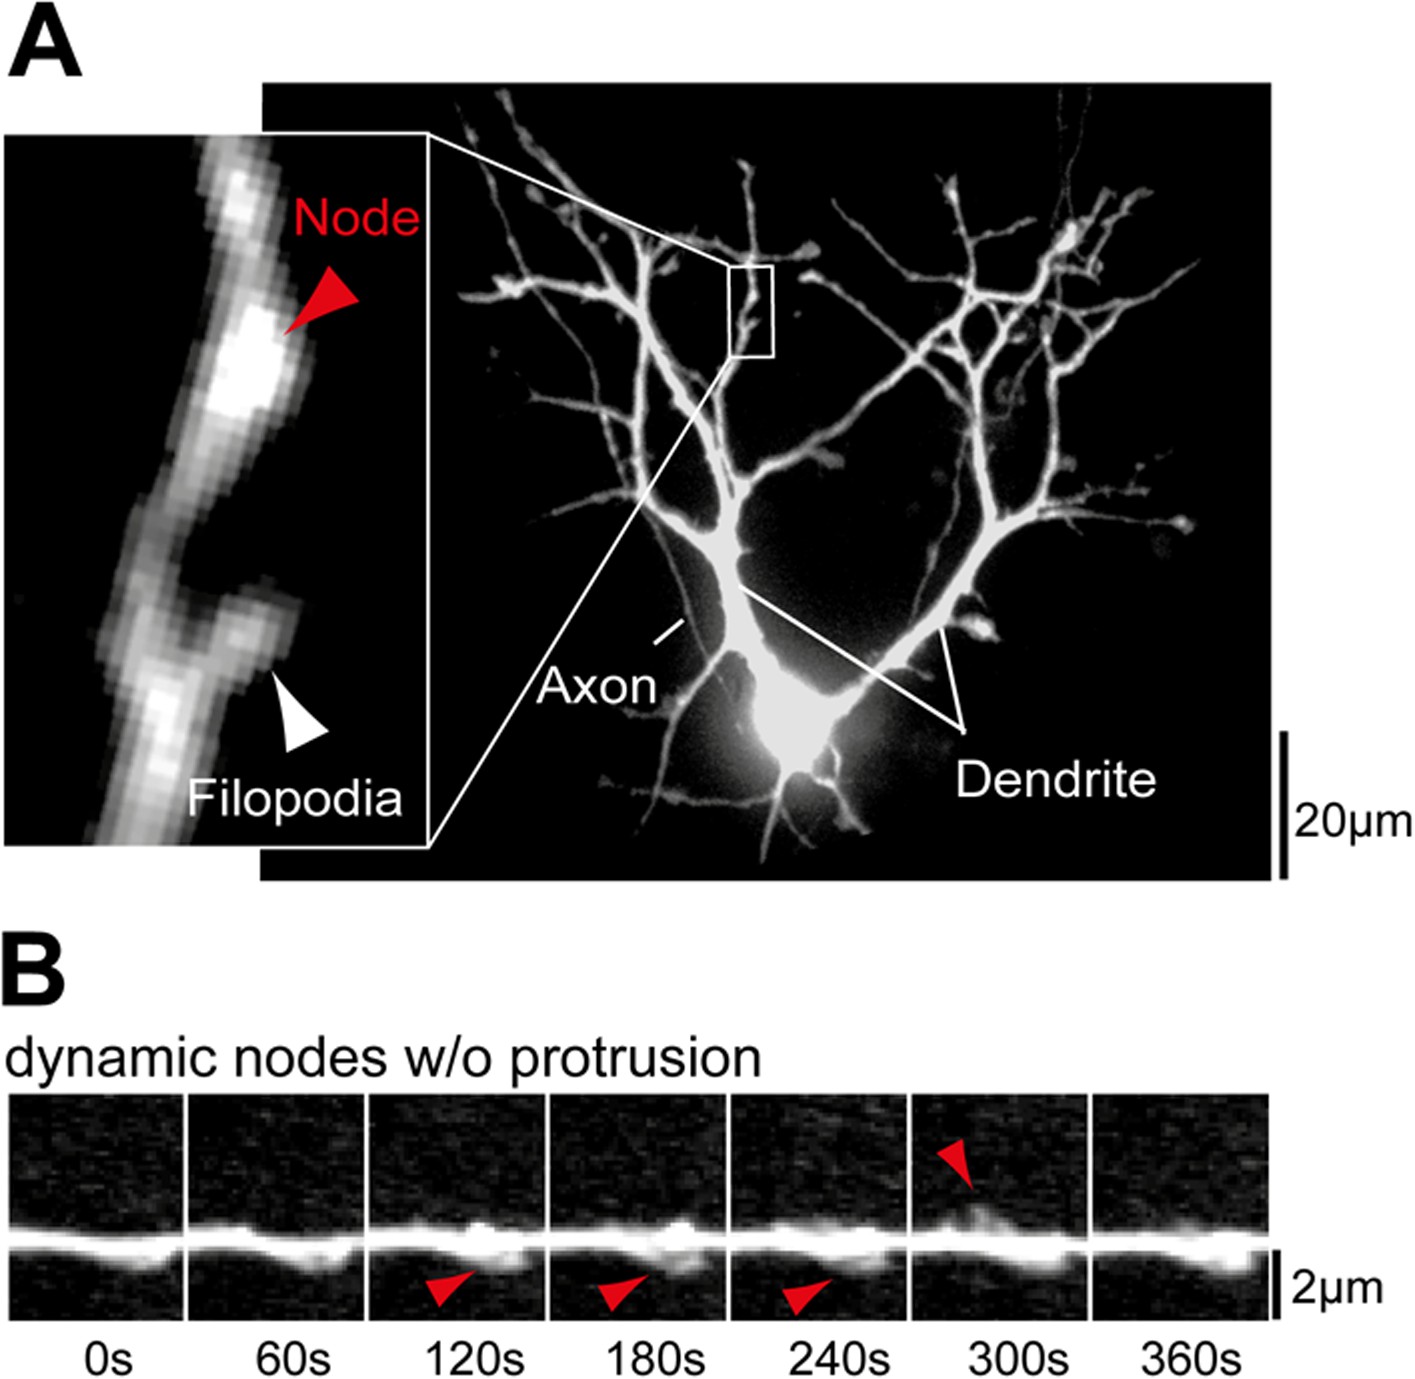
Examples of dendritic nodes.
(A) Nodes are identified as thickened regions in the dendritic shaft. A section of the dendrite with a node but no filopodia (red arrow) and a node with a filopodium (white arrow) are shown enlarged. (B) Dendritic nodes (red arrow) are often observed without a subsequent extension of a filopodia. Scale bars (A), 20 µm; (B), 2 µm.
Figure 2—figure supplement 4
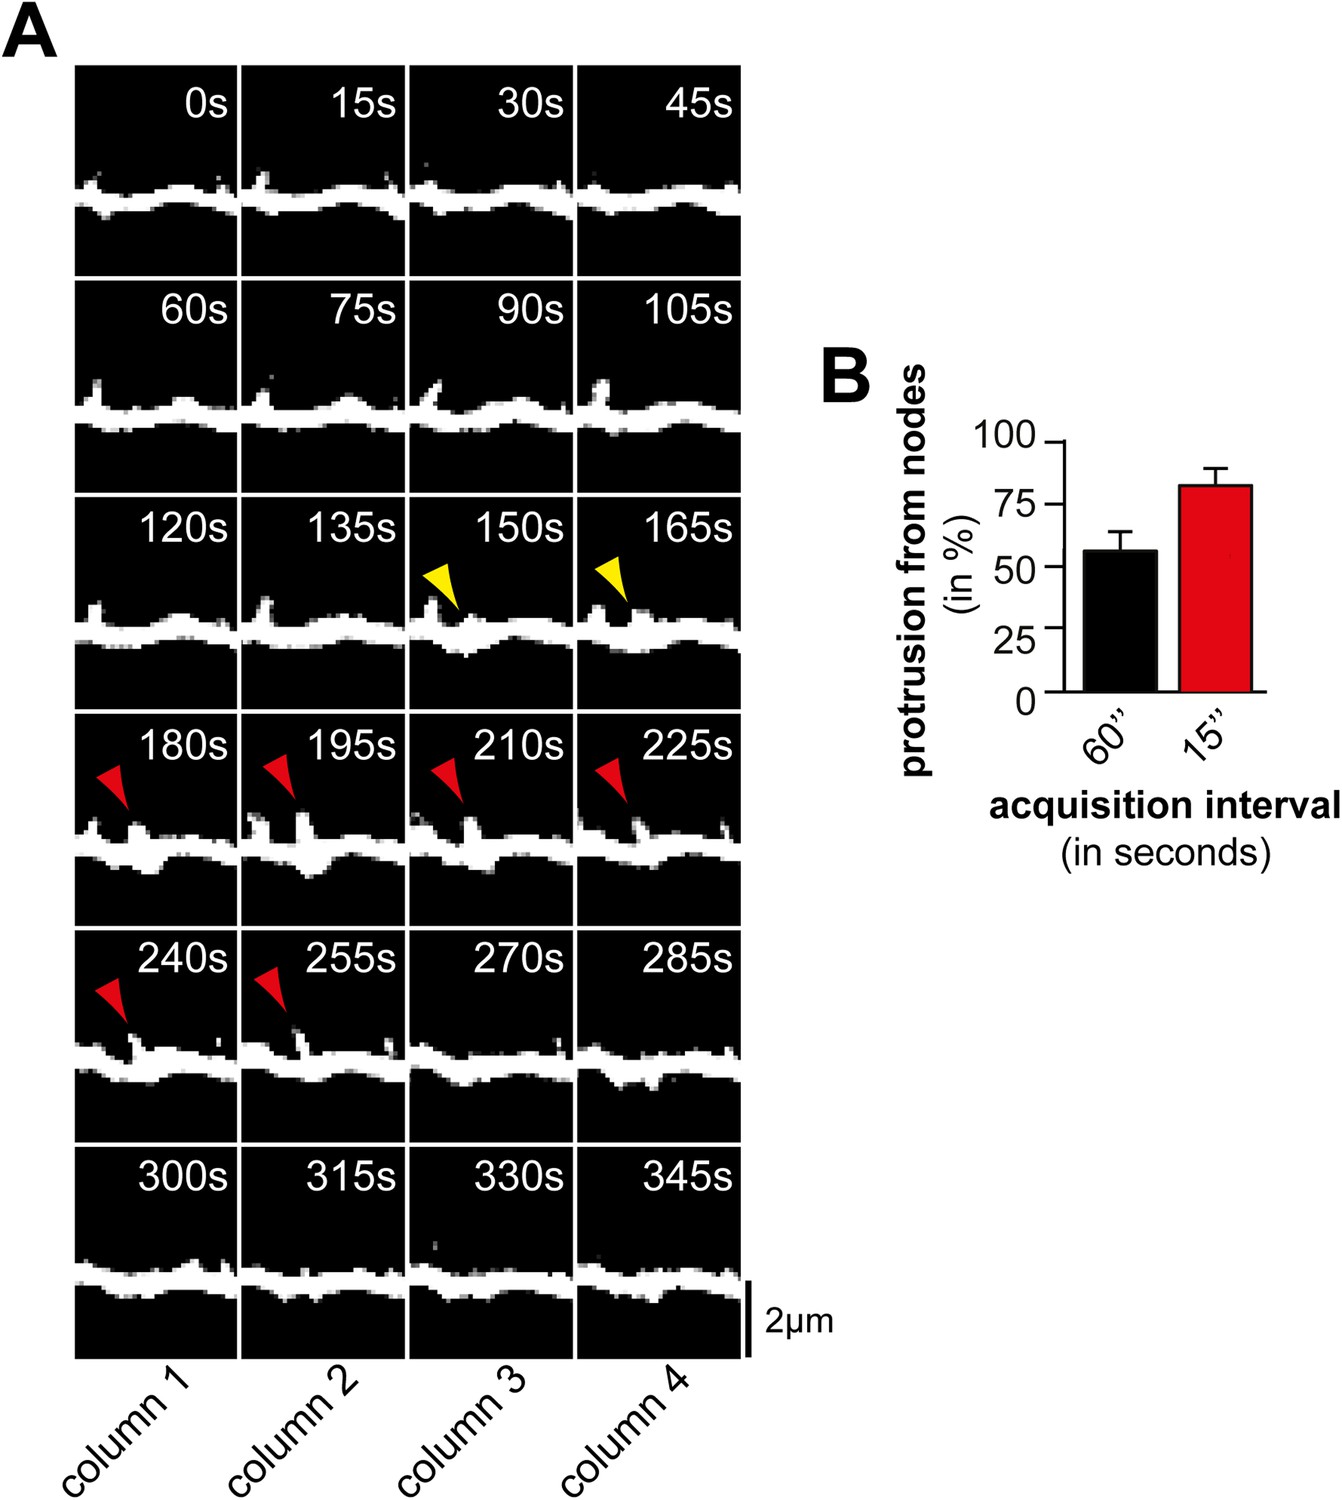
Acquisition interval of 60 s is sufficient to detect dynamic protrusions but not all nodes.
(A) Time lapse of a dendritic branch from which a protrusion (red) emerges and collapses. Note that not all nodes (yellow arrows) can be identified when using a 60 s interval (e.g., compare columns 2 and 4). (B) The majority of protrusions emerge from nodes. Quantification of percentage of filopodia that emerge from nodes using acquisition intervals of 60 s (black; 45 nodes form 11 neurons, 3 independent experiments) and 15 s (red; 75 nodes form 12 neurons, 3 independent experiments), respectively. Note that the fraction of protrusions emerging from nodes increases with shorter intervals as nodes can be short-lived. Scale bar (A), 2 µm.
Figure 2—figure supplement 5

The ArhGAP44 knockdown phenotype is phenocopied by the small GTPase Rac1 but not Cdc42.
(A) ArhGAP44 is a RhoGAP with dual selectivity for Rac1 and Cdc42. GTPase pull-down assay show hydrolysis of GTP-Cdc42 (green) and GTP-Rac1 (red) by ArhGAP44. (B) Overexpression of Rac1 but not of Cdc42 increases protrusion density. Neurons were transfected with the wild type form of human Rac1 and Cdc42. Note that only Rac1(red) increased protrusion density. (C) Rac1 but not Cdc42 reverse ArhGAP44(R291M)-dependent slow-down in protrusion dynamics. Neurons were transfected either with a control plasmid (black, n = 18 neurons, 3 independent experiments), Cdc42 (green, n = 15 neurons, 3 independent experiments), Rac1 (red, n = 13 neurons, 3 independent experiments), ArhGAP44(R291M) (blue, n = 18 neurons, 3 independent experiments), or co-transfected with ArhGAP44(R291M) together with Cdc42 (green-blue, n = 11 neurons, 3 independent experiments) or Rac1 (violet, n = 13 neurons, 3 independent experiments). (D) Overexpression of Rac1 but not of Cdc42 triggered node formation observed upon knockdown of ArhGAP44. Time-lapse images of neurons co-transfected with a siRNA directed against ArhGAP44 together with a fluorescence marker (top), expressing wild-type Rac1 (second panel), expressing wild-type Cdc42 (third panel), and expressing control plasmid (bottom). Note that ectopic nodes are formed from which filopodia emerge upon knockdown of ArhGAP44 and overexpression of Rac1 but not after expression of Cdc42. Scale bars (D, left panels), 20 µm; (D, right panels), 2 µm.
Figure 3 with 2 supplements
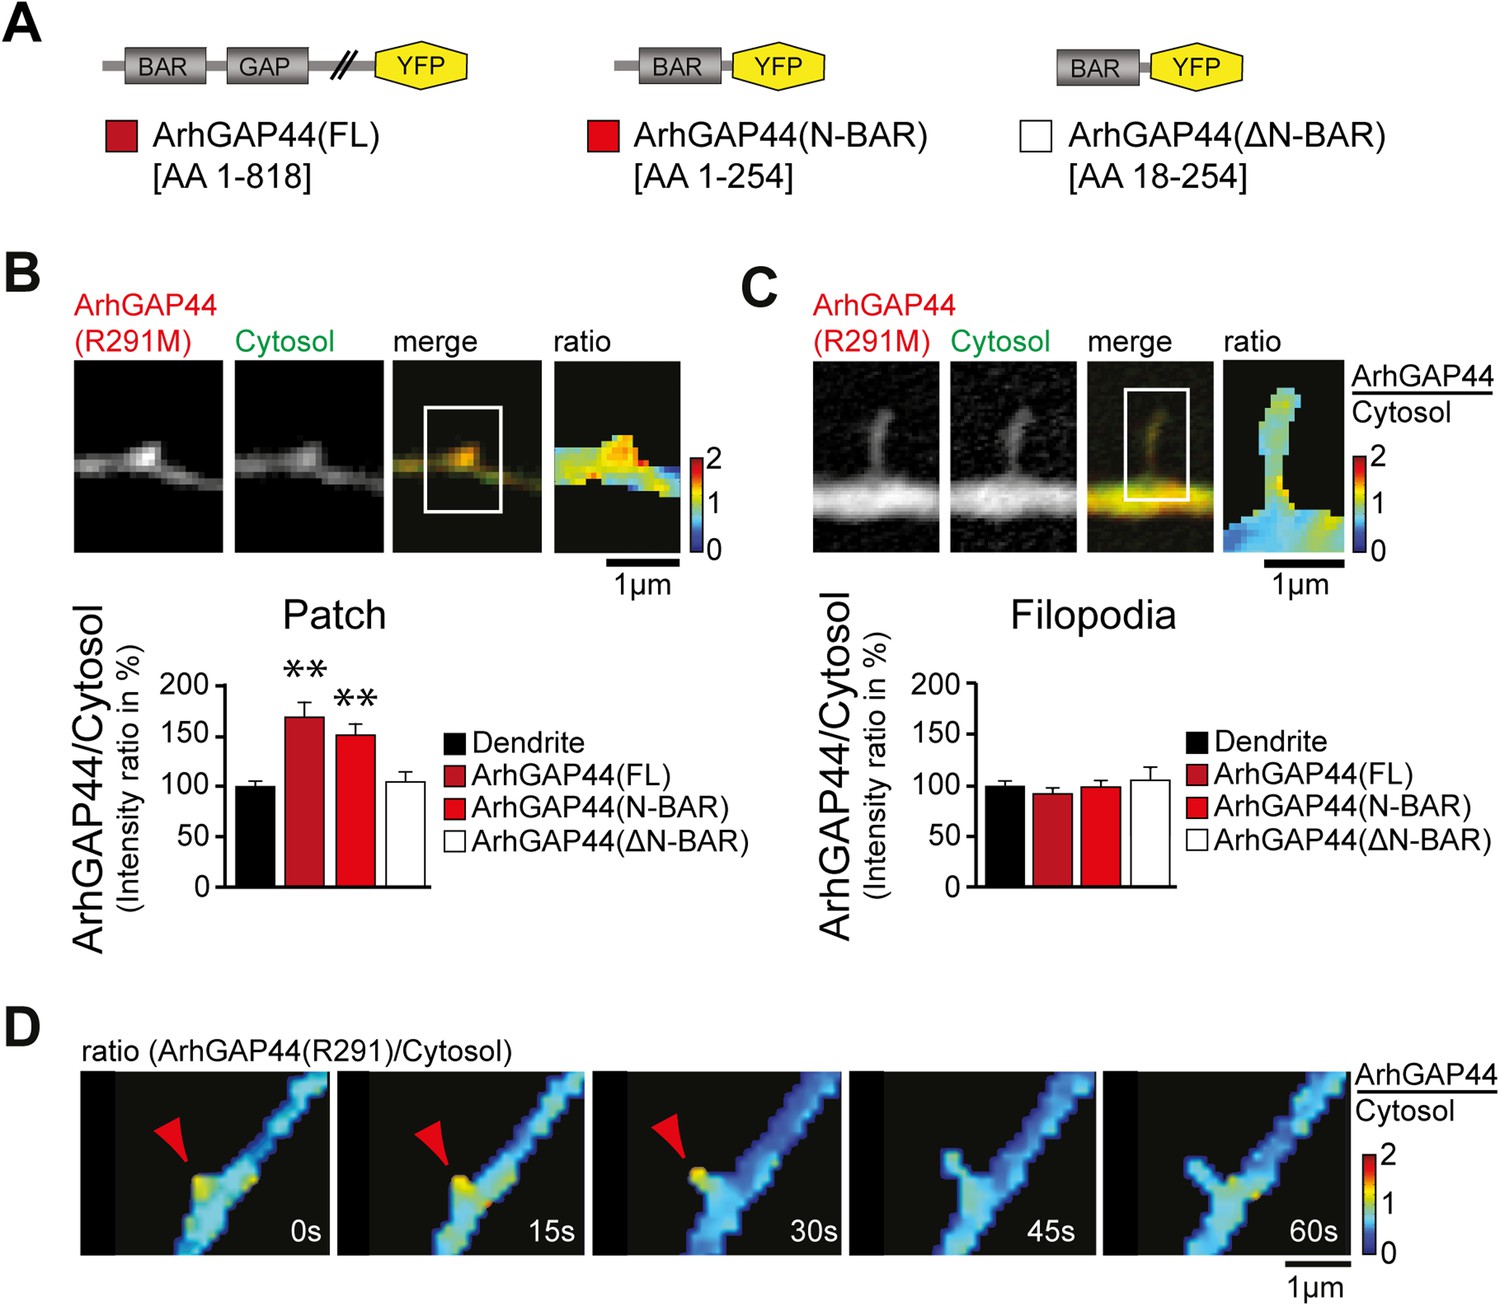
ArhGAP44 recruitment to dendritic nodes precedes filopodia extension.
(A) ArhGAP44 protein structure and deletion mutants. ArhGAP44 is composed of an amino-terminal curvature-sensing N-BAR domain (AA 1–254), followed by the RhoGAP domain (AA 255–445) and a stretch of ∼350 amino acids (AA 445–818) with no annotated domain structure. Full length (left, dark red), the isolated N-BAR domain (middle, red), and the N-BAR domain lacking the initial 18 amino acids (right, white) were tested. (B) Enrichment of full length (dark red; 25 patches, 12 neurons, 3 independent experiments) and the isolated N-BAR domain of ArhGAP44 (red, n = 34 patches, 11 neurons, 3 independent experiments) in dendritic patches. No enrichment is observed for the N-BAR domain lacking the first 18AA that encode an amphipathic helix critical for curvature sensing (white; 20 patches, 11 neurons, 3 independent experiments). Note, ArhGAP44(R291M) was used to reduce the compromised cell health caused by overexpression of equal levels of active wild-type protein. (C) No enrichment of full length (dark red; 26 filopodia, 14 neurons, 3 independent experiments), the isolated N-BAR domain of ArhGAP44 (red, n = 40 filopodia, 13 neurons, 3 independent experiments), or the N-BAR domain lacking the first 18AA (white; 22 patches, 10 neurons, 3 independent experiments) in dendritic filopodia. (D) Filopodia emerge from ArhGAP44-rich patches. Scale bars (B, C, D), 1 µm.
Figure 3—figure supplement 1
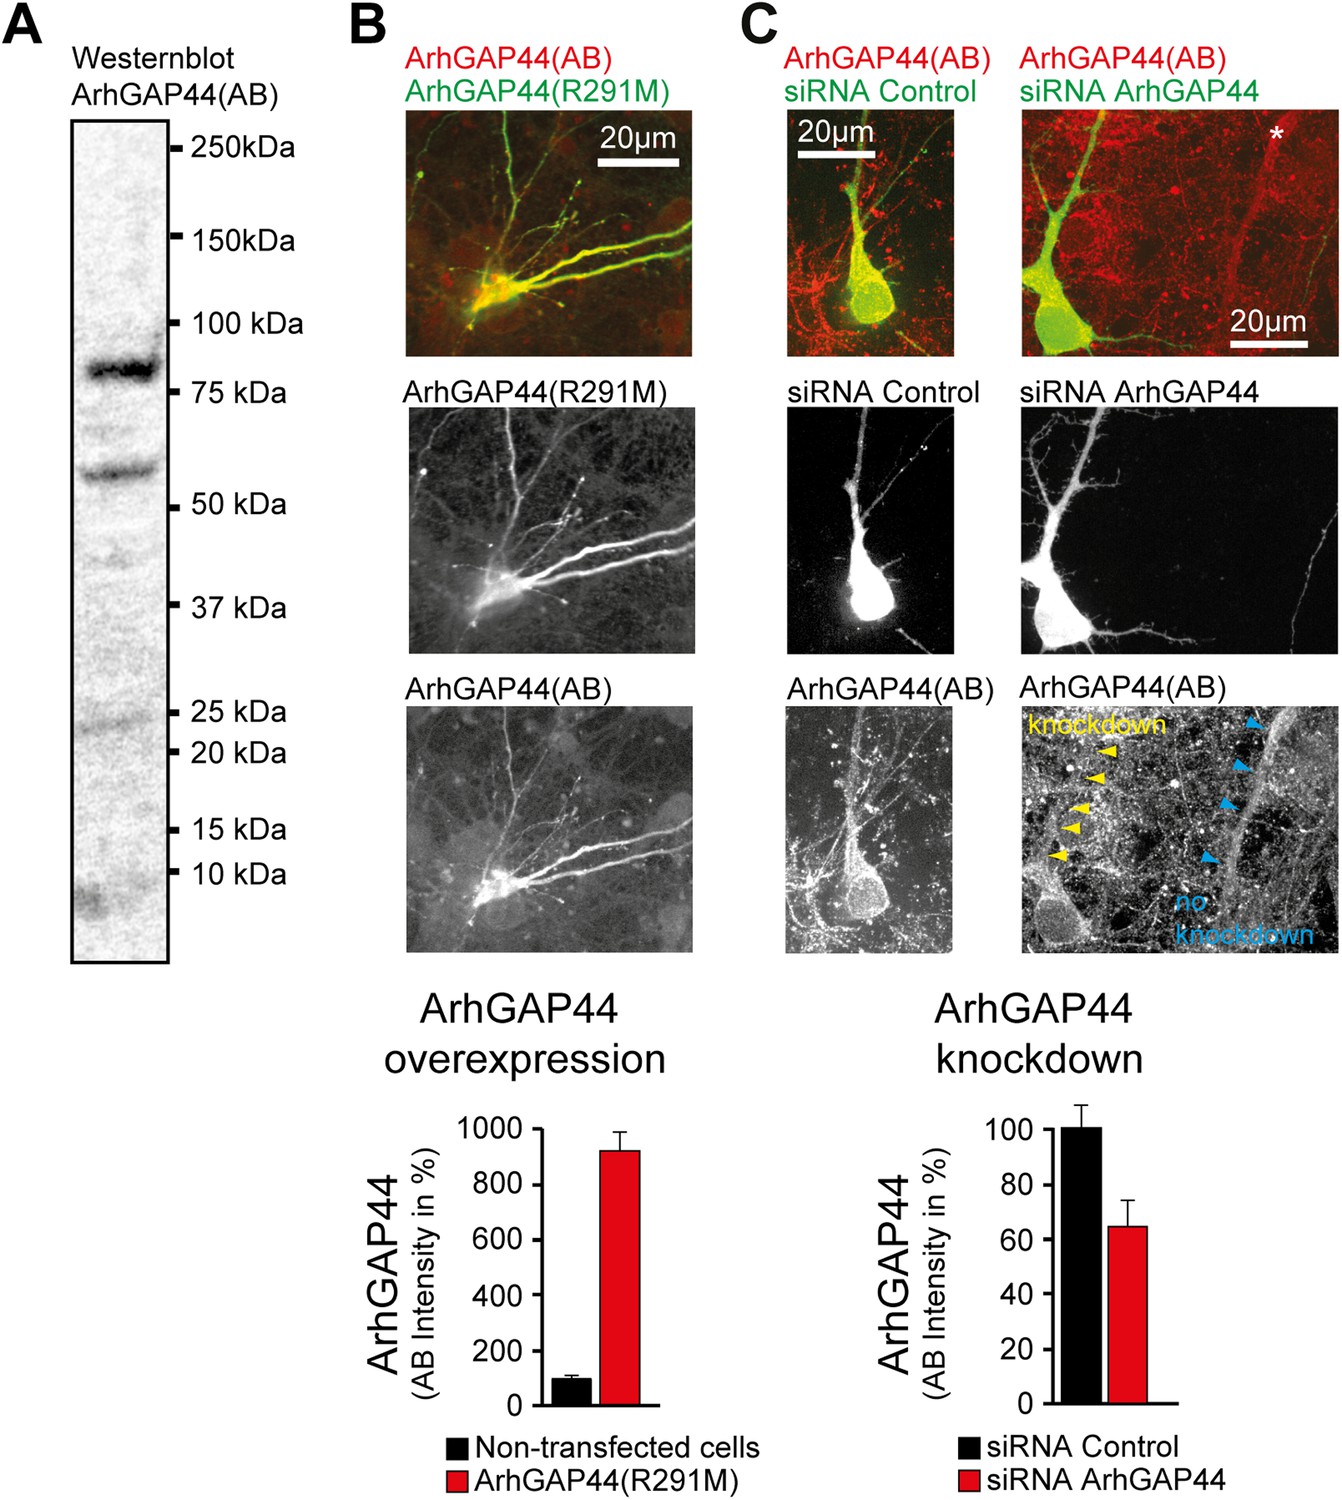
ArhGAP44 antibody controls.
(A) Western blot of whole rat brain with antibody directed against ArhGAP44(818AA) (unspecific bands are visible). (B) Increase immunostaining directed against ArhGAP44 after overexpression of ArhGAP44. Primary hippocampal neurons were transfected with a fluorescently tagged ArhGAP44(R291M) and fixed 24 hr later. Quantification of fluorescence intensity of non-transfected neurons (black, n = 20 cells, 2 independent experiments) and neurons transfected with ArhGAP44 (red, n = 12 cells, 2 independent experiments) after staining with an antibody directed against ArhGAP44 is shown below. (C) Control experiment showing reduced immunostaining of ArhGAP44 after knockdown of ArhGAP44. Primary hippocampal neurons were transfected at DIV10 with diced RNA directed against ArhGAP44 and a fluorescence reference (empty pEYFP plasmid) and fixed 48 hr later. Relative fluorescence intensity was measuerd in dendritic stretches and normalized to the adjacent background (arrows). Quantification of fluorescence intensity after staining with an antibody directed against ArhGAP44 of cells transfected with control siRNA (black, n = 16 cells, 2 independent experiments) and siRNA directed against ArhGAP44 (red, n = 18 cells, 2 independent experiments) is shown below. Scale bars (B and C), 20 µm.
Figure 3—figure supplement 2
ArhGAP44 localization in neurons.
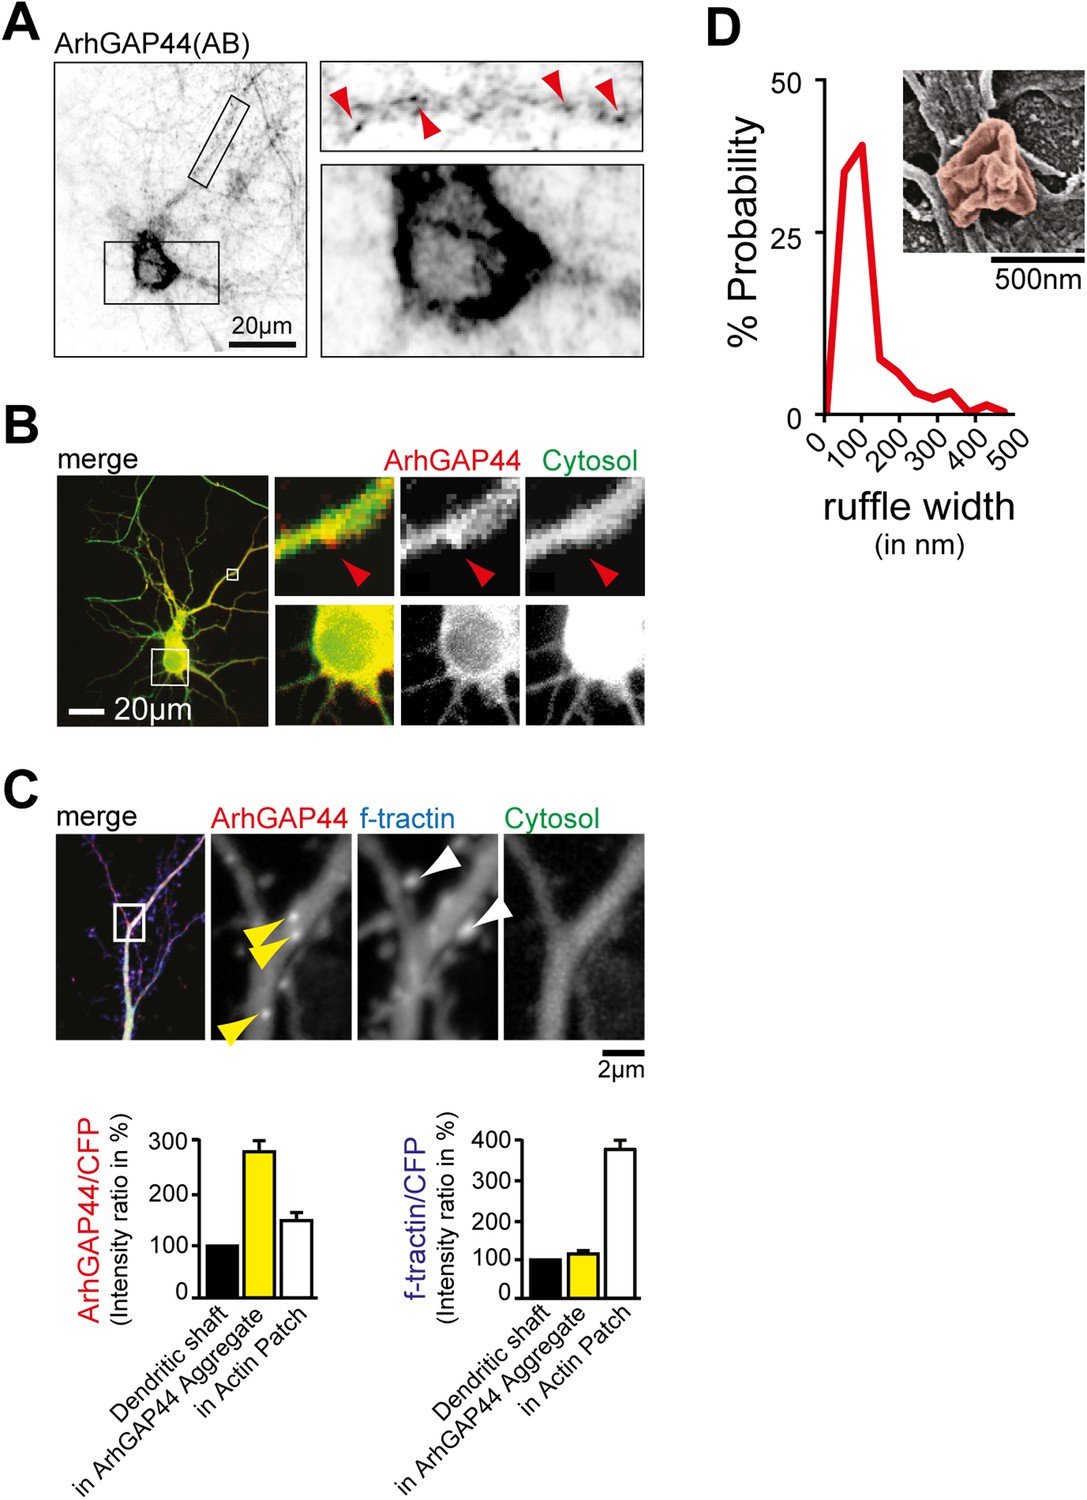
(A) Immunostaining directed against endogenous ArhGAP44 in cultured neurons (top). Primary hippocampal neurons were cultured for 11 days and stained with antibodies directed against ArhGAP44. ArhGAP44 is absent from the nucleus and enriched in distinct patches along the dendritic shaft (red arrows). (B) Overexpressed ArhGAP44 is absent from the nucleus and enriched at distinct patches along the dendritic arbors (bottom). Primary hippocampal neurons were transfected with ArhGAP44(R291M) (red) and a cytosolic reference (green) at DIV10, and imaged 24 hr after transfection. ArhGAP44(R291M) is absent from the nucleus (bottom panels), but present at distinct patches along the dendrite (top panels, red arrow). (C) Overexpression of the isolated N-BAR domain of ArhGAP44 for 48 hr causes bright protein aggregates that are distinct from ArhGAP44 patches. Colocalization analysis (right panels) indicates that expression of ArhGAP44 for extended time causes formation of bright protein aggregates (yellow, n = 24 aggregates, 9 neurons, 2 independent experiments) that do not co-localize with actin patches (white, 34 actin patches form 25 neurons; 3 independent experiments). (D) Nodes that form along the dendrite surface display highly curved membrane sections. Average diameter of individual membrane ruffles in nodes is shown next to it. Scale bars (A and B), 20 µm; (C), 2 µm; (D), 500 nm.
Figure 4 with 3 supplements
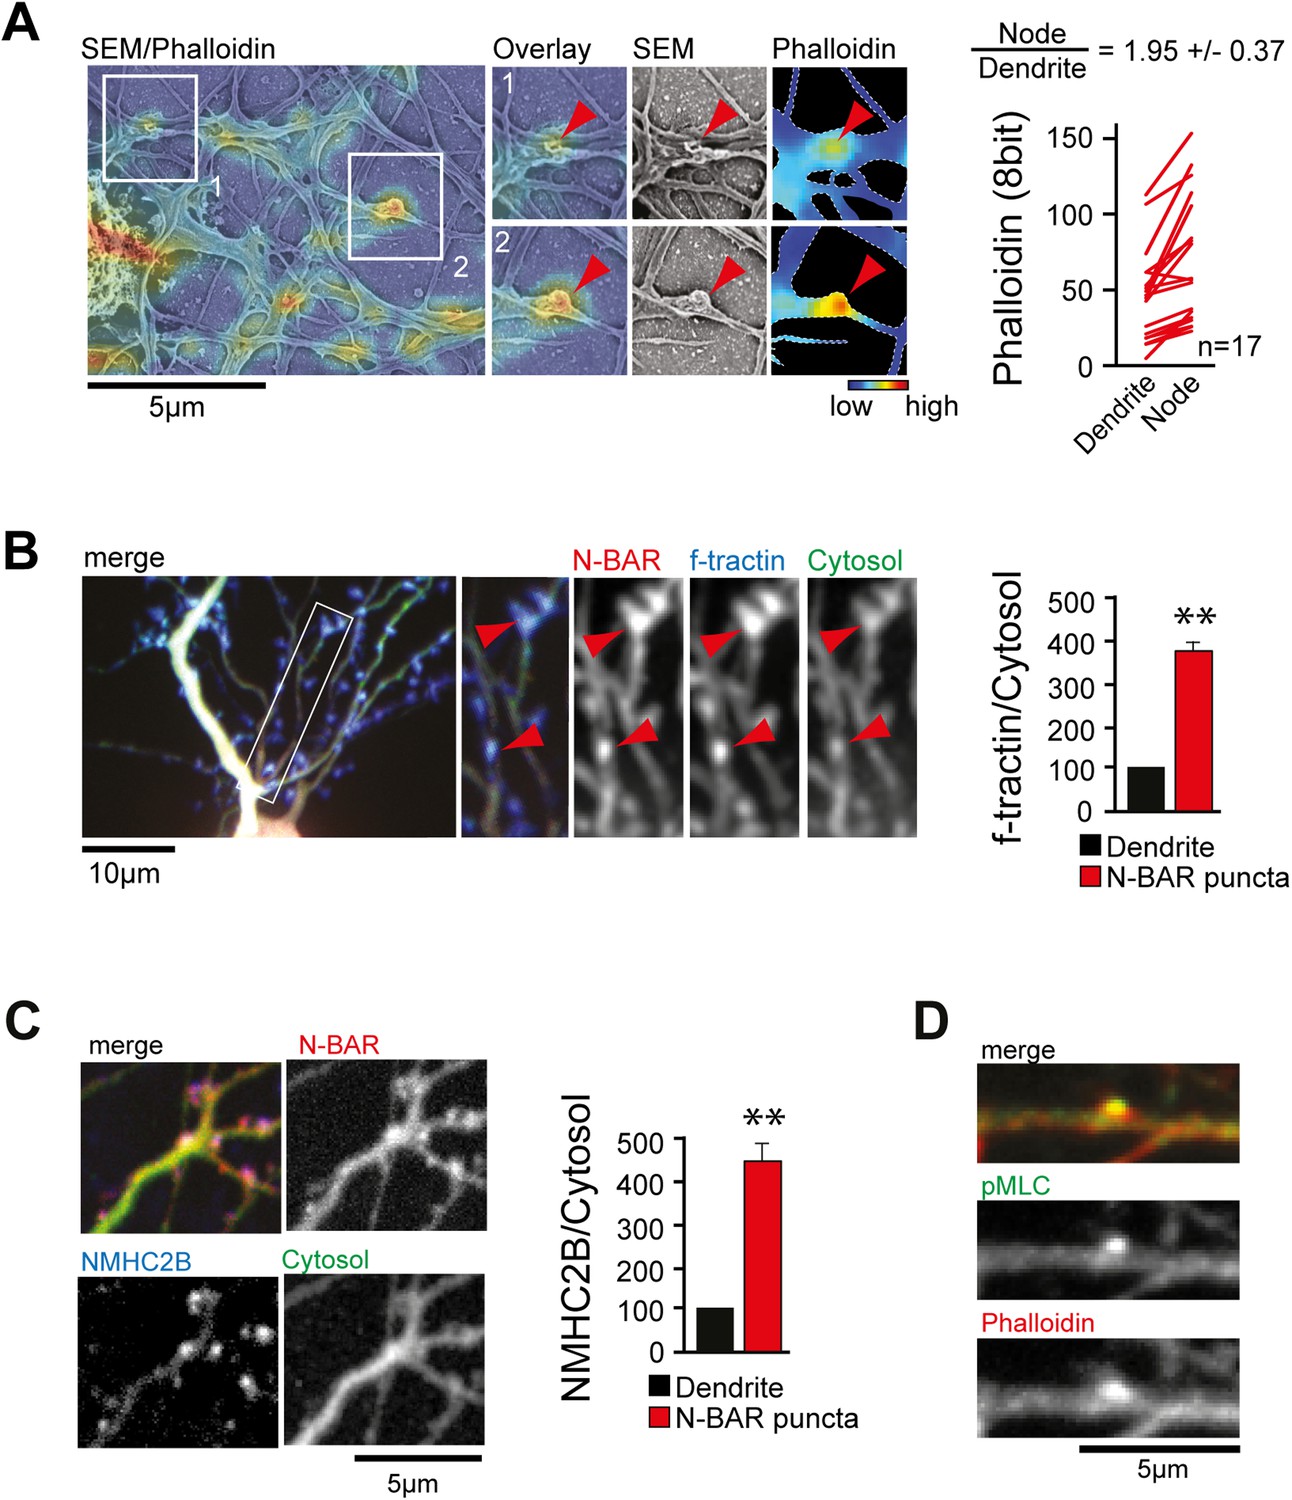
ArhGAP44 is recruited to convoluted dendritic PM sections enriched in polymerized actin and myosin.
(A) Correlative fluorescence and scanning electron microscopy shows actin enrichment in convoluted nodes that form along dendritic arbors. Quantification of the relative fluorescent intensity of phalloidin in individual nodes compared to adjacent dendritic sections is shown to the right. (B) F-tractin and ArhGAP44 co-localize. Neuron was transfected with the N-BAR domain of ArhGAP44 (red), f-tractin (blue), and a cytosolic reference (green). A magnified section (white box) and quantification of relative f-tractin intensity in ArhGAP44 patches are shown next to it (34 patches form 25 neurons; 3 independent experiments). (C) NMHC-2B and ArhGAP44 co-localize. Neurons were transfected with the N-BAR domain of ArhGAP44 (red), NMHC-2B (blue), and a cytosolic reference (green). Quantification of relative NMHC-2B intensity in ArhGAP44 patches is shown next to it (n = 20 patches form 13 neurons; 3 independent experiments). (D) Phosphorylated regulatory myosin light chain (green) is enriched in dendritic actin patches (red). Scale bars (A, C, D), 5 µm; (B), 10 µm.
Figure 4—figure supplement 1
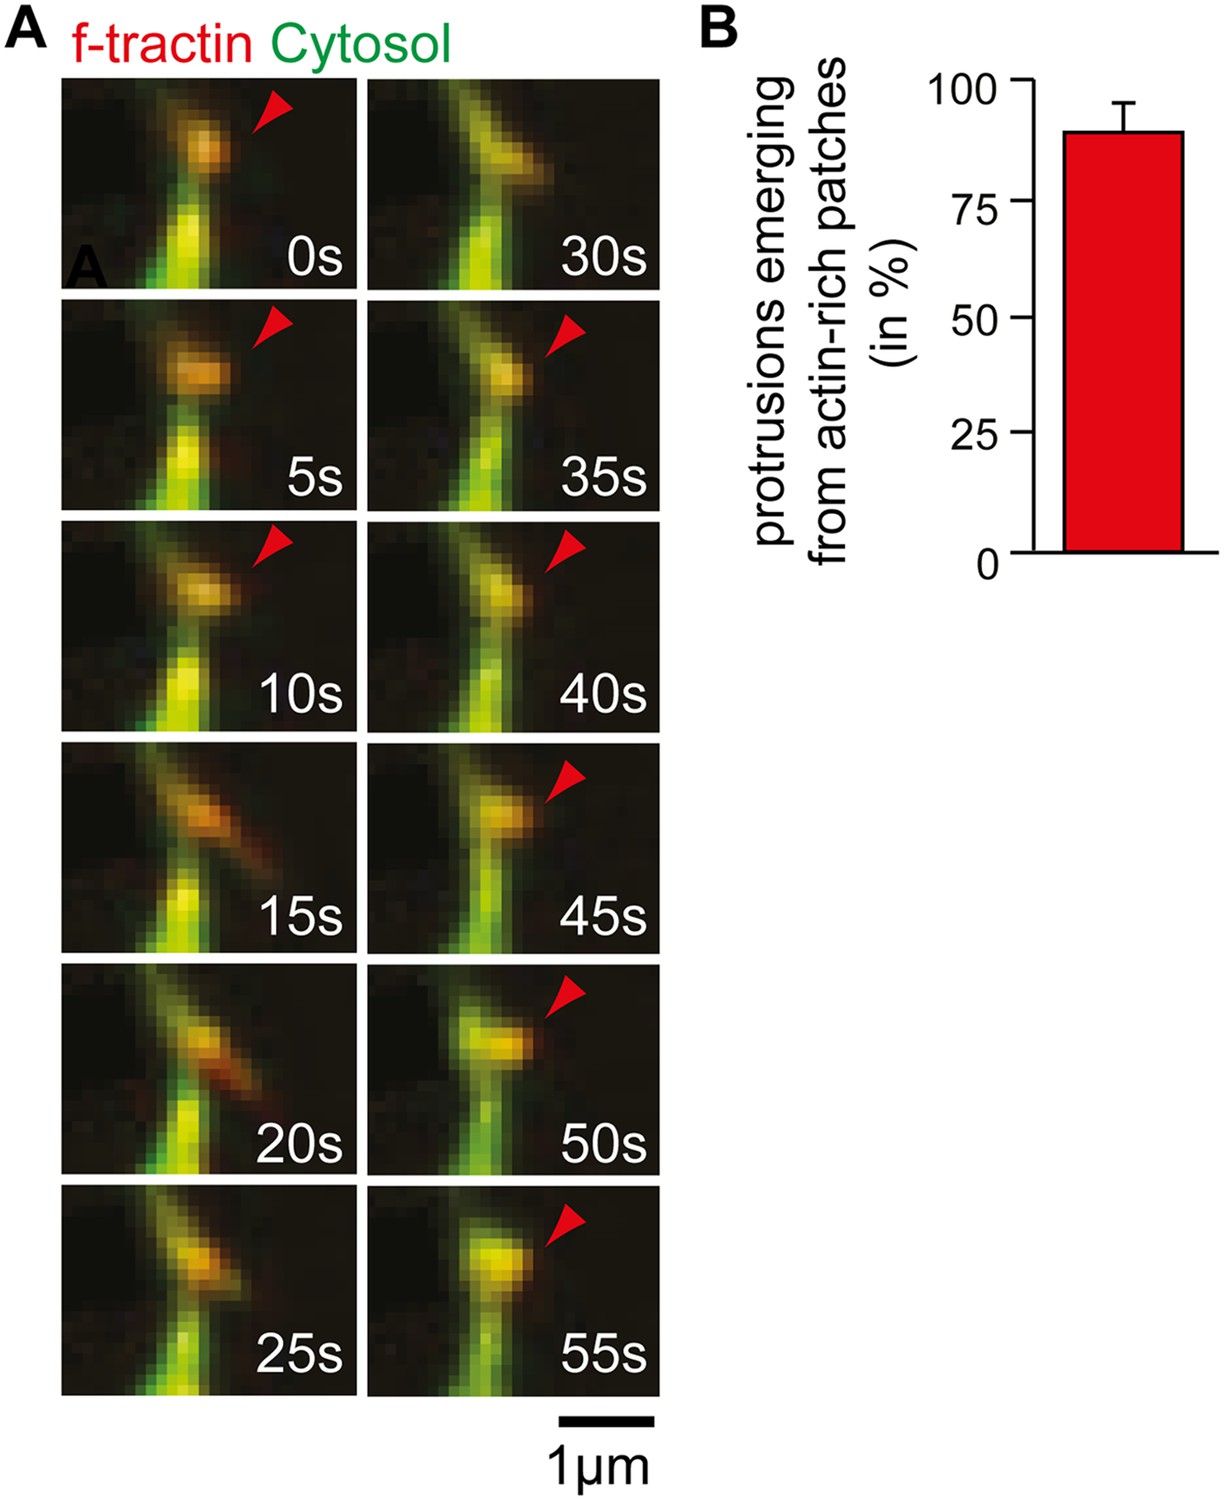
Time-lapse of exploratory dendritic filopodia emerging from actin patches.
(A) Neurons were transfected at DIV10 with the filamentous actin marker f-tractin (red) together with a cytosolic reference (green) and imaged 24 hr later. Red arrows indicate relative accumulation of f-tractin compared to a cytosolic reference at nodes that form before filopodia initiation and persist after filopodia collapse. (B) Filopodia emerge from pre-existing actin patches. Quantification using an acquisition interval of 15 s show that 89% ± 6% of filopodia emerge from actin patches (24 patches form 10 neurons; 3 independent experiments). Scale bar (A), 1 µm.
Figure 4—figure supplement 2
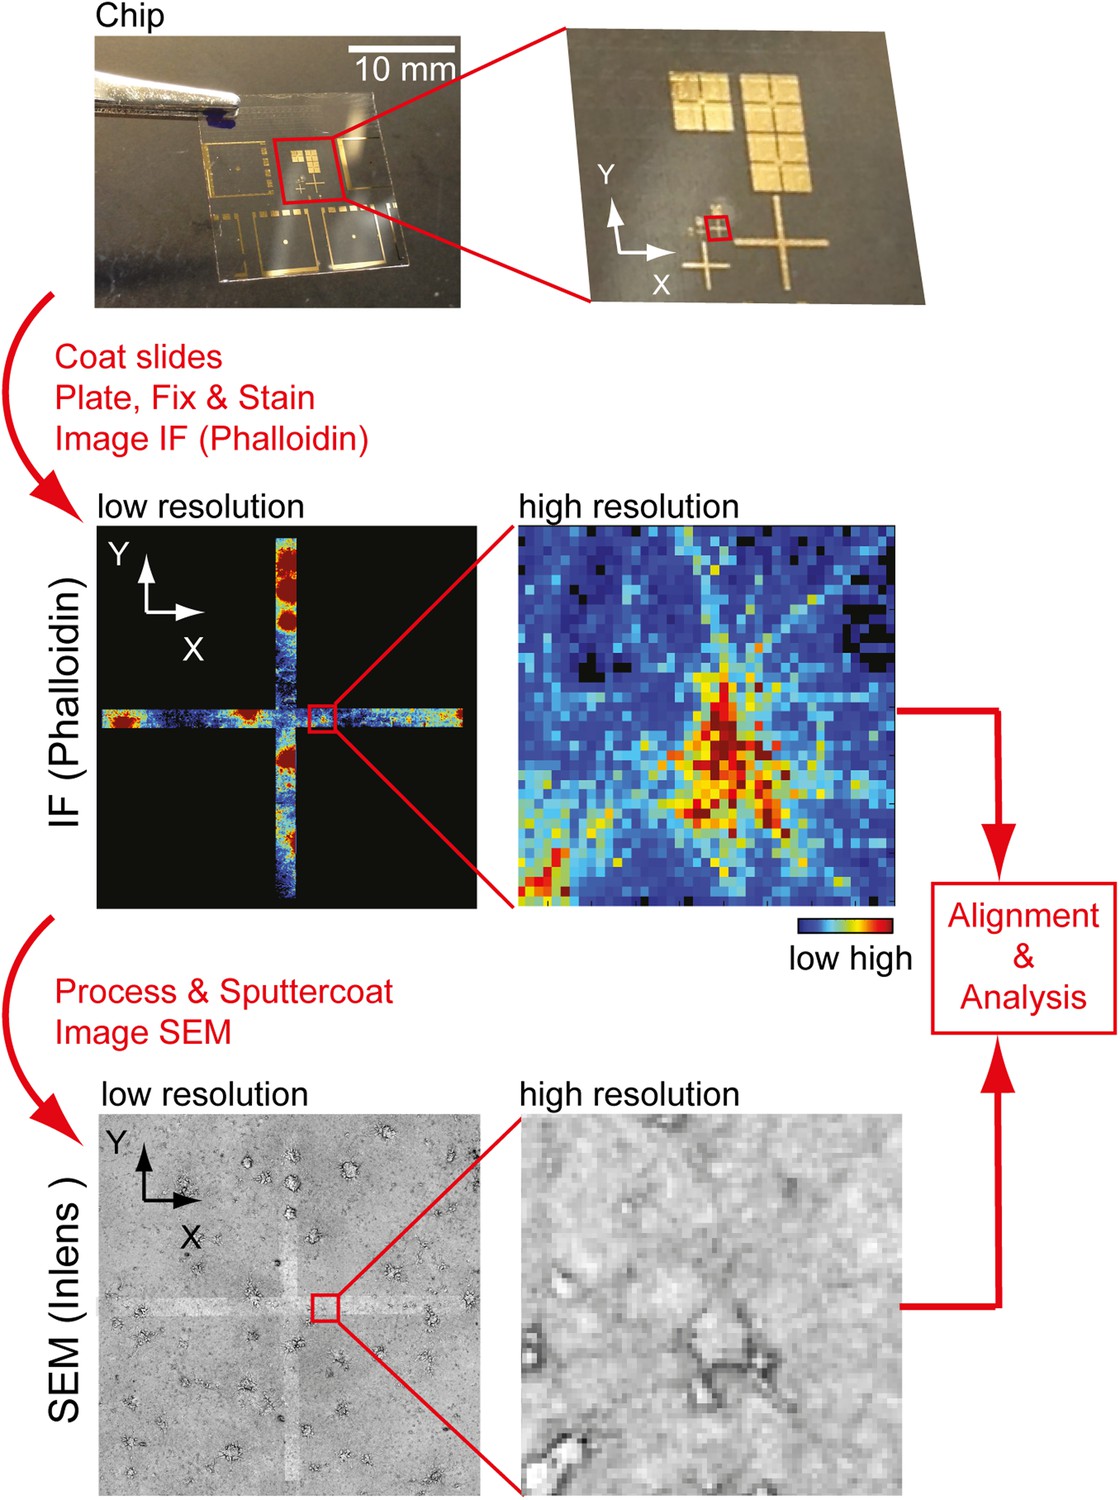
Workflow to identify individual neurons for correlative SEM/IF microscopy.
Example of pattern used for navigation on the glass slide is shown at the top. Gold deposit can be detected on the SEM using the back-scatter or inlens detector as well as in immunofluorescence. Scale bar, 10 mm.
Figure 4—figure supplement 3
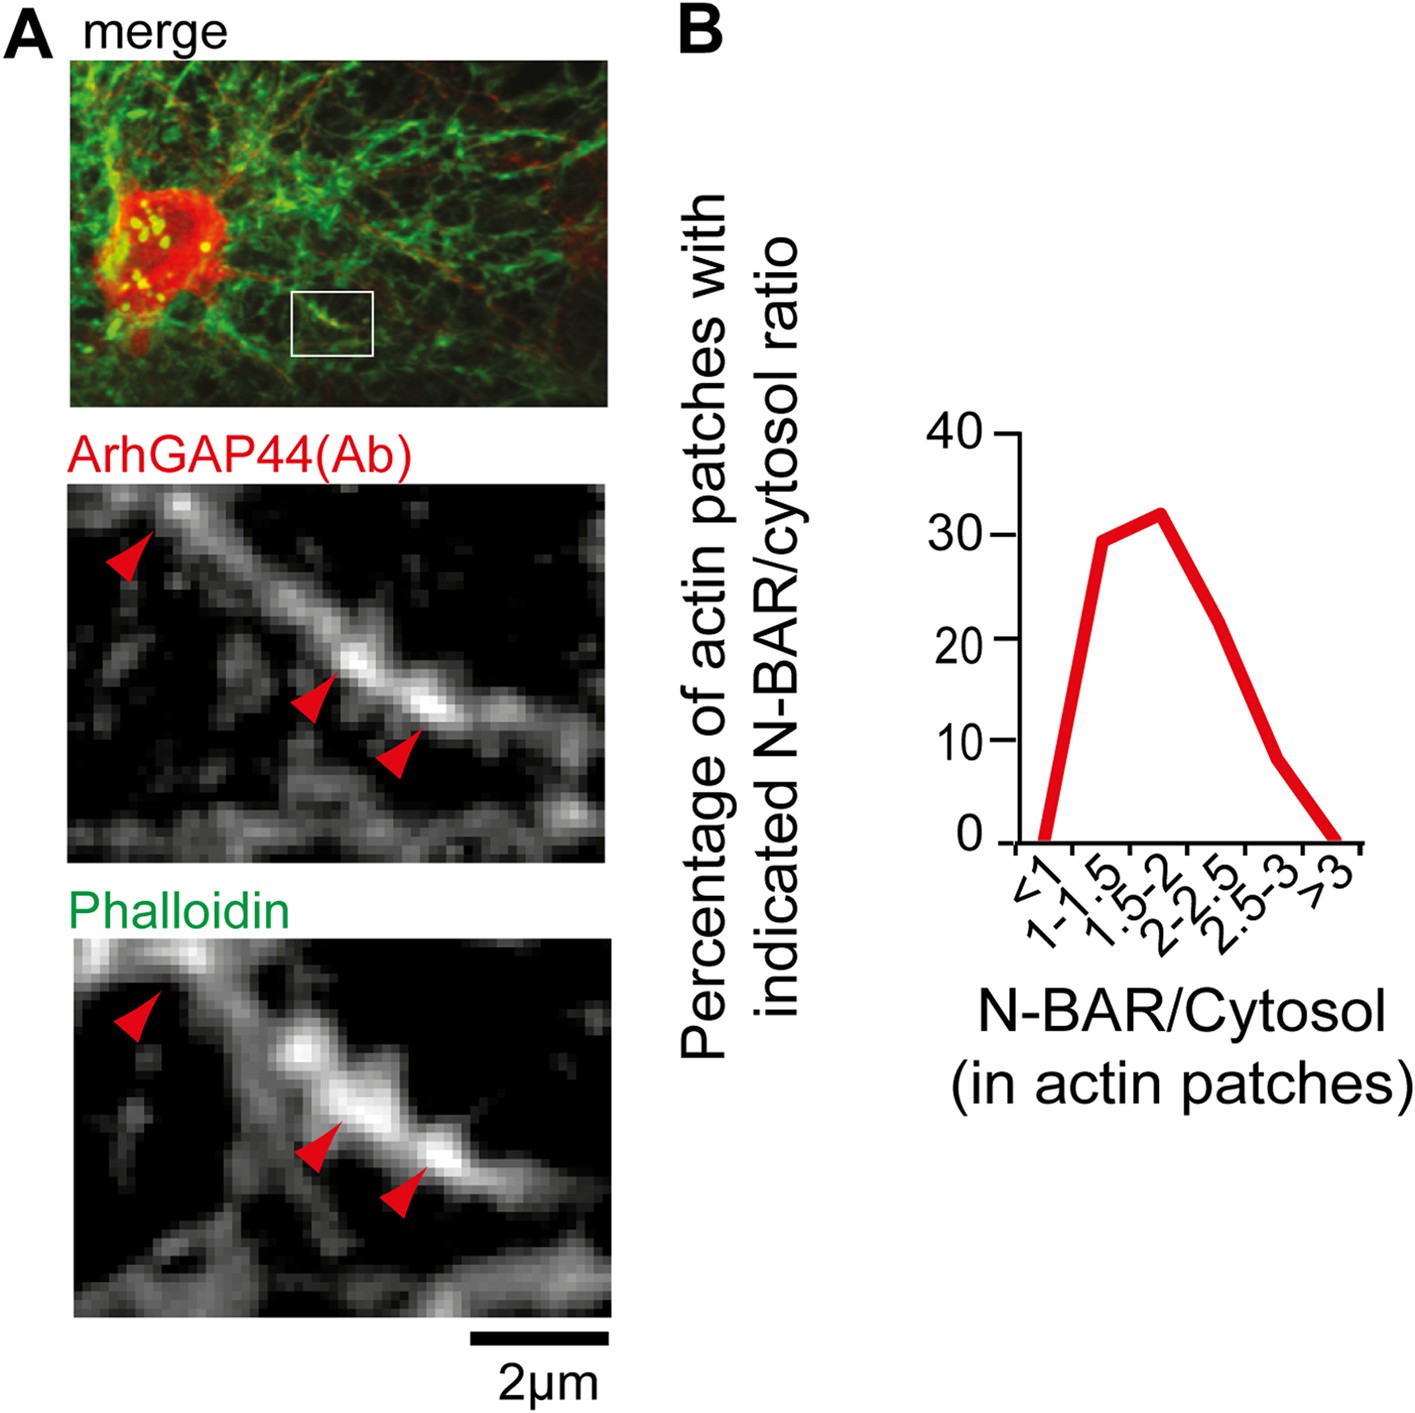
ArhGAP44 is enriched at actin patches.
(A) Neurons were fixed and stained with an antibody directed against ArhGAP44(red) and phalloidin (green). Note that the antibody directed against ArhGAP44 is enriched in phalloidin-rich patches. (B) The isolated N-BAR domain of ArhGAP44 is enriched in dendritic actin-patches. Neurons were transfected with the isolated N-BAR domain of ArhGAP44, a marker for filamentous actin (f-tractin) and a cytosolic reference. The average enrichment of the isolated N-BAR domain of ArhGAP44 over a cytosolic reference in dendritic actin patches is 80% ± 8% (34 patches form 25 neurons; 3 independent experiments). Scale bar, 2 µm.
Figure 5 with 7 supplements

Myosin dependent recruitment of the N-BAR domain of ArhGAP44 to actin patches.
(A) Inhibition of acto-myosin dependent forces decreases relative concentration of the N-BAR domain of ArhGAP44 in actin patches. Neurons were transfected with the N-BAR domain of ArhGAP44 (red), f-tractin (blue), and a cytosolic reference (green). Neuron is shown before (left panels) and after addition of the MLCK inhibitor ML-7 (right panels). (B) Cumulative distribution and average values of the relative intensity of the N-BAR domain of ArhGAP44 to a cytosolic reference in actin patches are shown before (black) and after (red) addition of CytoD (n = 49 patches; 12 cells, 3 independent experiments), LatA, (n = 27 patches; 10 cells, 3 independent experiments), ML-7 (n = 118 patches; 15 cells, 3 independent experiments), or the vehicle DMSO (n = 62 patches; 12 cells, 3 independent experiments). Scale bar, 5 µm.
Figure 5—figure supplement 1

Inhibition of actin polymerization decreases relative concentration of the N-BAR domain of ArhGAP44 but does not completely dissolve actin patches.
Neurons were transfected with the N-BAR domain of ArhGAP44 (red), f-tractin (blue), and a cytosolic reference (green), and imaged 24 hr later. Note that actin patches persist treatment with CytoD (red arrow). Scale bar, 5 µm.
Figure 5—figure supplement 2

ArhGAP44 is recruited to collapsing artificial lamellipodia in neurons.
(A) Rapamycin-induced dimerization assay. Neurons were quadruple-transfected with a membrane-anchored FRB, a fluorescently labeled FKBP that was associated with the Rac-GEF TIAM, a cytosolic reference, and the fluorescently labelled N-BAR domain of ArhGAP44. Addition of rapamycin triggered dimerization of FRB and FKBP, which led to a rapid translocation of TIAM to the plasma membrane. Enrichment of TIAM at the plasma membrane augmented local Rac activity and actin dynamics. (B) Neurons quadruple-transfected with the constructs before and after addition of rapamycin. Note the formation of ectopic actin-rich structures. (C) Time lapse images show enrichment of the N-BAR domain of ArhGAP44 at retracting actin-rich structures. Cells were quadruple-transfected with Lyn-FRB, CFP-FKBP-TIAM, YFP-ArhGAP44(N-BAR), and the empty mCherry plasmid as a cytosolic reference. Note the enrichment of the N-BAR domain of ArhGAP44 at the collapsing lamellipodia. (D) Kymograph of ArhGAP44(N-BAR) (top panel) and the cytosolic reference mCherry (middle panel) show relative enrichment of the N-BAR domain of ArhGAP44 at a retracting actin-rich structures (bottom panel). (B), 10 µm; (C), 2 µm.
Figure 5—figure supplement 3
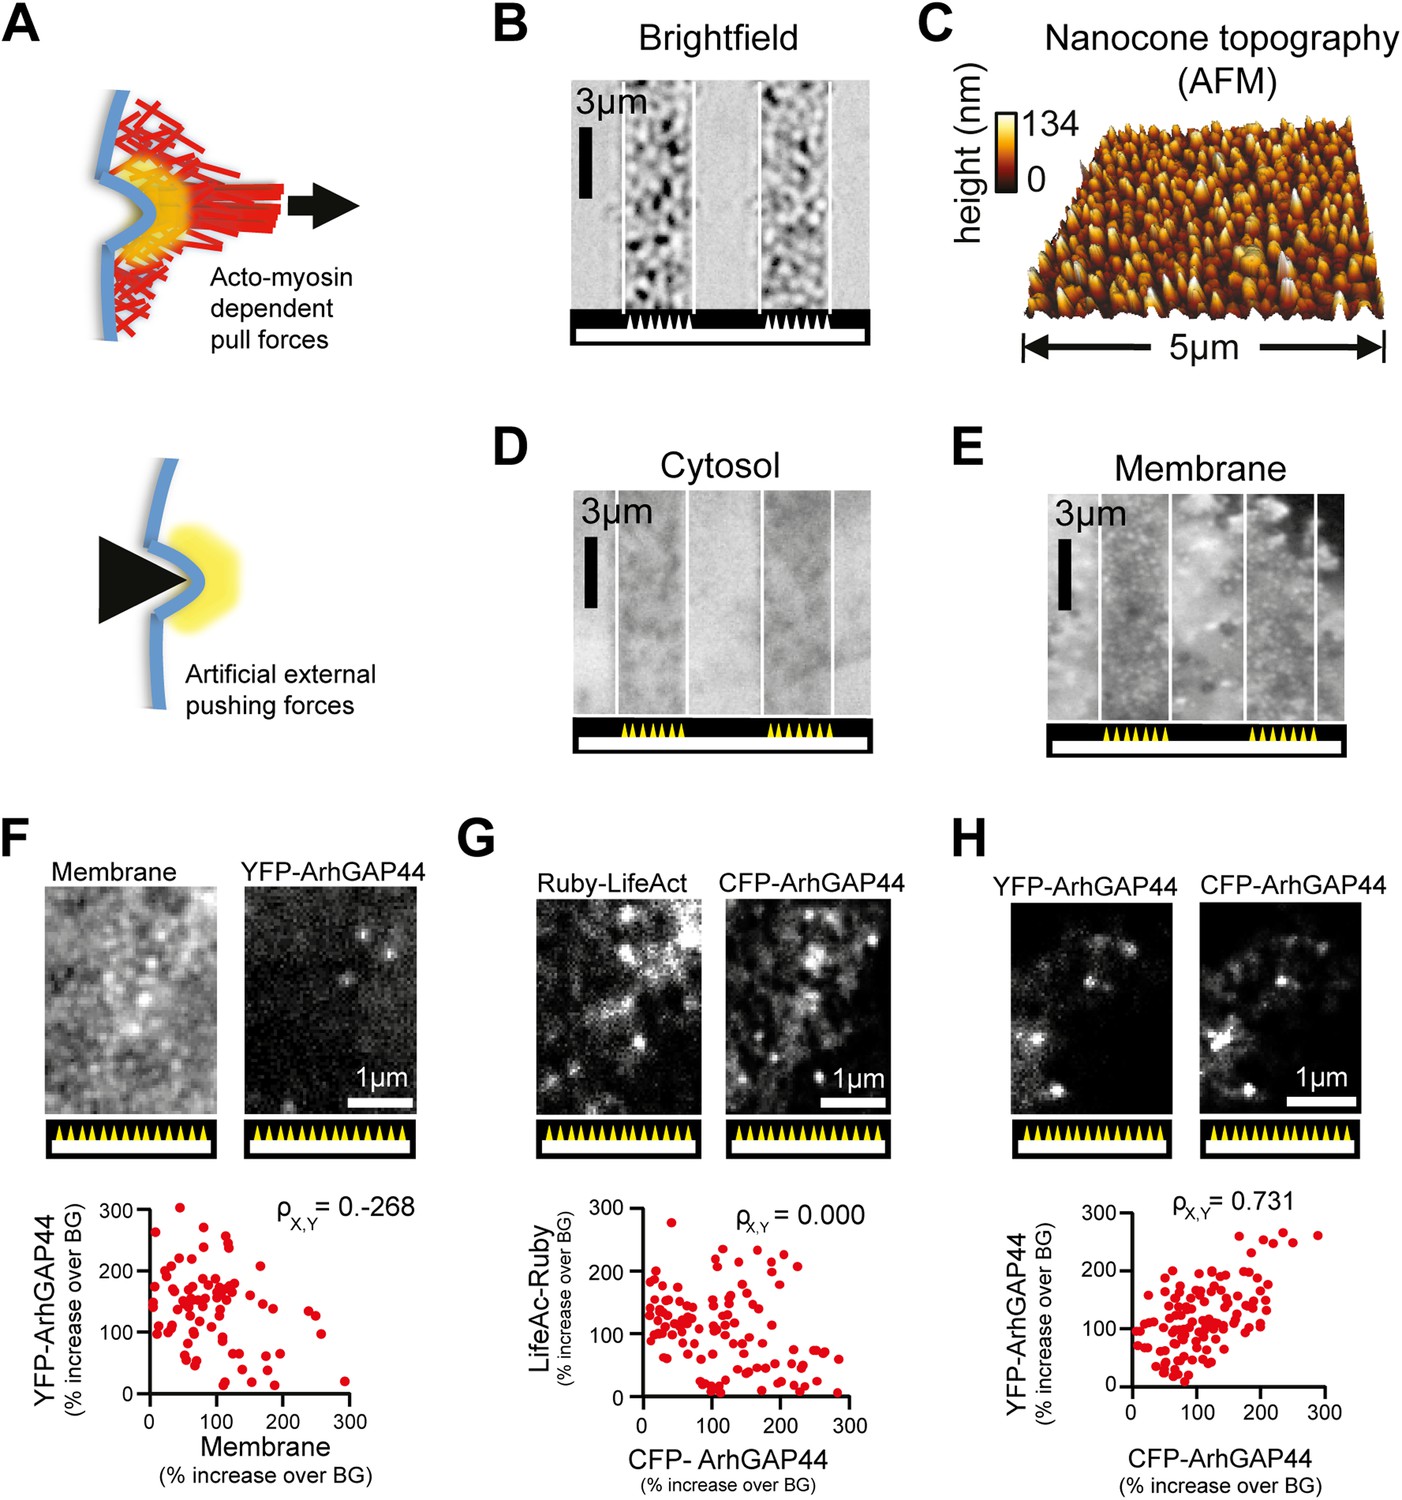
Artificial membrane deformations recruit ArhGAP44 to the plasma membrane.
(A) Inward membrane deformation by acto-myosin-dependent contraction of membrane-associated actin cables (top panel) is mimicked by artificially applied external forces via cone-shaped nanostructures (bottom panel). (B) Brightfield image of glass slide where cone-shaped nanostructures (i.e., nanocones) were deposited in 3-µm wide stripes. Nanocones are depicted as small triangular structures at the bottom of the image. (C) Atomic force microscope images of the surface of such cone-shapes nanostructures. (D and E) Control experiment showing cells cultured on stripes of nanocones transfected with a cytosolic marker (D) and with a membrane marker (E). (F) Control experiments testing for correlation between ArhGAP44(R291M) and membrane (CFP-CAAX) puncta over individual nanocones. Since positions and amplitudes of the respective puncta show low correlation, an increase in total membrane cannot account for the formation of YFP-ArhGAP44(R291M) puncta (G) Control experiments testing for a possible local actin polymerization induced by nanocones. Cells expressing the actin marker Ruby-LifeAct (left) together with CFP-ArhGAP44(R291M) (right) over nanocones. Individual LifeAct and ArhGAP44(R291M) puncta show no significant correlation. This is consistent with the hypothesis that nanocone-induced membrane deformation and not binding to local actin structures is responsible for the observed N-BAR translocation. (H) Control experiment testing for co-localization of ArhGAP44(R291M) with itself. Scale bars (B, D, E), 3 µm; (C), 5 µm; (F–H), 1 µm.
Figure 5—figure supplement 4

N-BAR domain of ArhGAP44 enriched at nanocone-induced dendritic plasma membrane deformations in neurons.
(A and B) The curvature-sensitive N-BAR domain of ArhGAP44 is enriched to nanocone-induced membrane deformation at the basal membrane. Neurons were cultured on a glass-slide patterned with nanocones and transfected with the isolated N-BAR domain of ArhGAP44. Note in (B) that puncta are present only on the dendritic stretch to the left that is in contact with nanocones but not in the section of the dendrite to the right that is not touching the nanomaterial. (C) Neurons cultured on a glass-slide patterned with stripes of nanocones and transfected with the isolated N-BAR domain of ArhGAP44. Quantification of N-BAR puncta on glass (black, n = 17 neurons, 2 independent experiments) and on nanocones (red, n = neurons, 2 independent experiments) is shown below. Scale bars (A and B), 10 µm; (C), 50 µm.
Figure 5—figure supplement 5
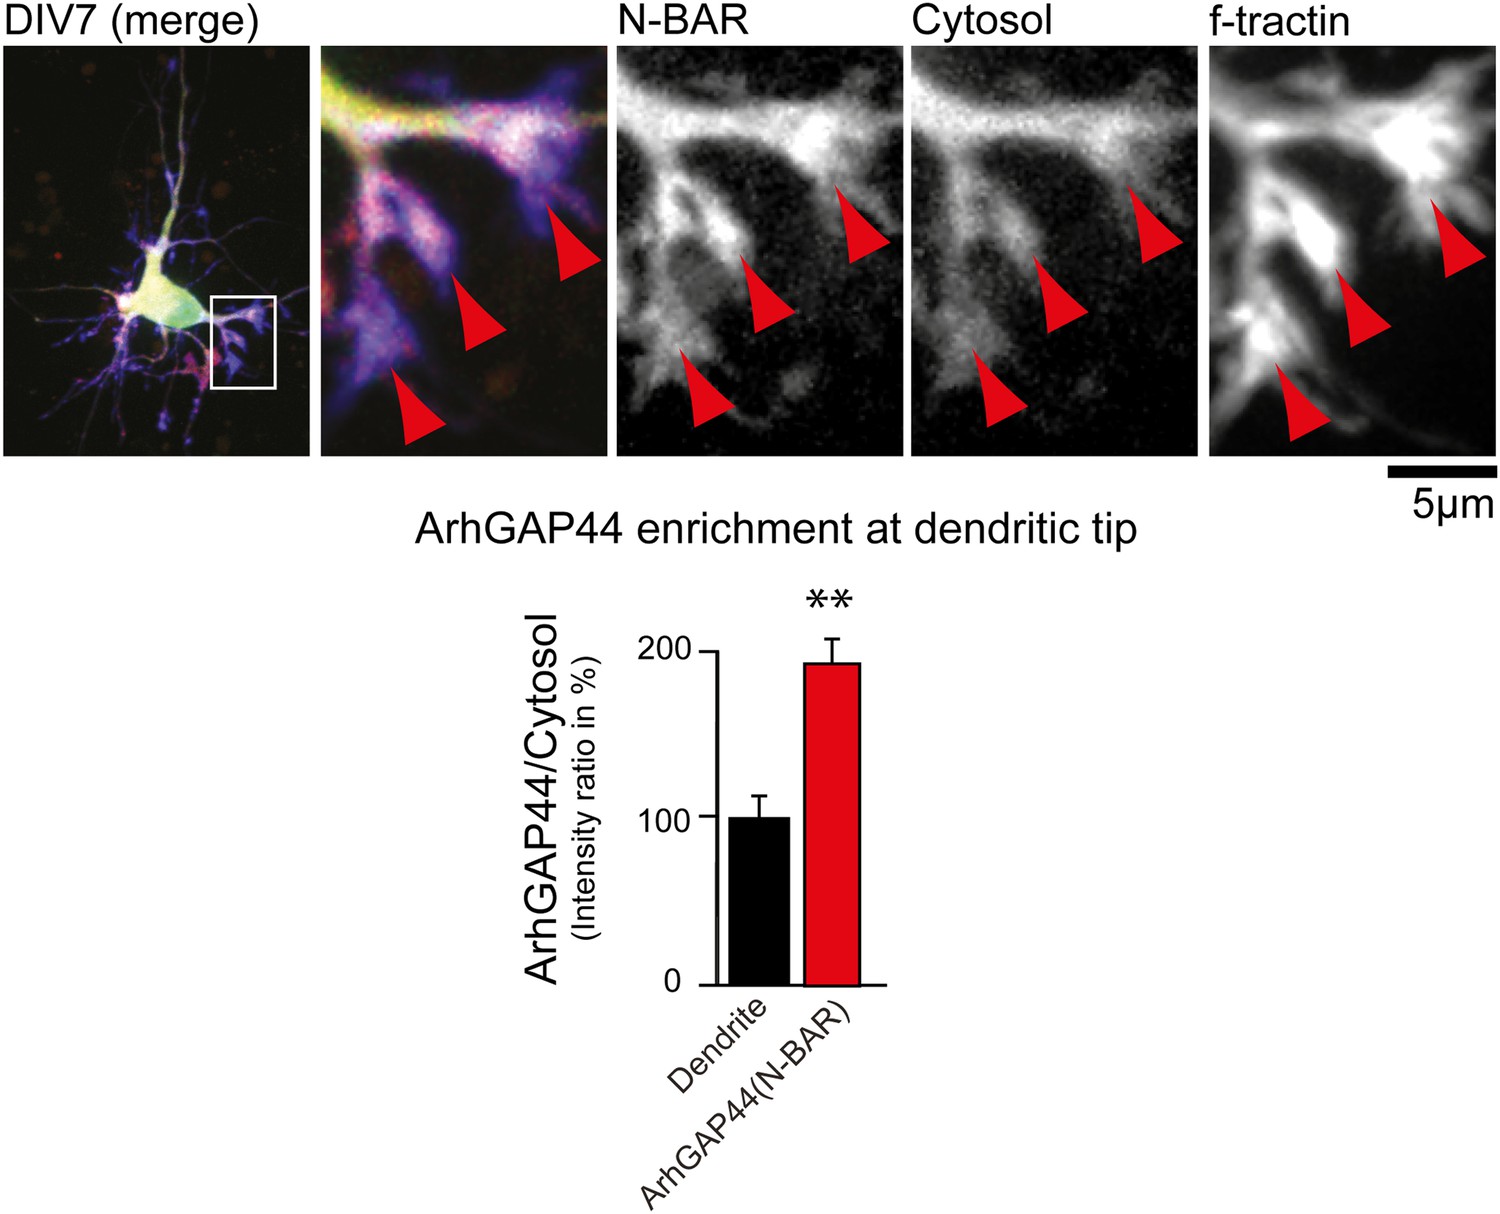
ArhGAP44 is enriched at dendritic tips.
Primary hippocampal neurons were transfected with a fluorescently tagged N-BAR domain of ArhGAP44 (red), a marker for filamentous actin (blue), and a cytosolic reference (green) at DIV6 and imaged 24 hr later. Red arrows depict dendritic tips. Quantification of fluorescence intensity show a relative enrichment of the isolated N-BAR domain over a cytosolic reference at actin-rich structures at the tip of dendrites (n = 14 dendritic tips from 10 neurons; 2 independent experiments). Scale bar, 5 µm.
Figure 5—figure supplement 6
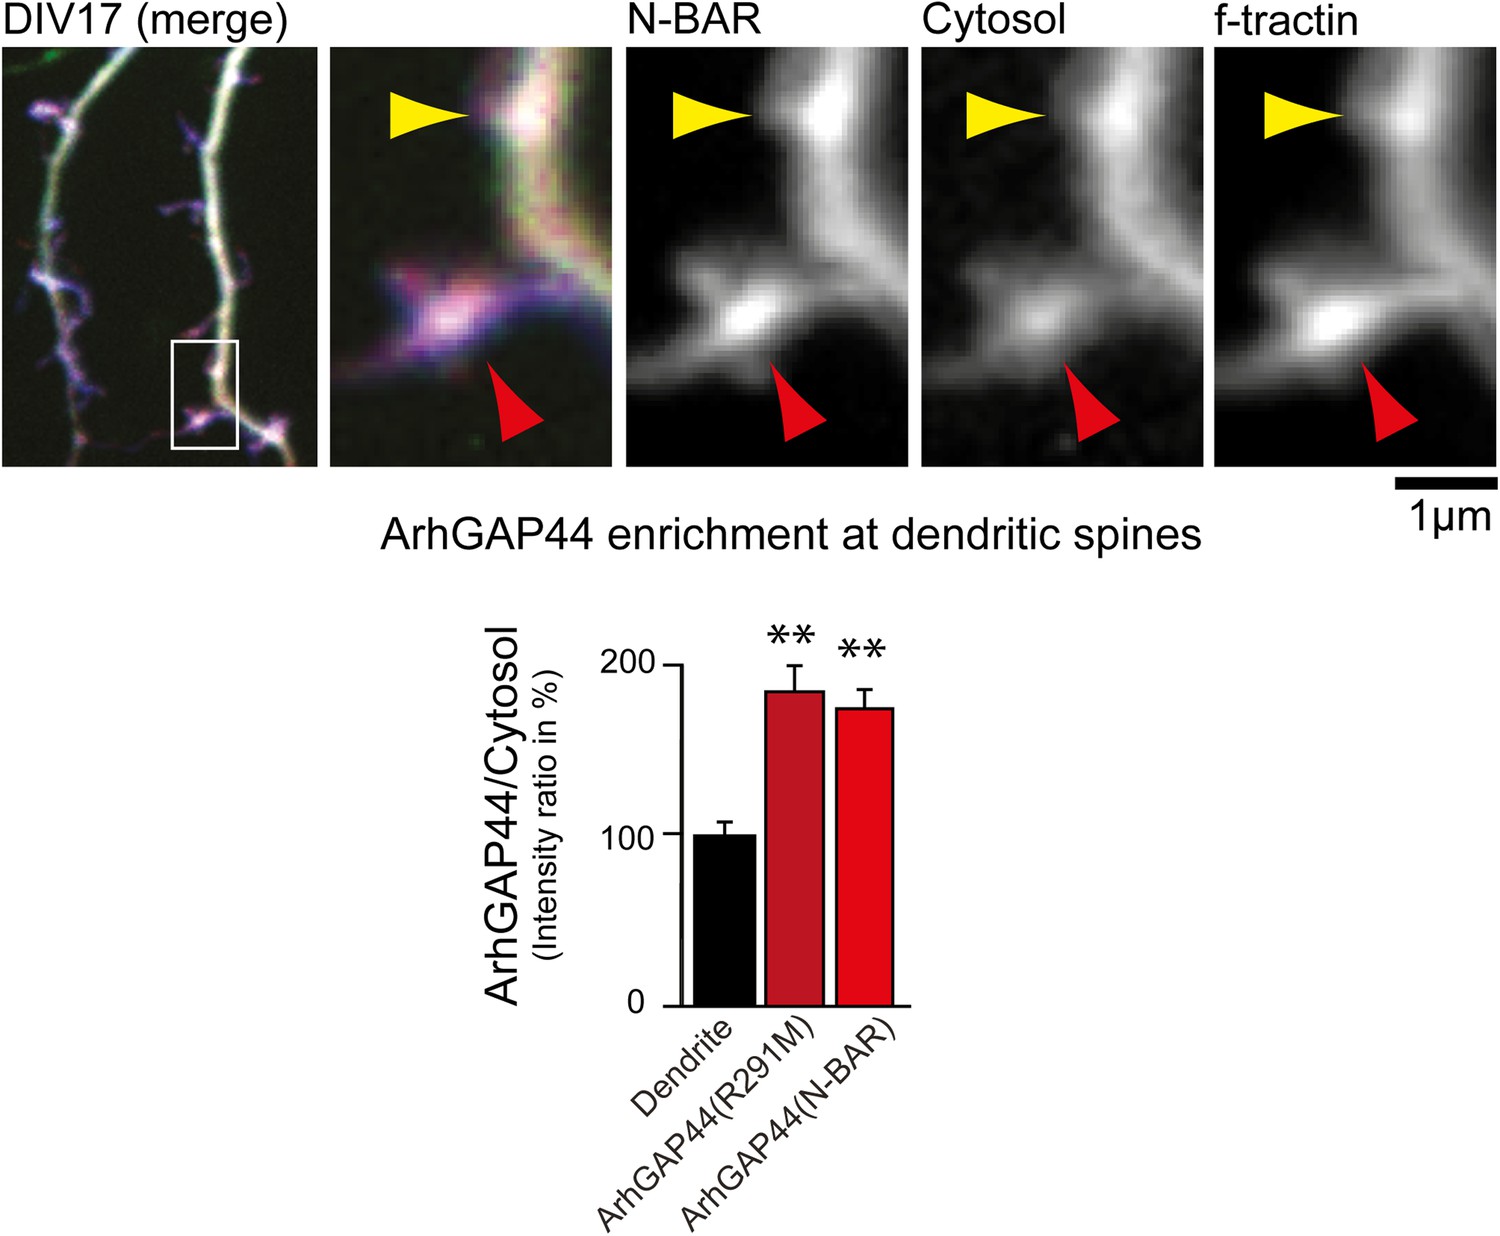
ArhGAP44 is enriched at dendritic spines.
Primary hippocampal neurons were transfected with fluorescently tagged ArhGAP44 (red), a marker for filamentous actin (blue), and a cytosolic reference (green) at DIV16 and imaged 24 hr later. Quantification of fluorescence intensity show a relative enrichment of the full-length ArhGAP44(R291M) (dark red) and for the isolated N-BAR domain of ArhGAP44 (red) over a cytosolic reference at spine-shaped, actin-rich dendritic structures (n = 21 structures form 13 neurons for ArhGAP44(R291) and 24 structures from 12 neurons for the N-BAR domain of ArhGAP44; both from 2 independent experiments). Scale bar, 1 µm.
Figure 5—figure supplement 7
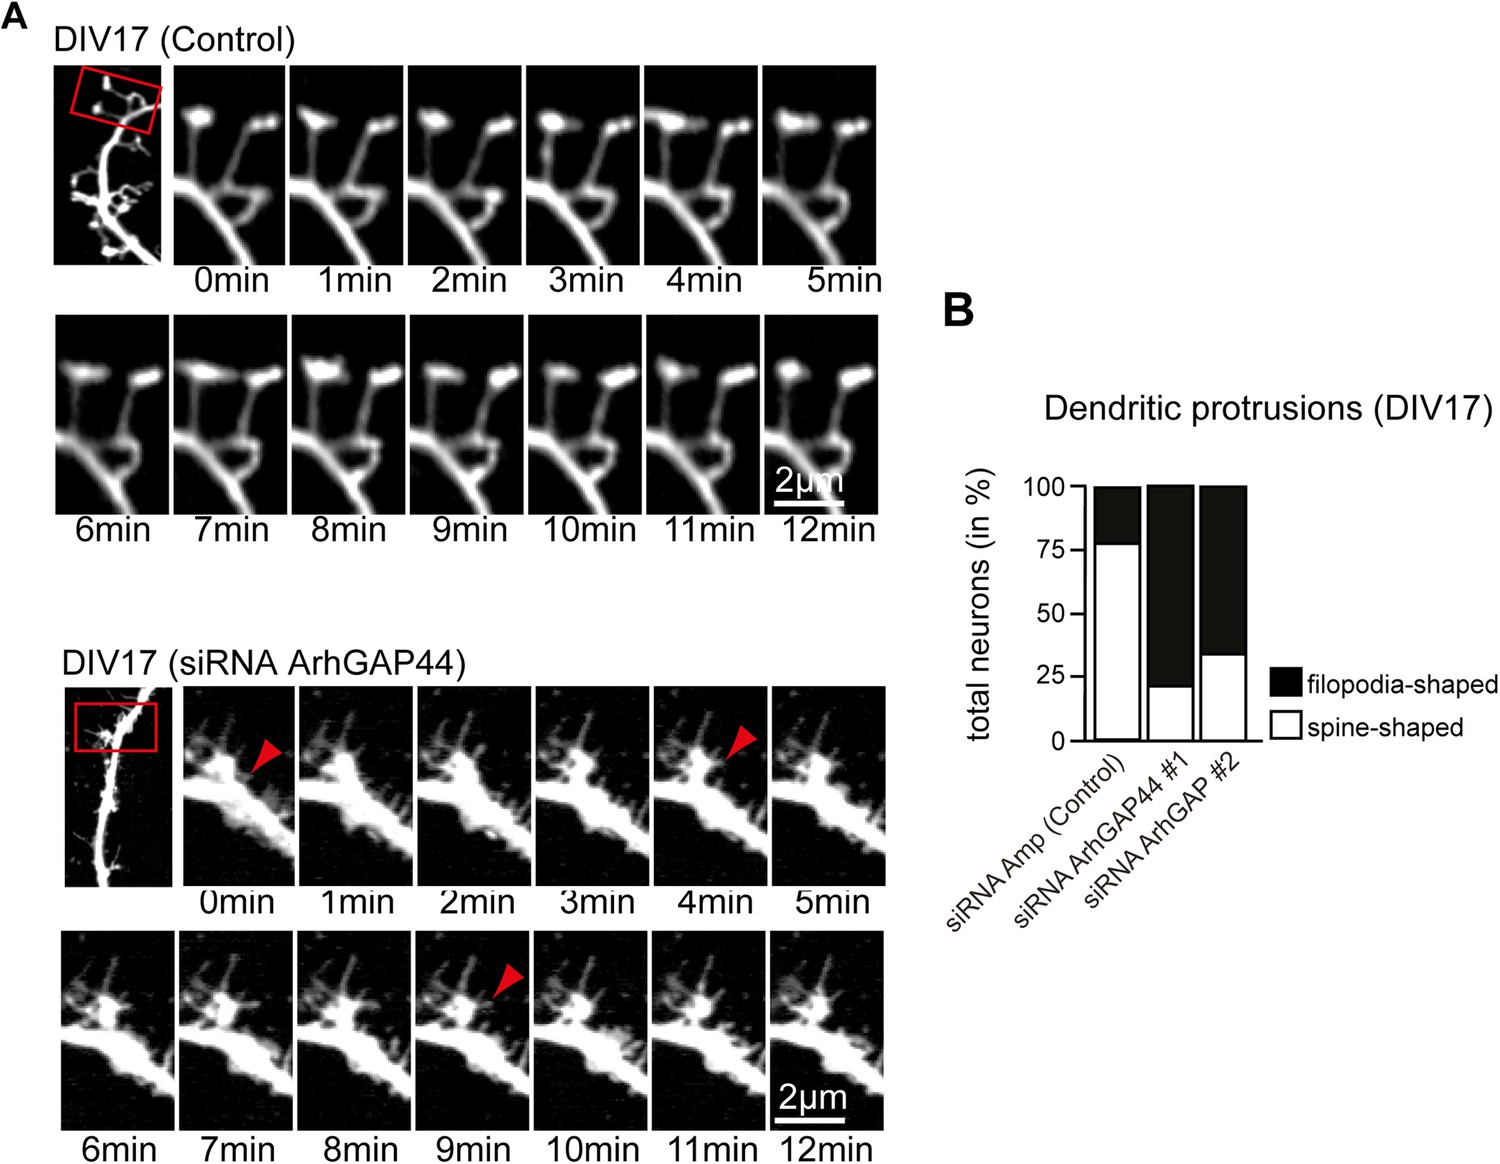
Knockdown of ArhGAP44 alters protrusion morphology and dynamics in aged neurons.
(A) Increased filopodia dynamics after knockdown of ArhGAP44. Primary hippocampal neurons were transfected at DIV14 with diced RNA directed against ArhGAP44 (or a control) and a fluorescence marker and imaged 72 hr later. Note the increase in node and filopodia formation (red arrows) upon knockdown of ArhGAP44. (B) Reduction of spine-shaped protrusions upon knockdown of ArhGAP44 (n = control, 18 neurons; siRNA ArhGAP44 (diced pool #1), 20 neurons; siRNA ArhGAP44 (diced pool #2), 23 neurons; both from 2 independent experiments). Scale bar, 2 µm.
Figure 6 with 1 supplement
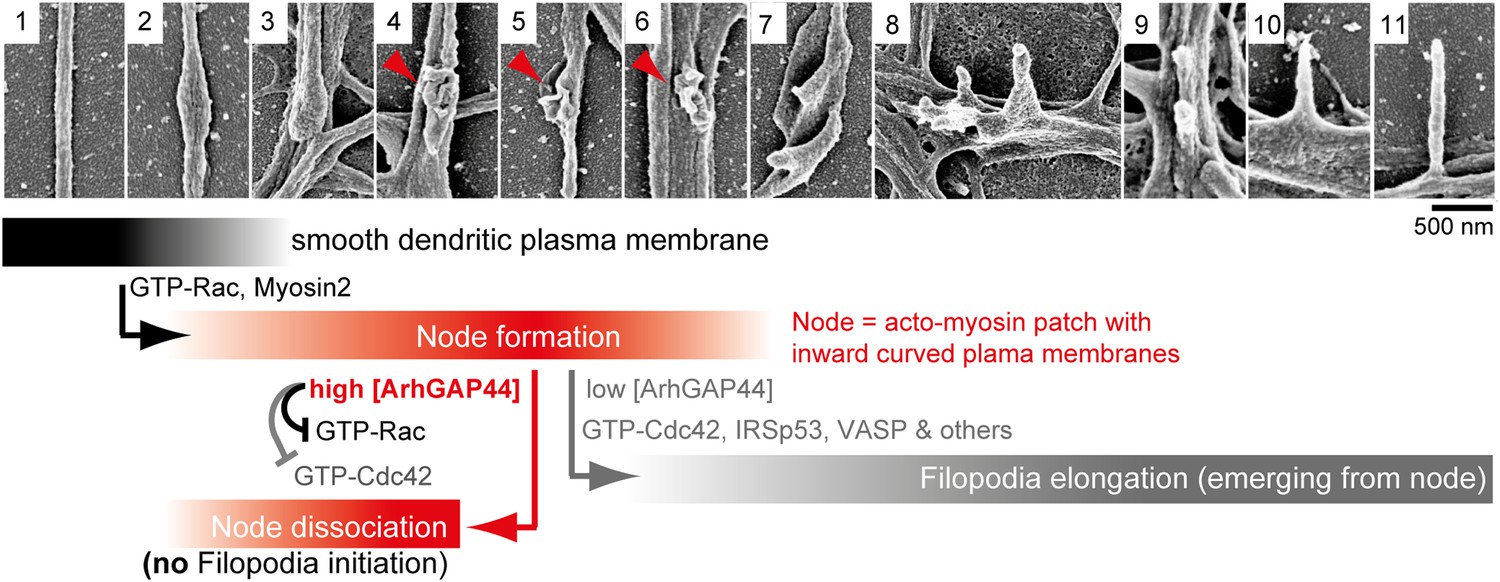
Proposed model of ArhGAP44-dependent regulation of exploratory dendritic filopodia initiation.
Scanning electron micrographs of dendritic protrusions with and without filopodial protrusions aligned in a hypothetical time-line. Proposed model that myosin-dependent contractions in actin patches triggers local plasma membrane indentations (i.e., node formation) with curved membranes to which ArhGAP44 is recruited (frame 4–6, red). Increased local ArhGAP44 concentration limits Rac1-dependent actin polymerization and weakens or dissociates the node. Low ArhGAP44 concentration at nodes allows filopodia initiation that relies on Cdc42 and other factors (frame 7–11, gray). Scale bar, 500 nm.
Figure 6—figure supplement 1
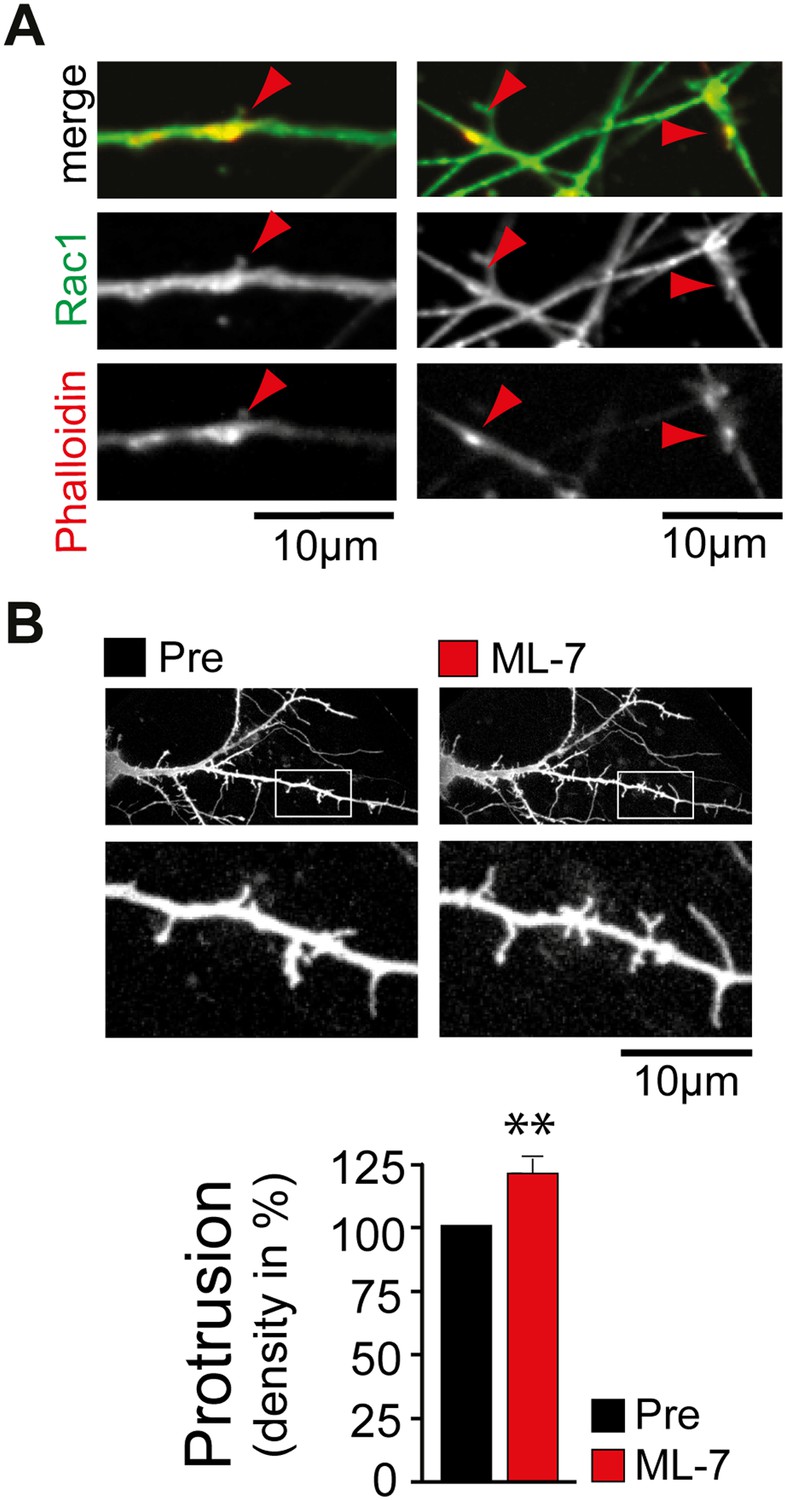
Control experiments supporting the proposed model.
(A) Rac1 is enriched in dendritic actin patches. Neurons were fixed at DIV12 and stained with an antibody directed against Rac1 (green) and phalloidin (red). (B) Inhibition of myosin light chain kinase increases filopodia density. Filopodia density on neurons was measured before (black) and 120 min after (red) the addition of the MLCK inhibitor ML-7 (n = 21 neurons, 3 independent experiments). Scale bars (A and B), 10 µm.
Videos
Video 1
Example of a stable dendritic protrusion.
Neuron was transfected with a fluorescence marker at DIV11 and imaged 24 hr later. Individual frames were taken every 60 s. Scale bar is 2 μm. Video is 720× real-time.
Video 2
ArhGAP44(R291M) transfection causes increased dendritic node and reduced protrusion formation.
Neuron was transfected with ArhGAP44(R291M) at DIV11 and imaged 24 hr later. Individual frames were taken every 60 s. Scale bar is 2 μm. Video is 360× real-time.
Video 3
Knockdown of ArhGAP44 increases dendritic node and protrusion formation.
Neuron was co-transfected with diced RNA directed against ArhGAP44 and a cytosolic reference at DIV7 and imaged at DIV12. Individual frames were taken every 60 s. Scale bar is 2 μm. Video is 360× real-time.
Video 4
Knockdown of ArhGAP44 increases dendritic node formation.
Neuron was co-transfected with diced RNA directed against ArhGAP44 and a cytosolic reference at DIV7 and imaged at DIV12. Individual frames were taken every 60 s. Scale bar is 2 μm. Video is 360× real-time.
Video 5
Example of dendritic node formation.
Neuron was transfected with a fluorescence marker at DIV11 and imaged 24hr later. Individual frames were taken every 60 s. Scale bar is 2 μm. Video is 360× real-time.
Video 6
Knockdown of ArhGAP44 triggers formation of protrusion from dendritic nodes.
Neuron was co-transfected with RNA directed against ArhGAP44 and a cytosolic reference at DIV7 and imaged at DIV12. Individual frames were taken every 60 s. Scale bar is 2 μm. Video is 360× real-time.
Video 7
Rac1 overexpression causes abnormal dendritic node and protrusion formation.
Neuron was transfected with Rac1(wt) at DIV11 and imaged 24 hr later. Individual frames were taken every 60 s. Scale bar is 2 μm. Video is 360× real-time.
Video 8
Rac1 overexpression causes abnormal dendritic node and protrusion formation.
Neuron was transfected with Rac1(wt) at DIV11 and imaged 24 hr later. Individual frames were taken every 60 s. Scale bar is 2 μm. Video is 360× real-time.
Video 9
Cdc42 overexpression causes abnormal dendritic protrusion formation.
Neuron was transfected with Cdc42(wt) at DIV11 and imaged 24 hr later. Note the elongation of a preexisting dendritic protrusion. Individual frames were taken every 60 s. Scale bar is 2 μm. Video is 360× real-time.
Video 10
Cdc42 overexpression causes abnormal dendritic protrusion formation.
Neuron was transfected with Cdc42(wt) at DIV11 and imaged 24 hr later. Note the elongated filopodia emerging from the dendrite. Individual frames were taken every 60 s. Scale bar is 2 μm. Video is 360× real-time.
Video 11
Rac1 synthetically rescues ArhGAP44(R291M)-dependent reduction in protrusion formation.
Neuron was co-transfected with Rac1(wt) and ArhGAP44(R291M) at DIV11 and imaged 24 hr later. Individual frames were taken every 60 s. Scale bar is 2 μm. Video is 360× real-time.
Video 12
Actin enriches at patches that precede exploratory filopodia initiation.
Neurons were transfected with a marker for filamentous actin (f-tractin, red) and a cytosolic reference (green). Note the formation of actin patches prior to filopodia formation (white boxes). Individual frames were taken every 5 s. Video is 50× real-time.
Video 13
Enrichment of the N-BAR domain of ArhGAP44 at retracting actin-rich structures in neurons.
Neuron was transfected with Lyn-FRB, CFP-FKBP-Tiam1 (blue), the N-BAR domain of ArhGAP44 (red), and a cytosolic reference (green) at DIV11. Images show formation and retraction of artificial lamelipodia-like structures that formed along the dendritic shaft upon rapamycin-triggered recruitment of the Rac GEF Tiam1 to the plasma membrane. Individual frames were taken every 15 s. Scale bar is 2 μm. Video is 120× real-time.
Video 14
Enrichment of the N-BAR domain of ArhGAP44 at basal membrane sections indented by nanocones.
3D rotation of neuron plated on nanocone-coated glass slide and transfected with the N-BAR domain of ArhGAP44. Note the punctate enrichment at the basal membrane below the soma. Scale bar is 10 μm.
Video 15
Enrichment of the N-BAR domain of ArhGAP44 at the dendritic section that is in contact with nanocones.
3D rotation of neuron plated on nanocone-coated glass slide and transfected with the N-BAR domain of ArhGAP44. Note the punctate enrichment at the top where the dendrite is touching the nanocone surface. Scale bar is 10 μm.
Tables
Table 1
Reference genes expressed predominantly in the adult brain or in the spinal cord
| Gene | Adult brain | Spinal cord | Ratio | Reference |
|---|---|---|---|---|
| PMP22* | 720.55 | 2516.35 | 0.286347 | (Snipes et al., 1992) |
| MPZ* | 5.5 | 181.5 | 0.030303 | (Su et al., 1993) |
| BSN† | 56.7 | 3.45 | 16.43478 | (tom Dieck et al., 1998) |
| GRIA2† | 355.1 | 11.55 | 30.74459 | (Martin et al., 1993) |
-
*
enriched in the spinal cord.
-
†
enriched in the adult brain.
Table 2
Reference genes expressed predominantly in the adult or in the fetal brain
| Gene | Adult brain | Fetal brain | Ratio | Reference |
|---|---|---|---|---|
| RELN* | 34.85 | 93.35 | 0.373326 | (D'Arcangelo et al., 1995) |
| DCX* | 10.55 | 2577 | 0.004094 | (des Portes et al., 1998) |
| NRXN1* | 72.1 | 143.15 | 0.503667 | (Ushkaryov et al., 1992) |
| NLGN1* | 7.5 | 24.7 | 0.303644 | (Ichtchenko et al., 1995) |
| CAMK2B† | 818.15 | 321.25 | 2.54677 | (Omkumar et al., 1996) |
| MUNC13† | 26.3 | 9.75 | 2.697436 | (Betz et al., 1998) |
| MECP2† | 818.15 | 321.25 | 2.54677 | (Amir et al., 1999) |
| PSD95† | 362.1 | 12.7 | 28.51181 | (Kornau et al., 1995) |
| PACSIN1† | 90.8 | 20.1 | 4.517413 | (Qualmann et al., 1999) |
-
*
enriched in the fetal brain.
-
†
enriched in the adult brain.
Additional files
-
Supplementary file 1
Names and relative expression levels of 286 putative actin regulators. List depicting the expression levels of genes identified in the NCBI search in various tissues of the Human U133A/GNF1H Gene Atlas data set (gnf1h-gcrma unaveraged). Note that values are log-transformed.
- https://doi.org/10.7554/eLife.03116.050
Download links
A two-part list of links to download the article, or parts of the article, in various formats.
Downloads (link to download the article as PDF)
Open citations (links to open the citations from this article in various online reference manager services)
Cite this article (links to download the citations from this article in formats compatible with various reference manager tools)
Dynamic recruitment of the curvature-sensitive protein ArhGAP44 to nanoscale membrane deformations limits exploratory filopodia initiation in neurons
eLife 3:e03116.
https://doi.org/10.7554/eLife.03116


