Serum amyloid A is a retinol binding protein that transports retinol during bacterial infection
- University of Texas Southwestern Medical Center, United States
- New York University School of Medicine, United States
- Howard Hughes Medical Institute, University of Texas Southwestern Medical Center, United States
Figures
Figure 1 with 2 supplements
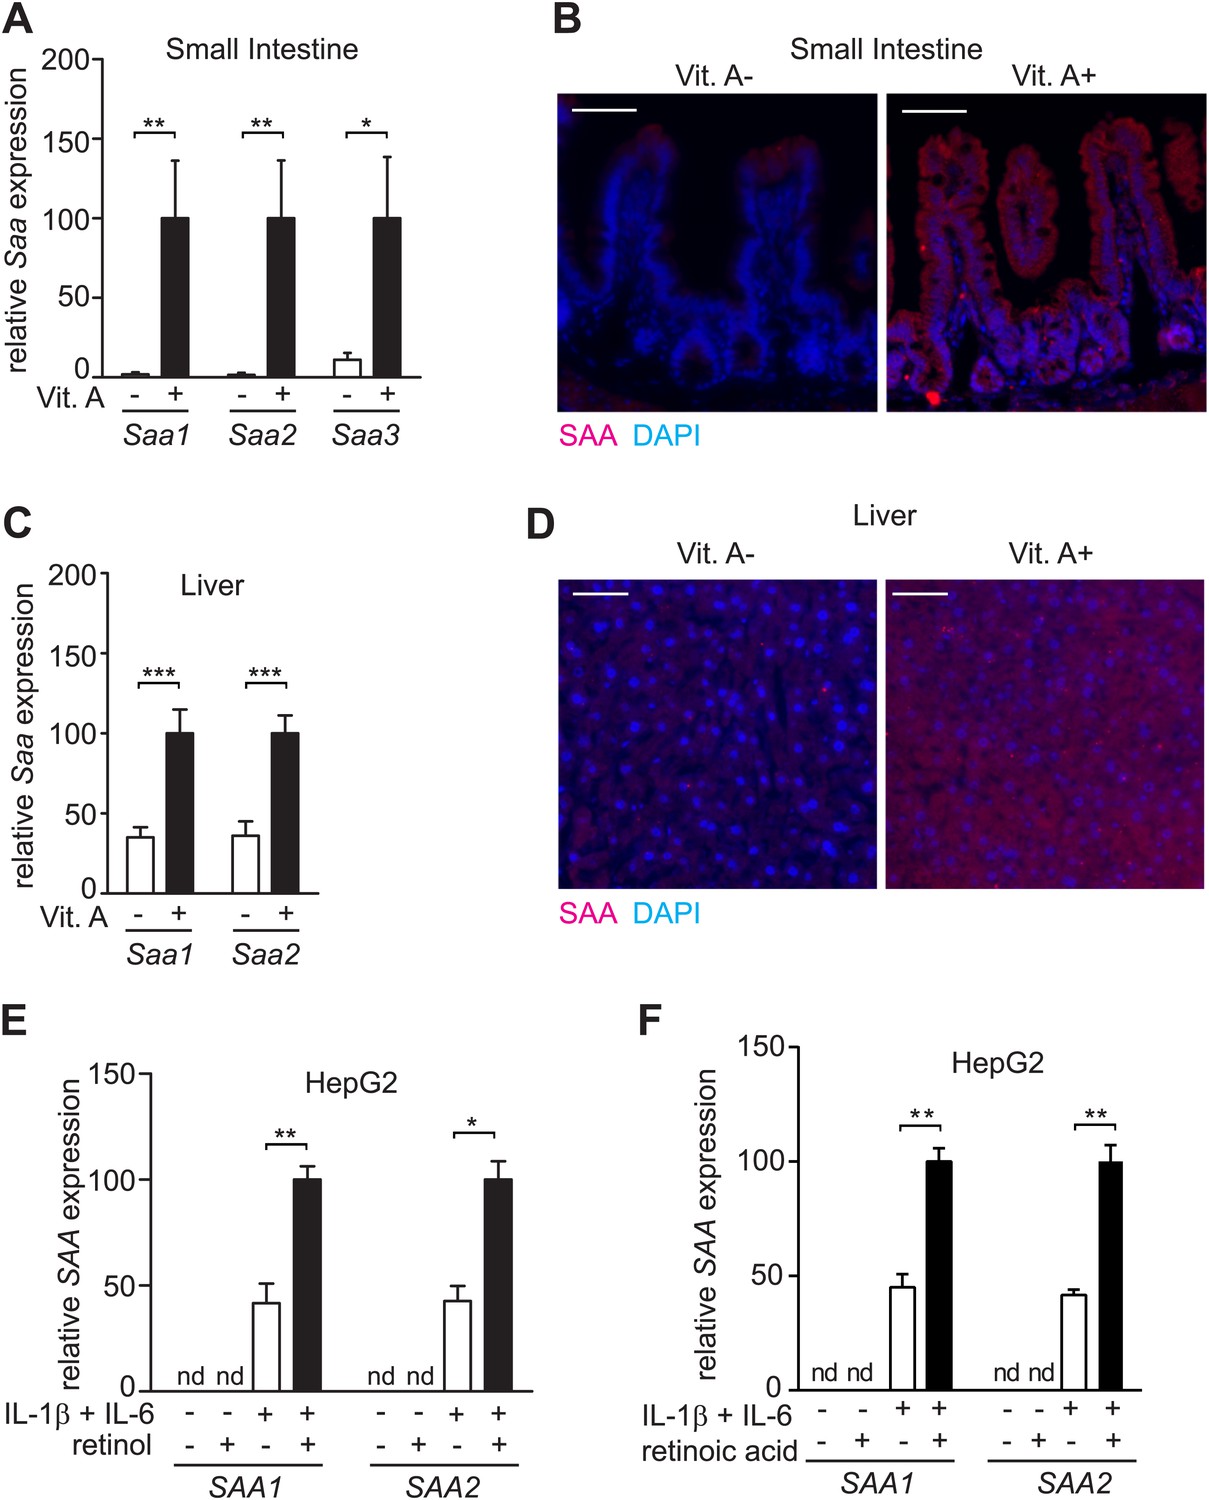
SAA expression requires dietary vitamin A.
(A) Mice were maintained on a normal (Vit. A+) diet or a vitamin A-deficient (Vit. A−) diet as in Figure 1—figure supplement 1. Ileal Saa expression was quantified by Q-PCR (primer sequences are given in Table 1). N = 3–5 mice per condition. (B) Ileal sections were stained with anti-SAA antibody (‘Materials and methods’) and anti-rabbit IgG-Cy3 (red), and counterstained with DAPI (blue). Scale bar = 50 µm. (C) Q-PCR determination of Saa expression levels in livers of mice on a normal or vitamin A-deficient diet. N = 5 mice/condition. (D) Liver sections were stained with anti-SAA antibody and anti-rabbit IgG-Cy3 (red), and counterstained with DAPI (blue). Scale bars = 50 µm. (E and F) Analysis of SAA expression in HepG2 cells. Cells were cultured in retinoid-free medium and then treated with IL-1β and IL-6 and/or 1 μM retinol (E) or 100 nM retinoic acid (F). SAA expression was determined by Q-PCR. N = 3 independent experiments. Mean ± SEM is plotted. nd, not detected. *p < 0.05; **p < 0.01; ***p < 0.001. p values were determined by two-tailed Student's t test.
Figure 1—figure supplement 1
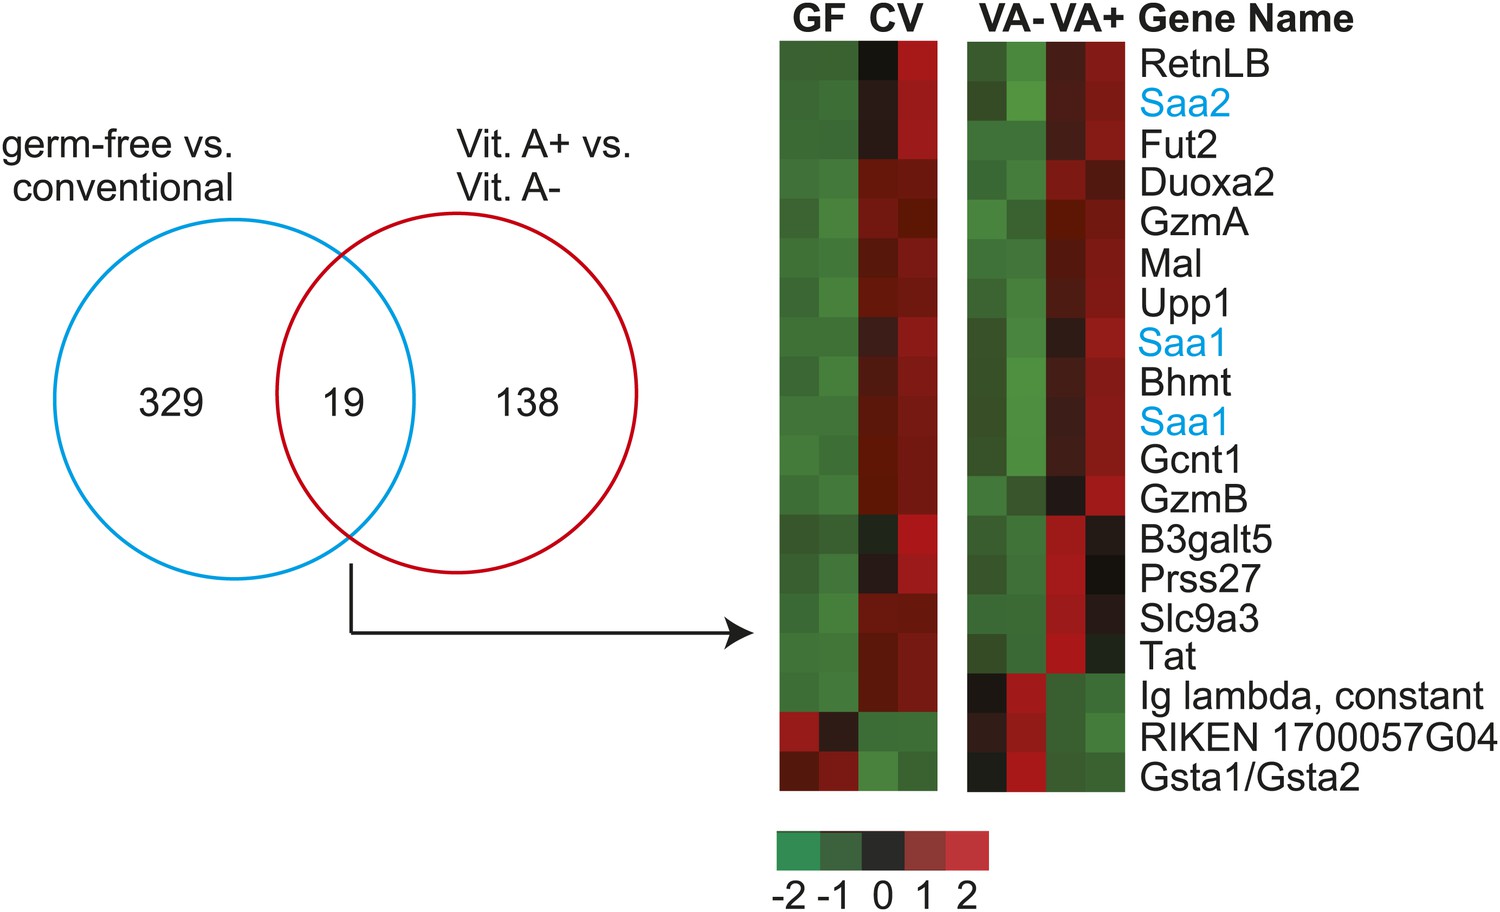
Intestinal Saa1 and Saa2 are differentially regulated by dietary vitamin A.
Affymetrix Mouse Genome 430 2.0 arrays were used to compare transcript abundance in small intestines from germ-free (gf) and conventional (cv) mice, and from mice fed a normal diet vs a vitamin A-deficient diet. Differentially expressed transcripts were identified as outlined in ‘Materials and methods’, revealing 329 differentially-expressed genes between the germ-free and conventional groups, and 138 differentially-expressed genes between the vitamin A+ and vitamin A− groups. A Venn diagram representation of the experimental results is shown at left. 19 genes were differentially expressed in both comparisons and are displayed as a heatmap in which expression level is defined by Z-score (defined in ‘Materials and methods’). Saa1 and 2 are highlighted in blue. Other vitamin A-sensitive genes identified by this screen include granzymes A and B (gene symbols: GzmA and GzmB). There is a known role for retinoic acid in CD8+ T cell differentiation (Allie et al., 2013), which could explain the lowered abundance of granzyme transcripts in the vitamin A-deficient mice. Additionally, the array data reveal unexpected vitamin A-sensitive expression of three glycosyltransferases–fucosyltransferase 2 (Fut2), β1,6-N acetylglucosaminyltransferase (Gcnt1), and β1,3-galactosyltransferase 5 (B3galt5)–that participate in mucin glycan synthesis (Thomsson et al., 2002; Brockhausen et al., 2009).
Figure 1—figure supplement 2
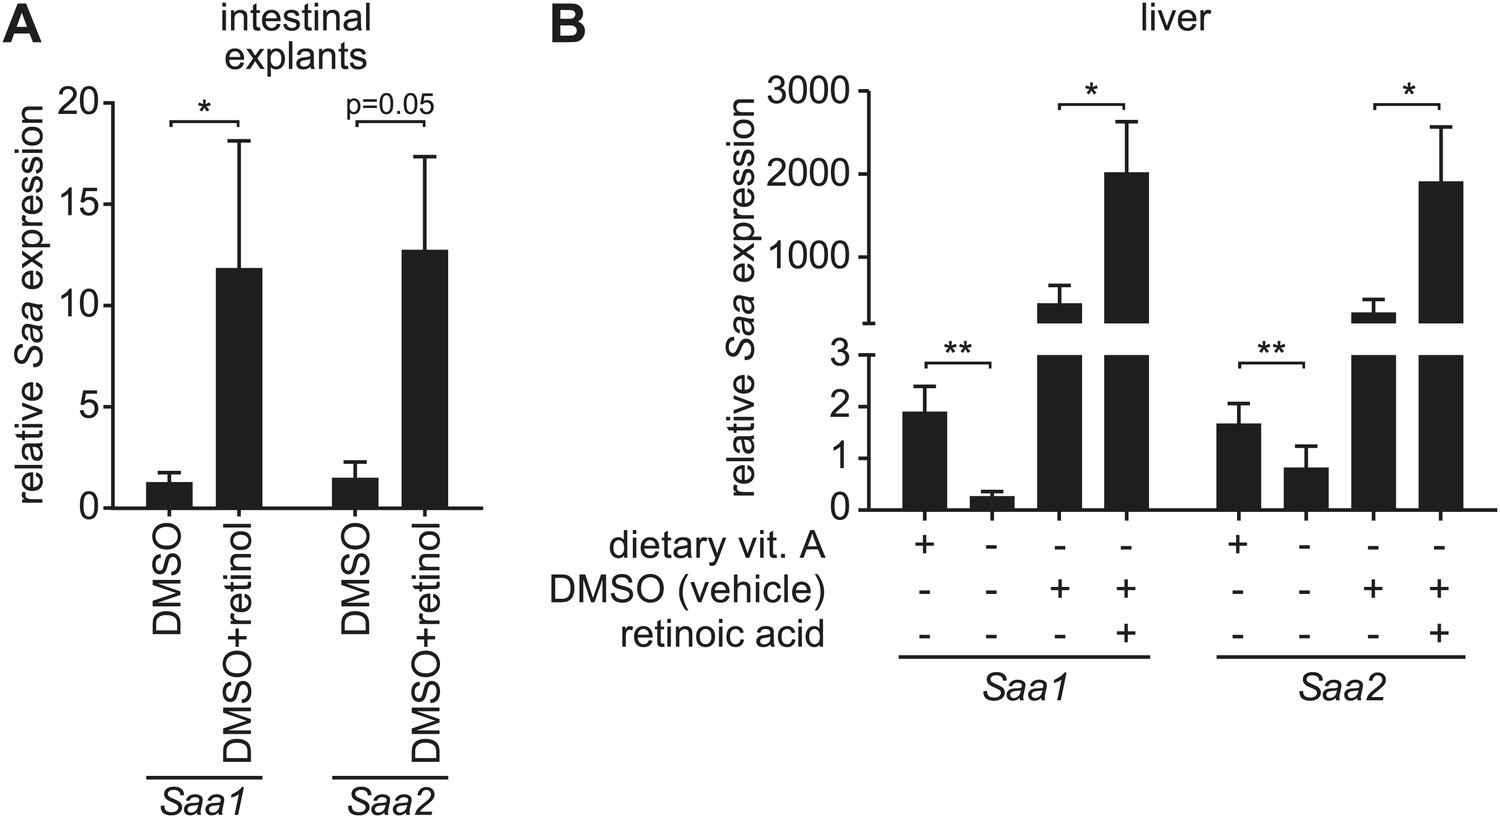
Retinoid supplementation stimulates Saa expression in intestine and liver.
(A) Five centimeter explants from the distal small intestine (ileum) of vitamin A-replete mice were cultured for 6 hr in the presence of 0.1% DMSO or 1 µM retinol in 0.1% DMSO. Saa transcript abundance was determined by Q-PCR. N = 6 mice/condition. (B) Vitamin A-depleted mice were treated with retinoic acid administered by intraperitoneal injection daily over the course of three days. Saa transcript abundance was determined by Q-PCR. Note that injection of DMSO vehicle alone resulted in increased Saa expression. N = 4–17 mice/condition. Mean ± SEM is plotted. *p < 0.05, **p < 0.01. p values were determined by the Mann–Whitney test in (A) and two-tailed Student's t test in (B).
Figure 2 with 2 supplements
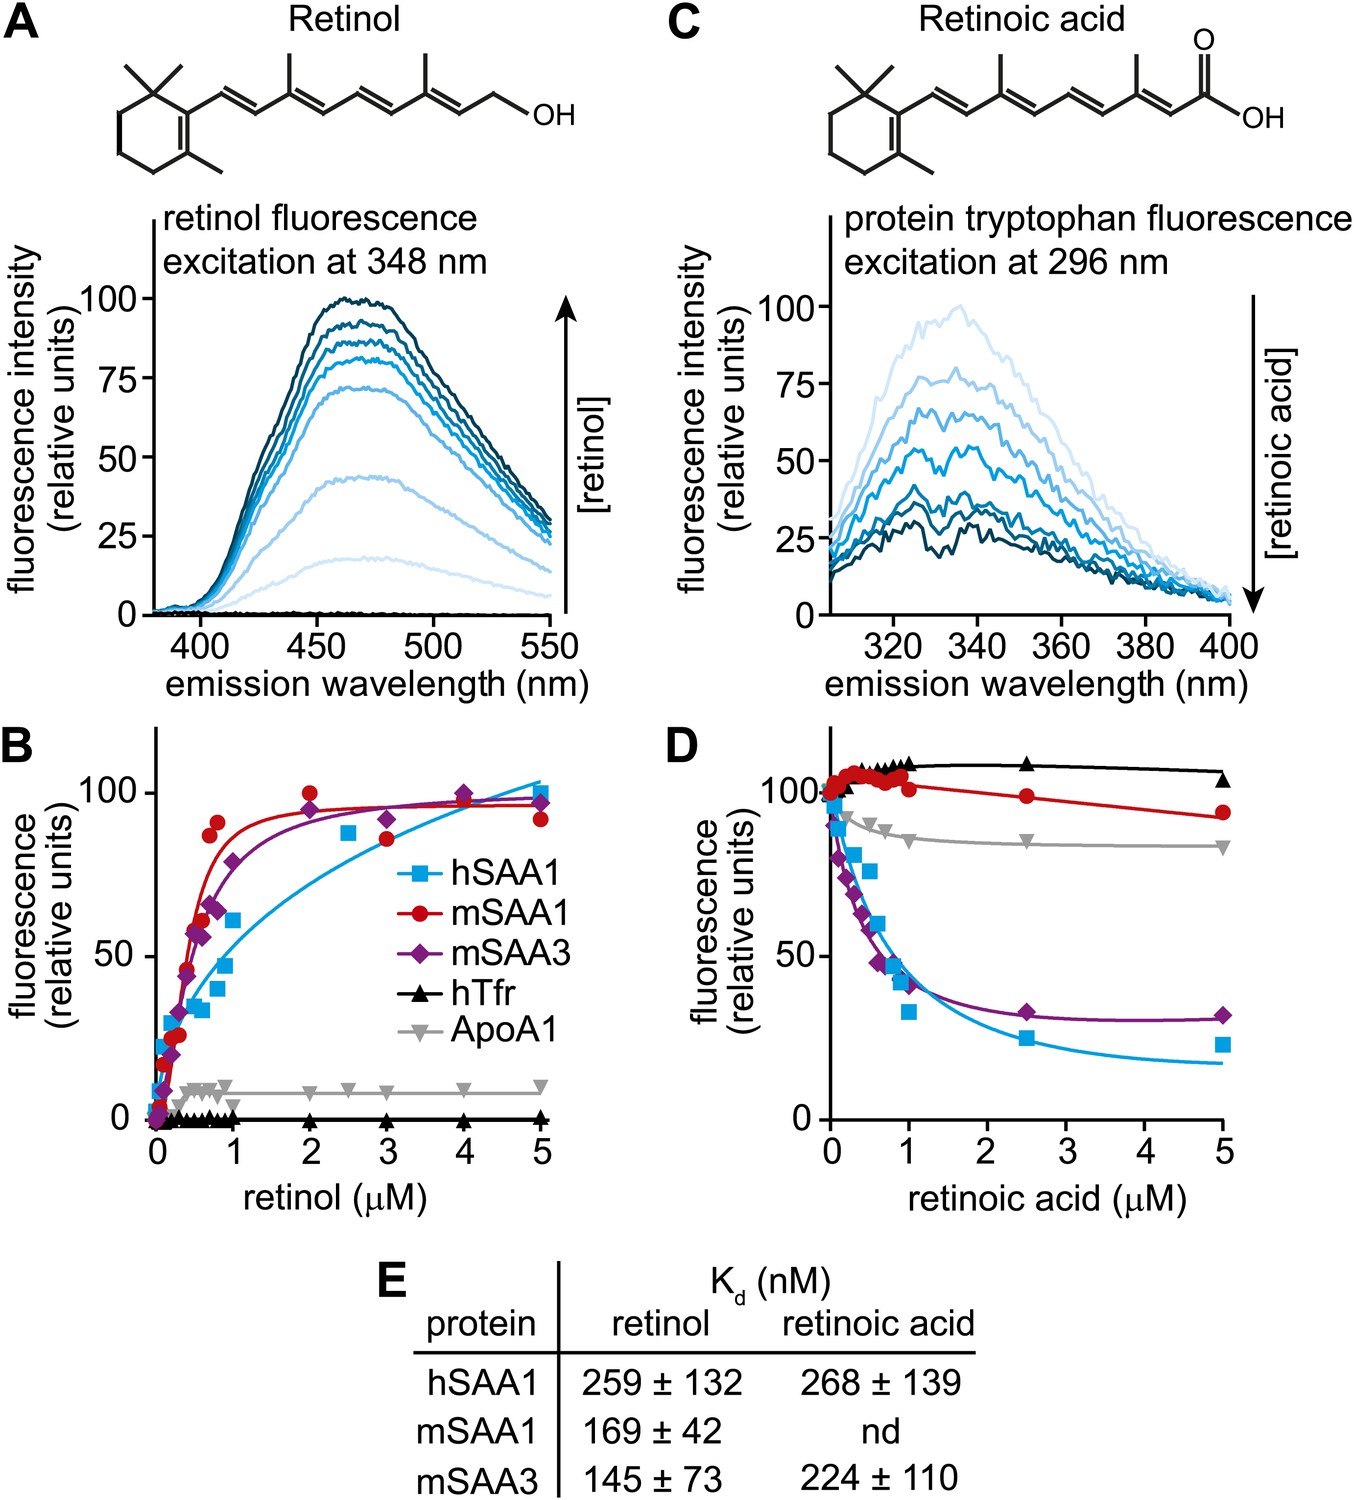
Human and mouse SAAs bind retinol.
(A) Retinol exhibits intrinsic fluorescence that is enhanced upon binding to proteins through energy transfer from tryptophan residues. All-trans-retinol was titrated into mSAA3 and fluorescence emission was monitored following excitation at 348 nm. The chemical structure of retinol is shown. (B) All-trans-retinol was titrated into hSAA1, mSAA1, mSAA3, human transferrin (hTfr; negative control), and apolipoprotein A1 (ApoA1; negative control). Binding was quantified by monitoring retinol fluorescence at 460 nm following excitation at 348 nm as in (A). Plots are representative of five independent experiments. (C) Retinoic acid lacks intrinsic fluorescence, but can quench intrinsic protein fluorescence due to energy transfer from tryptophan residues (Cogan et al., 1976). All-trans-retinoic acid was titrated into mSAA3 and fluorescence quenching was monitored following excitation at 296 nm. The chemical structure of retinoic acid is shown. (D) All-trans-retinoic acid was titrated into hSAA1, mSAA1, mSAA3, hTfr, and ApoA1. Fluorescence emission was monitored at 334 nm with excitation at 296 nm as in (C). Plots are representative of three independent experiments. (E) Kds were calculated from the binding assay data plotted in (B) and (D) and were derived from three independent experiments. nd, not determined. Additional ligand binding measurements are provided in Figure 2—figure supplements 1 and 2.
Figure 2—figure supplement 1

Retinol and retinoic acid binding to human retinol binding protein 4 (hRBP4).
For comparison, we calculated binding affinities of retinol and retinoic acid to hRBP4 using the fluorescence binding assays described in Figure 2. The results are consistent with published values (Cogan et al., 1976) and are similar to the binding affinities calculated for human and mouse SAAs in Figure 2.
Figure 2—figure supplement 2
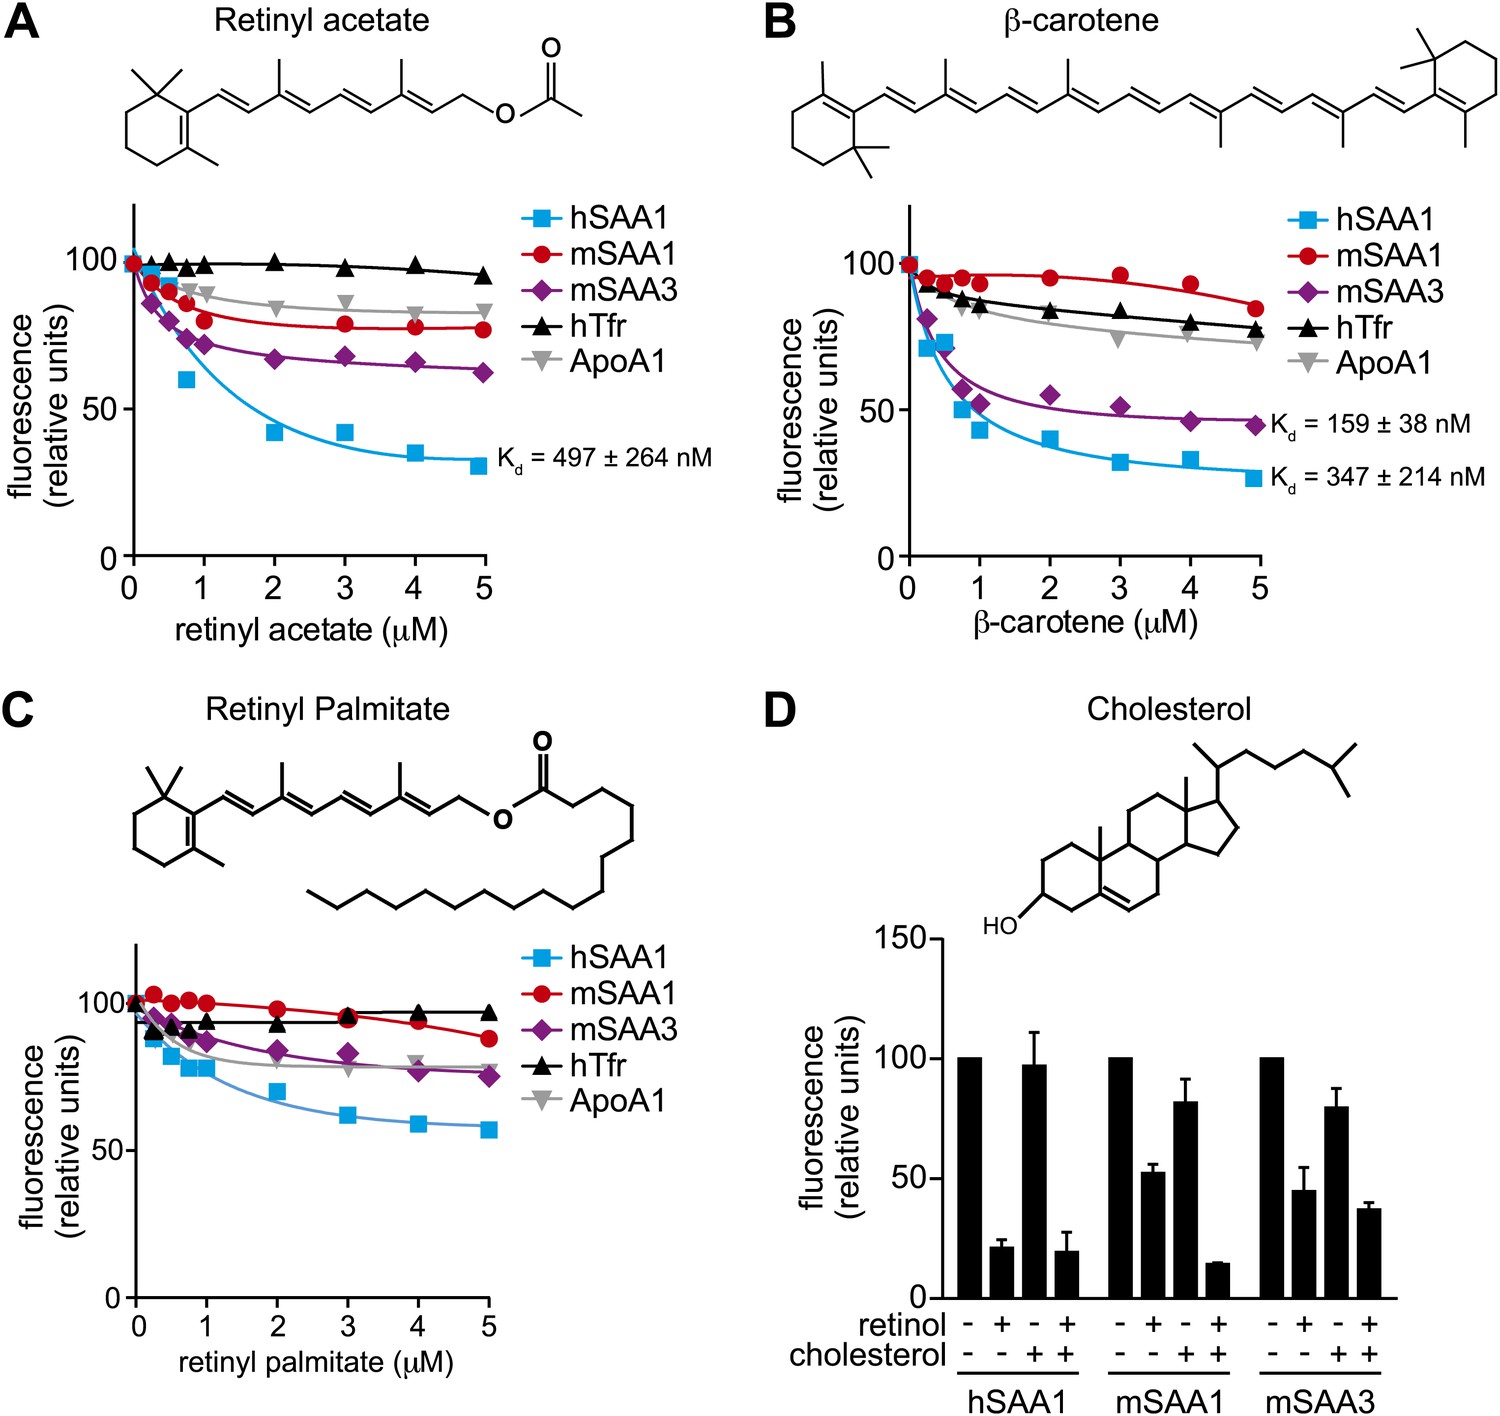
Additional ligand binding studies on human and mouse SAAs.
(A–C) Retinyl acetate (A), β-carotene (B), and retinyl palmitate (C) were titrated into hSAA1, mSAA1, mSAA3, hTfr (negative control) and ApoA1 (negative control), and fluorescence quenching was monitored at 334 nm with excitation at 296 nm. Plots are representative of three independent experiments. The Kds are averages of the values derived from the three experiments. (D) Competitive inhibition of retinol binding by cholesterol was quantified. Saturating concentrations of retinol were added to hSAA1, mSAA1, and mSAA3, and fluorescence quenching was monitored as in (A–C). 10 μM cholesterol was added into the assay and inhibition of fluorescence quenching by retinol was monitored. Values are the average ± SEM of triplicate experiments.
Figure 3 with 2 supplements
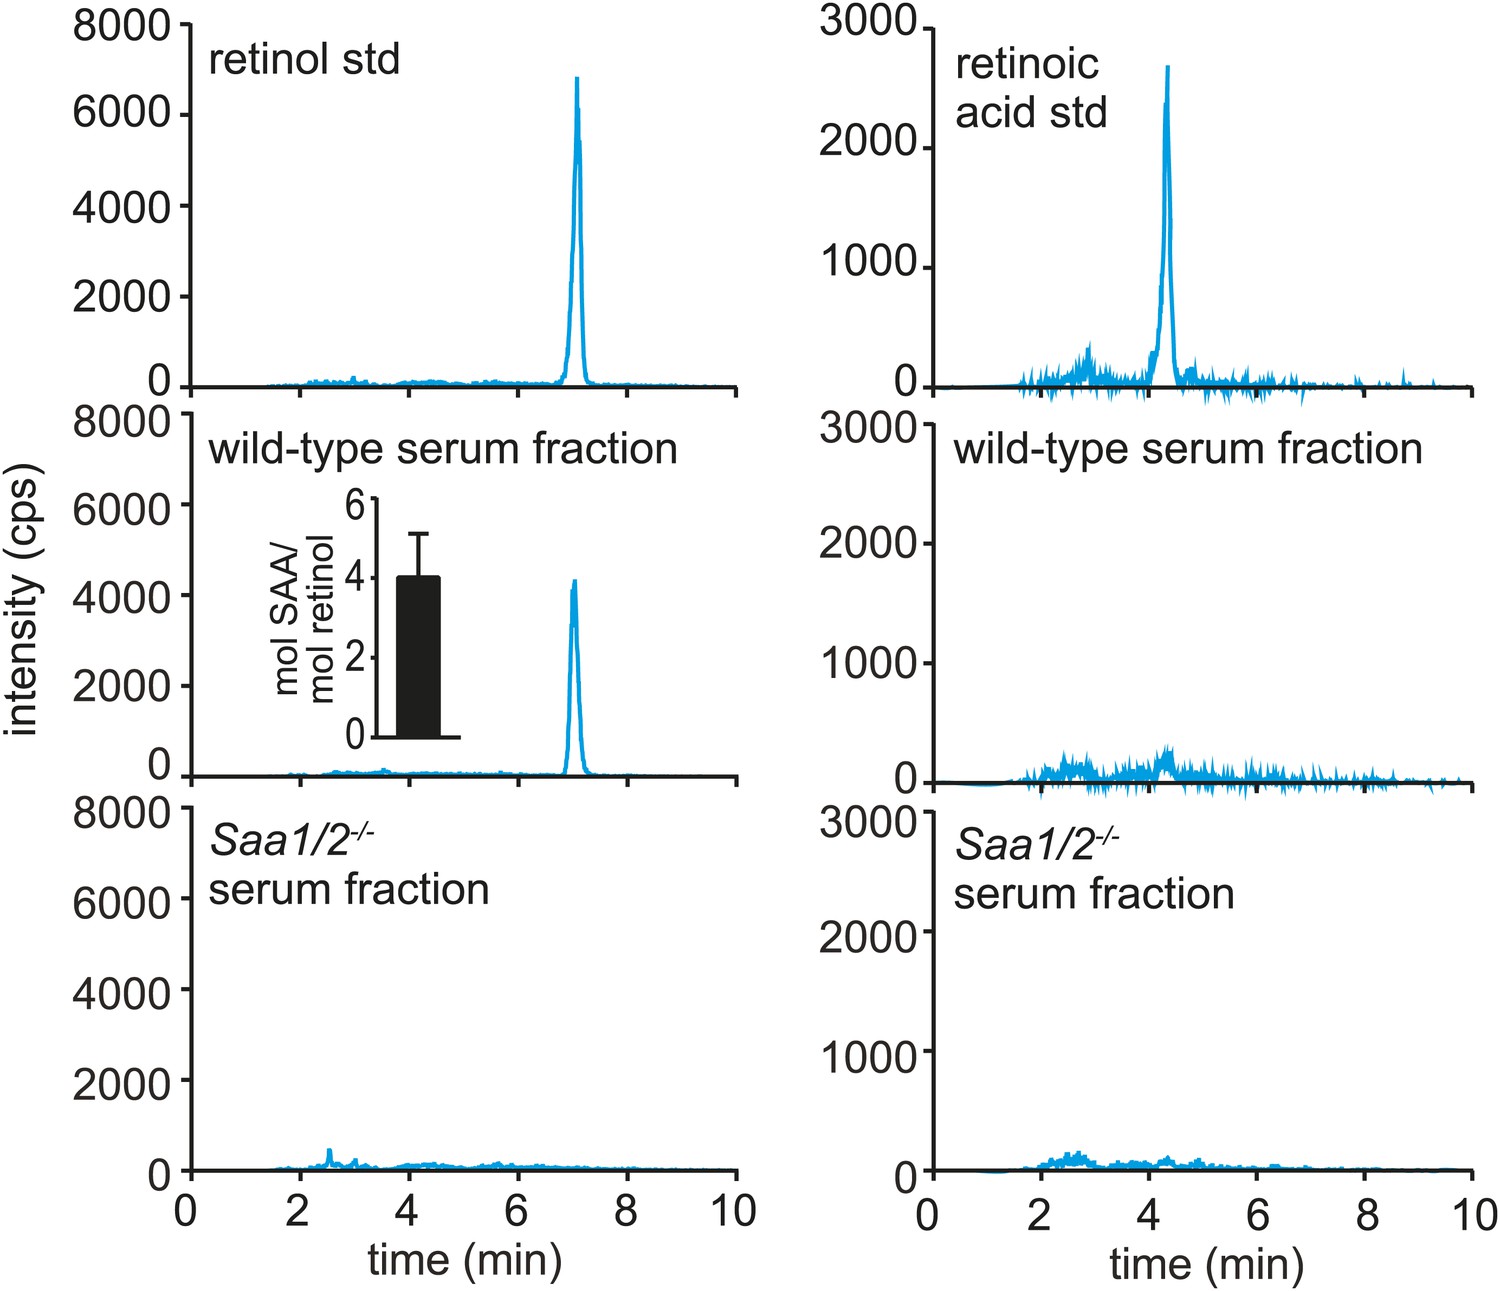
Serum SAA is associated with retinol in vivo.
Wild-type or Saa1/2−/− mice were infected intraperitoneally with S. typhimurium and serum was collected 24 hr later. The serum was fractionated by size exclusion chromatography and a major SAA-containing fraction from wild-type mice was identified by Western blot (Figure 3—figure supplement 1). The SAA-containing fraction and the equivalent serum fraction from Saa1/2−/− mice were hexane-extracted and analyzed by LC-MS/MS against retinol and retinoic acid standards. Additional support for the identification of retinol is provided in Figure 3—figure supplement 2. The LC-MS/MS chromatograms of daughter ion 93 are shown. mol SAA/mol retinol is shown in the inset. Data are representative of duplicate experiments with triplicate samples in each experiment.
Figure 3—figure supplement 1
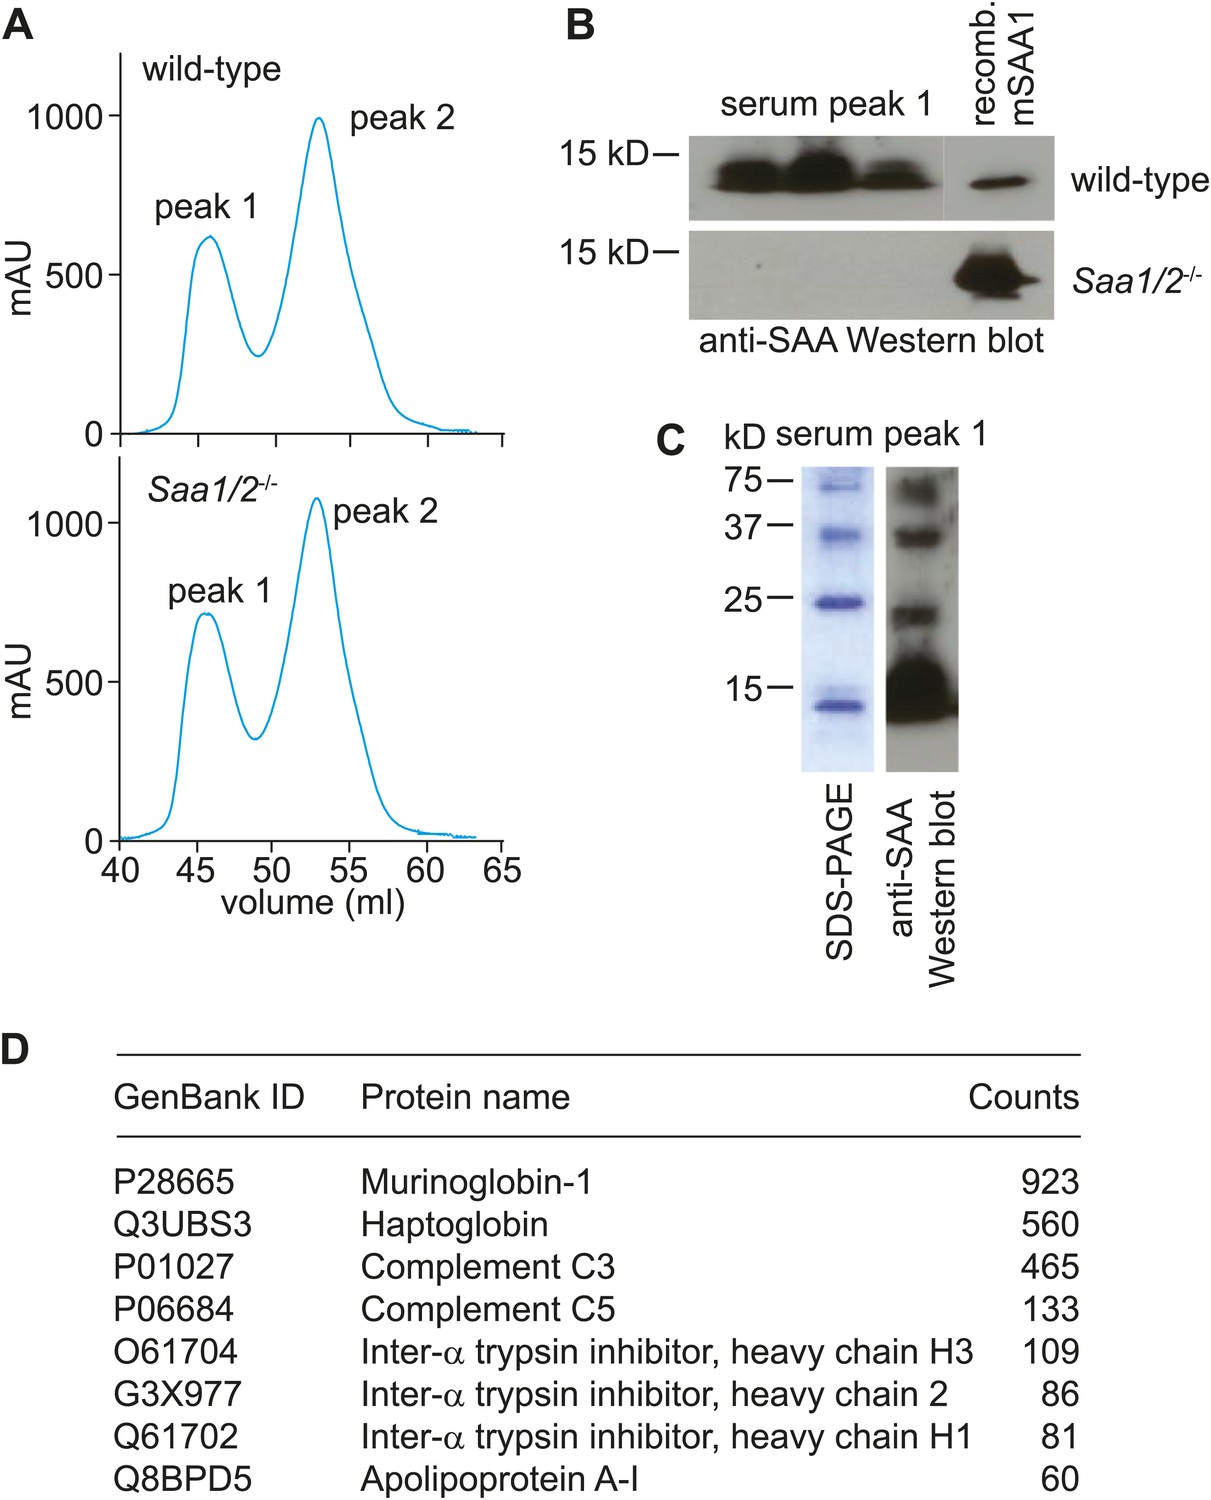
Size-exclusion chromatography and mass spectrometry analysis of SAA-containing serum fractions.
(A) Wild-type and Saa1/2−/− mice were challenged intraperitoneally with S. typhimurium and serum was collected 24 hr later. The serum was concentrated and the proteins were fractionated into two major peaks by size exclusion chromatography on a Superdex 75 HiLoad 16/60 column. (B) SAA was detected in peak 1 by Western blot. (C) SDS-PAGE and Western blot analysis of serum peak 1. SDS-PAGE reveals four major protein bands that correspond to SAA bands as determined by Western blot. (D) Mass spectrometry analysis was performed to identify other proteins in serum peak 1. No other retinoid binding proteins were detected in the peak.
Figure 3—figure supplement 2
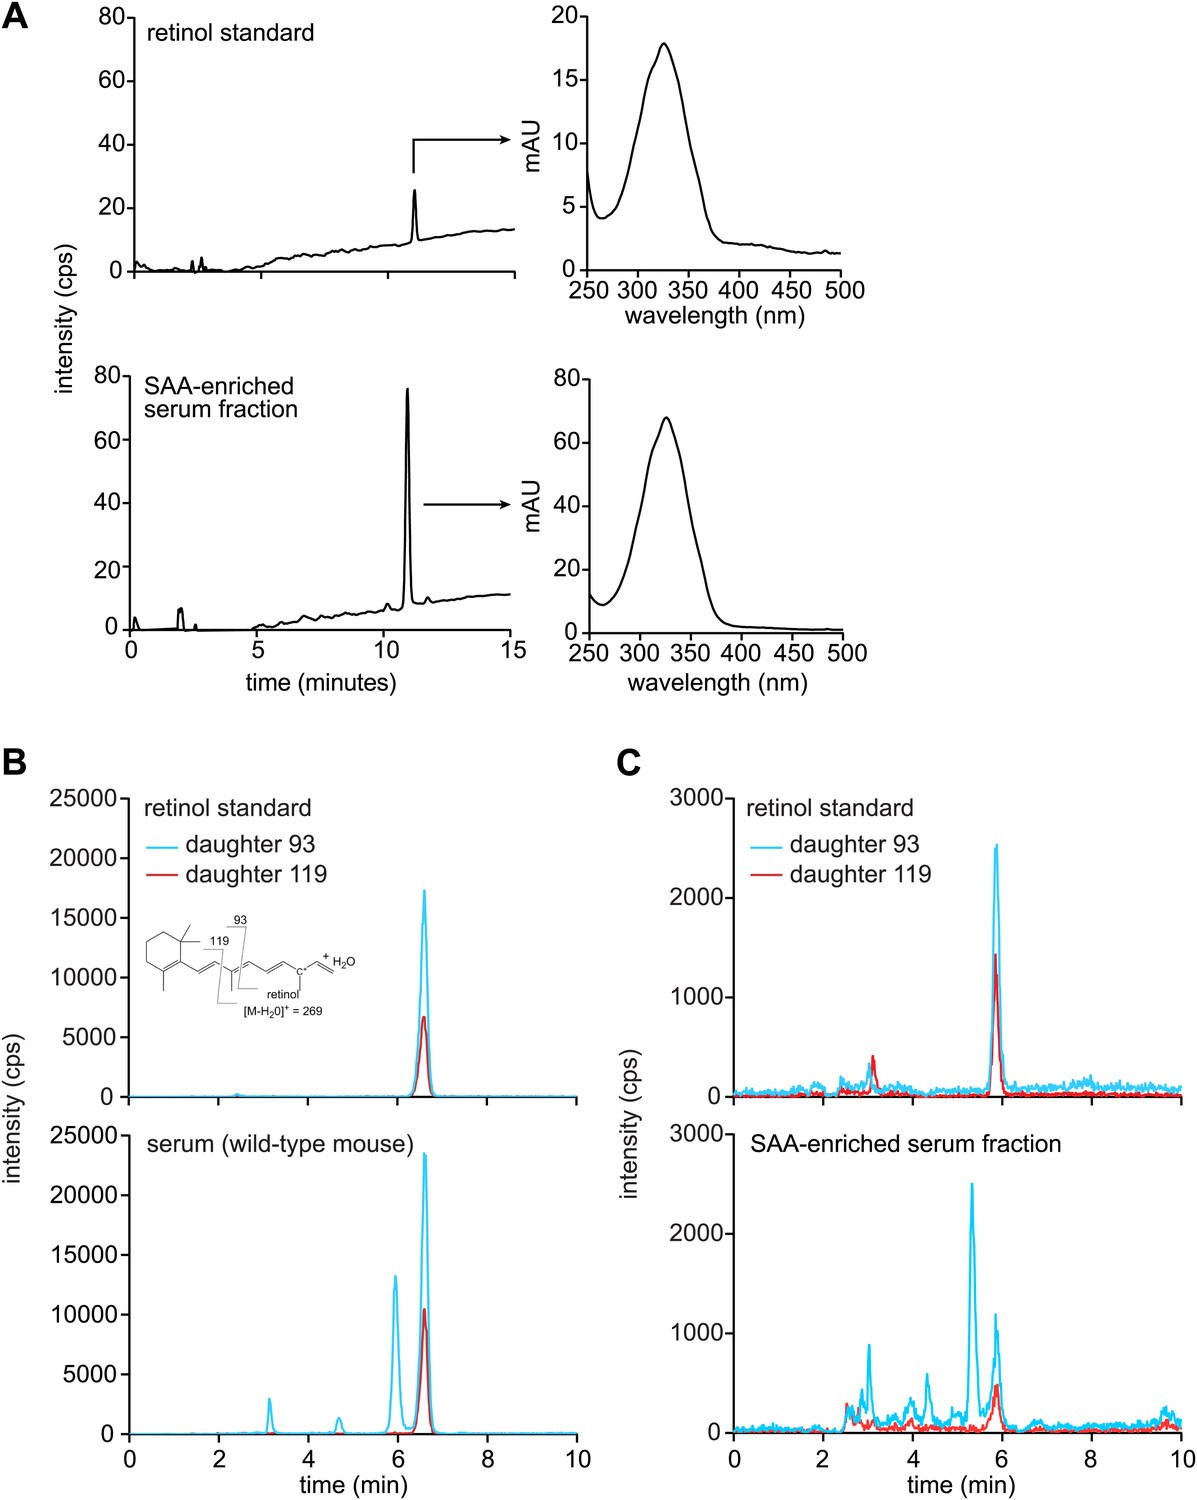
Mouse SAA is associated with retinol in the serum following infection.
(A–C) Wild-type mice were infected by intraperitoneal delivery of S. typhimurium and serum was collected and processed for retinoids as described in ‘Materials and methods’. (A) LC-MS profiles of retinol standard and the SAA-enriched fraction from wild-type mouse serum, prepared as described in Figure 3—figure supplement 1. The retinol peaks were further analyzed by spectroscopy and display maxima at 325 nm, which is characteristic of retinol. (B and C) Retinoids were extracted from unprocessed serum (B) or from the SAA-enriched serum fraction (C) of S. typhimurium infected wild-type mice and analyzed by LC-MS/MS. Retinol was detected by analyzing two daughter ions (93, 119). The inset in the top left panel shows the derivation of the daughter ions from the parent retinol. We noted a modest decrease in the elution time of retinol between the experiments shown in (B) and (C); however, this difference was observed in both the experimental sample and the retinol standard.
Figure 4 with 1 supplement
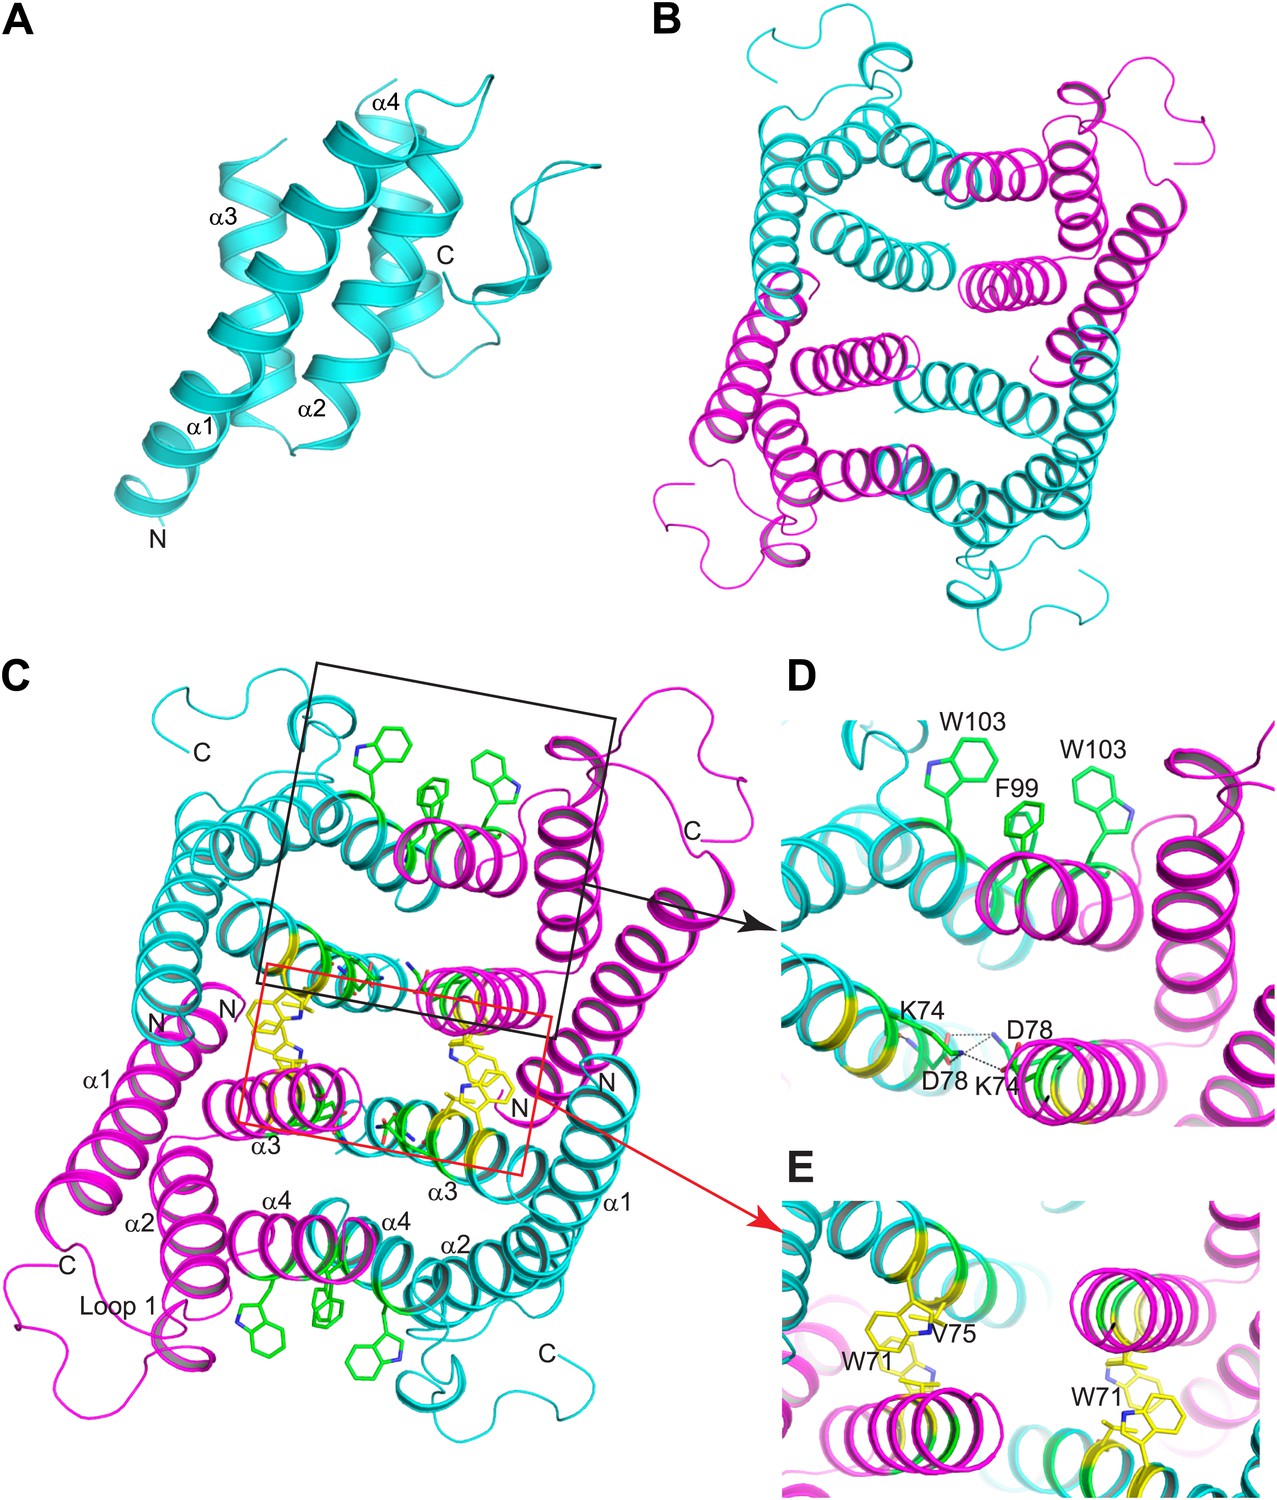
Structure of mSAA3 and molecular contacts within the tetrameric unit.
(A) Structure of the mSAA3 monomer (side view), with helices and termini labeled. (B) Top view of the tetrameric mSAA3 structure. Chains forming dimer pairs are colored cyan and magenta. In (C), helices α1-4 and the N- and C-termini of two monomers are labeled. Residues that make dimer contacts are shown as green sticks while residues involved in tetramer stabilization are shown as yellow sticks. (D and E) Magnified regions of a dimer interface (D) and tetramer interface (E) are shown. Views are slightly rotated so that the interactions can be clearly visualized. Crystal structure data collection and refinement statistics are provided in Table 2; alignments of mouse and human SAAs are shown in Figure 4—figure supplement 1; parameters from the protein Interfaces, Surfaces, and Assemblies (PISA) analysis showing a tetrameric state are provided in Table 3.
Figure 4—figure supplement 1
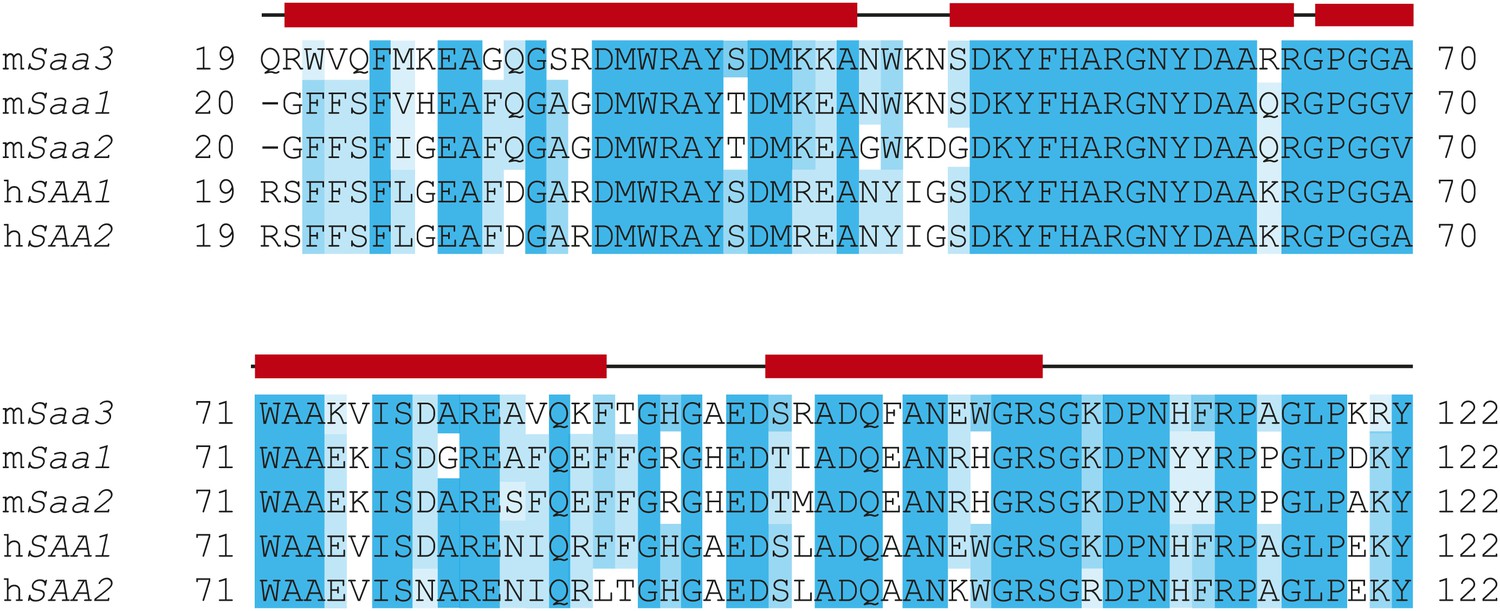
Sequence alignment of mouse and human SAAs.
Secondary structure is based on the mSAA3 crystal structure and is indicated above the sequence. α-helices are shown as solid red bars while loops and non-helical secondary structure are marked as solid black lines.
Figure 5
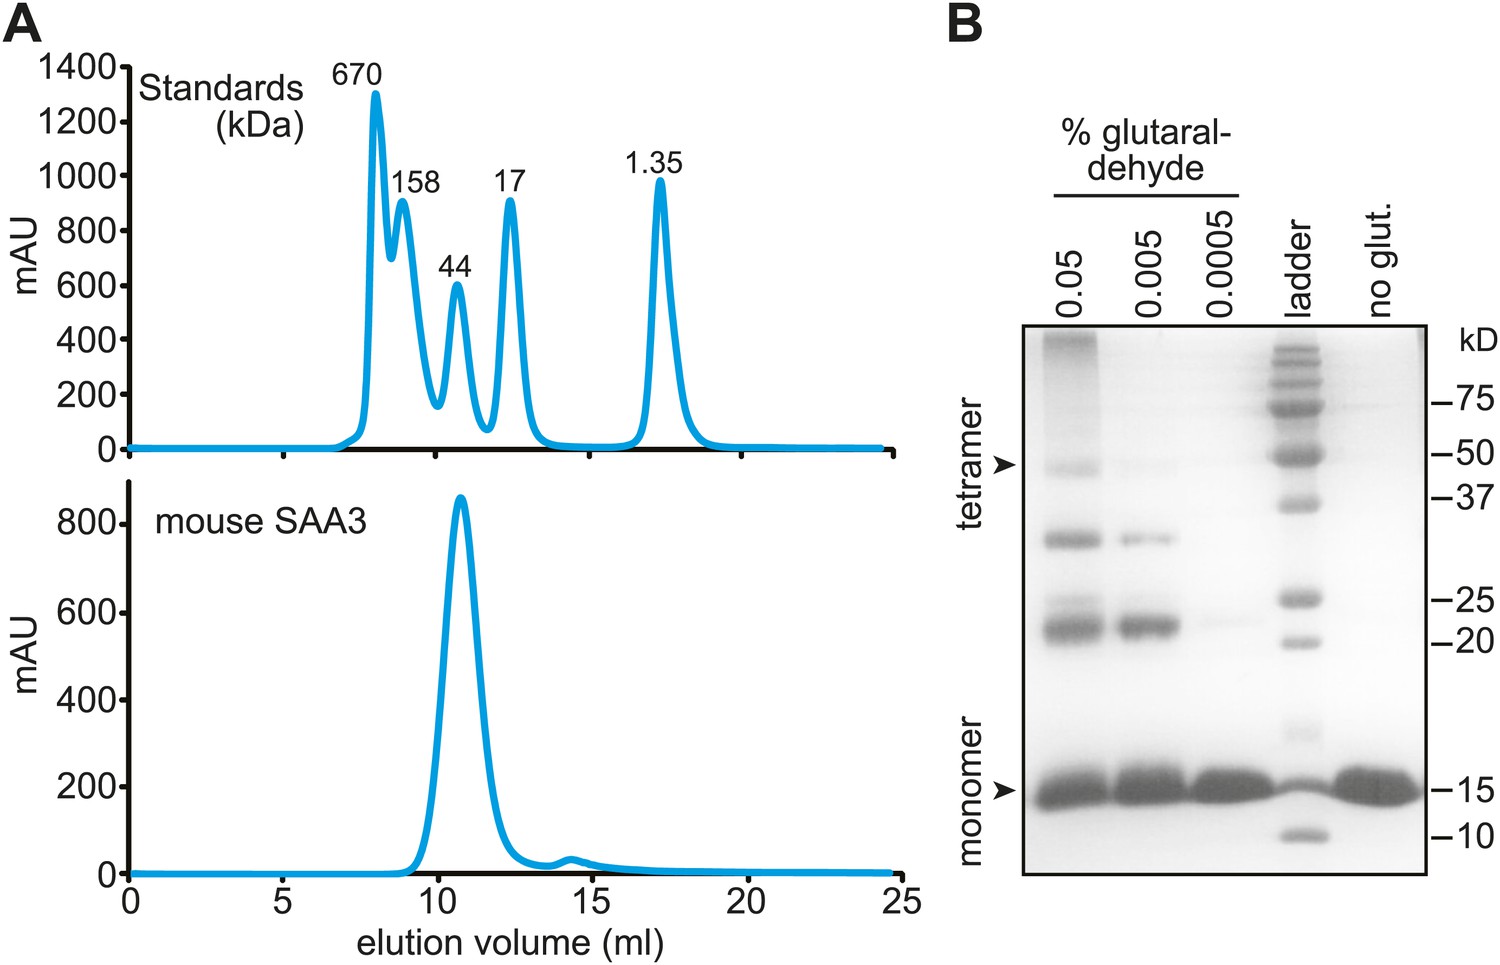
Mouse SAA3 is tetrameric in solution.
(A) Size exclusion chromatography profile of purified mouse SAA3 on a Superdex 75 10/300 GL column. Elution of standards (BioRad) is shown in the top panel and elution of SAA3 is shown in the bottom panel. mSAA3 elutes at a position consistent with a tetramer (monomer is 12.2 kDa). (B) Cross-linking analysis of mSAA3. Purified mSAA3 was cross-linked with glutaraldehyde and analyzed by SDS-PAGE.
Figure 6
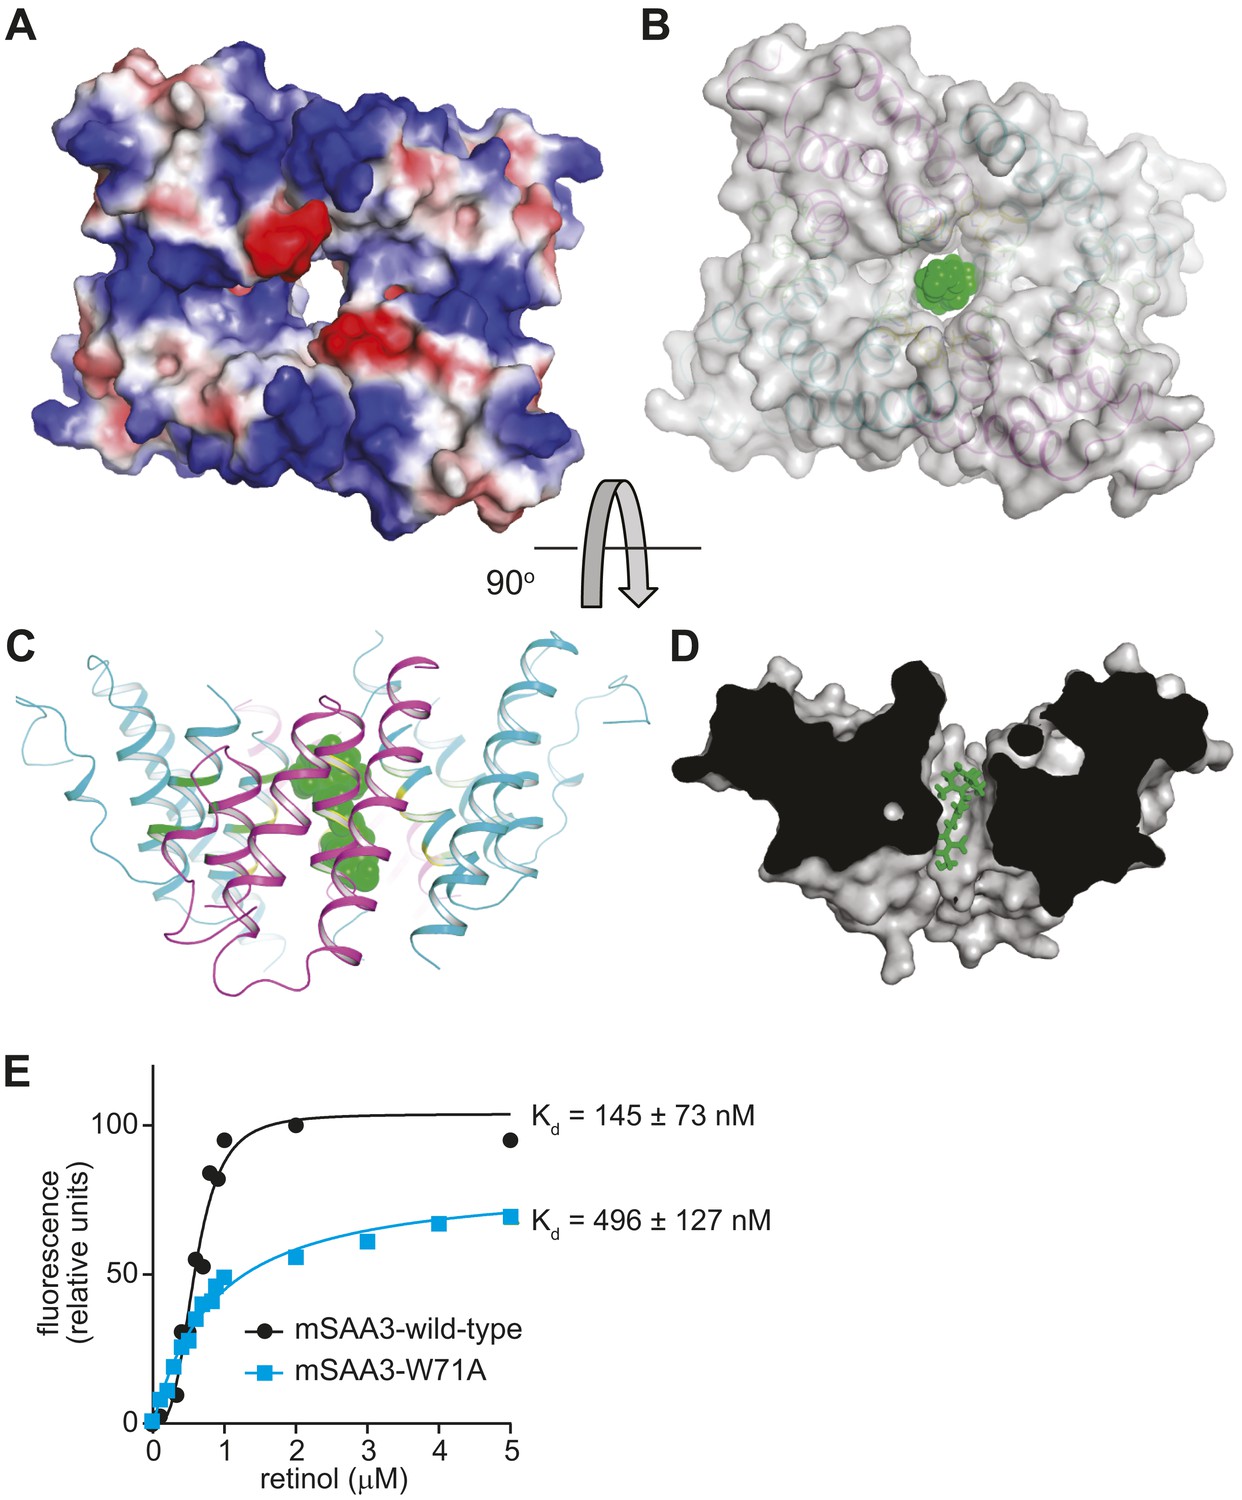
The mSAA3 tetramer forms a hollow hydrophobic binding pocket that can accommodate retinol.
(A) A surface rendering of the tetramer showing the interior cavity, with the electrostatic potential displayed using a color gradient ranging from negative (red) to neutral (white) to positive (blue). The orientation is similar to that in Figure 4B. (B–D) Different views of a retinol molecule docked in the putative ligand-binding pocket. (B) A semi-transparent surface representation of the protein in the same orientation as Figure 4B, with a cartoon trace. Retinol atoms are represented as green spheres. The views in (C) and (D) are rotated by approximately 90° in the horizontal plane relative to (A) and (B), and (B) is rotated by approximately 90° in the vertical plane relative to (C). In (D), a surface model of the protein is shown, sliced close to the binding pocket. Retinol atoms are shown as sticks. (E) Wild-type or Trp71Ala (W71A) mutant mSAA3 was assayed for retinol binding as described in Figure 2. Representative plots and Kds were calculated from the binding assay data and were derived from five independent experiments.
Figure 7
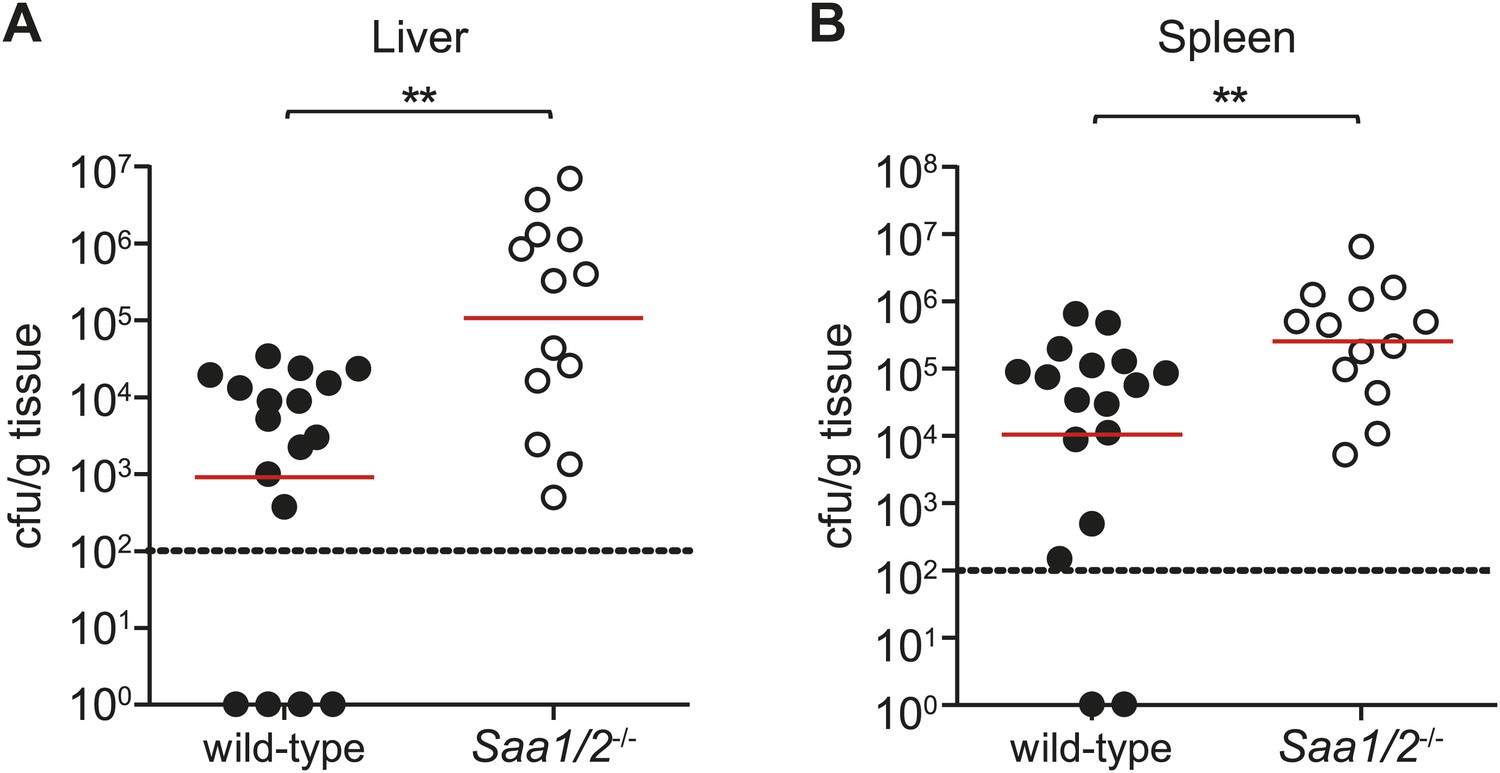
Saa1/2−/− mice have higher bacterial burdens following S. typhimurium infection.
10 week old wild-type and Saa1/2−/− mice were inoculated intraperitoneally with 10,000 cfu of S. typhimurium. Livers (A) and spleens (B) were collected after 24 hr and analyzed for bacterial counts by dilution plating. Combined results from two independent experiments are shown. Each point represents one mouse and geometric means are indicated. Dotted line indicates limit of detection. **p < 0.01 using the Mann–Whitney test.
Tables
Table 1
Primers used in Q-PCR analysis
| Primer name | Primer sequence |
|---|---|
| mouse SAA1 F | 5ʹ-CATTTGTTCACGAGGCTTTCC |
| mouse SAA1 R | 5ʹ-GTTTTTCCAGTTAGCTTCCTTCATGT |
| mouse SAA2 F | 5ʹ-TGTGTATCCCACAAGGTTTCAGA |
| mouse SAA2 R | 5ʹ-TTATTACCCTCTCCTCCTCAAGCA |
| mouse SAA3 F | 5ʹ-CGCAGCACGAGCAGGAT |
| mouse SAA3 R | 5ʹ-CCAGGATCAAGATGCAAAGAATG |
| human SAA1 F | 5ʹ-GGCATACAGCCATACCATTC |
| human SAA1 R | 5ʹ-CCTTTTGGCAGCATCATAGT |
| human SAA2 F | 5ʹ-GCTTCCTCTTCACTCTGCTCT |
| human SAA2 R | 5ʹ-TGCCATATCTCAGCTTCTCTG |
| mouse 18S F | 5ʹ-CATTCGAACGTCTGCCCTATC |
| mouse 18S R | 5ʹ-CCTGCTGCCTTCCTTGGA |
| mouse Gapdh F | 5ʹ-TGGCAAAGTGGAGATTGTTGCC |
| mouse Gapdh R | 5ʹ-AAGATGGTGATGGGCTTCCCG |
| human Gapdh F | 5ʹ-CCTGGTCACCAGGGCTGCTTTTAAC |
| human Gapdh R | 5ʹ-GTCGTTGAGGGCAATGCCAGCC |
Table 2
Crystal structure data collection and refinement statistics
| Data collection | |
| Space group | P62 |
| Cell dimensions (Å) | a = b = 78.33, c = 62.32 |
| α = β = 90o, γ = 120o | |
| Wavelength (Å) | 0.9794 |
| Rsym or Rmerge (%) | 8.4 |
| Resolution (Å)* | 50–2.05 (2.09–2.05) |
| I/σI | 19.19 (3.23) |
| Completeness (%) | 99.8 (97.3) |
| Redundancy | 6.2 (5.4) |
| Refinement | |
| No. reflections | 12,206 |
| Resolution (Å)* | 39.17–2.06 (2.14–2.06) |
| Rwork/Rfree | 0.17/0.21 (0.16/0.19) |
| No. atoms | |
| Protein | 1608 |
| Ligand/ion | 3 |
| Water | 61 |
| R.m.s. deviations | |
| Bond lengths (Å) | 0.0077 |
| Bond angles (°) | 0.932 |
-
*
Highest resolution shell is shown in parenthesis.
Table 3
Parameters from the Protein Interfaces, Surfaces, and Assemblies (PISA) analysis
| Parameter | Value |
|---|---|
| Multimeric state | 4 |
| Composition | A2B2 |
| Dissociation pattern | 2(AB) |
| Surface area, Å2 | 19485.8 |
| Buried area, Å2 | 6125.7 |
| ΔGintrinsic, kcal/mol | −79.8 |
| ΔGdiss, kcal/mol | 11.1 |
| TΔSdiss, kcal/mol | 12.6 |
Download links
A two-part list of links to download the article, or parts of the article, in various formats.
Downloads (link to download the article as PDF)
Open citations (links to open the citations from this article in various online reference manager services)
Cite this article (links to download the citations from this article in formats compatible with various reference manager tools)
Serum amyloid A is a retinol binding protein that transports retinol during bacterial infection
eLife 3:e03206.
https://doi.org/10.7554/eLife.03206


