Increased H+ efflux is sufficient to induce dysplasia and necessary for viability with oncogene expression
- University of California, San Francisco, United States
Figures
Figure 1 with 3 supplements
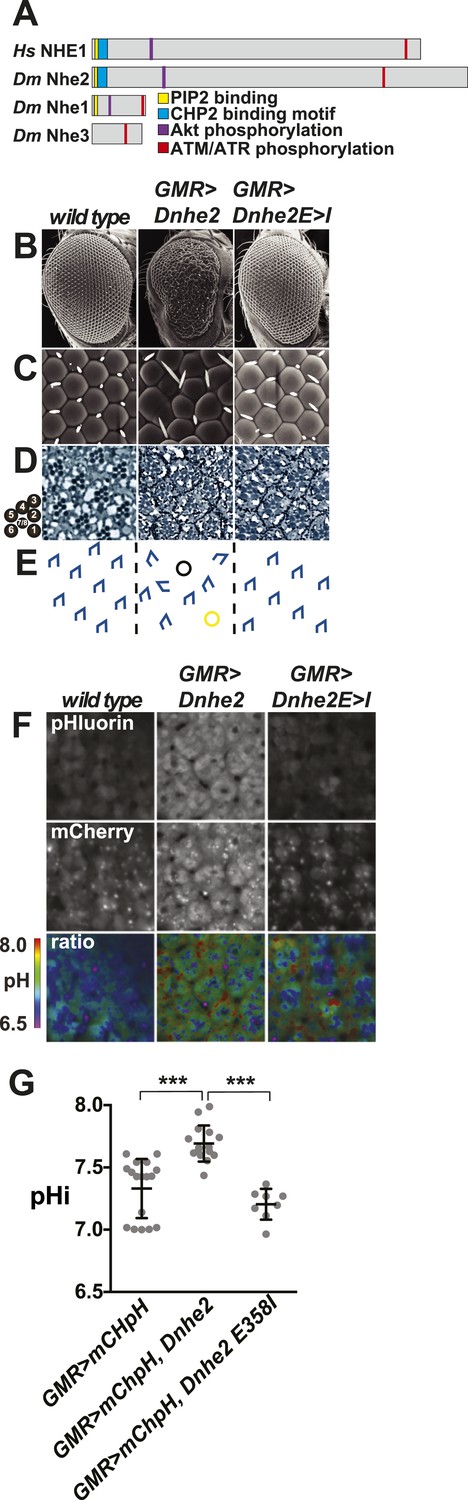
Dnhe2 over-expression is sufficient to induce dysplasia and hyperproliferation.
(A) Amino acid sequence analysis of NHE C-terminal cytoplasmic domains reveals that Drosophila melanogaster (Dm) Nhe2 has the highest homology with mammalian NHE1 compared with DmNhe1 and 3. (B and C) Scanning electron micrographs of the exterior surface of adult Drosophila eyes of the indicated genotypes. Anterior is to the right in all figures unless otherwise indicated. (D) Histological sections reveal an asymmetrical trapezoidal arrangement of rhabdomeres, the light-sensing organelles of the R cells, visible as dark circles; seven of the eight rhabdomeres are visible in each section. (E) Traced diagram showing ommatidial orientation, where blue trapezoids indicate wild type, black circles indicate missing R cells, and yellow circles indicate abnormal symmetrical R4/R4 cell specification. (F) Single confocal slices from live, pupal eyes expressing GMR > mChpH showing fluorescence of pHluorin (top), mCherry (middle) and ratiometric images (bottom). (G) pHi was calculated from ratio values using a standard curve and graphed (black lines show mean ± SEM). Calculated pHi values are: wild type (7.3 ± 0.06, n = 17), GMR > Dnhe2 (7.7 ± 0.04, n = 15); GMR > Dnhe2E358I (7.2 ± 0.04, n = 8). (***p < 0.001).
Figure 1—figure supplement 1
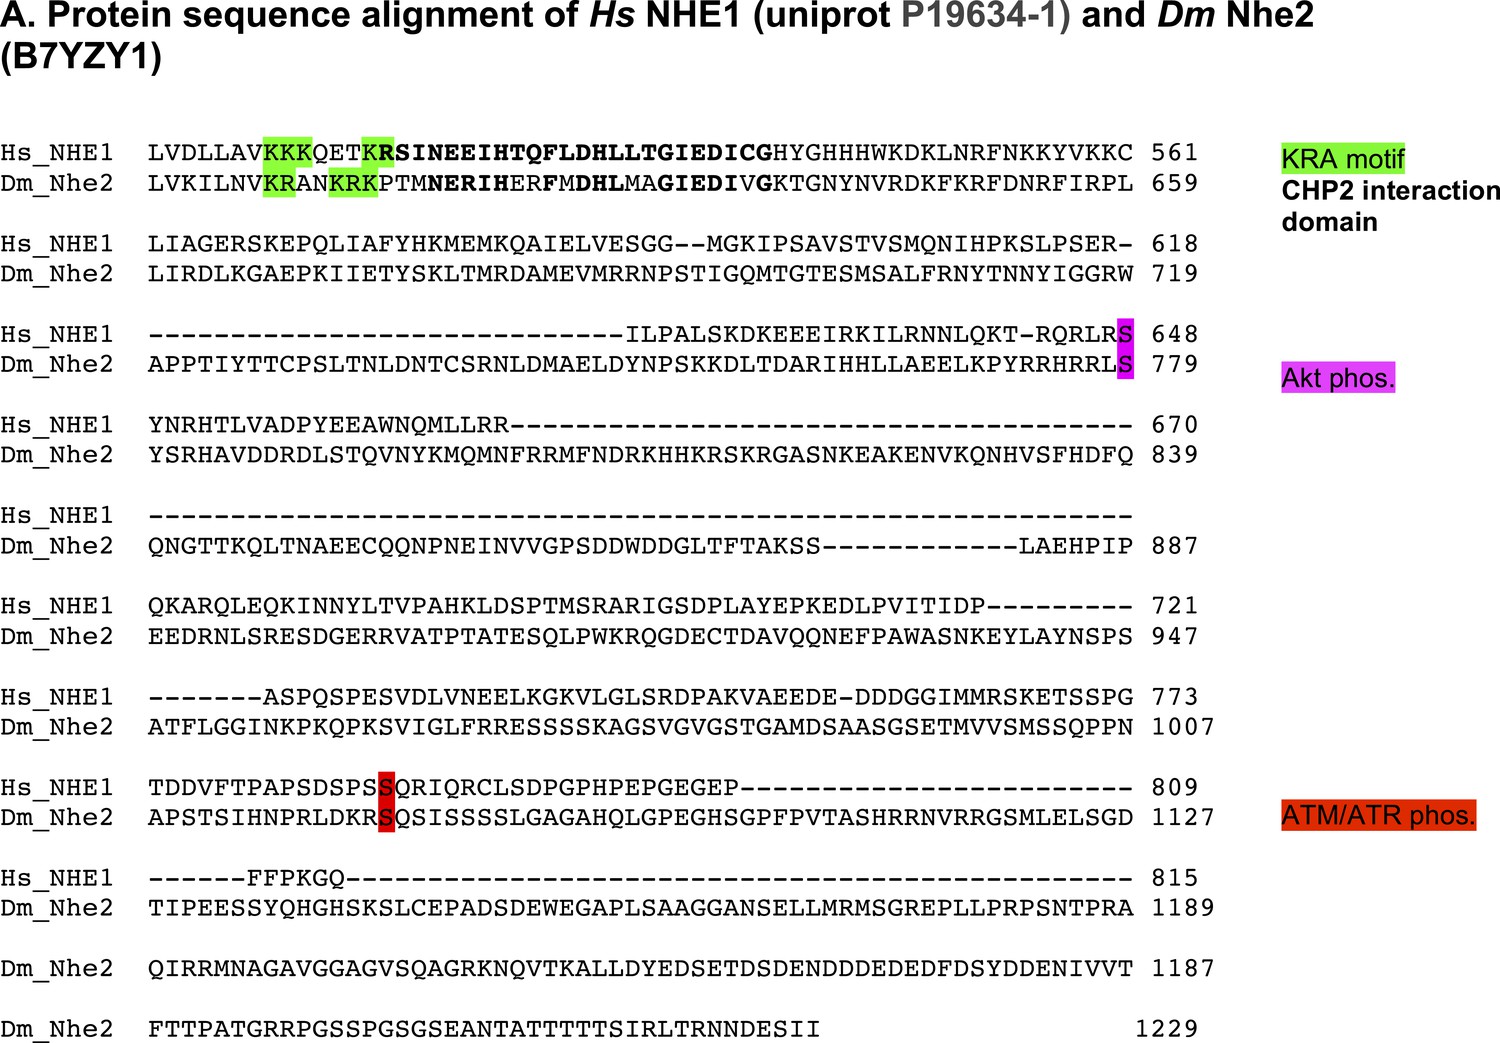
DNhe2 is the ortholog of human NHE1.
(A) Amino acid sequence alignment of the C-terminal cytoplasmic tails of Homo sapiens NHE1 and Drosophila melanogaster DNhe2. Conserved motifs and key regulatory residues are highlighted.
Figure 1—figure supplement 2
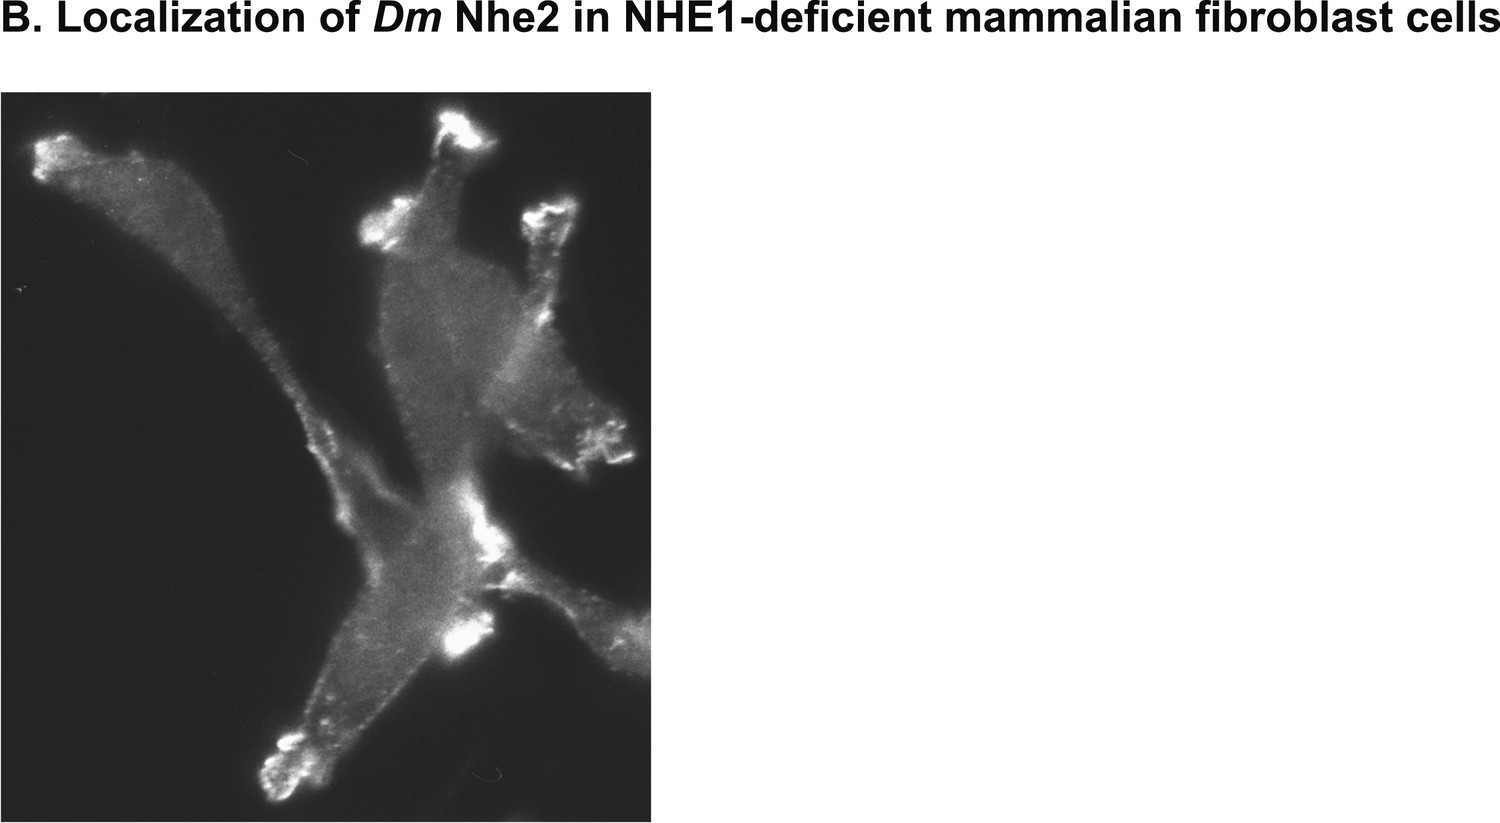
Heterologously expressed DNhe2 in NHE1-deficient CCL39 Chinese hamster lung fibroblasts (termed PS120 cells) localizes to plasma membrane protrusions, as has been shown for mammalian NHE1 (Putney and Barber, 2003).
https://doi.org/10.7554/eLife.03270.005
Figure 1—figure supplement 3
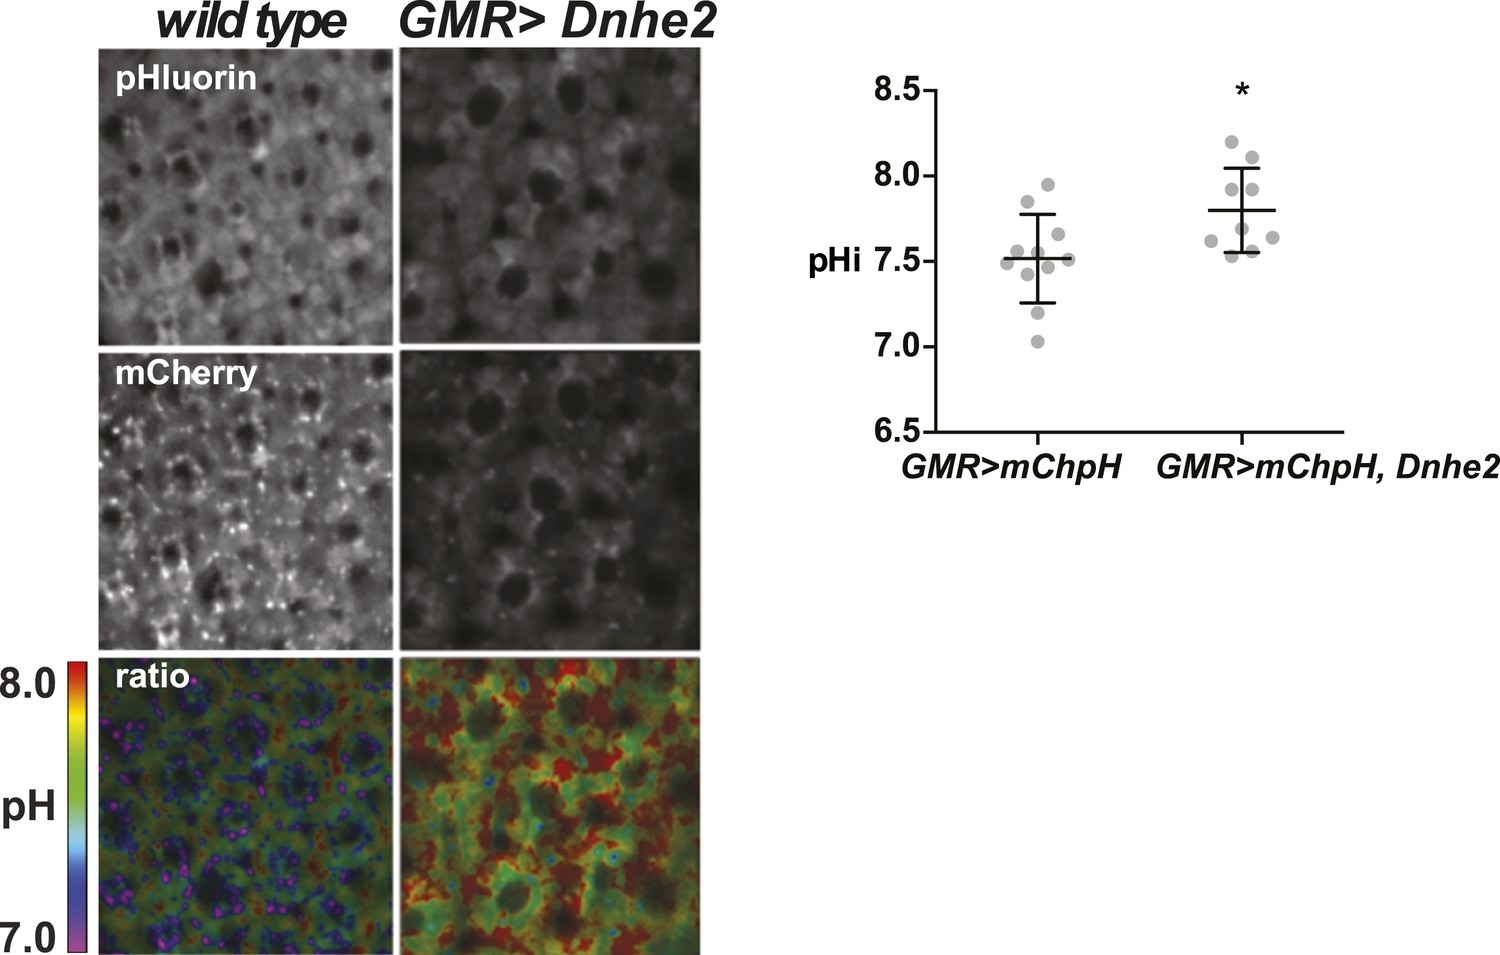
Dnhe2 over-expression increases pHi in photoreceptor neurons.
The pHi in photoreceptor neurons is significantly higher with Dnhe2 over-expression (7.8 ± 0.08, n = 11) compared with wild type (7.5 ± 0.08, n = 9). (*p < 0.05).
Figure 2
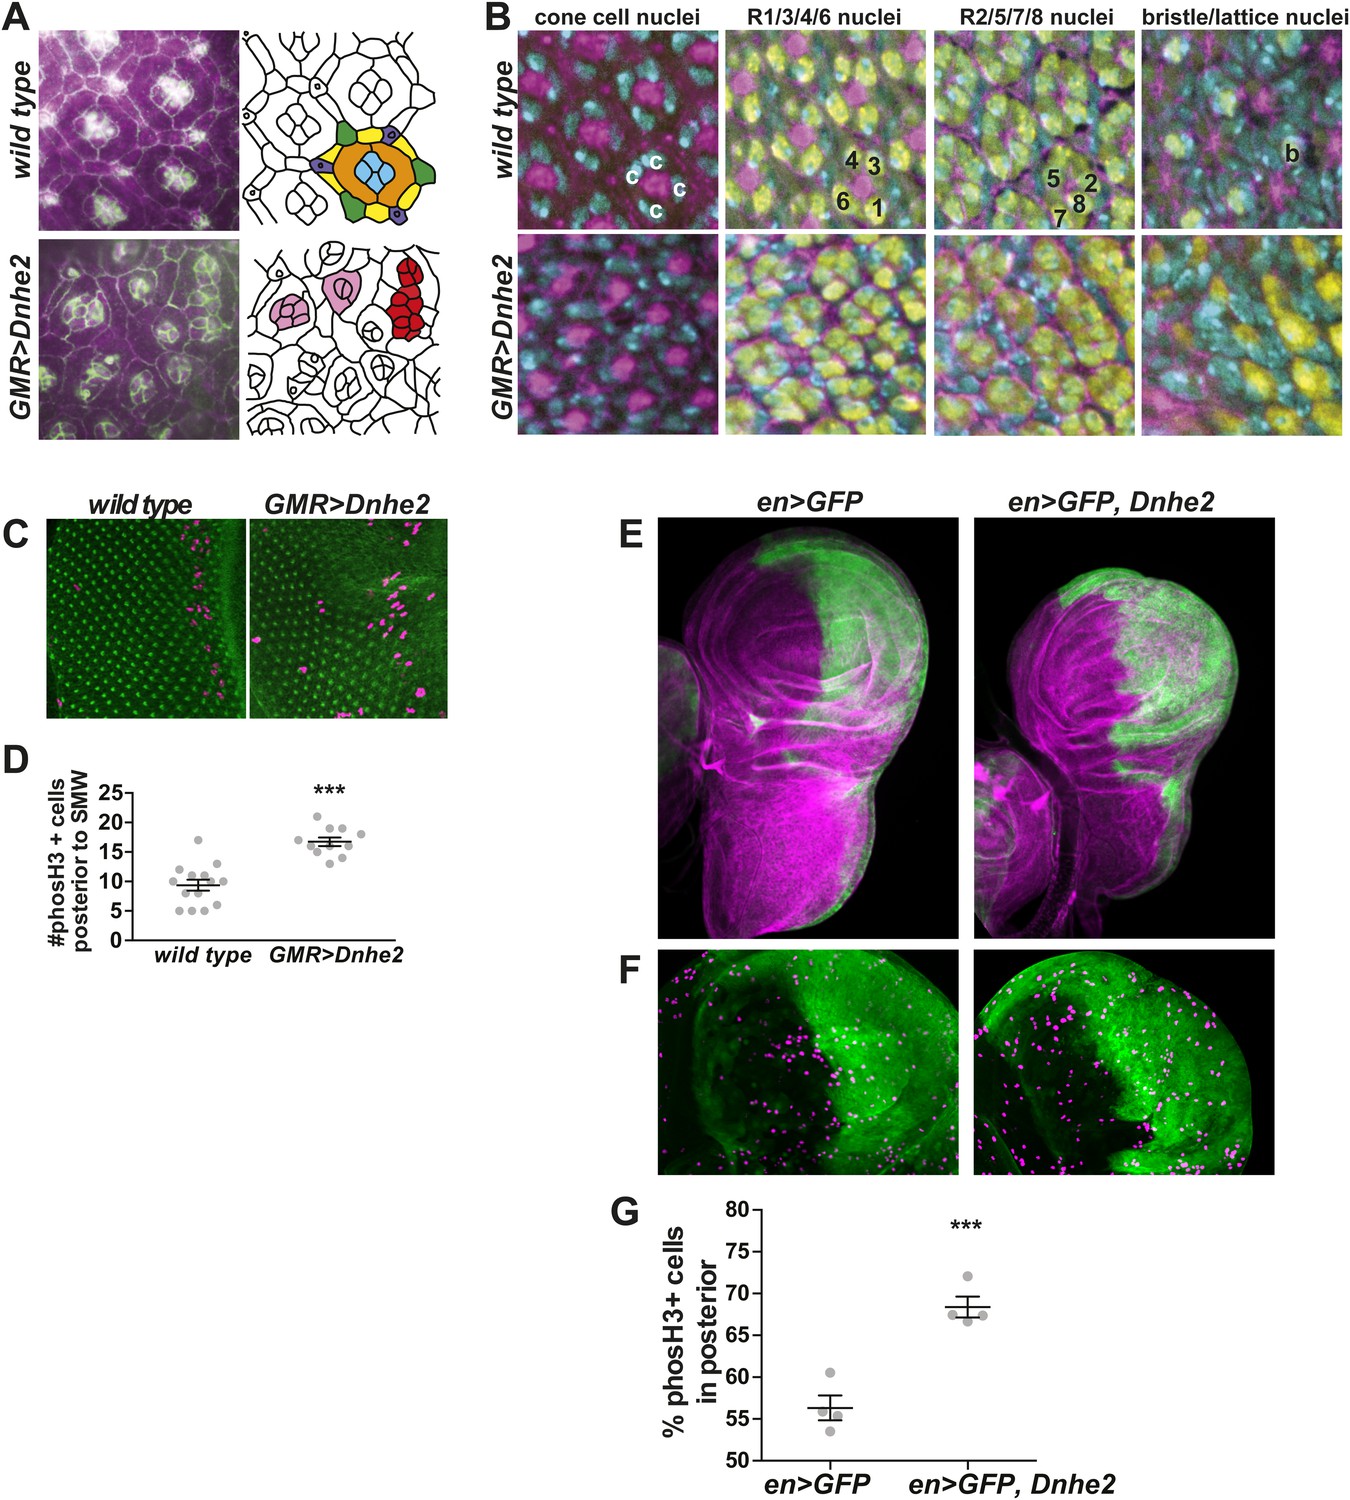
Dnhe2 over-expression disrupts cell shape and tissue organization and increases proliferation.
(A) Confocal micrographs of pupal retinae show disruption of cell shapes and cell–cell contacts as outlined by beta-catenin labeling (green) and rhodamine-phalloidin (magenta) in wild type (top) and GMR > Dnhe2 pupal retinae (bottom). Schematic diagrams are shown to the right with cell types designated by colors: cone cells (blue), primary pigments cells (orange), secondary pigment cells (yellow), tertiary pigment cells (green), and bristle cells (purple). (B) Three-dimensional tissue architecture is shown through the depth of the epithelium. Cells are labeled as follows: DNA label Hoescht (cyan); rhodamine-phalloidin (magenta); pan neuronal marker Elav (yellow). In wild type retinae, four cone cell nuclei are seen (marked with ‘c’) and F-actin labeling in the center of ommatidia. 3 µm lower, the stereotyped photoreceptor cell (R) organization where R1/6/3/4 are labeled and F-actin staining in the center of each ommatidium is seen. In the third slice, 3 µm lower, R2, 5 and 8 can be seen. And finally, on the basal side of the epithelium, the F-actin asters that mark the centers of each ommatidium and the single Elav-positive nucleus of the bristle complex found in wild type. (C) Immunolabeling of wL3 eye imaginal discs showing proliferating cells (phosH3, magenta) and adherens junctions (beta-catenin, green). (D) Quantification of proliferating cells posterior to the SMW (mean ± SEM: wild type (9.4 ± 0.9, n = 14), GMR > Dnhe2 (16.7 ± 0.71, n = 11). (E) Confocal slices through whole mount wing discs with engrailed-GAL4 (enGAL4) driver driving expression of GFP (green), or GFP and Dnhe2. Wing discs are labeled with rhodamine-phalloidin (magenta) to show tissue architecture. (F) An enlarged view of the wing pouch area, labeled with en > GFP (green) and phosH3 (purple). (G) Percent of phosH3+ cells in the posterior compartment (mean ± SEM: en > GFP [56.3 ± 1.5, n = 4]; en > GFP, Dnhe2 [68.4 ± 1.2, n = 4]). (*p < 0.05, **p < 0.01, ***p < 0.001).
Figure 3
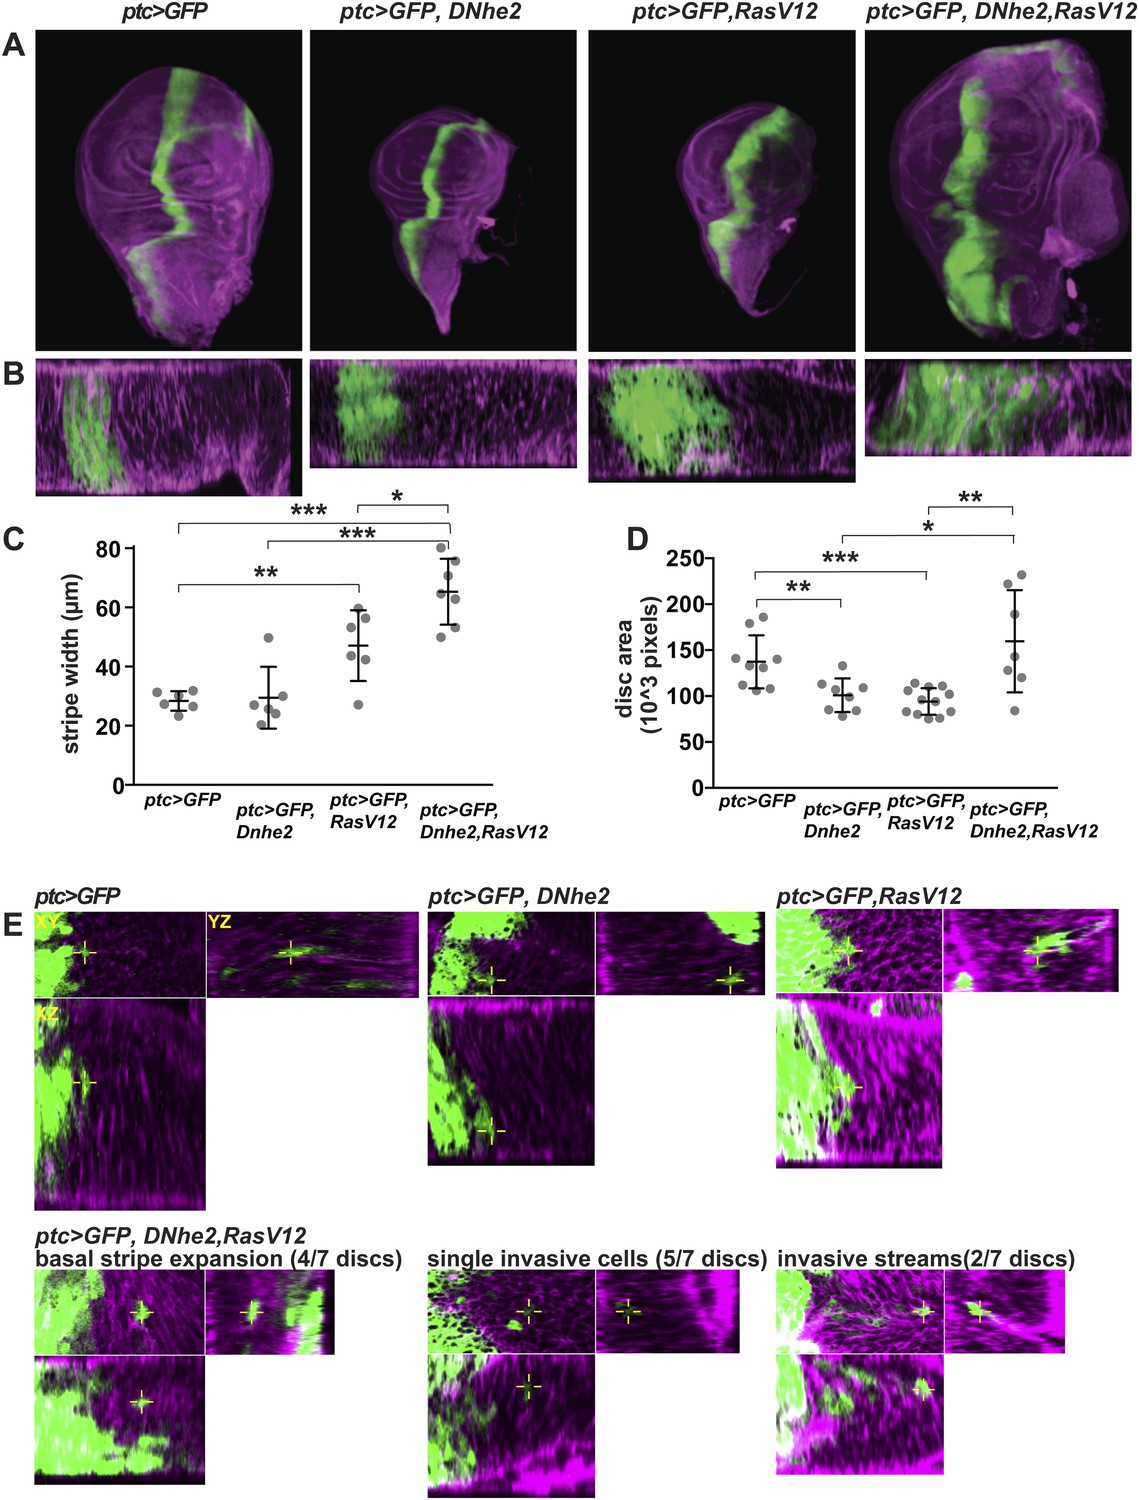
Dnhe2 co-expression enhances RasV12-mediated growth and invasion.
(A) Confocal images of third instar wing imaginal discs expressing ptc > GFP plus indicated transgenes (green) and rhodamine-phalloidin (purple) fluorescence in XY maximum projection images and (B) XZ single slices below (posterior to the right). (C) Quantification of ptc > GFP stripe width (in µm; mean ± SEM: ptc > GFP [26.4 ± 1.3, n = 6], ptc > GFP, Dnhe2 [27.4 ± 4.0, n = 6], ptc > GFP, RasV12 [43.8 ± 4.5, n = 6], ptc > GFP, RasV12, Dnhe2 [60.7 ± 3.9, n = 7]). (D) Quantification of total area of wing imaginal discs (in 103 pixels; mean ± SEM, ptc > GFP [137.3 ± 9.6, n = 9], ptc > GFP, Dnhe2 [107.8 ± 8.9, n = 9], ptc > GFP, RasV12 [93.5 ± 4.1, n = 12], ptc > GFP, RasV12, Dnhe2 [196.5 ± 41.4, n = 8]). (E) Invasive cells were identified as GFP-positive cells that were isolated from other GFP-positive cells in three-dimensional tissue architecture. For each example, shown are XY (upper left), YZ (upper right) and XZ (lower left) single confocal slices. Invasive phenotypes were rarely seen in ptc > GFP, ptc > GFP, Dnhe2 discs, or ptc > GFP, RasV12 wing discs. In ptc > GFP, RasV12, Dnhe2 discs, examples of basal stripe expansion (4/7), multiple single, invasive cells (5/7 discs) and streams of invading cells (2/7) were seen. (*p < 0.05, **p < 0.01, ***p < 0.001).
Figure 4
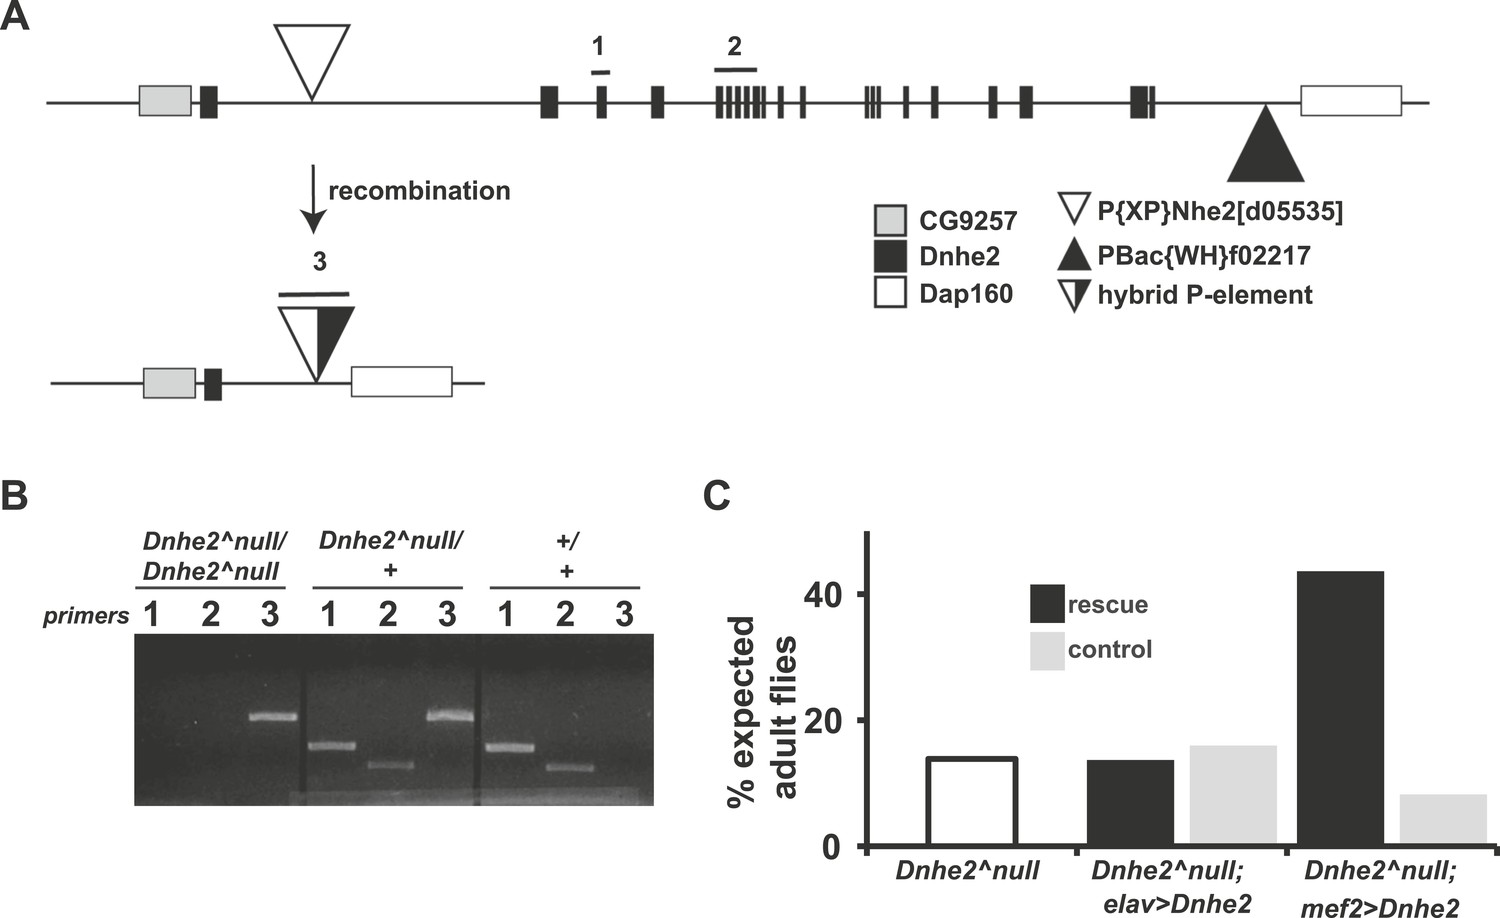
Deletion of Dnhe2 is semi-lethal with a genetic requirement in muscle.
(A) Schematic diagram of Dnhe2 genomic locus, showing Dnhe2 exons (black rectangles), neighboring genes CG9257 and Dap160 (grey and white rectangles, respectively) and P-elements P{XP}Nhe2[d05535] (white triangle) and PBac{WH}f02217 (black triangle). Following FLPase-mediated recombination, all coding exons of Dnhe2 were excised, leaving a hybrid P-element (black and white triangle). PCR primer pairs 1 and 2 are within Dnhe2 coding sequence, while primer pair 3 covers the recombinant P-element. (B) Sample PCR reactions from genomic DNA preps isolated from homozygous Dnhe2null, heterozygous and wild type adult Drosophila. Primer pairs 1 and 2 yield product only in wild type or heterozygotes. Primer pair 3 is generated in Dnhe2null homozygotes or heterozygotes. (C) Dnhe2null flies show 17.7% survival to adulthood. Rescue experiments that restore Dnhe2 expression in neurons (Dnhe2null; elavGAL4/UASDnhe2) do not rescue (13.7%), but expression in muscles (Dnhe2null; mef2GAL4/UASDnhe2) rescues to 43.6% survival. Controls (GAL4 driver alone) do not show any rescue effects with 16.0% survival for Dnhe2null; elavGAL4/+ and 8.2% survival for Dnhe2null; mef2GAL4/+.
Figure 5
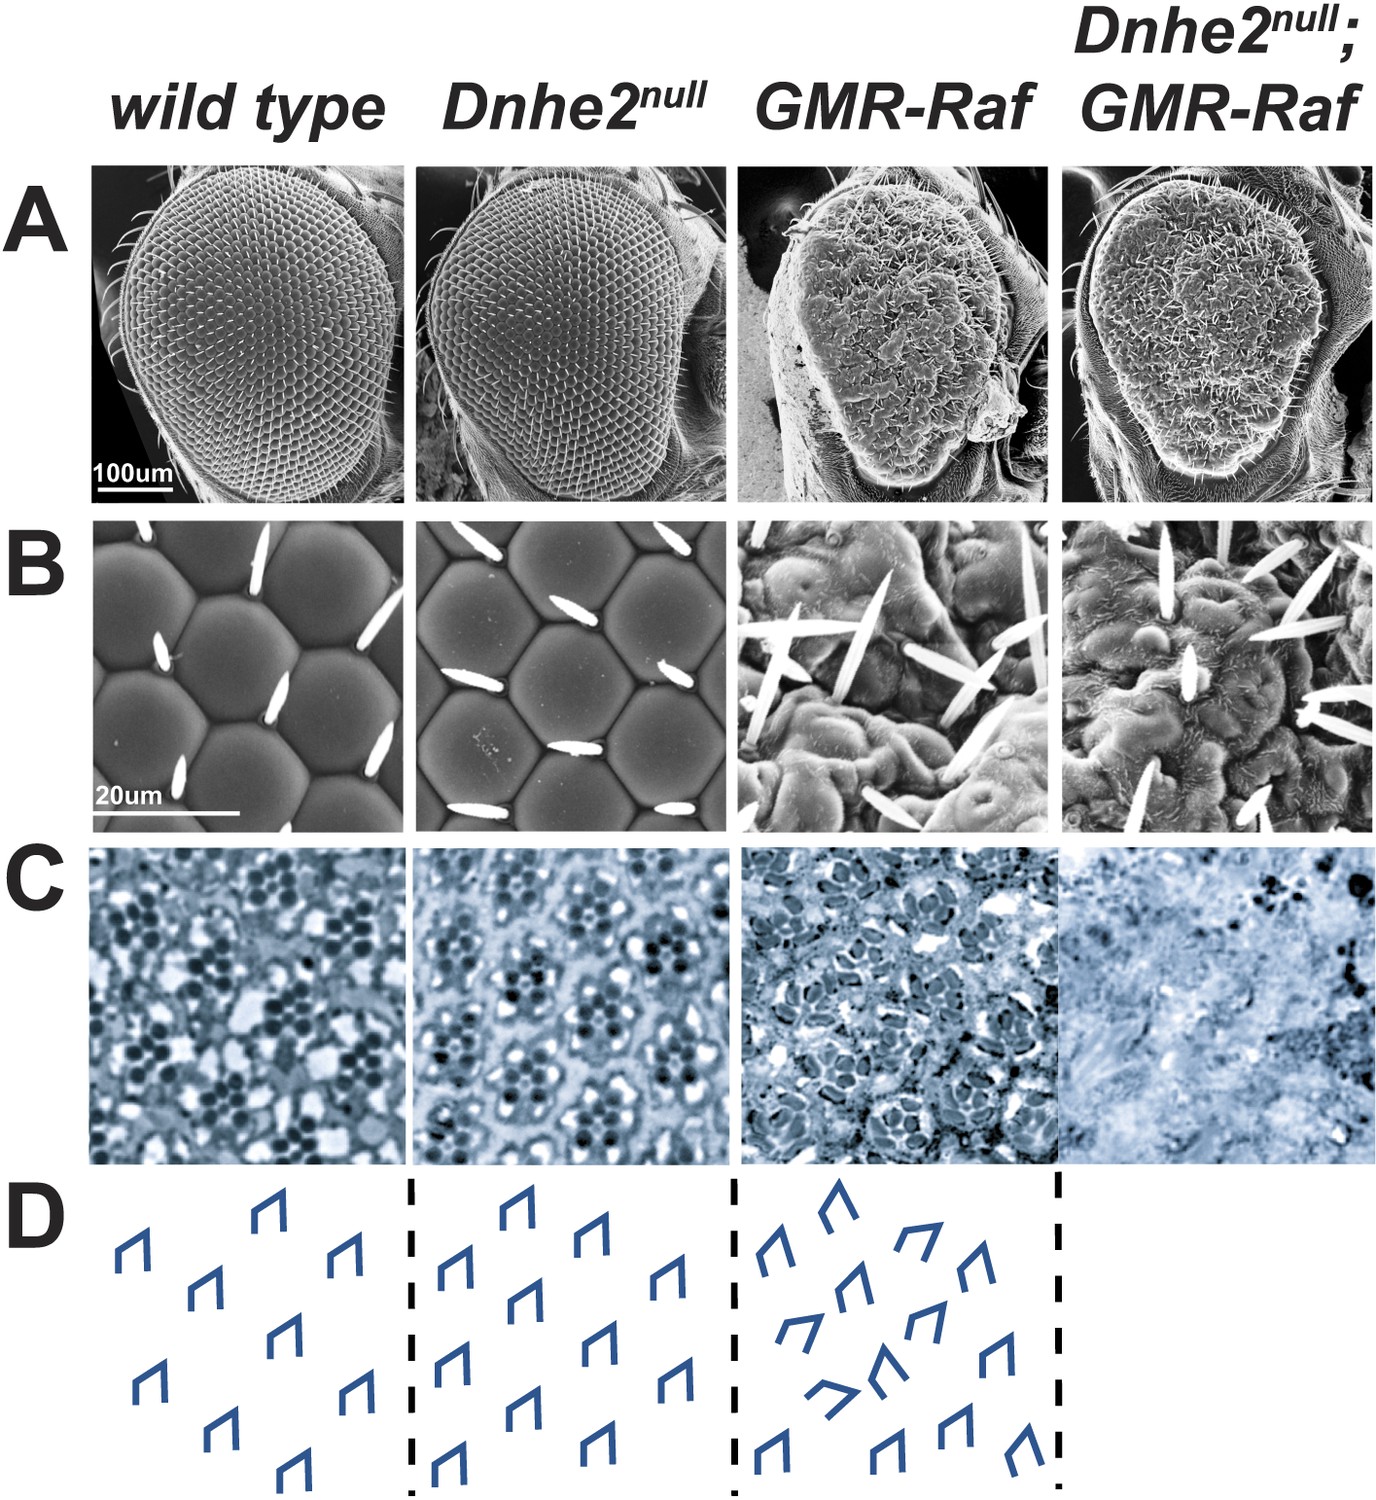
Synthetic lethality with oncogenic Raf and loss of Dnhe2.
(A and B) Scanning electron micrographs of the exterior surface of adult Drosophila eyes. Expression of GMR > Raf causes a rough eye phenotype in the absence and presence of Dnhe2. (C) Histological sections reveal a trapezoidal arrangement of rhabdomeres in wild type and Dnhe2null adult eyes. GMR > Raf eyes show ommatidial rotation defects and abnormal photoreceptor recruitment. Histological sections through Dnhe2null; GMR > Raf eyes show a complete absence of tissue organization consistent with coagulative necrosis. (D) Traced diagrams show ommatidial orientation.
Figure 6

Progressive synthetic defects with oncogenic Raf and loss of Dnhe2.
Phenotypic analyses are shown for the indicated genotypes at third larval instar (wL3) and mid-pupal developmental stages. (A) wL3 eye discs labeled for phospho-Histone3 (green) to indicate dividing cells, and E-cadherin to show adherens junctions (purple). (B) The number of phos-H3 cells posterior to the morphogenetic furrow were counted, and shown as % of wild type (mean ± SEM): w1118 (n = 12), Dnhe2null (83.6 ± 4.2, n = 8), GMR > Raf (121.7 ± 3.3, n = 8), Dnhe2null; GMR > Raf (68.2 ± 3.8, n = 7). (C) In pupal eyes, Elav labels photoreceptor neurons in all genotypes. (D) In 42H apf pupal eyes, adherens junctions are labeled with βeta-catenin, with schematic drawing shown in (E). Individual ommatidia have four central cone cells that are enwrapped by two primary pigment cells. These ommatidial cores are insulated from each other by a single row of interommatidial cells (IOCs). This organization is disrupted with expression of GMR > Raf, and further enhanced with deletion of Dnhe2. (*p < 0.05, **p < 0.01, ***p < 0.001).
Figure 7
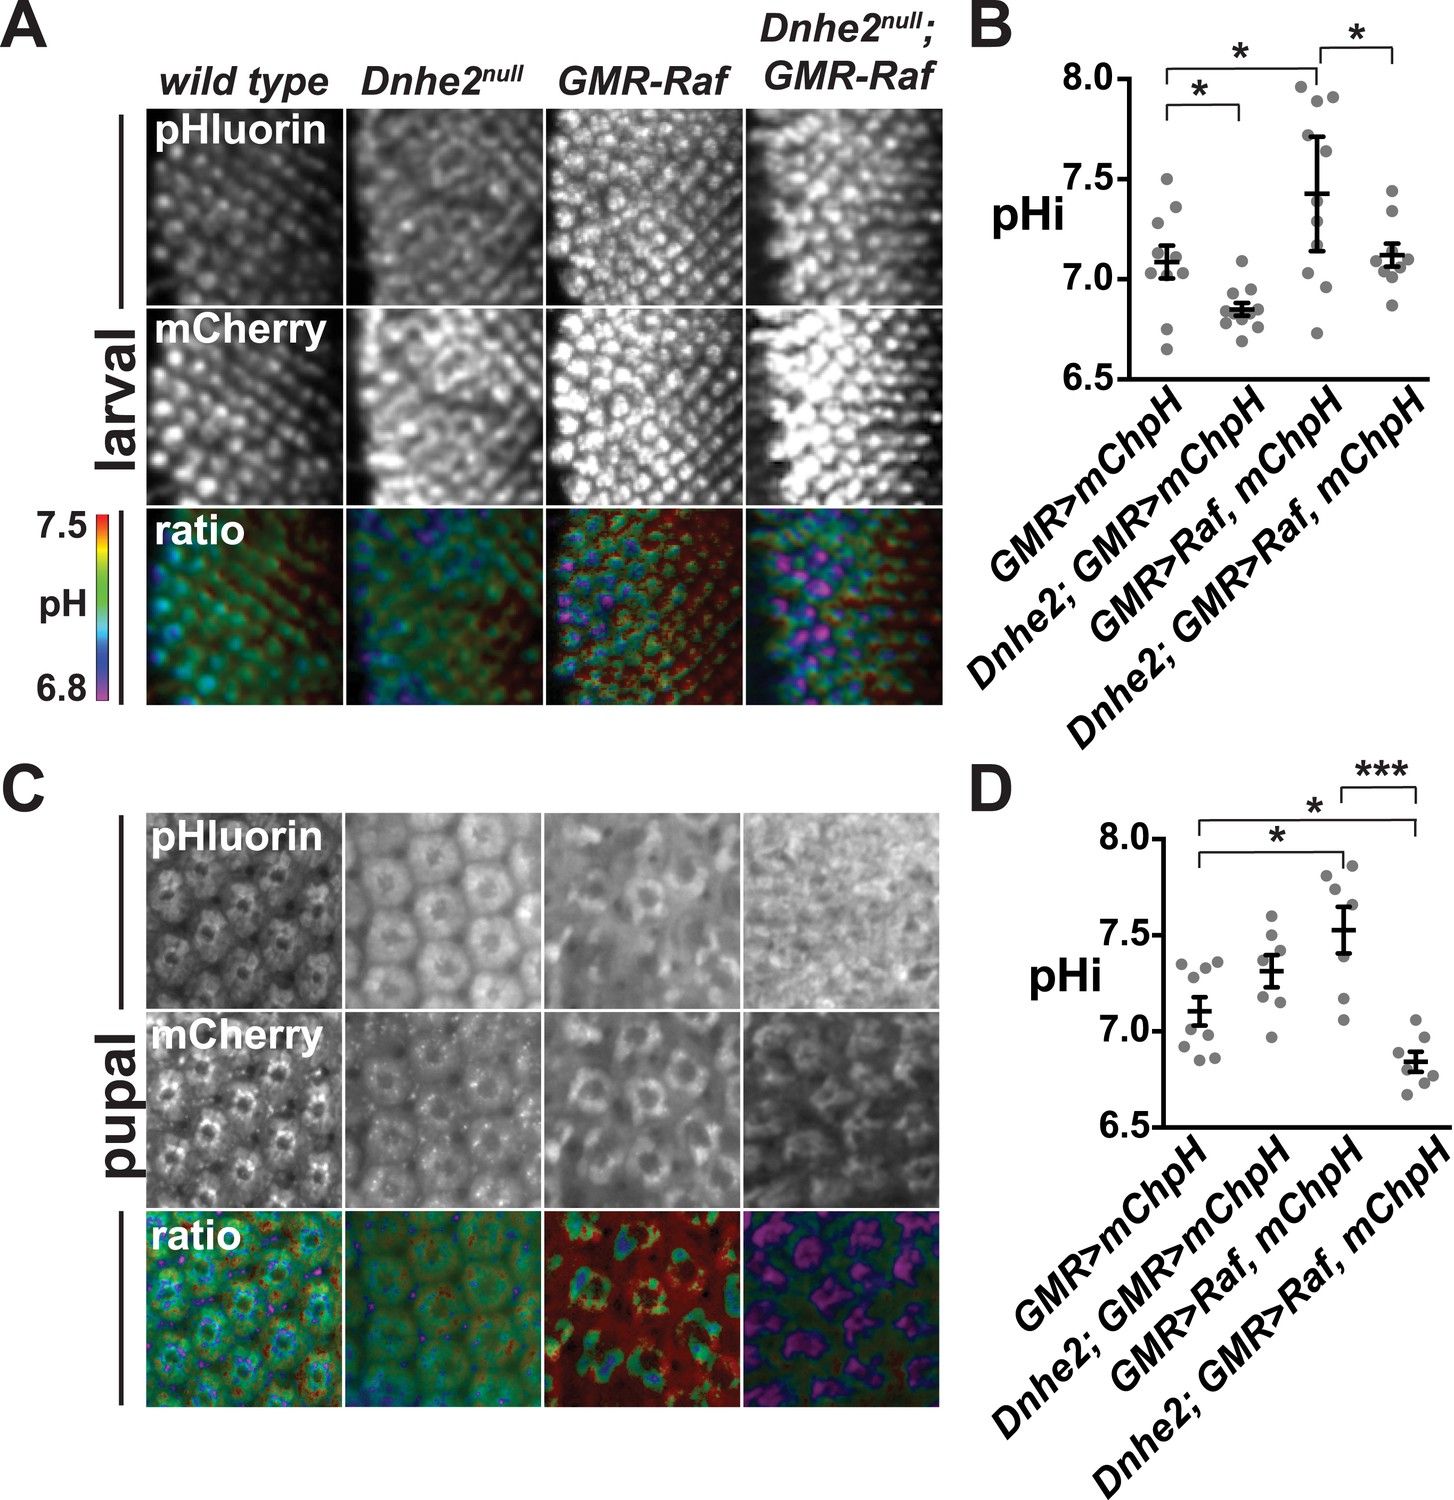
Dnhe2 deletion progressively decreases pHi in Raf-expressing but not wild type cells.
pHi was determined using GMR > mCh-pH. (A) Single confocal slices from live, third larval instar eye imaginal discs showing fluorescence of pHluorin (top row), mCherry (middle row), and ratiometric images (bottom row). Ratiometric images were generated by dividing the fluorescence intensity of pHluorin by mCherry. (B) pHi was calculated from ratio values using a standard curve and graphed (mean ± SEM). Estimated pHi values in third larval instar retinal tissue are: wild type (7.1 ± 0.08, n = 10); Dnhe2null (6.9 ± 0.03, n = 11); GMR > Raf (7.4 ± 0.13, n = 11); Dnhe2null; GMR > Raf (7.1 ± 0.06, n = 9). (C) Single confocal slices from live, pupal eyes, as described above. (D) Estimated pHi values in pupal retinal tissue are: wild type (7.1 ± 0.07, n = 9), Dnhe2null (7.3 ± 0.08, n = 7); GMR > Raf (7.5 ± 0.12, n = 7); Dnhe2null; GMR > Raf (6.8 ± 0.05, n = 7). (*p < 0.05, ***p < 0.001).
Figure 8 with 1 supplement
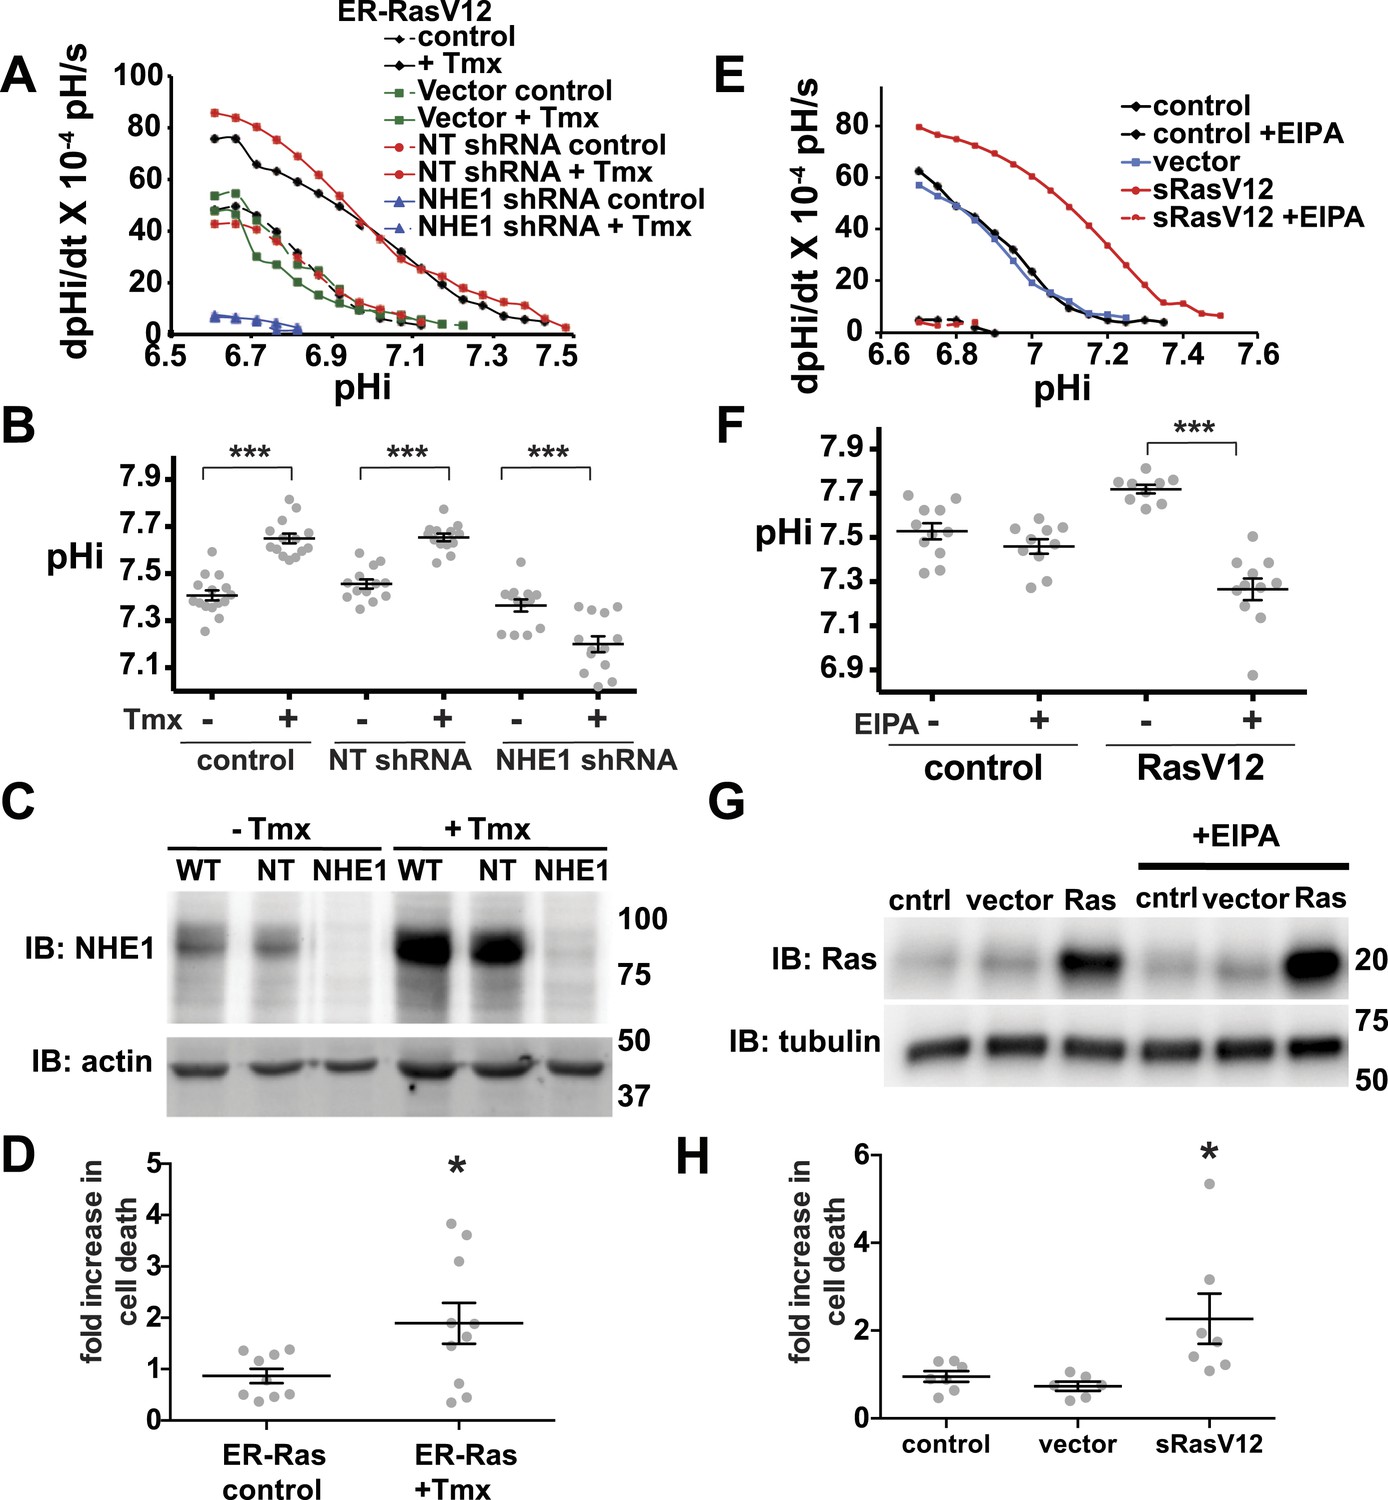
Decreased NHE1 expression or activity with RasV12 expression prevents increased pHi in human MCF10A cells and shows synthetic lethality.
(A) In MCF10A cells expressing ER-RasV12 the rate of pHi recovery from an acid load, an index of H+ efflux, is substantially greater in tamoxifen (Tmx)-treated controls (solid black line) and with non-targeting (NT) shRNA (solid blue line) than in the absence of Tmx (dotted black and blue lines, respectively) or in vector controls (solid and dotted green lines). In NHE1 shRNA cells pHi recoveries are nearly abolished in the absence (dotted red line) or presence (red solid line) of Tmx. (B) Tamoxifen increases steady-state pHi in control (mean ± SEM for all condition: control 7.41 ± 0.02, +Tmx 7.65 ± 0.02) and NT shRNA control (7.45 ± 0.02, +Tmx 7.65 ± 0.02) cells but not in NHE1 shRNA cells (7.36 ± 0.03, +Tmx 7.20 ± 0.03). (C) Expression of NHE1 is increased upon tamoxifen (Tmx) treatment of ER-RasV12 cells. Treatment of cells with NHE1 shRNA decreases NHE1 expression. (D) Cell death, indicated by Annexin V-positive cells is significantly greater with NHE1 shRNA in ER-RasV12 expressing cells (1.9× increase over NT shRNA), but not in control cells (0.87×). (E) The rate of pHi recovery from an acid load is substantially greater in MCF10A cells stably expressing RasV12 (sRasV12, red solid line) compared with control (WT, solid black line) or vector expression (solid blue line). The NHE1 inhibitor EIPA abolishes pHi recoveries in control (dotted black line) and sRasV12 cells (dotted red line). (F) Steady-state pHi is significantly higher in sRasV12 cells compared with control cells. With EIPA treatment, steady-state pHi is significantly lower in sRasV12 (control 7.72 ± 0.02, +EIPA 7.27 ± 0.02) but not in control cells (control 7.53 ± 0.03, +EIPA 7.46 ± 0.03). (G) sRasV12 expressing cells show increased expression of Ras compared to either control or vector cells. Ras expression is unaffected by inhibition of NHE1. (H) Treatment with EIPA induces cell death only in sRasV12 expressing cells (2.3× increase over control), but not in vector (0.73×) or control (0.95×) cells. Sample were pooled from three independent cell preparations (for NHE1 shRNA, two different shRNA constructs were tested in two cell preparations and pooled). (*p < 0.05, **p < 0.01).
Figure 8—figure supplement 1
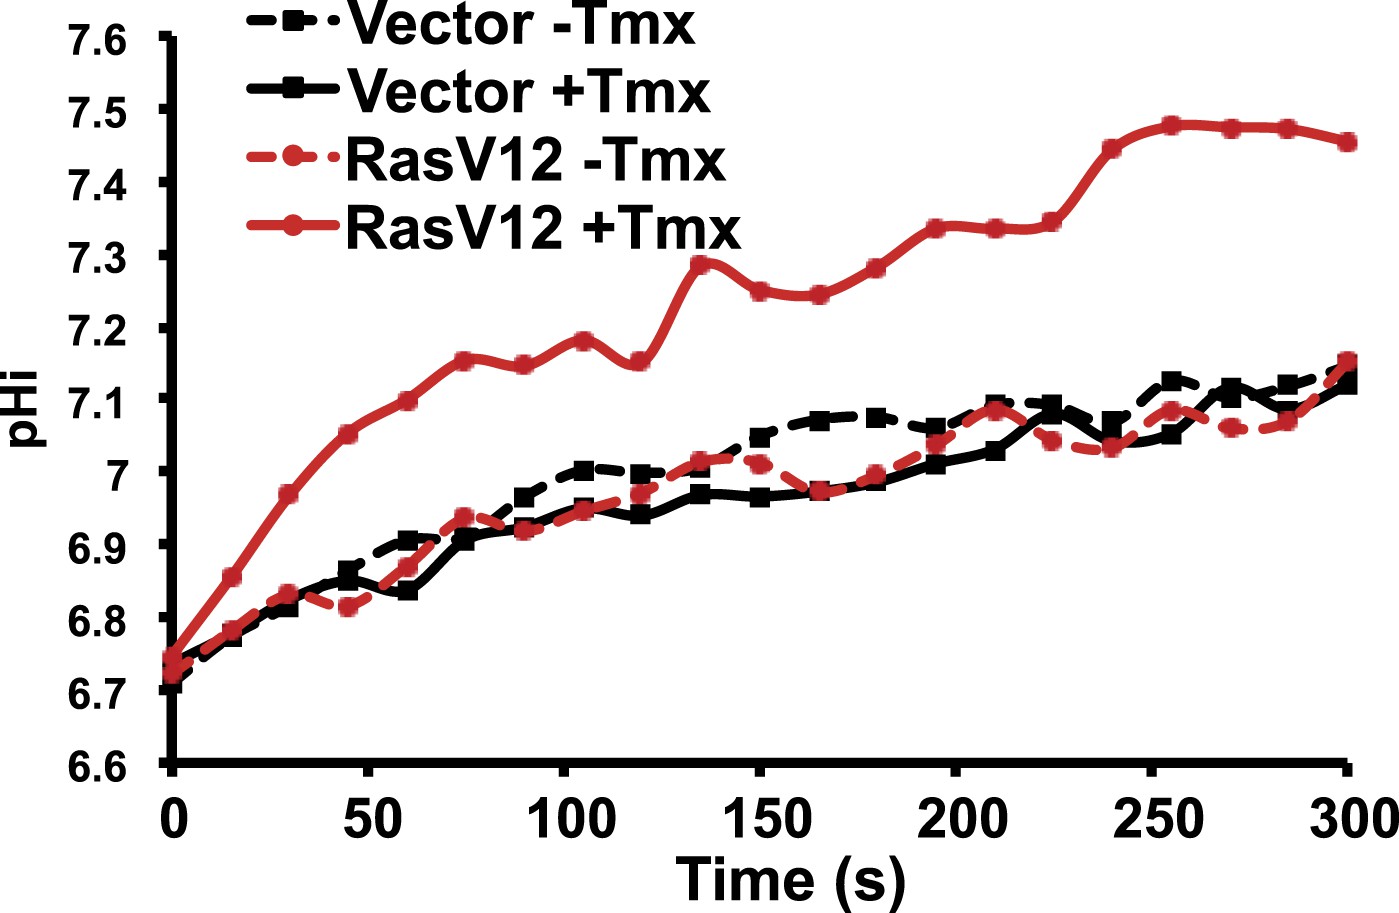
RasV12 expression increases NHE1 activity and pHi.
ER-RasV12 expressing cells show increased NHE1 activity in the presence of tamoxifen (Tmx, solid red line), but not without Tmx (red dotted line). This effect is not seen in vector control cells (black solid and dotted lines).
Figure 9
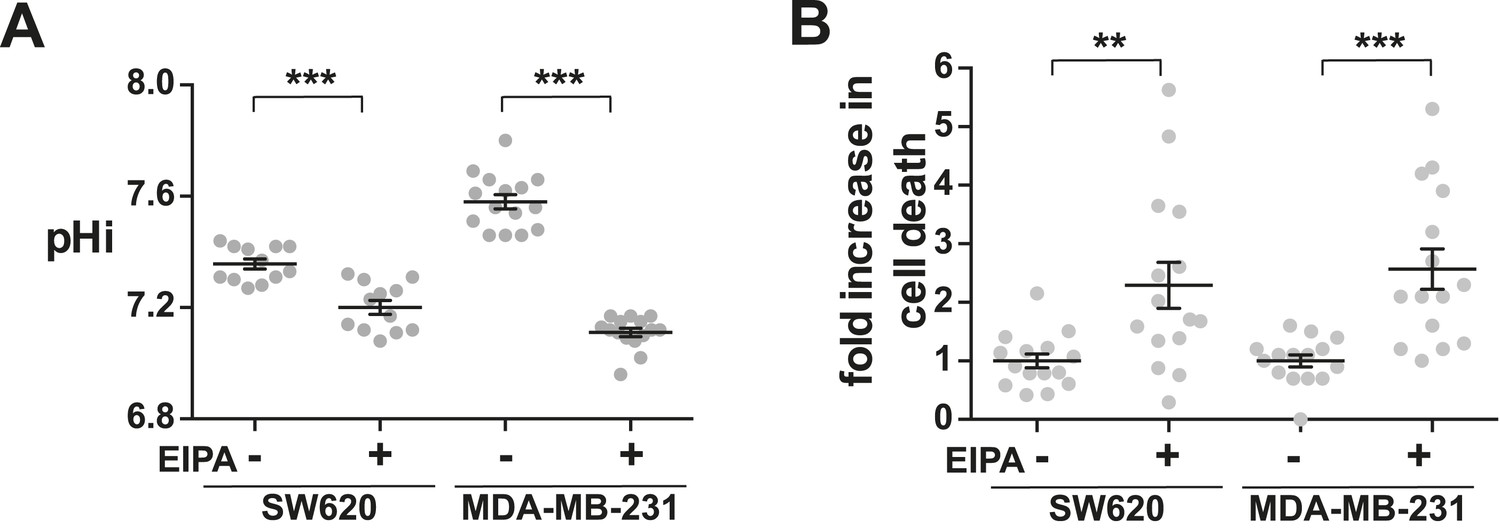
Decreased NHE1 activity in tumor-derived cell lines induces cell death.
(A) pHi is decreased with EIPA treatment in both SW620 metastatic colorectal tumor cells (control 7.36 ± 0.02, +EIPA 7.2 ± 0.03), and MDA-MB-231 metastatic breast cells (control 7.58 ± 0.03, +EIPA 7.11 ± 0.01). (B) Cell death as determined by a trypan blue exclusion assay is also increased in both cell lines with EIPA treatment over control: SW620 2.3×; MDA-MB-231 2.6×. Data are from four or five independent cell preps. (*p < 0.05, **p < 0.01, ***p < 0.001).
Download links
A two-part list of links to download the article, or parts of the article, in various formats.
Downloads (link to download the article as PDF)
Open citations (links to open the citations from this article in various online reference manager services)
Cite this article (links to download the citations from this article in formats compatible with various reference manager tools)
Increased H+ efflux is sufficient to induce dysplasia and necessary for viability with oncogene expression
eLife 4:e03270.
https://doi.org/10.7554/eLife.03270


