Irreversible fate commitment in the Arabidopsis stomatal lineage requires a FAMA and RETINOBLASTOMA-RELATED module
- Stanford University, United States
- Utrecht University, Netherlands
- Howard Hughes Medical Institute, Stanford University, United States
Figures
Figure 1 with 2 supplements

FAMA and RBR physically interact and regulate guard cell division and differentiation.
(A) Schematic of key stages in stomatal development mediated by bHLHs SPCH, MUTE and FAMA. Cell types are labeled as: meristemoid mother cell (MMC), meristemoid (M), stomatal lineage ground cell (SLGC), guard mother cell (GMC), guard cell (GC), pavement cell (PC). (B and C) Expression of FAMA and RBR in GMCs and GCs. Confocal images of 5-days post germination (dpg) cotyledon of FAMAp:GFP-FAMA (B, in green) and RBRp:RBR-CFP (C, in green). Inset in (B) is a fama mutant GMC at 10-dpg. Cell outlines (purple) were visualized with propidium iodide. (D and E) Reduction in RBR level leads to extra divisions in GCs. Confocal images of a co-suppressed RBRp:RBR-CFP line (D) and FAMAp:amiRBR expressing a CDKA1;1 reporter (green) (E). Yellow arrowheads in (D) indicate ectopic cell divisions. Cell outlines (white) were visualized with propidium iodide. (F) ClustalW2-based protein alignment of the LxCxE motif among FAMA relatives. (G and H) FAMA interacts with RBR in vivo and in vitro through its LxCxE motif. Representative images (G, left) and quantified data (G, right; rep: replicate) of Bimolecular Fluorescence Complementation (BIFC) analysis between FAMA and RBR. Pairs of CYCD/CYCDLGK-RBR and FAMA-bHLH93 (Ohashi-Ito and Bergmann, 2006) were used as controls. (H) Yeast two-hybrid interaction assays between FAMA and RBR. (I) Complementation of seedling lethality in fama mutants by FAMALGK (FAMAp:FAMALGK; fama). (J–L) Diversity of GC defects in adaxial cotyledon epidermis of 12-dpg FAMALGK. DIC images of a mature GC showing strong phenotype (J, false red colors indicate different GC units within another) and a broader view of GCs with different defects (K). Key: ectopic asymmetric divisions (arrowheads), new GC units (asterisks), properly spaced divisions and GC units (brackets). Inset shows a lobed GC. (L) Quantitation of different classes of GC defects (cartoons on Y-axis) in FAMALGK at 6, 9 and 12-dpg. Bars represent the percentages of each class over all GCs on adaxial cotyledons. All images are at the same magnification (including insets in B and K). Scale bar, 10 μm.
Figure 1—figure supplement 1
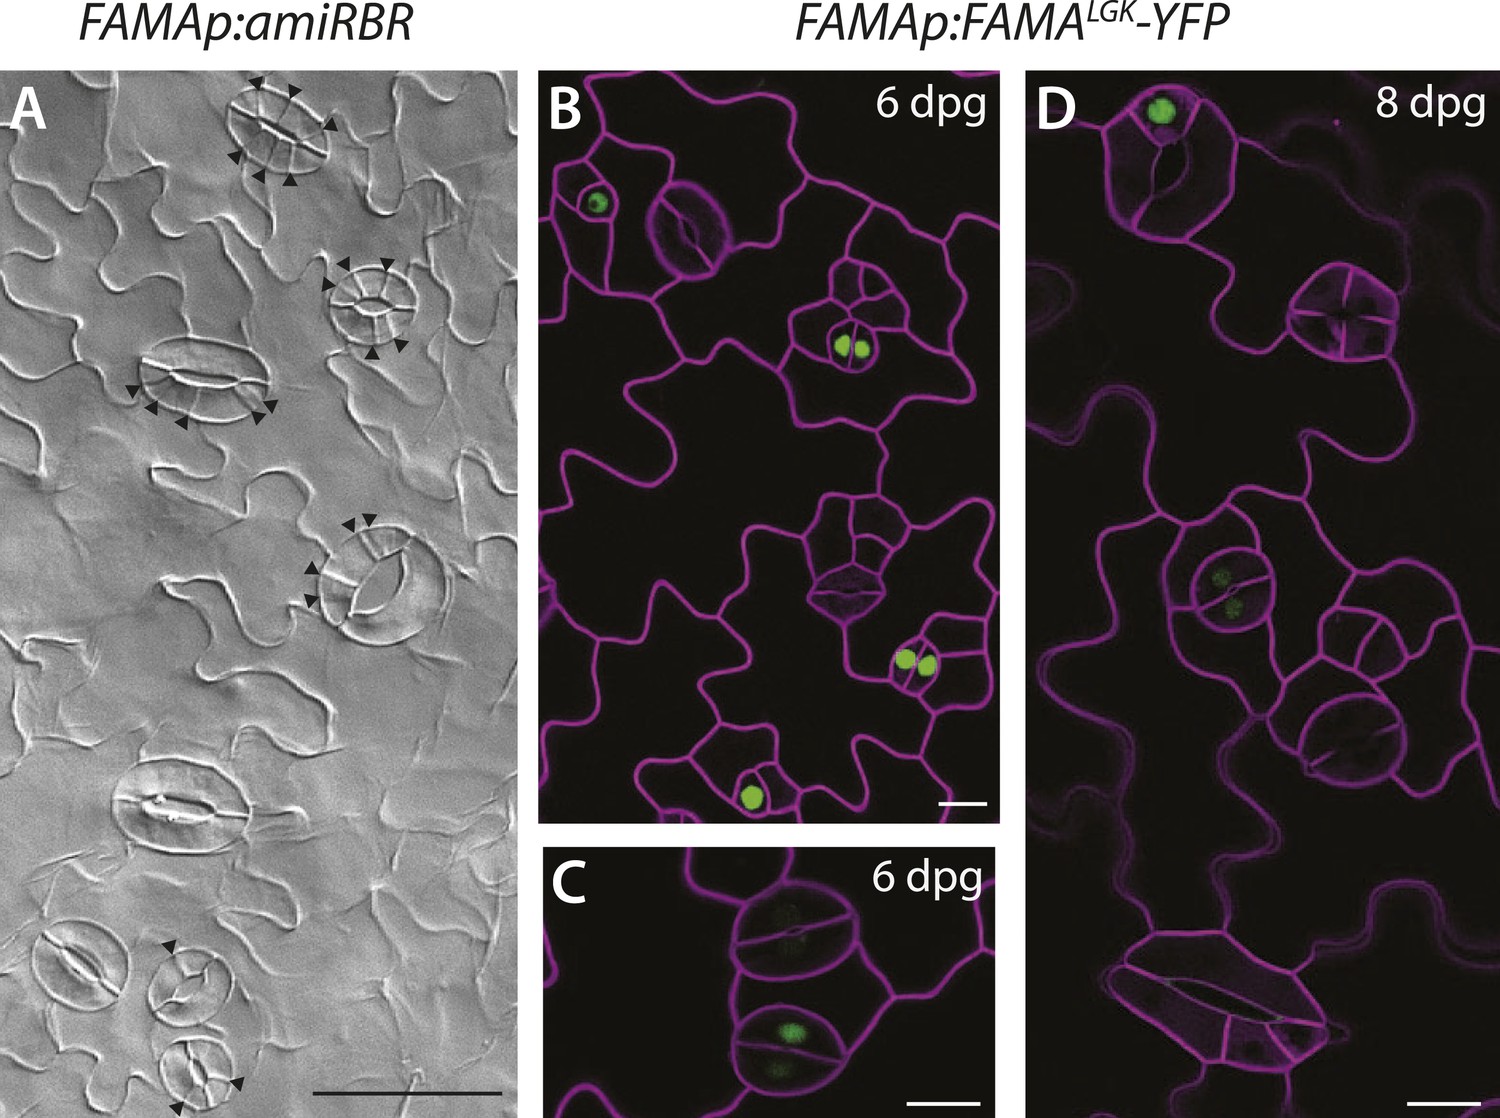
Additional images of FAMA promoter-driven expression of amiRBR and of FAMALGK-YFP.
(A) Reduction of RBR levels under the FAMA promoter (FAMAp:amiRBR) drives ectopic cells divisions exclusively in guard cells (black arrowheads). (B–C) Expression pattern of YFP-tagged FAMALGK (FAMAp:FAMALGK-YFP, green) rescuing the fama mutant is indistinguishable from the wild type in guard cells (GCs) of 6-dpg cotyledons; it first appears in GMCs (single green nuclei), persists into young GCs (pairs of green nuclei), but disappears before GCs mature and make full pores. (D) When ectopic GCs divisions appear, FAMALGK-YFP is absent from most divisions but only appears in cells (top left) that are likely new GMCs based on morphology. Cell outlines (purple) were visualized with propidium iodide. Scale bar in A, 50 μm, scale bars in B–D, 10 μm.
Figure 1—figure supplement 2
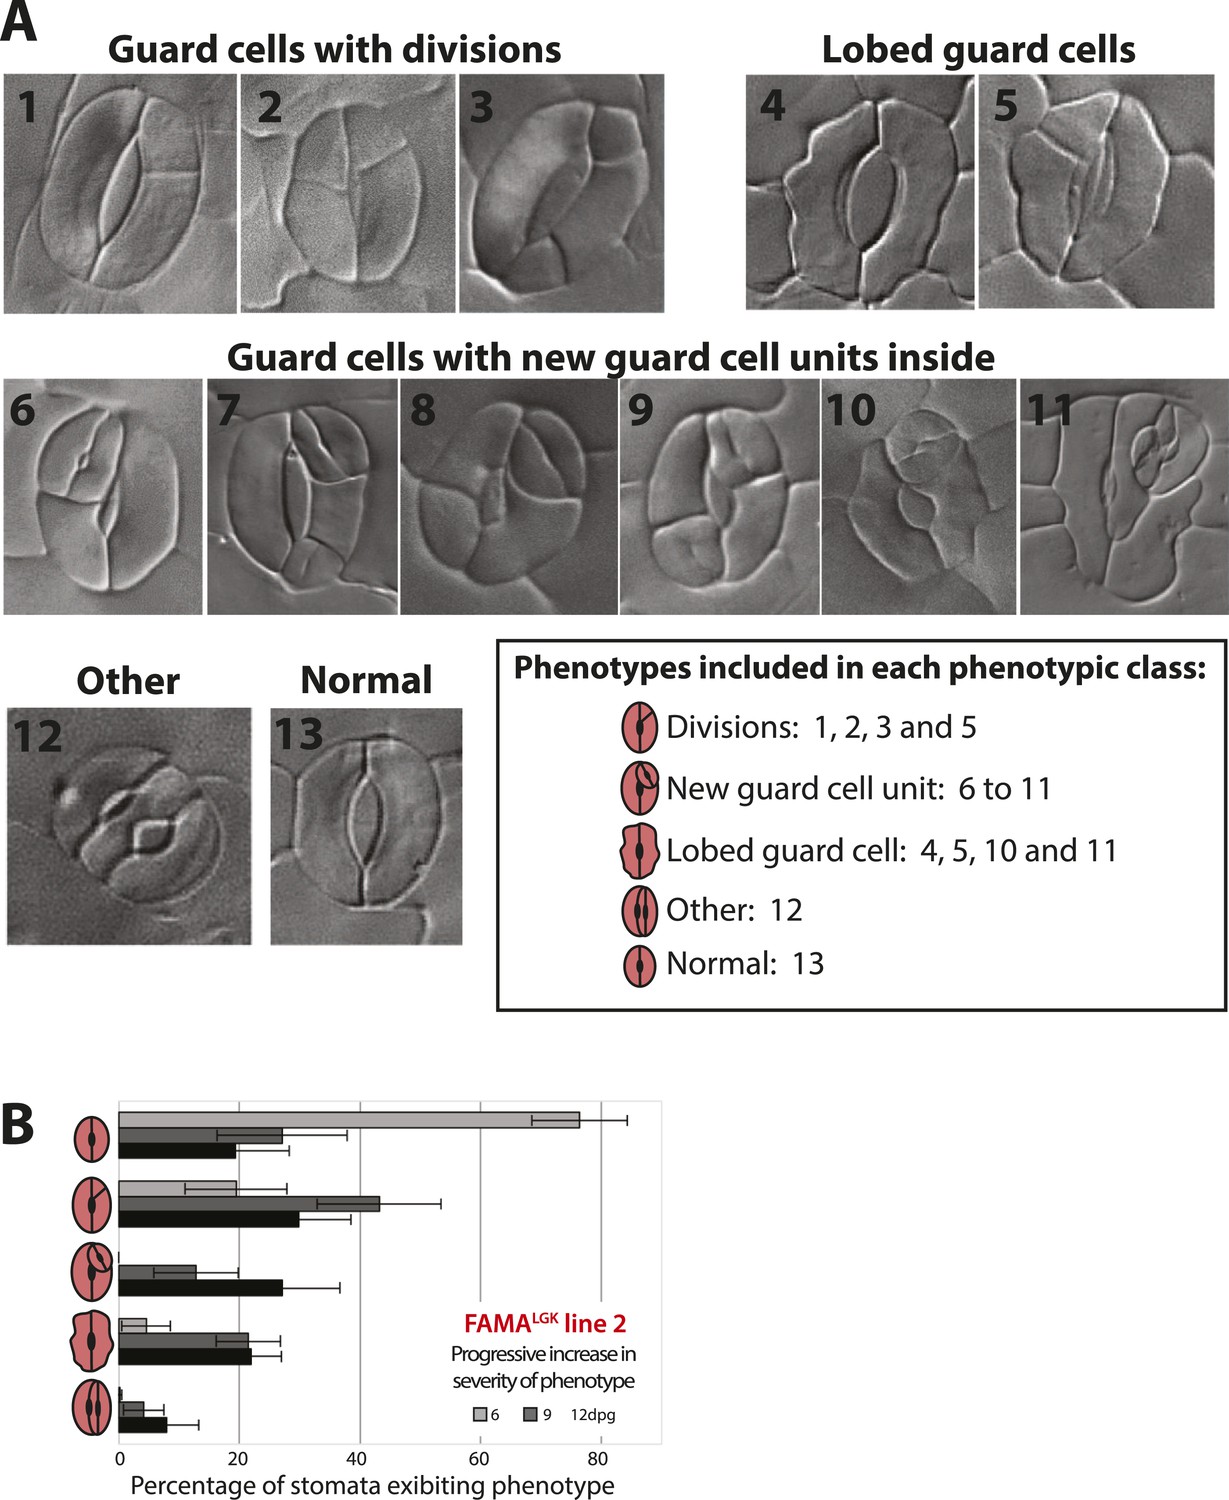
Categorization of guard cell (GC) defects and increase in severity over time in FAMALGK.
(A) DIC images of distinguishable phenotypic defects in GCs in FAMALGK plants (FAMAp:FAMALGK; fama). For quantification analysis, 13 distinct phenotypes (1–13) were identified at appreciable frequencies and grouped into 5 phenotypic classes (box). (B) GC defects of a second, independent FAMALGK line from the one characterized in Figure 1L at 6, 9 and 12-dpg; note similar results between the two lines. Cartoons of GCs on the Y-axis indicate the 5 phenotypic classes scored. Bars represent the average percentages of each phenotypic class over total number of GCs (± SEM) in 0.320 mm−2 DIC images of adaxial cotyledons at the indicated age.
Figure 2 with 3 supplements

Disruption of FAMA-RBR interaction leads to failure of terminal differentiation and reiteration of stomatal lineage divisions and gene expression programs.
(A) Diagram of stages of stomatal development (abbreviated and color-coded as in Figure 1A) and expression window of bHLH transcription factors SPCH, MUTE and FAMA. (B) Characterization of GC defects in FAMALGK plants accompanied by key stomatal reporters. Wild type-looking GCs of FAMALGK plants re-iterate the stomatal developmental pathway, undergo further divisions and exhibit correct orderly expression of stage-specific stomatal regulators and cell cycle genes. Each column from left to right represents a stage in the progression of the stomatal lineage (abbreviated as in Figure 1A). Rows from top to bottom show expression patterns of plasma membrane (PM) marker (row 1), and reporters of SPCH (row 2, beige), MUTE (row 3, orange), FAMALGK (row 4, red) and CDKA1;1 (row 5). Images are of independent GCs of adaxial cotyledons at 6, 9 or 12-dpg. (C) Expression of each marker (rows 1 to 5) in GCs that underwent amplifying or spacing divisions. (D) Guard cells exhibiting pavement cell-like lobed growth with no divisions or expression of stomatal and cell cycle reporters. Cell outlines (purple) were visualized with propidium iodide or ML1p:mCherry-RCI2A. Autofluorescence of chloroplasts (blue spheres) may be visible in some images. All images are at the same magnification. Scale bar, 10 μm.
Figure 2—figure supplement 1
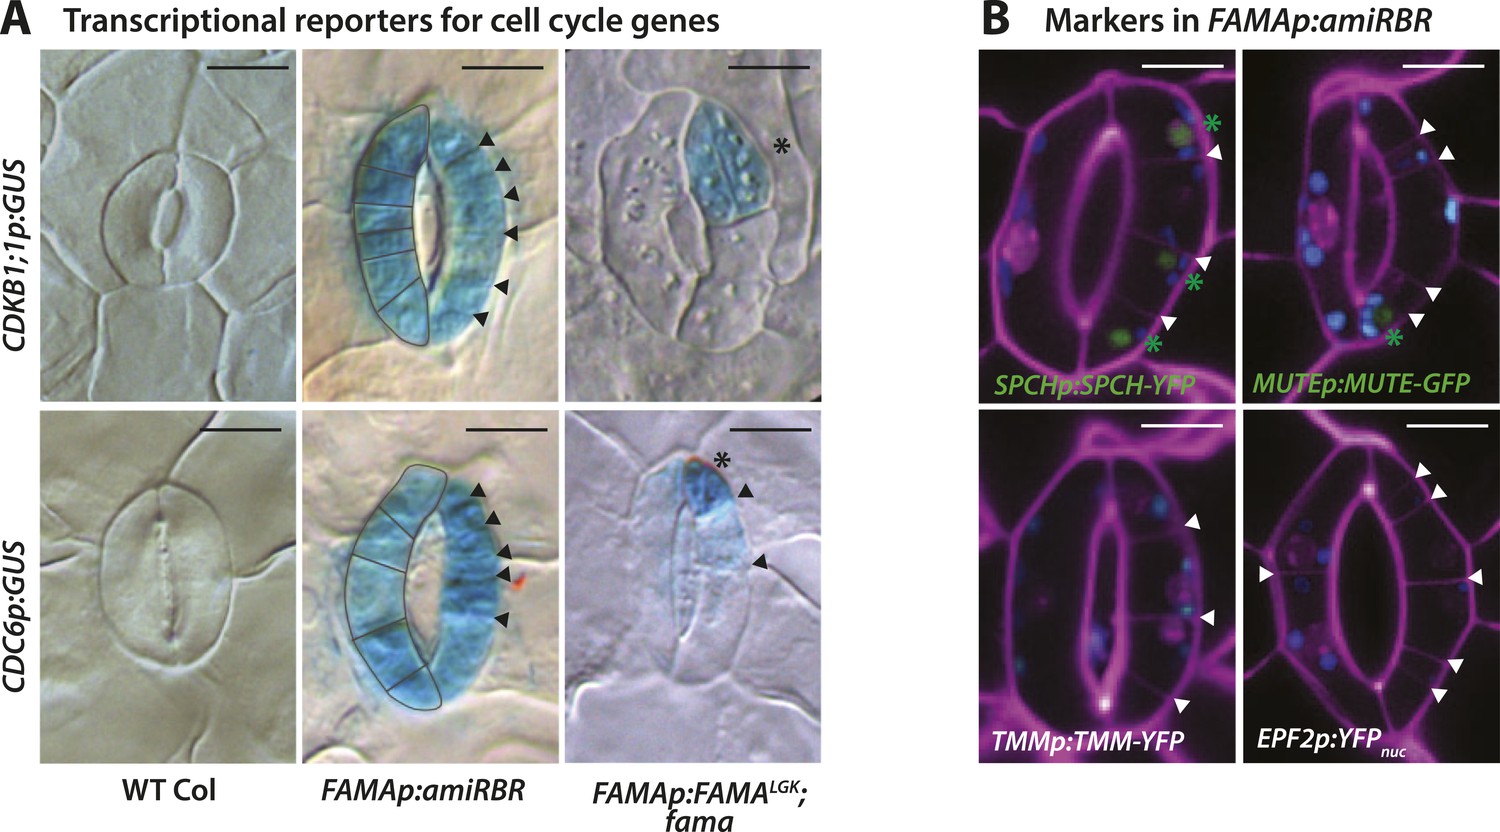
Expression of cell cycle and stomatal reporters in FAMALGK plants (FAMAp:FAMALGK;fama) and amiRBR (FAMAp:amiRBR) mutants and examples of timelapse images for SPCH and MUTE markers.
(A) GUS staining of transcriptional reporters for cell cycle genes CDKB1;1 and CDC6 (rows) in WT Col (left column), amiRBR (middle), and FAMALGK plants (right column). Note that the pattern and levels of expression differ between the RBR knockdown line (amiRBR) and when the interaction between FAMA and RBR is disrupted (FAMALGK). In the amiRBR line, CDKB1;1 and CDC6 are strongly expressed in both GCs, each of which displays ectopic cell divisions (outline in left guard cell and arrowheads in the right guard cell). Broad expression of CDKB1;1 and CDC6 is consistent with RBR's function as a direct repressor of the transcription factor E2F and its cell cycle target genes required for the G1 to S-phase transition (Gutzat et al., 2012). In FAMALGK plants, however, CDKB1;1 and CDC6 are restricted to only some stomatal cell divisions (stars mark new GCs and arrows mark amplifying ACDs). Expression of CDKB1;1 and CDC6 are likely consequences of regulated cell divisions as the mutant GCs progress through the stomatal lineage. (B) Confocal images of stomatal lineage reporters in GCs of amiRBR. Cell outlines are visualized with propidium iodide (purple). Arrowheads correspond to ectopic cell divisions. Of the reporters tested, SPCH and MUTE are weakly and infrequently seen (<20% of GCs) and only in GCs with many ectopic divisions (green asterisks). TMM and EPF2, however, were not detectable. Small blue disks visible in these cells are chloroplasts. Scale bar, 10 μm.
Figure 2—figure supplement 2
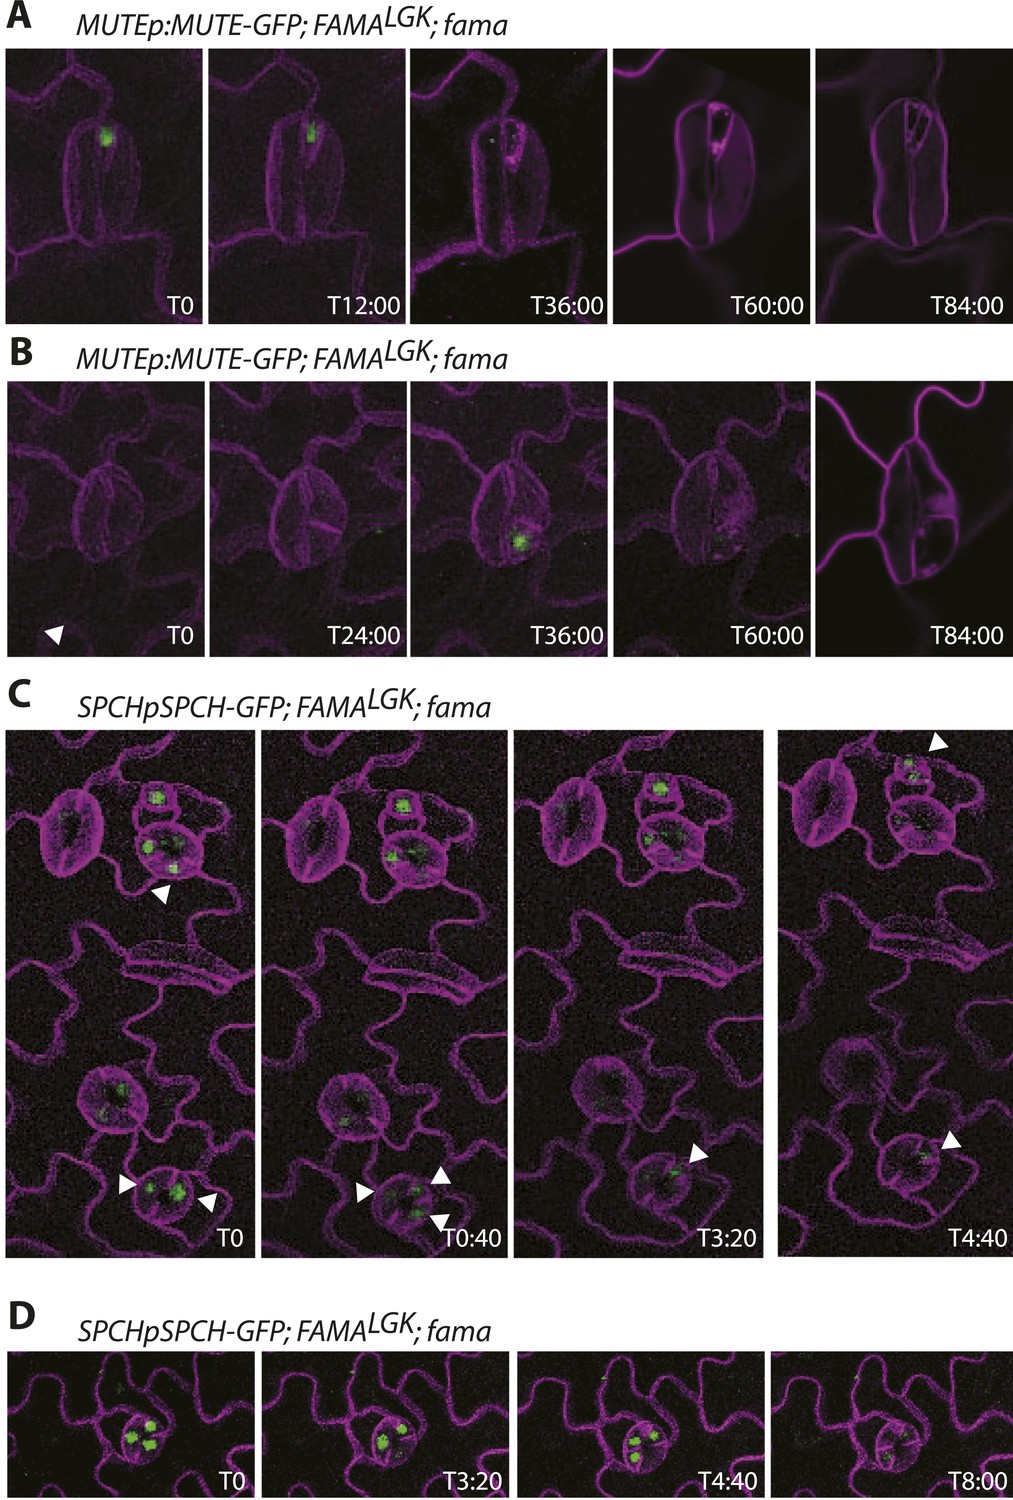
Timelapse imaging of cell fate reporters in FAMALGK lines.
(A–B) Examples of MUTE expression in reprogrammed guard cells. MUTE expression always appears after an asymmetric division and before a symmetric division to create a new guard cell pair. (C–D) Examples of SPCH expression. SPCH appears before divisions, persists after division in both daughters, but then becomes undetectable in one daughter (white arrowheads track expressing cells in C). SPCH expression has disappeared before cells undergo symmetric divisions to create the new guard cell pair. All images are from abaxial cotyledons placed in the timelapse imaging chamber at 6 days post germination. Time relative to first panel image in hours:minutes is indicated in the bottom right corner of each image. Because development is asynchronous, T0 is a different absolute time for each montage.
Figure 2—figure supplement 3
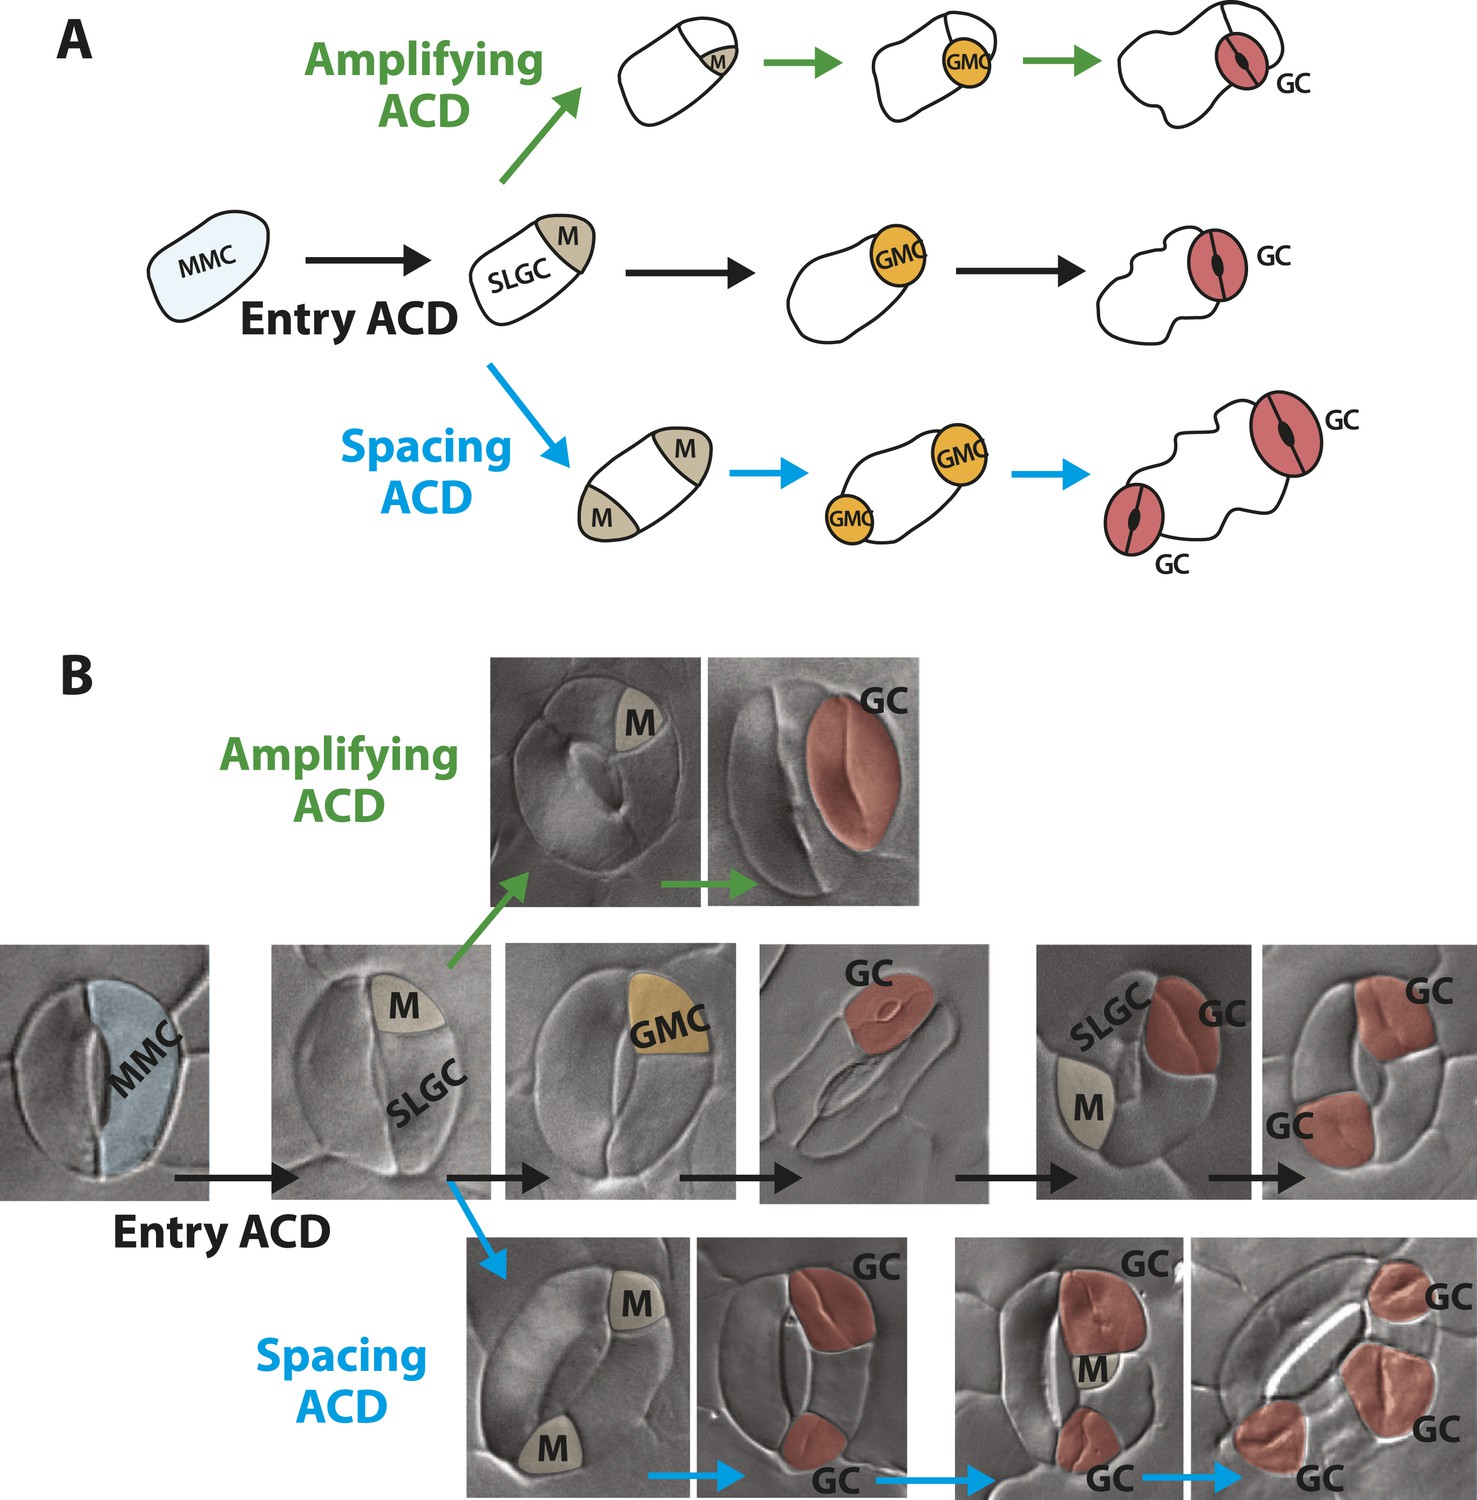
Guard cells in FAMALGK plants reiterate the stomatal developmental pathway and undergo stereotypic stomatal asymmetric cell divisions that generate the diversity in phenotype.
(A) Diagram of three types of asymmetric cell division (ACD) in the stomata lineage. Entry division (black) of a meristemoid mother cell (MMC) initiates the lineage and results in the formation of a meristemoid (M) and a stomatal lineage ground cell (SLGC). Amplifying division (green) denotes a subsequent ACD of a meristemoid. Spacing division (blue) is the ACD of a SLGC, where the newly formed M is spaced away from existing M, guard mother cell (GMC) or guard cells (GCs). (B) GCs of FAMALGK plants re-enter the stomatal lineage and can undergo the three types of stomatal ACD. DIC images of GCs from FAMALGK plants illustrating the entry (black), amplifying (green) and spacing (blue) divisions and their subsequent progression in the lineage (left to right). Images were false colored to indicate MMC (light blue), M (beige), GMC (orange), GC (red).
Figure 3
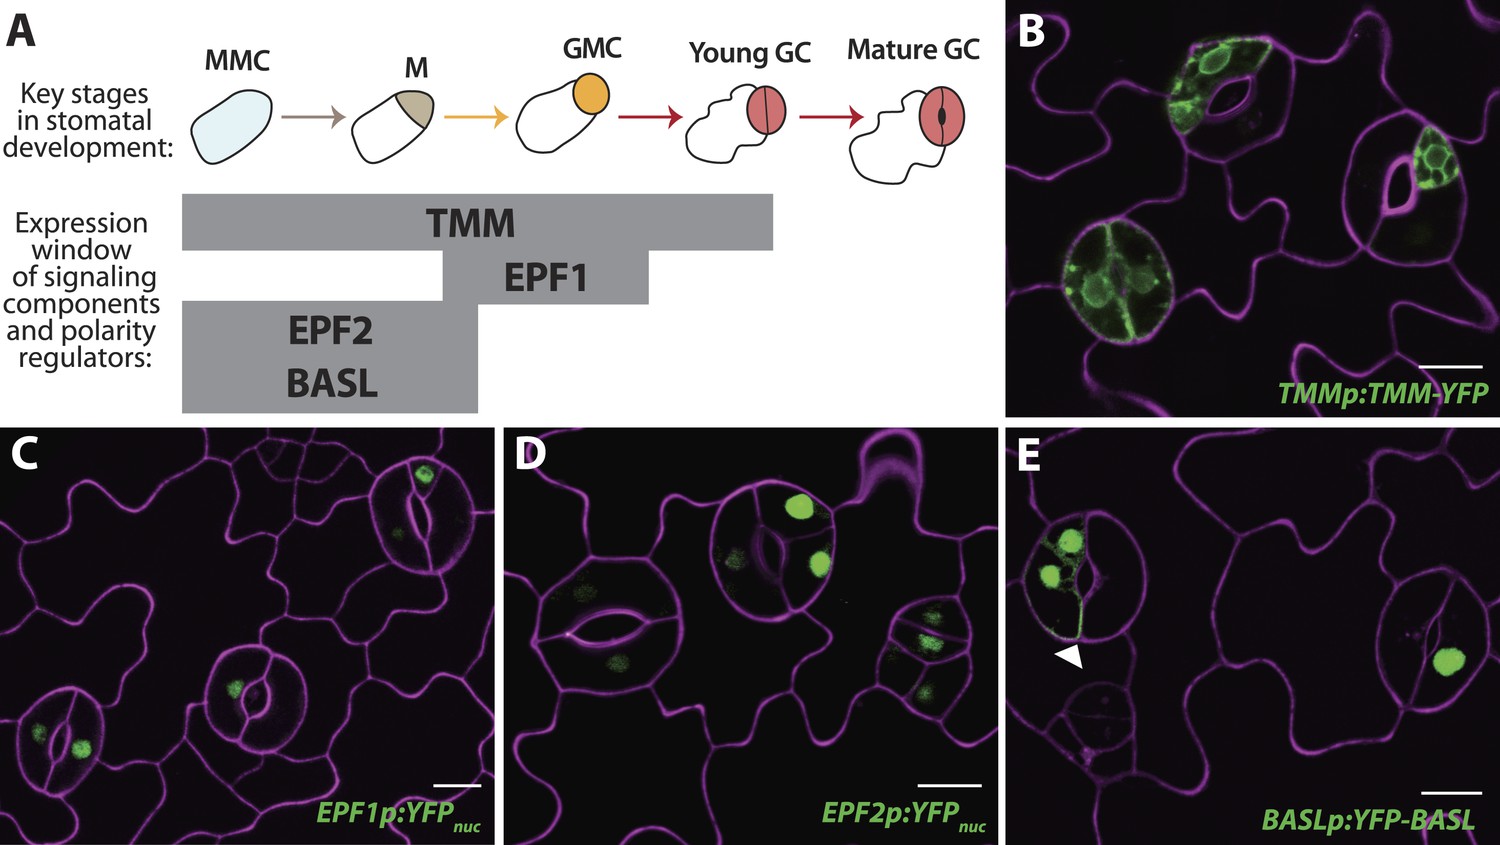
Reprogrammed FAMALGK guard cells re-express early stomatal signaling components and polarity regulators.
(A) Diagram of stages of stomatal development (abbreviated as in Figure 1A) and expression window of signaling and polarity regulators indicated as bars spanning lineage stages. Re-expression of TMMp:TMM-YFP (B), EPF1p:YFPnuc (C), EPF2p:YFPnuc (D), and BASLp:YFP-BASL (E) in GCs from adaxial cotyledons of 6-dpg FAMALGK seedlings. Arrowhead in (E) indicates the polarized crescent characteristic of BASL in asymmetrically dividing cells. Cell outlines (purple) were visualized with propidium iodide. Scale bar, 10 μm.
Figure 4
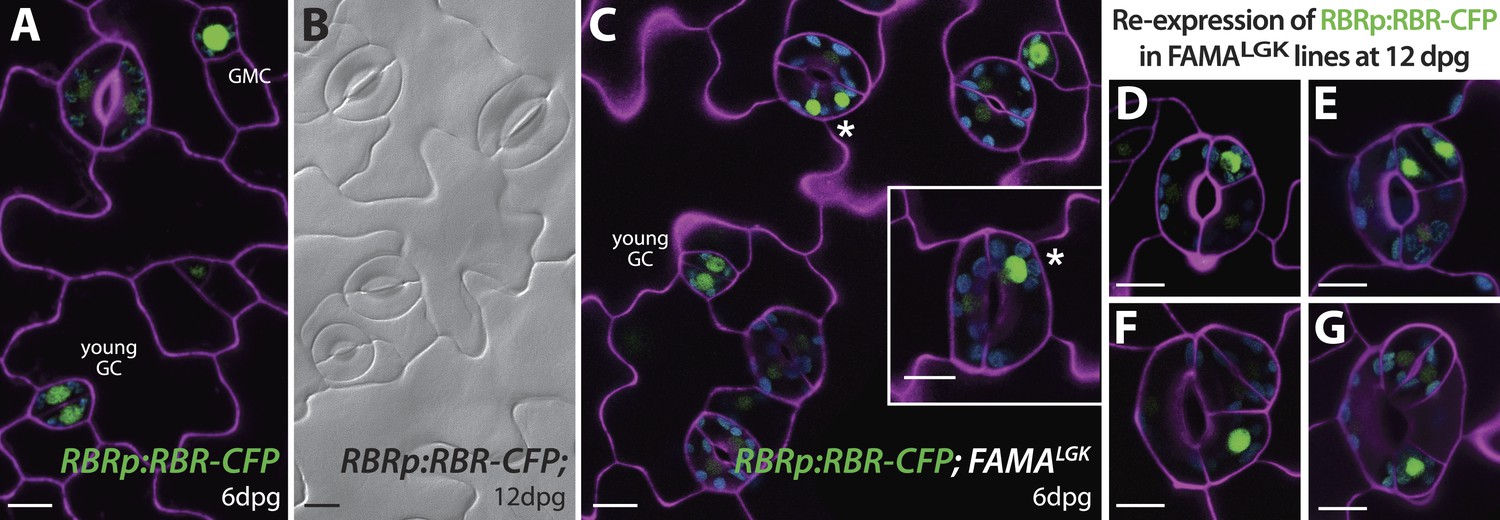
Expression of RBRp:RBR-CFP reappears in reprogramed FAMALGK guard cells.
RBRp:RBR-CFP (green) is expressed in GMCs and young GCs, but expression in WT does not confer any guard cell phenotype at 6-dpg (A) or 12-dpg (B). Reprogrammed guard cells in FAMALGK plants re-express RBR in specific cells (green) as they recapitulate the stomatal development pathway and undergo precursor divisions. Meristemoid mother cell (MMC) and meristemoid (M) divisions (asterisks) captured at 6-dpg (C) and GMC and spacing asymmetric cell division (ACD) captured at 12-dpg (D–G). Cell outlines in confocal images are visualized with propidium iodide (purple). Small disks visible in color in these cells are chloroplasts. Scale bar, 10 μm.
Figure 5 with 4 supplements
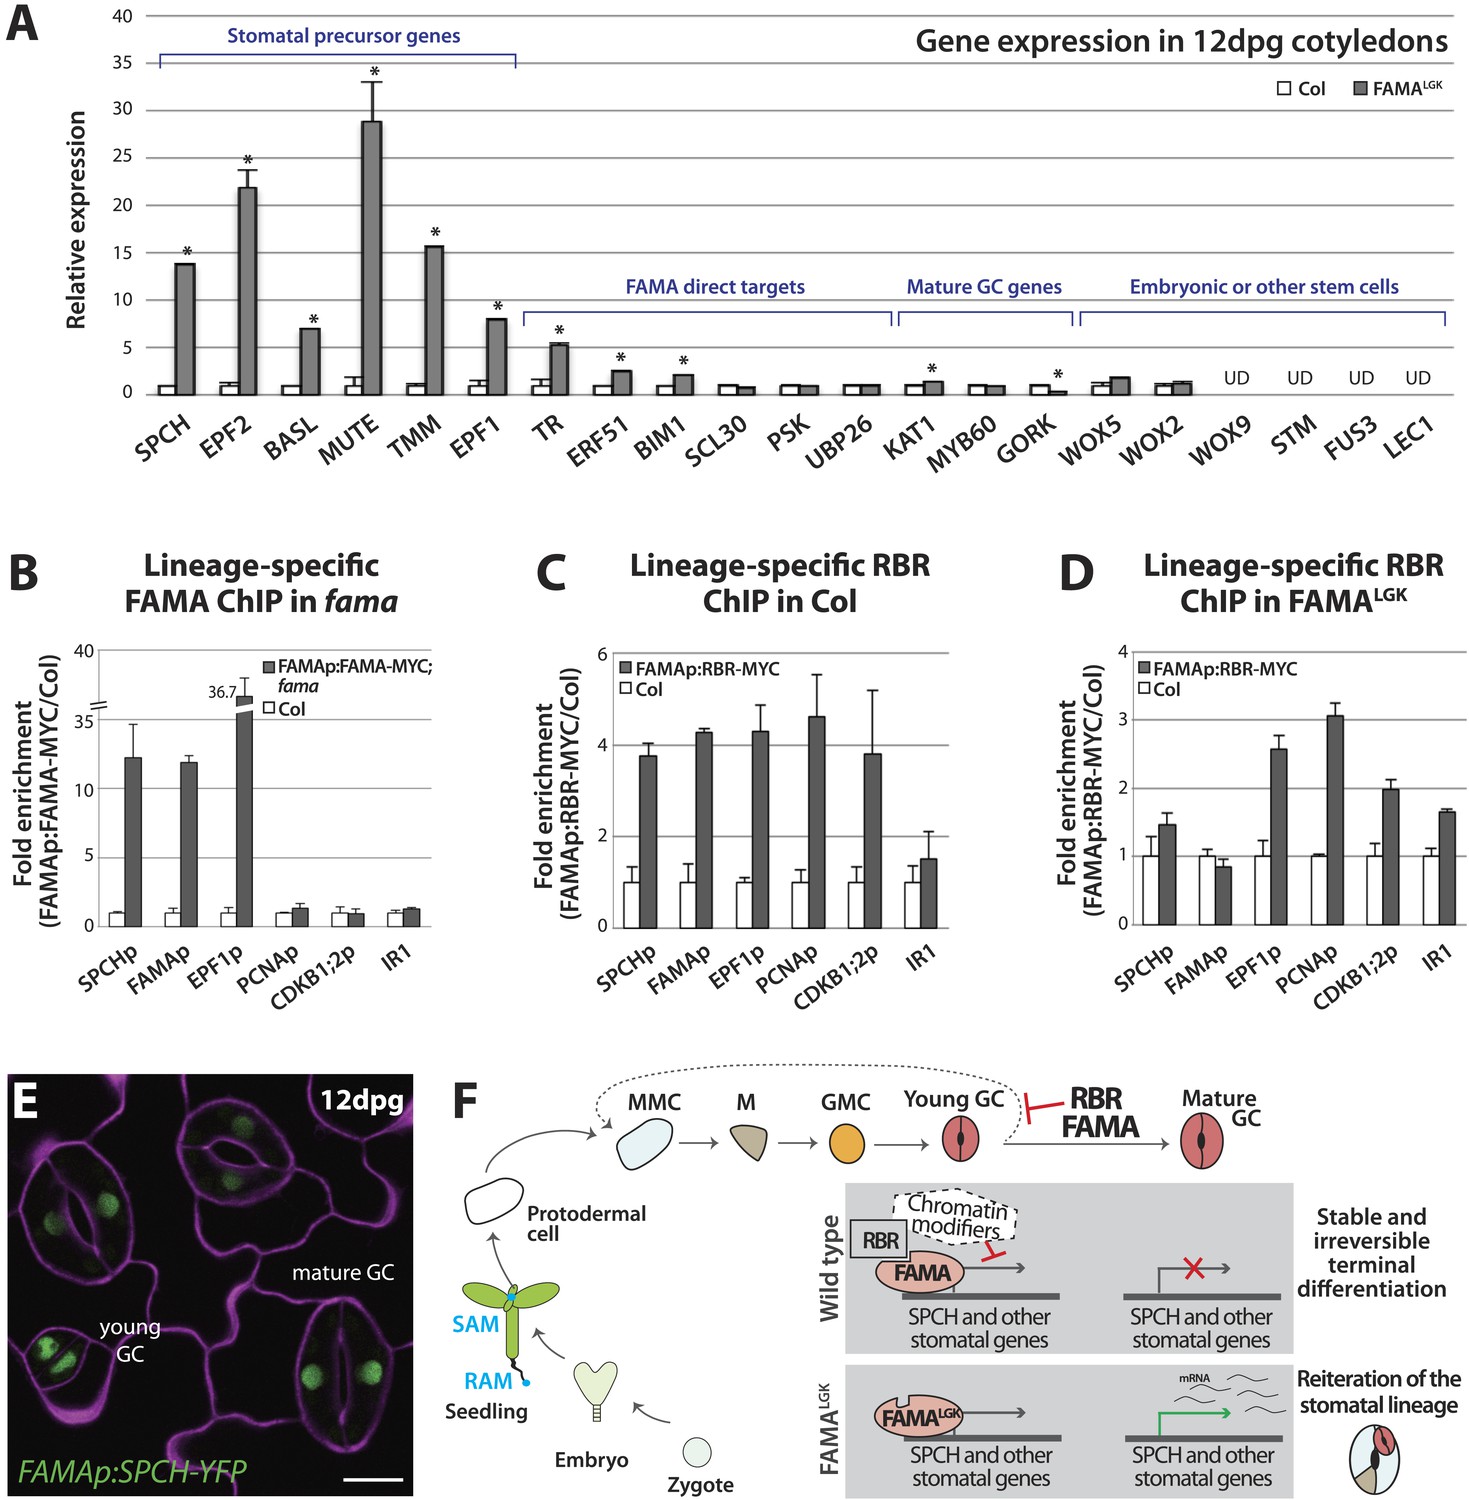
Terminal differentiation of guard cells may be mediated by FAMA-guided recruitment of RBR to suppress stomatal regulatory genes.
(A) Expression analysis in mature cotyledons (12-dpg) of FAMALGK and wild type (Col) by quantitative RT-PCR. Signals were normalized to ACTIN2 and then to Col. Values shown are means ± SEM. UD, undetected. Asterisks indicate significant difference (Student's t test, * p < 0.05). (B–D) Binding of FAMA and RBR to regulatory regions of stomatal genes. ChIP assays were performed with FAMAp:FAMA-MYC in fama (B), FAMAp:RBR-MYC in Col (C), and FAMAp:RBR-MYC in FAMALGK (FAMAp:FAMALGK;fama) (D) using an anti-Myc antibody as in (Lau et al., 2014). ChIPed DNA was quantified by qPCR with primers specific to the indicated gene promoters or the negative control region, IR1 (Cruz-Ramirez et al., 2012). Input-adjusted signals were normalized to Col. Values are means ± SEM. (E) FAMA promoter-driven expression of SPCH in wild type is not sufficient to reprogram guard cells to FAMALGK phenotype. Confocal image of FAMAp:SPCH-YFP (green) in 12-dpg cotyledon visualized with propidium iodide (purple). Scale bar, 10 μm. (F) The stomatal lineage represents a stem-cell like lineage that is distinct from other stem-cell like compartments in the shoot, root or embryo. The FAMA-RBR module maintains terminal differentiation of guard cells (GCs) through repression of the early stomatal lineage genes, likely made permanent by chromatin modification. In FAMALGK plants, RBR is no longer recruited to SPCH and other stomatal lineage gene promoters allowing inappropriate re-expression of these genes and subsequent reiteration of the stomatal development pathway.
Figure 5—figure supplement 1
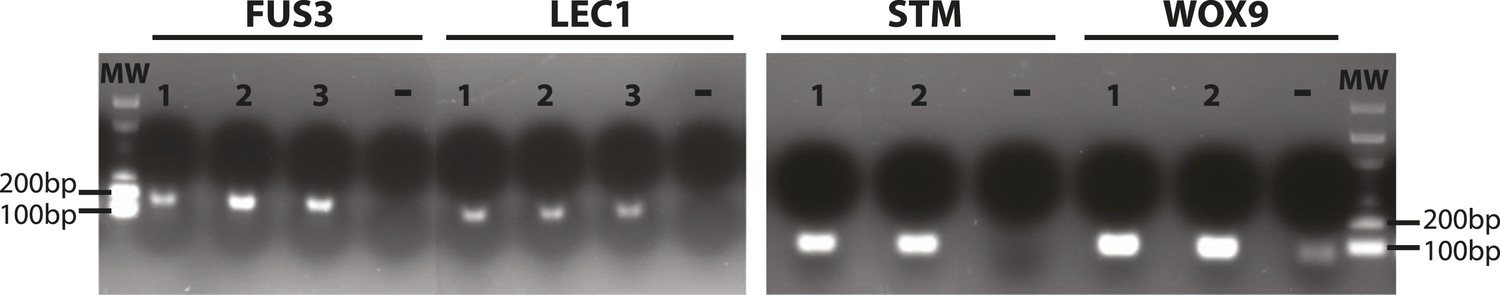
Validation of primers for the stem cell markers FUS3, LEC1, STM and WOX9.
RT-PCR reactions for RNA extracted from immature siliques of Arabidopsis. Target size of the amplified products is indicated in Supplementary file 1. Lanes: molecular weight DNA ladder (MW), independent RNA samples (1, 2, 3), negative controls (−). Gel was stained with ethidium bromide.
Figure 5—figure supplement 2
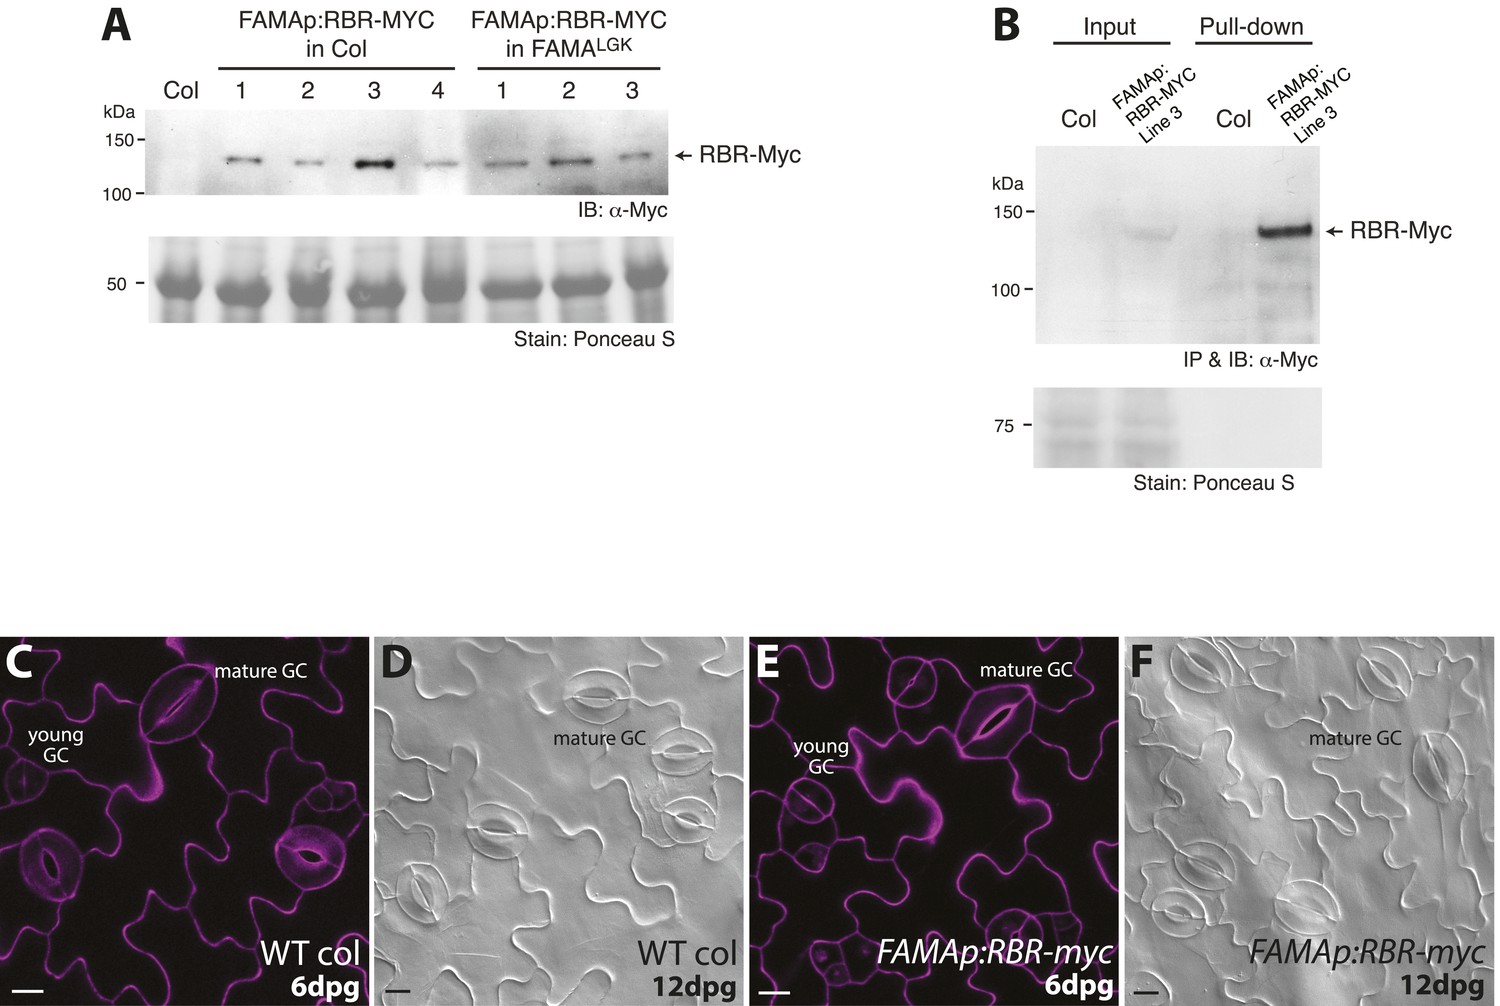
Generation of transgenic lines expressing Myc-tagged RBR driven by FAMA promoter, in vivo immunoprecipitation of the RBR-Myc protein and phenotypic analysis of the transgenic lines.
(A) Western detection of RBR-Myc in transgenic plants harboring the FAMAp:RBR-MYC construct in either Col (lines 1–4) or FAMALGK (lines 1–3) backgrounds. Total protein was extracted from 5-dpg seedlings of the indicated genotypes and probed with α-Myc antibody. Recombinant RBR-Myc has a calculated M.W. of 128.5 kDa. (B) In vivo pull-down assay of stomatal lineage expressed RBR-MYC from transgenic plants. Total soluble protein from Col and FAMAp:RBR-MYC (in Col) was incubated with an anti-Myc antibody. Precipitated samples were probed with the same antibody in Western analysis. IB: Immunoblot, IP: Immunoprecipitation. (C–F) Confirmation that expression of FAMAp:RBR-MYC does not alter guard cell development. (C–F) Confocal images of 6-dpg cotyledons and DIC images of 12-dpg cotyledons of wild type and FAMAp:RBR-MYC plants. Transgenic plants harboring the FAMAp:RBR-MYC construct (E–F) do not exhibit changes in GC divisions (neither fewer, nor more divisions are found) and are indistinguishable from wild type (C–D) at 6 and 12-dpg. Cell outlines (purple) in confocal images were visualized with propidium iodide. All images are at the same magnification. Scale bar, 10 μm.
Figure 5—figure supplement 3
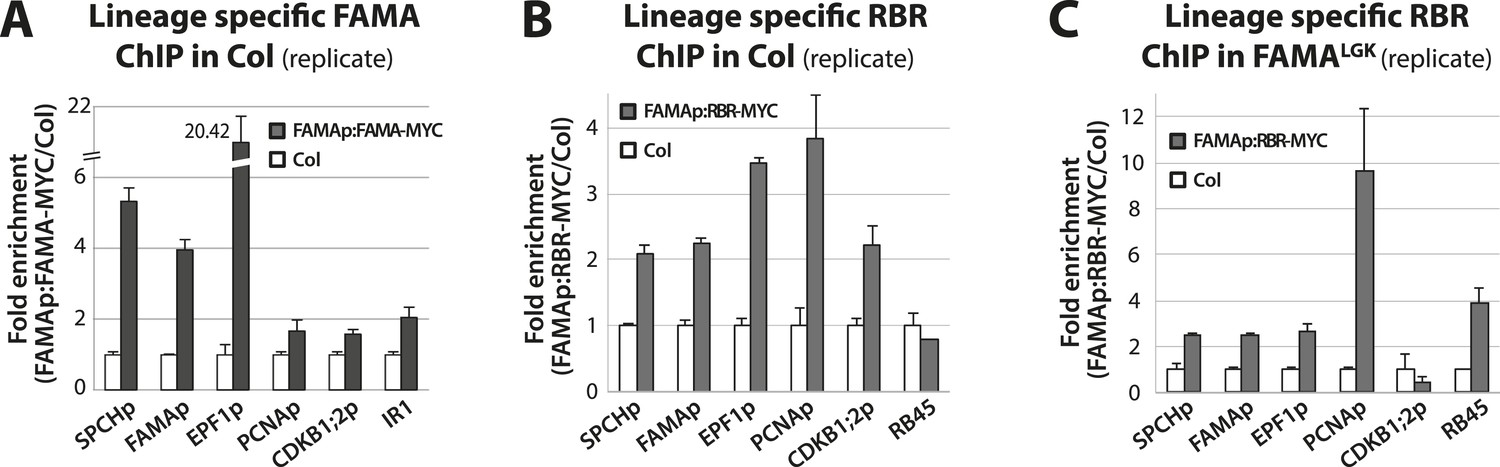
Biological replicates for ChIP experiments in Figure 5.
ChIP assays were performed with FAMAp:FAMA-MYC in Col (A), FAMAp:RBR-MYC in Col (B), and FAMAp:RBR-MYC in FAMALGK plants (C) using an anti-Myc antibody as in (Lau et al., 2014). ChIPed DNA was quantified by qPCR with primers specific to the indicated gene promoters or the negative control region, IR1 or RB45 (Cruz-Ramirez et al., 2012) and (Weimer et al., 2012). Input-adjusted signals were normalized to Col. Values are means ± SEM.
Figure 5—figure supplement 4
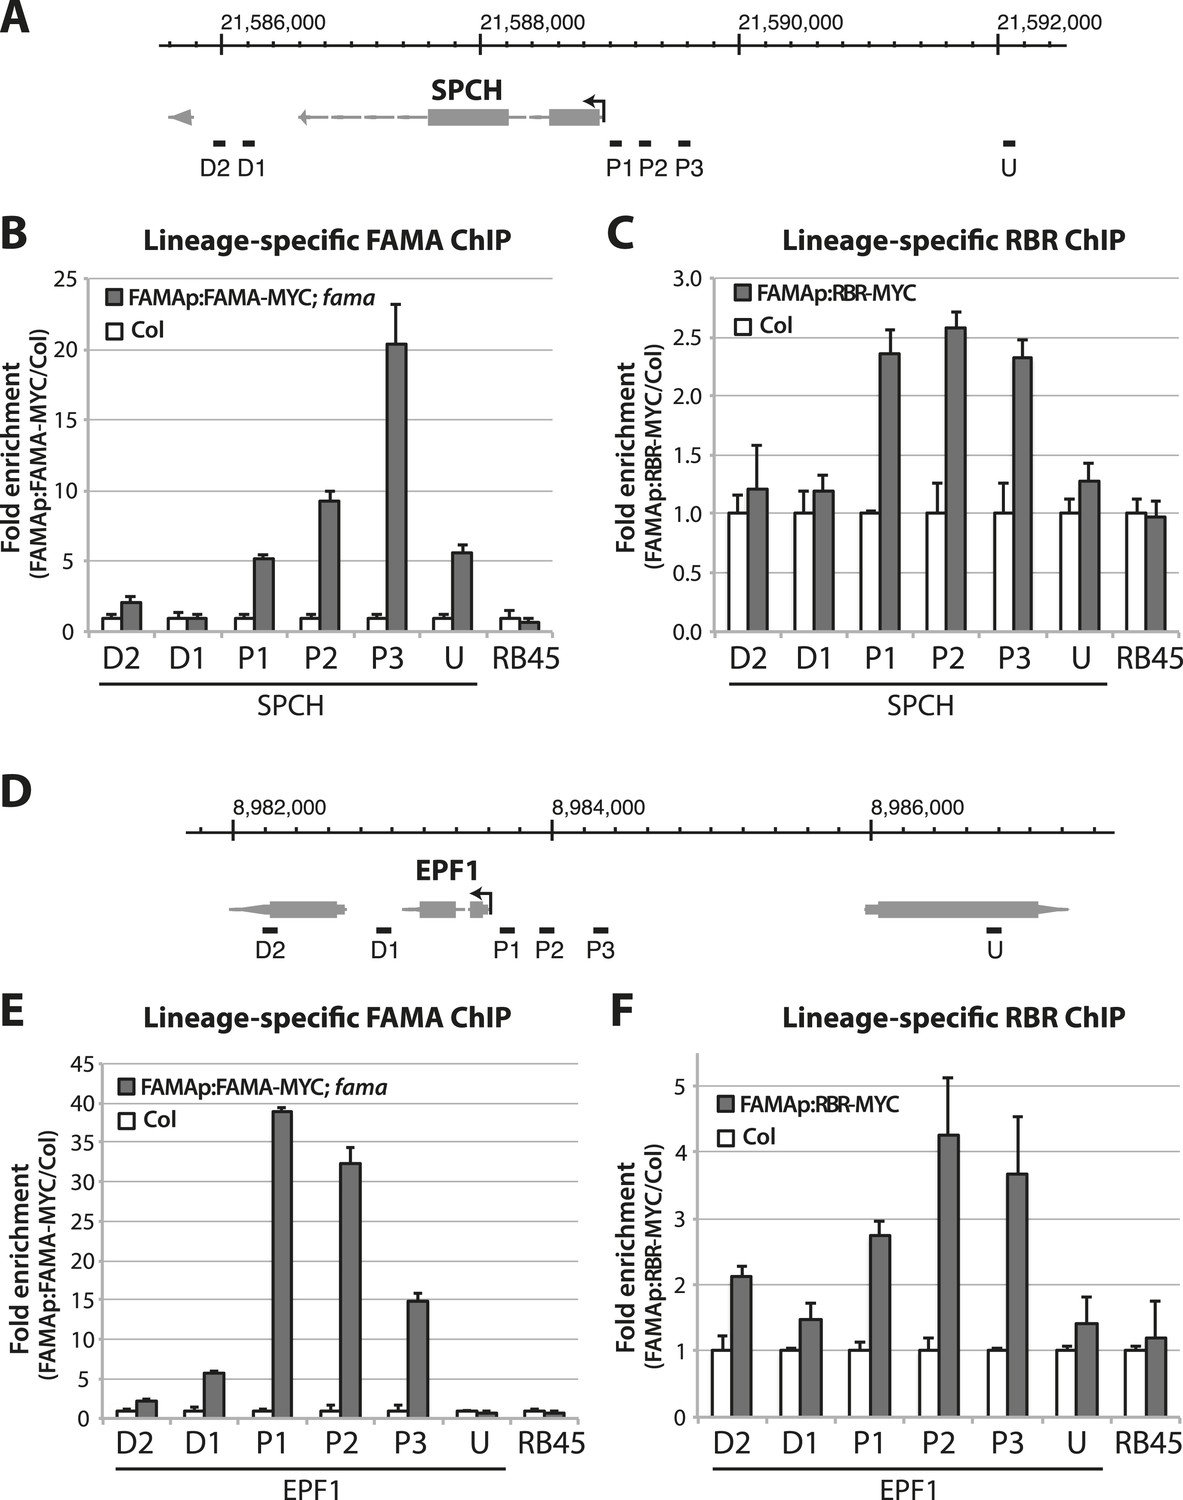
Dissection of FAMA and RBR binding on stomatal target genes.
(A and D) Map of the SPCH (A) and EPF1 (D) loci. Arrow indicates orientation of the gene and the transcription start site. Genome coordinate is indicated above the gene structure. Black bars indicate genomic region probed by ChIP-qPCR assays. Key: U, upstream; P, promoter; D, downstream. (B, C, E and F) ChIP assays were performed with FAMAp:FAMA-MYC in fama (B and E) and FAMAp:RBR-MYC in Col (C and F), using an anti-Myc antibody as in (Lau et al., 2014). ChIPed DNA was quantified by qPCR with primers specific to the indicated genomic regions relative to SPCH (B and C) and EPF1 (E and F) or the negative control region, RB45 (Weimer et al., 2012). Input-adjusted signals were normalized to Col. Values are means ± SEM.
Author response image 1
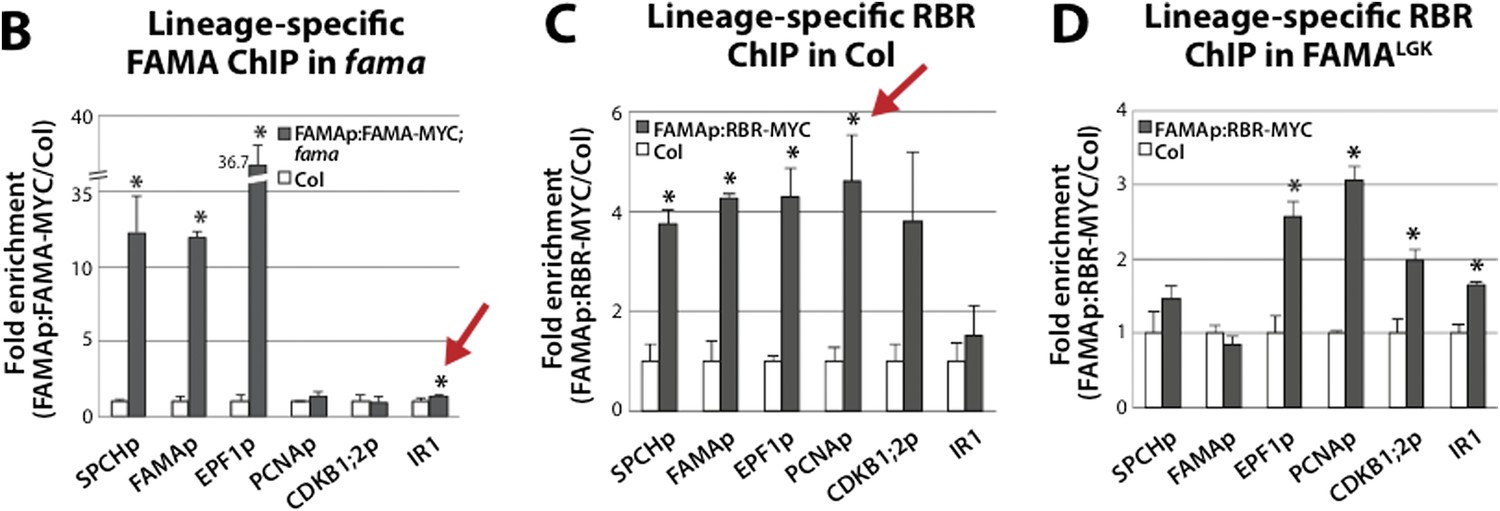
Student’s t-test analysis of ChIP-qPCR data presented in Figure 5B-D. Statistical analysis was applied to normalized CT values. P<0.05 was considered statistically significant. Red arrows indicate P-values not considered statistically significant when error propagation of normalized CT values is taken into account.
Author response image 2
Author response image 3
Additional files
-
Supplementary file 1
Primers used in FAMA-RBR study.
- https://doi.org/10.7554/eLife.03271.017
Download links
A two-part list of links to download the article, or parts of the article, in various formats.
Downloads (link to download the article as PDF)
Open citations (links to open the citations from this article in various online reference manager services)
Cite this article (links to download the citations from this article in formats compatible with various reference manager tools)
Irreversible fate commitment in the Arabidopsis stomatal lineage requires a FAMA and RETINOBLASTOMA-RELATED module
eLife 3:e03271.
https://doi.org/10.7554/eLife.03271


