The scaffold protein Nde1 safeguards the brain genome during S phase of early neural progenitor differentiation
- Northwestern University Feinberg School of Medicine, United States
Figures
Figure 1 with 3 supplements
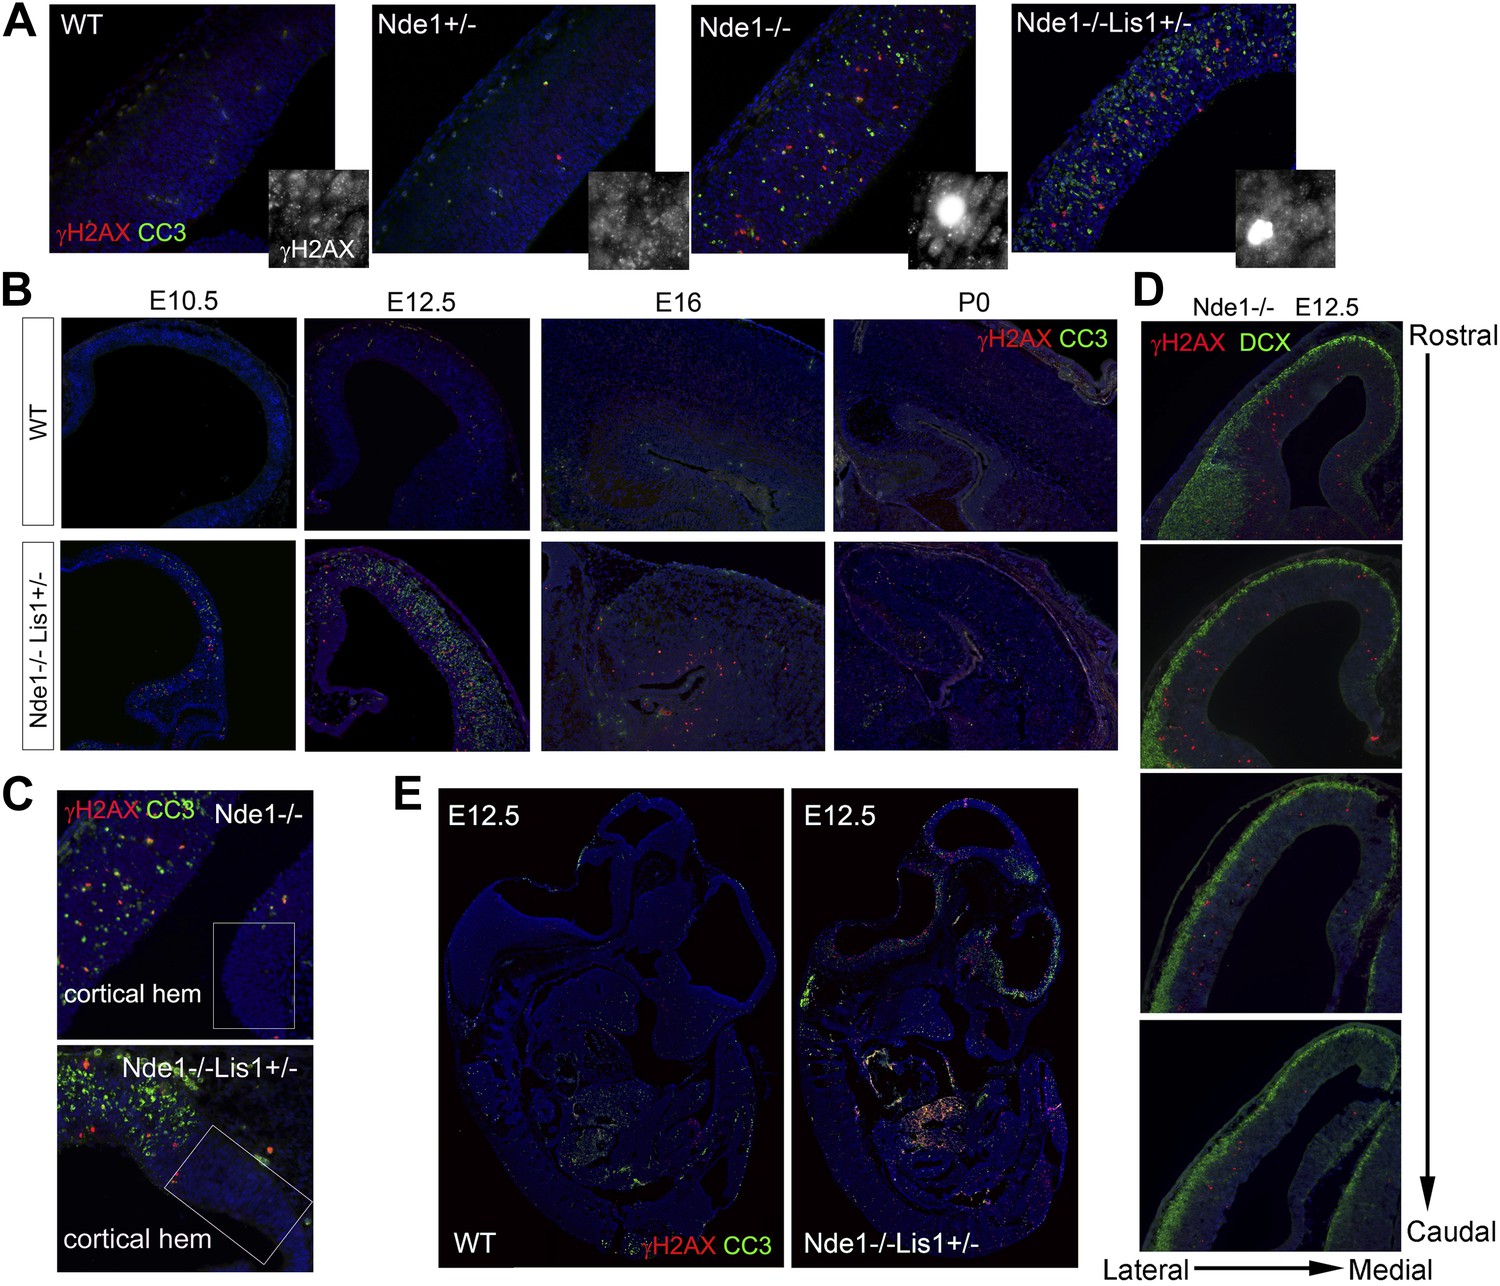
The correlation of DNA damage and apoptosis with neural progenitor early fate restriction in Nde1 mutant brains.
(A) Immunohistological analysis of γH2AX (red) and cleaved caspase 3 (CC3, green) reveals the co-existence of DNA damage and apoptosis in the neocortex of Nde1 mutants at E12.5. Higher-magnification views indicate the high level of γH2AX pan-nuclear signals associated with severe DNA damage and low γH2AX signals associated with normal replication foci. (B) Developmental analysis of the temporal correlation between immunosignals of γH2AX (red) and cleaved caspase 3 (CC3, green) from E10.5 to P0. (C) The lack of DNA damage and apoptosis in the cortical hem (a region where neural progenitors divide but do not undergo neuronal differentiation) of Nde1−/− and Nde1−/−Lis1+/− brains at E12.5. (D) Immunohistological analysis of serial coronal sections of Nde1−/− brains to demonstrate the spatial correlation of γH2AX (red) with TNG revealed by DCX abundance (green). (E) Immunohistological analysis of γH2AX (red) and cleaved caspase 3 (CC3, green) on sagittal sections of an Nde1−/−Lis1+/− embryo and its wild-type littermate at E12.5. Nuclei DNA was stained with Hoechst 33342 and shown in blue in all fluorescent images.
Figure 1—figure supplement 1
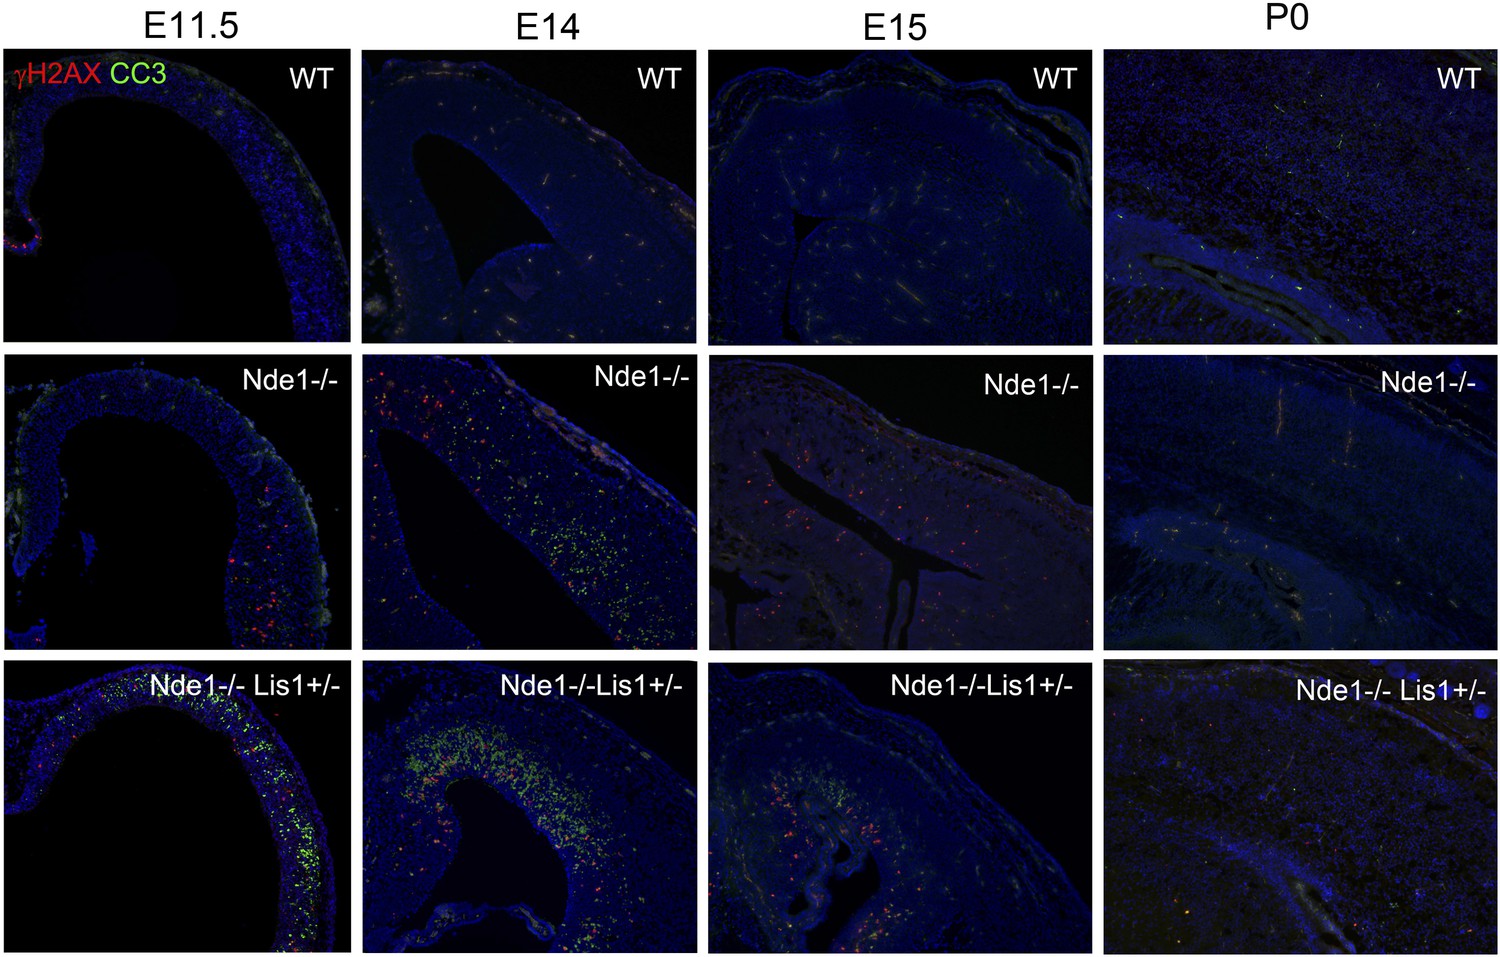
The correlation of DNA damage and apoptosis with neural progenitor early fate restriction in Nde1 mutants.
Immunohistological analysis with antibodies to γH2AX (red) and cleaved caspase 3 (CC3, green) shows the spatiotemporal concurrence of DNA damage and apoptosis with early stages of neuronal differentiation in both Nde1−/− and Nde1−/−Lis1+/− brains. Nuclei DNA was stained with Hoechst 33342 and shown in blue.
Figure 1—figure supplement 2
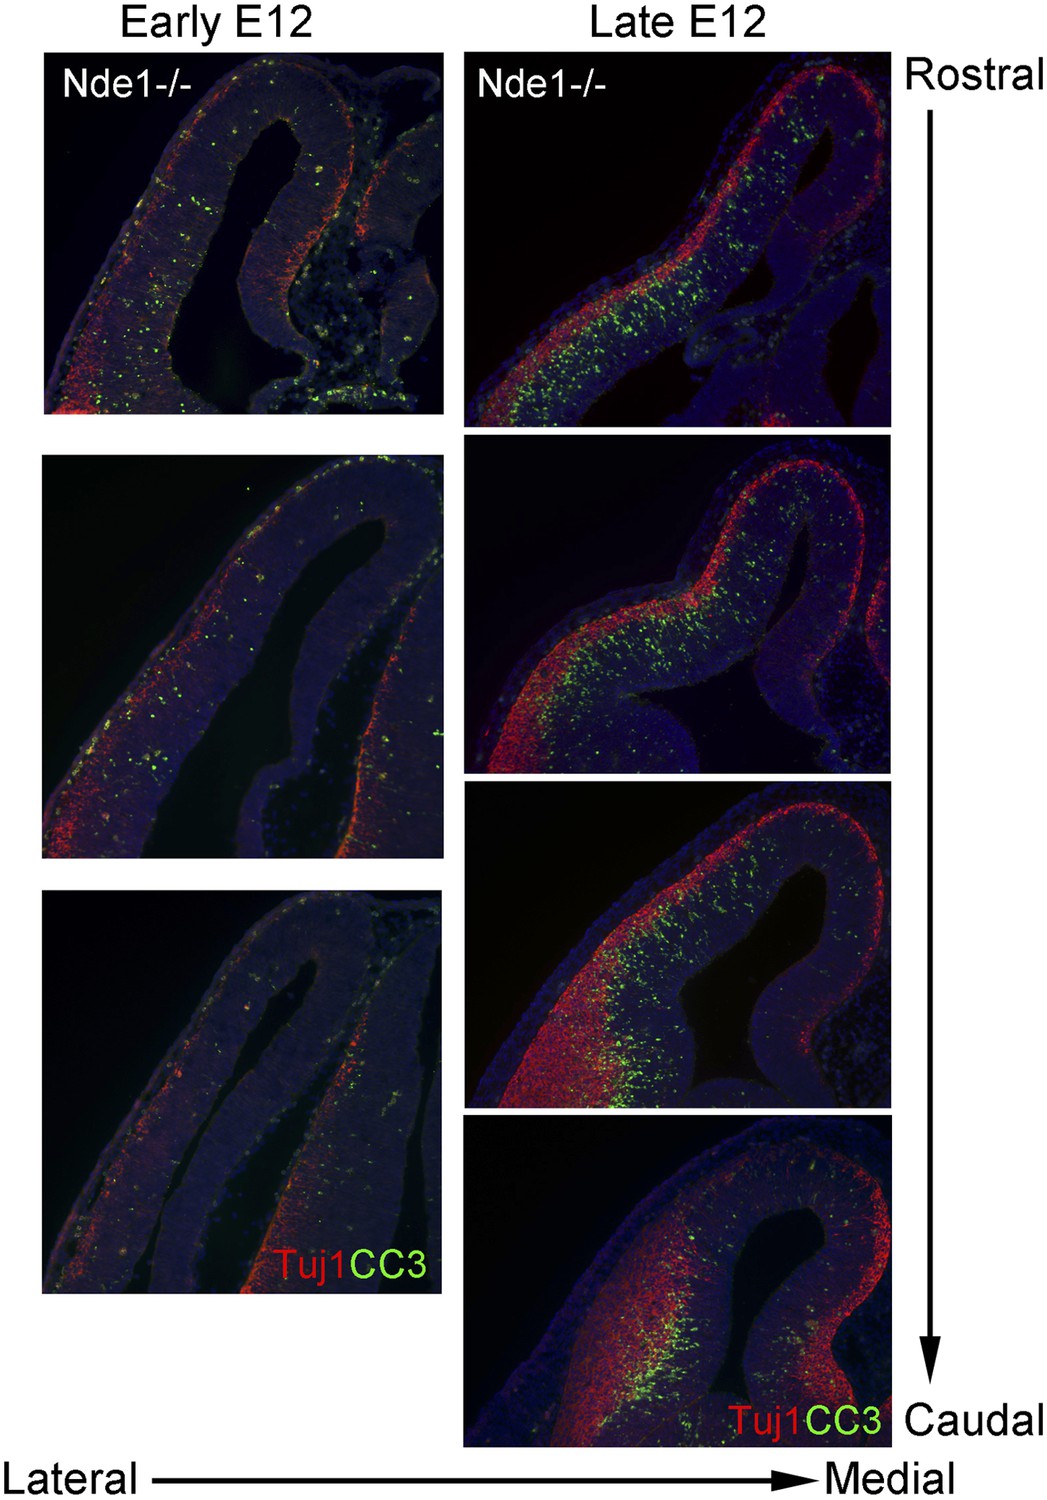
DNA damage and apoptosis along the transverse neurogenetic gradient (TNG) in Nde1−/− brains.
Immunohistological analysis of serial coronal sections of Nde1−/− brains at early and late E12, respectively, to demonstrate the spatial correlation of cleaved caspase 3 (CC3, green) with TNG revealed by Tuj1 (red). Nuclei DNA was stained with Hoechst 33342 and shown in blue in all fluorescent images.
Figure 1—figure supplement 3
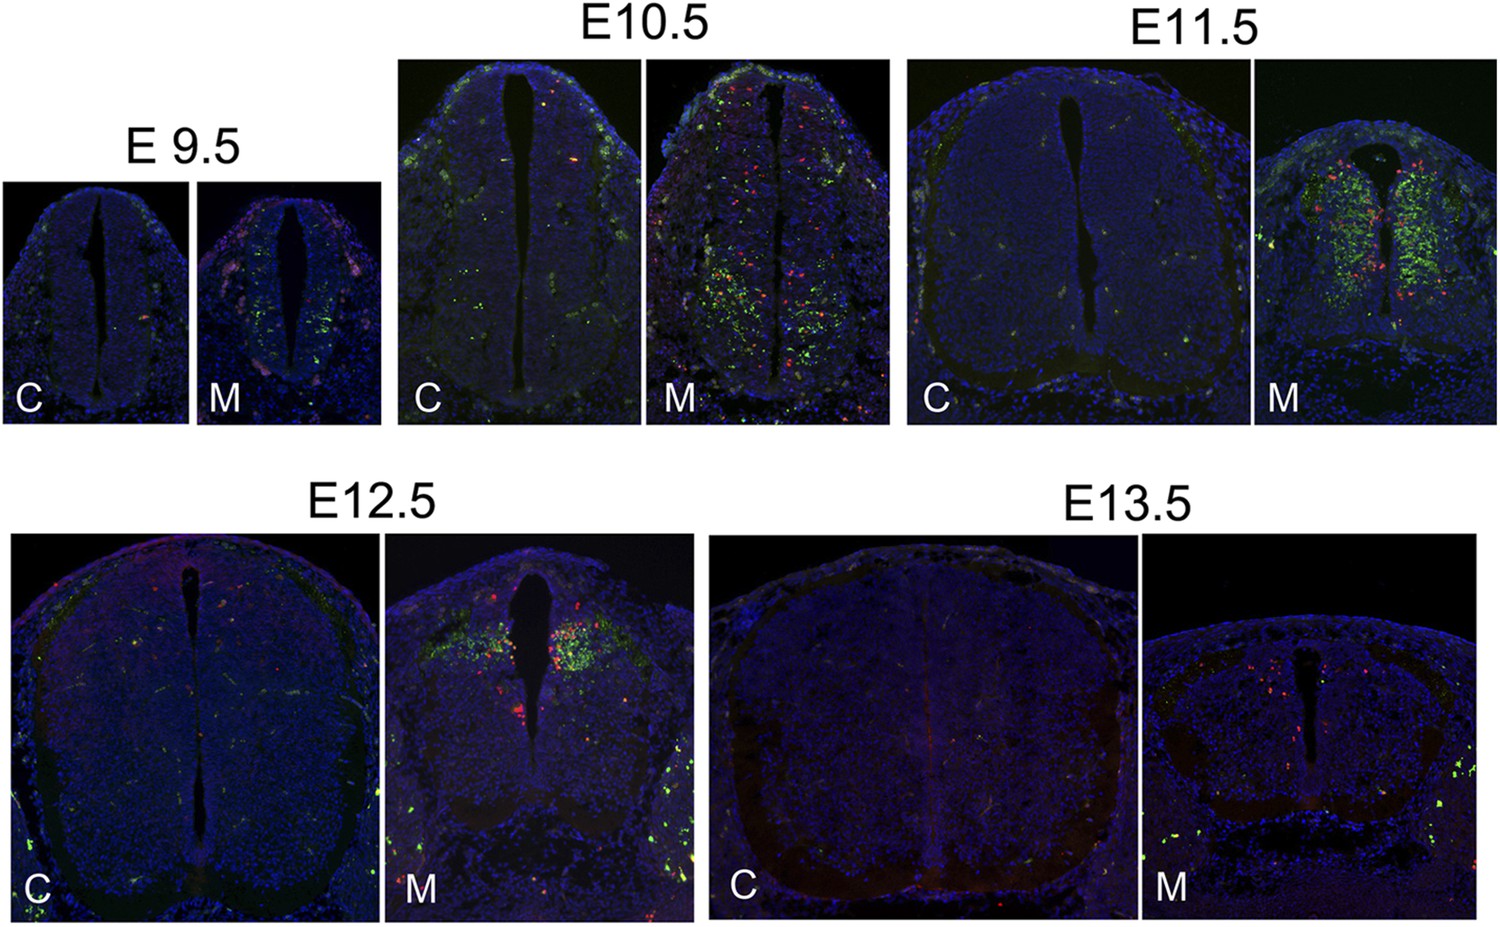
The correlation of DNA damage and apoptosis with neuronal differentiation in the Nde1 mutant spinal cord from E9.5 to E13.5.
Immunohistological analysis of γH2AX (red) and cleaved caspase 3 (CC3, green) of the developing spinal cord of Nde1−/−Lis1+/− (M) and control (C, Nde1+/− or wild type) littermates from E9.5 to E13.5. Nuclei DNA was stained with Hoechst 33342 and shown in blue in all fluorescent images.
Figure 2
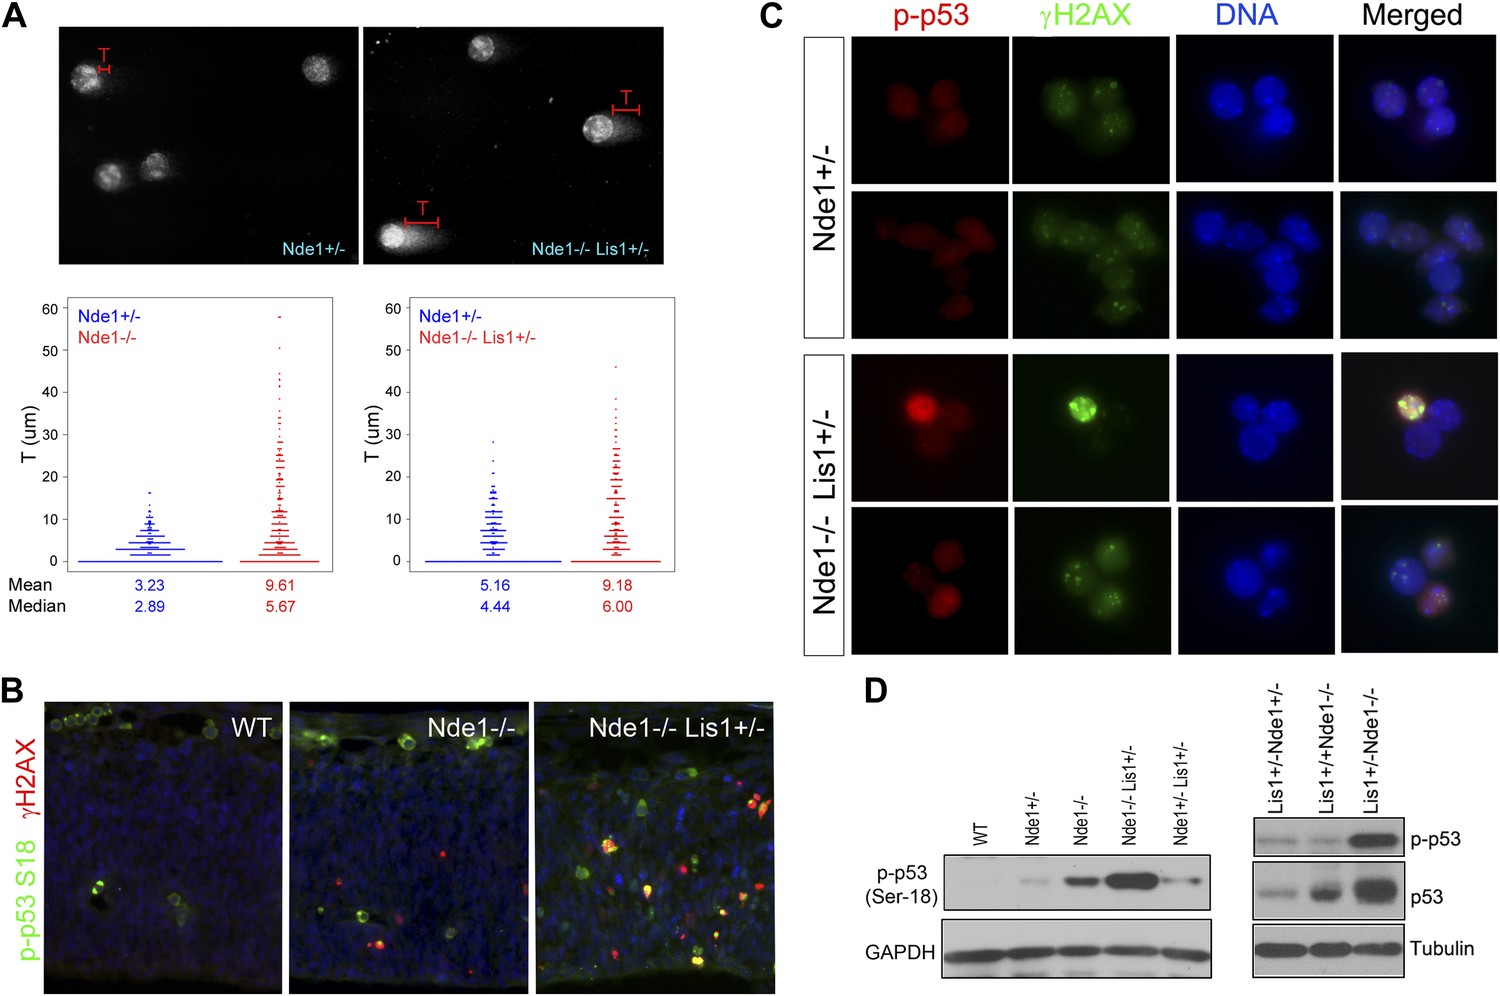
Co-activation of γH2AX with p53 in Nde1 mutant neocortices.
(A) Results from comet assay with cortical cells isolated from Nde1−/− or Nde1−/−Lis1+/− mutants and their Nde1+/− littermates at E12.5. The distribution, mean, and median values of comet tail length (T) from over 300 randomly selected and photographed cells are presented. Nde1−/− and Nde1−/−Lis1+/− cells showed increased comet tail length compared to Nde1+/− cells, respectively; p < 0.0001 by the Wilcoxon rank-sum two sample test. (B) Immunohistological analysis of the γH2AX (red) and phospho-p53 Ser18 (p-p53, green) in the neocortex of wild-type and Nde1 mutants at E12.5. (C) Immunofluorescence analysis of the co-activation of γH2AX (green) and phospho-p53 Ser18 (red) in primary cortical cells isolated at E12.5. Note the lack of DNA condensation and fragmentation of cells with high phospho-H2AX and p53 signals. (D) Immunoblotting analyses of phospho-p53 Ser18 in embryonic cortical lysates at E12.5. Nuclei DNA was stained with Hoechst 33342 and shown in blue in all fluorescent images.
Figure 3 with 1 supplement

Restoration of the size and structure of the Nde1−/− brain by abrogating p53.
(A) Immunohistological analyses of cleaved caspase 3 (CC3, green) in wild-type, Nde1−/−, Nde1+/−Trp53−/−, and Nde1−/−Trp53−/− neocortices at E12.5. (B) Brain weight of Nde1−/−, Nde1−/−Trp53−/− mutant mice and their littermates at post-natal for 3 to 4 weeks. Data are mean ± SD. Significant overall differences were found among wild-type and Nde1–Trp53 double mutants by ANOVA (p < 0.0001). Pairwise comparisons showed that the brain mass of Nde1−/−Trp53−/− mice (n = 8) was significantly increased compared to that of Nde1−/− mice (*p < 0.0001), but not significantly different from that of the wild-type mice (n.s., p = 0.06). (C) H&E stained brain sections of wild-type, Nde1−/−, Nde1+/−Trp53−/−, and Nde1−/−Trp53−/− mice reveal normal size and anatomical structure of the Nde1−/−Trp53−/− brain. (D) H&E stained cortical sections of wild-type, Nde1−/−, and Nde1−/−Trp53−/− brains, showing restored layer II/III cortical neurons in the Nde1−/−Trp53−/− brains. (E) Immunohistological and quantitative analyses of the number and distribution of Cux1+ (red) superficial layer cortical neurons. Cortical neurons were identified by NeuN immunoreactivities (green); nuclei DNA was stained with Hoechst 33342 and shown in blue. Data are presented as mean ± SD in percentage of total NeuN+ neurons (n = 5). Significant overall differences were found among wild-type, Nde1−/−, and Nde1−/−Trp53−/− brains by ANOVA (p < 0.0001). Pairwise comparisons indicated that compared to the wild-type, Cux1+ neurons were significantly decreased in the Nde1−/− brains (*p < 0.0001), but not significantly changed in Nde1−/−Trp53−/− brains (n.s., p = 0.94). Compared to Nde1−/−, Cux1+ neurons were significantly increased in Nde1−/−Trp53−/− brains (p < 0.0001). (F) Immunohistological and quantitative analyses of the number and distribution of Foxp2+ (red) deep layer cortical neurons. Significant overall differences were found among wild-type, Nde1−/−, and Nde1−/−Trp53−/− brains by ANOVA (p < 0.0001). Pairwise comparisons indicated that compared to the wild-type, Foxp2+ neurons were significantly increased in the Nde1−/− brains (*p<0.005), but not significantly changed in Nde1−/−Trp53−/− brains (n.s., p = 0.77). Compared to Nde1−/−, Foxp2+ neurons were significantly decreased in Nde1−/−Trp53−/− brains (p = 0.001).
Figure 3—figure supplement 1
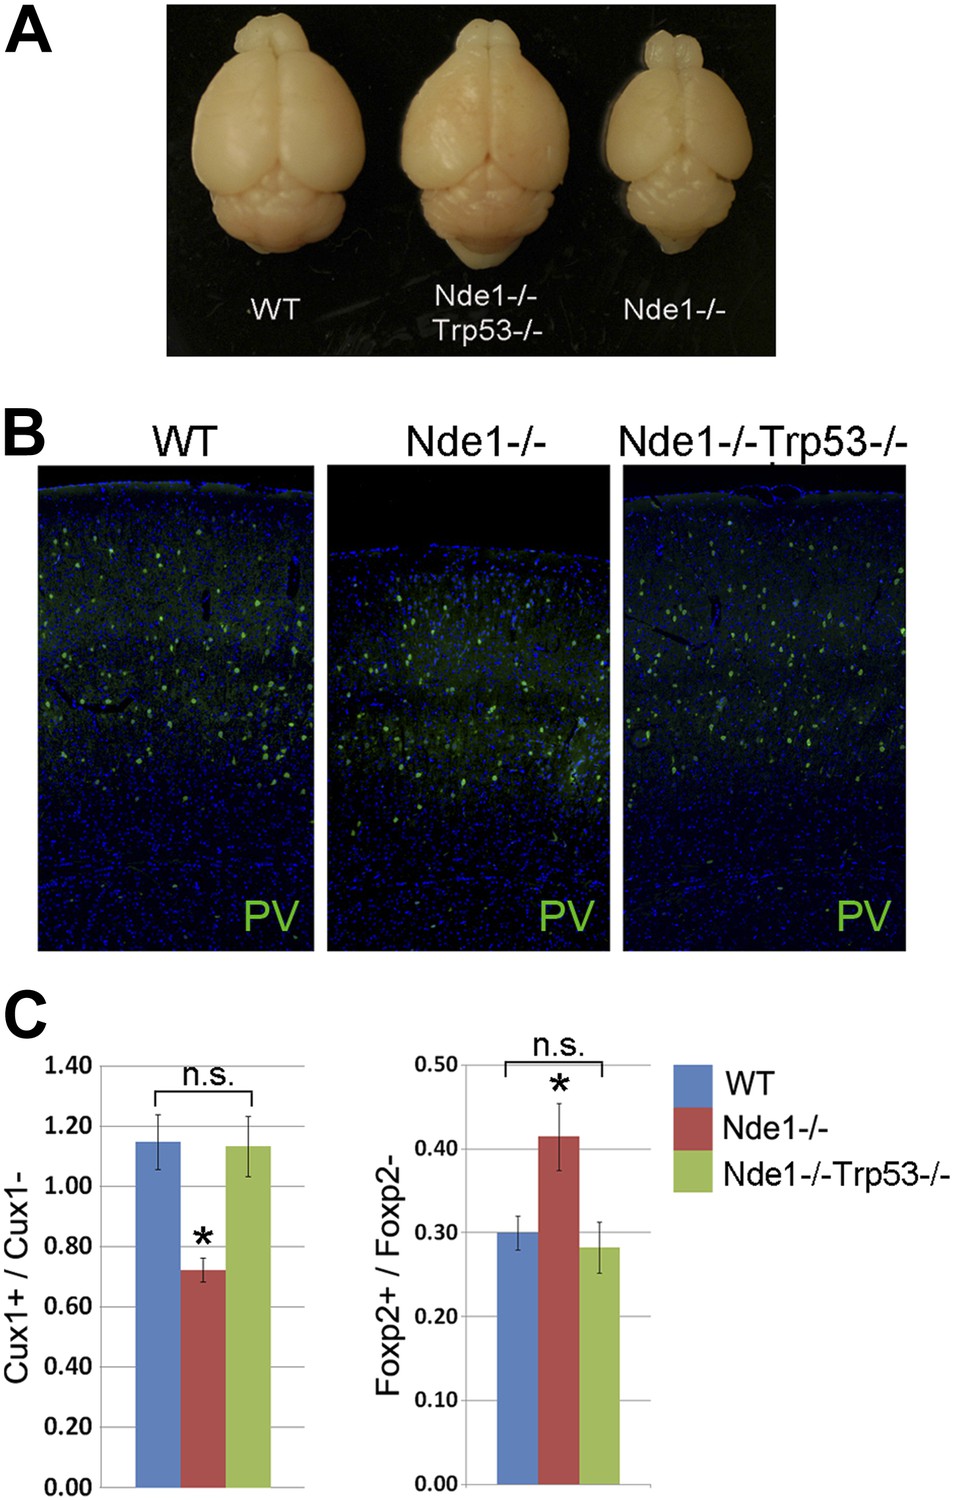
Restoration of brain size and structure of Nde1−/− mutants by abrogating p53.
(A) Representative brain images of wild-type, Nde1−/−, and Nde1−/−Trp53−/− mice at post-natal day 23. (B) Immunostaining with parvalbumin antibody (PV) showing the normal number and distribution of GABAergic interneurons in the Nde1−/−Trp53−/− cortex. Nuclei DNA was stained with Hoechst 33342 and shown in blue. (C) Quantitative analyses of Cux+ superficial and Foxp2+ deep layer cortical neurons. Data are presented as mean ± SD (n = 5). Significant overall differences were found among wild-type, Nde1−/−, and Nde1−/−Trp53−/− brains by ANOVA (p < 0.0001 for Cux1+; p = 0.0009 for Foxp2+ neurons). Pairwise comparisons indicated that compared to the wild-type, Cux1+ neurons were significantly decreased in the Nde1−/− brains (*p < 0.0001) but not significantly changed in Nde1−/−Trp53−/− brains (n.s., p = 0.95). Compared to Nde1−/−, Cux1+ neurons were significantly increased in Nde1−/−Trp53−/− brains (p < 0.0001). Compared to the wild-type, Foxp2+ neurons were significantly increased in the Nde1−/− brains (*p = 0.0045), but not significantly changed in Nde1−/−Trp53−/− brains (n.s., p = 0.72). Compared to Nde1−/−, Foxp2+ neurons were significantly decreased in Nde1−/−Trp53−/− brains (p = 0.001).
Figure 4 with 2 supplements
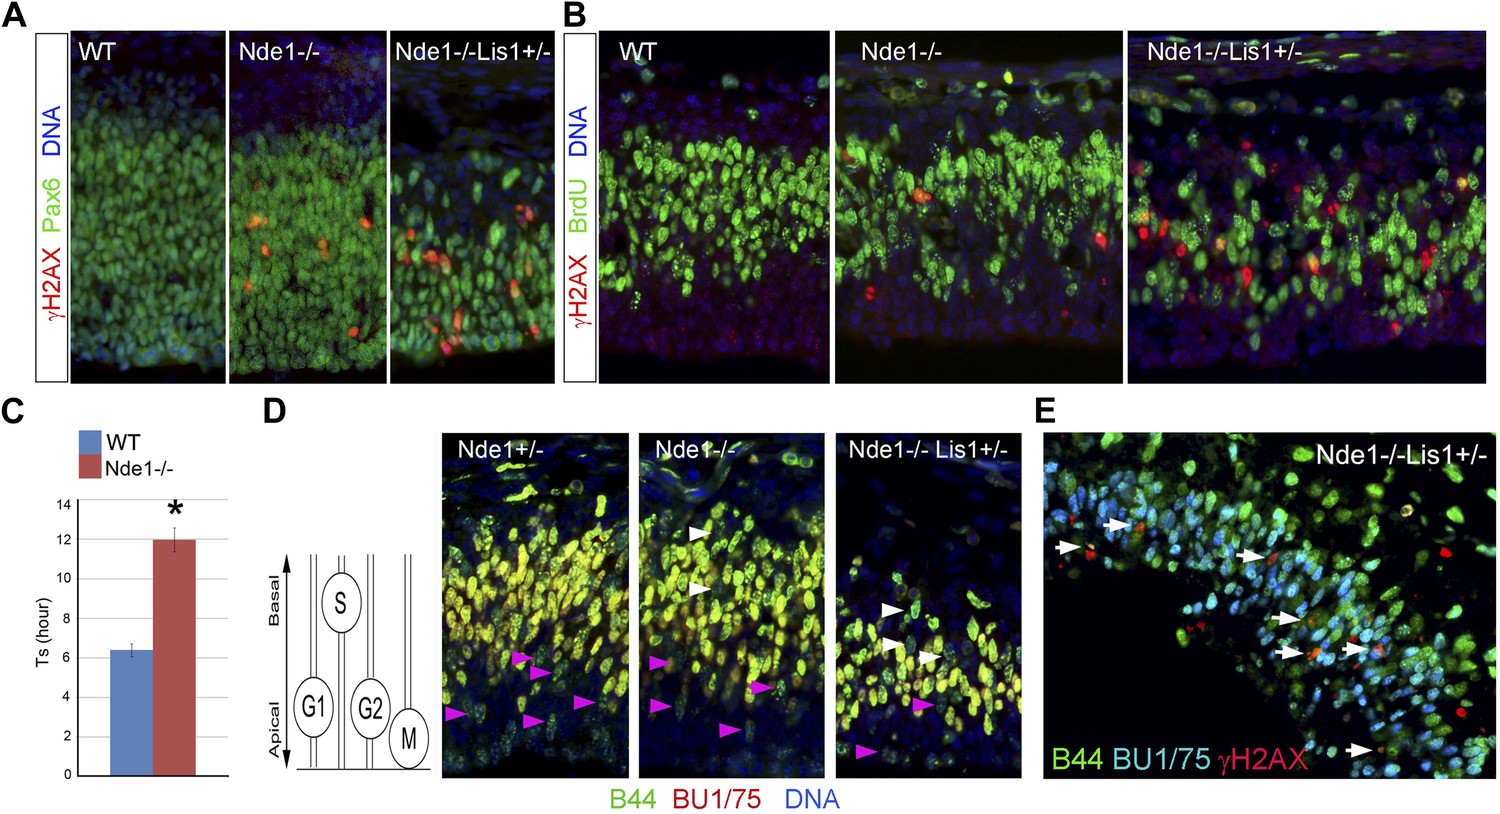
DNA damage caused by Nde1 mutation occurs concurrently with DNA replication.
(A) Co-immunostaining of γH2AX (red) and multipotent/primary progenitor marker Pax6 (green) on cortical sections at E12.5. (B) Co-immunostaining of γH2AX (red) and BrdU (green); cortical sections were prepared from BrdU pulse (30 min) labeled embryos at E12.5. Quantification of γH2AX+ cells showed that 18.3 ± 6.1% (mean ± SD) of γH2AX+ Nde1−/− and 23.4 ± 3.1% (mean ± SD) of γH2AX+ Nde1−/−Lis1+/− cells were also BrdU+. (C) S phase duration (Ts, hr) measurement indicates significant delay of DNA replication in Nde1−/− neural progenitors. Data are mean ± SD, p < 0.0001 by Student's t test. (D) Representative images of B44 (green, recognizes both IdU and BrdU) and BU1/75 (red, recognizes only BrdU) double immunohistological staining in an IdU (2 hr), BrdU (30 min) sequential labeling experiment. Cells that have finished S phase and progressed to G2/M are indicated by pink arrows; cells that remained in the S phase zone but stopped incorporating BrdU are indicated by white arrows. A diagram to indicate the cell cycle dependent nuclei position through INM is included. (E) B44 (green), BU1/75 (blue), and γH2AX (red) triple immunostaining of cortical sections of Nde1−/−Lis1+/− mutant after IdU (2.5 hr), BrdU (30 min) sequential labeling. 47.5 ± 0.1% (mean ± SD) of total γH2AX+ cells were B44+BU1/75−, indicating the association of DNA damage with stalled DNA replication (white arrows).
Figure 4—figure supplement 1
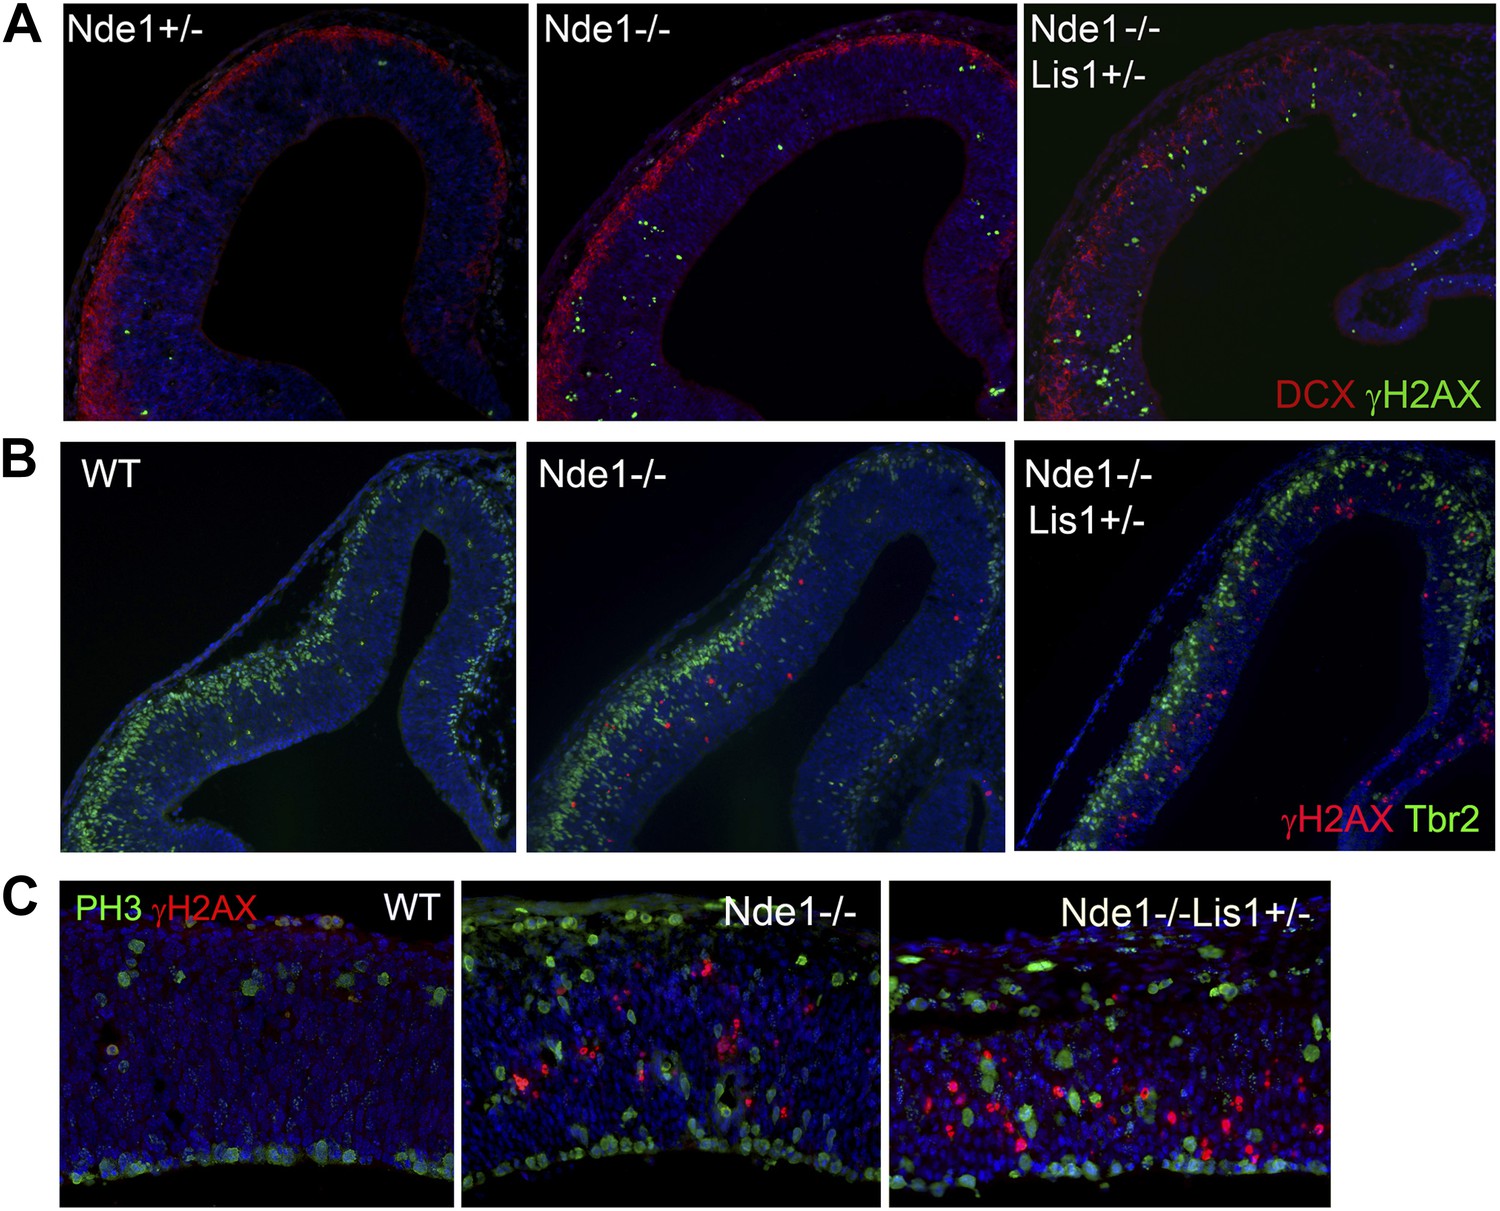
The cell type and cell cycle specificity of DNA damage in Nde1 mutant brains.
(A) Double immunohistological staining E12.5 cortical sections with γH2AX (green) and the new neuron marker DCX (red). (B) Double immunohistological staining E13.5 cortical sections with γH2AX (red) and the intermediate progenitor marker Tbr2 (green). (C) Double immunohistological staining E12.5 cortical sections with γH2AX (red) and the G2/M marker PH3 (green). Nuclei DNA was stained with Hoechst 33342 and shown in blue in all fluorescent images.
Figure 4—figure supplement 2
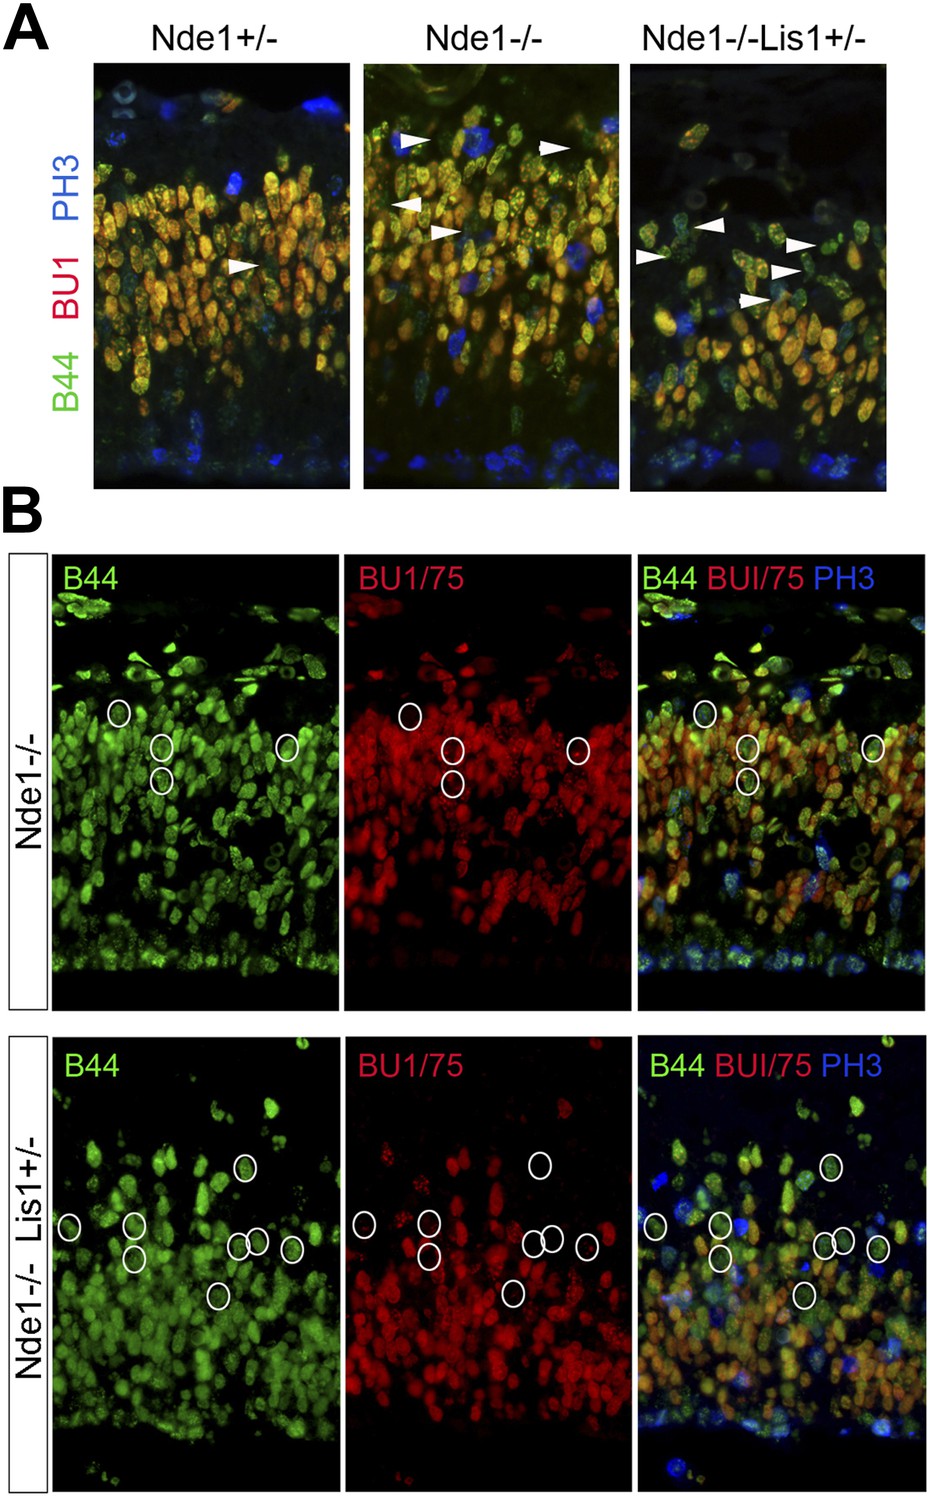
Stalled or delayed DNA replication in Nde1 mutant neural progenitors.
(A) Triple immunofluorescence histological staining of neocortical sections with B44 (green), BU1/75 (red), and PH3 (blue), showing the lack of PH3 immunoreactivity in the arrow-indicated B44+BU1− cells of Nde1−/− and Nde1−/−Lis1+/− cortices. (B) Representative images of B44 (green), BU1/75 (red), and PH3 (PH3) triple immunohistological staining after IdU (2.5 hr), BrdU (30 min) sequential labeling. Note the B44+BU1/75−PH3− cells (circles) in the S phase region of Nde1−/− and Nde1−/−Lis1+/− cortices.
Figure 5
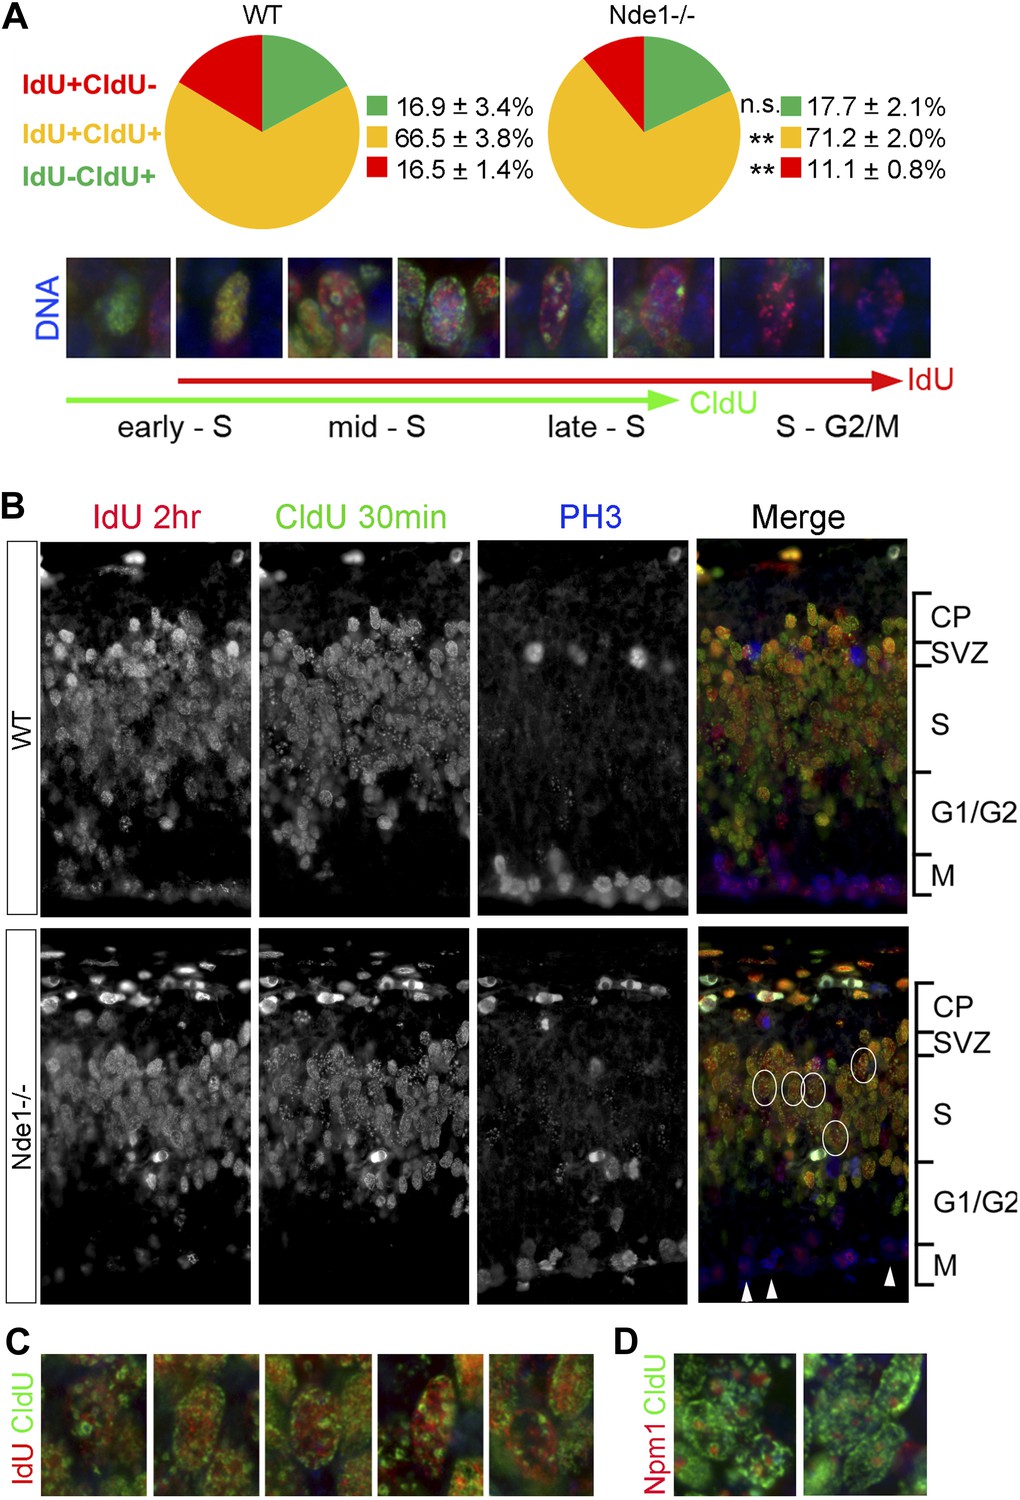
Stalled DNA replication during mid-late S phase at heterochromatic domains in Nde1−/− mutant neural progenitors.
(A) Quantitative analysis of IdU+CldU− (red), IdU+CldU+ (yellow), and IdU−CldU+ (green) cell fractions (%) by IdU (2 hr) and CldU (30 min) sequential labeling. Data are presented as mean ± SD. n.s.: p > 0.05; **: p < 0.001 by Chi–Square tests. A diagram that shows spatiotemporal patterns of early, mid, and late S phase DNA replication is included. (B) Representative images of B44 (red), BU1/75 (green), and PH3 (blue) triple immunostaining from IdU (2 hr) and CldU (30 min) sequential labeling experiments. Note the CldU (BU1/75, green) signals in IdU+CldU+ progenitors highlight predominantly heterochromatic structures (circled cells, better revealed in C) and the low IdU (B44, red) signals in PH3+ cells of the Nde1−/− mutant (arrows). (C) Higher-magnification views of selected Nde1−/− mutants progenitors (circled in B) that show DNA replication at heterochromatin (nuclear periphery, the rim of the nucleoli, and large foci of repeated heterochromatic sequences). (D) Double immunohistological stain of CldU (green) and nucleolar marker Nucleophosmin 1 (Npm1, red) to view stalled DNA replication at perinuclear heterochromatin, which is known to comprise centromeres and pericentromeres.
Figure 6 with 1 supplement
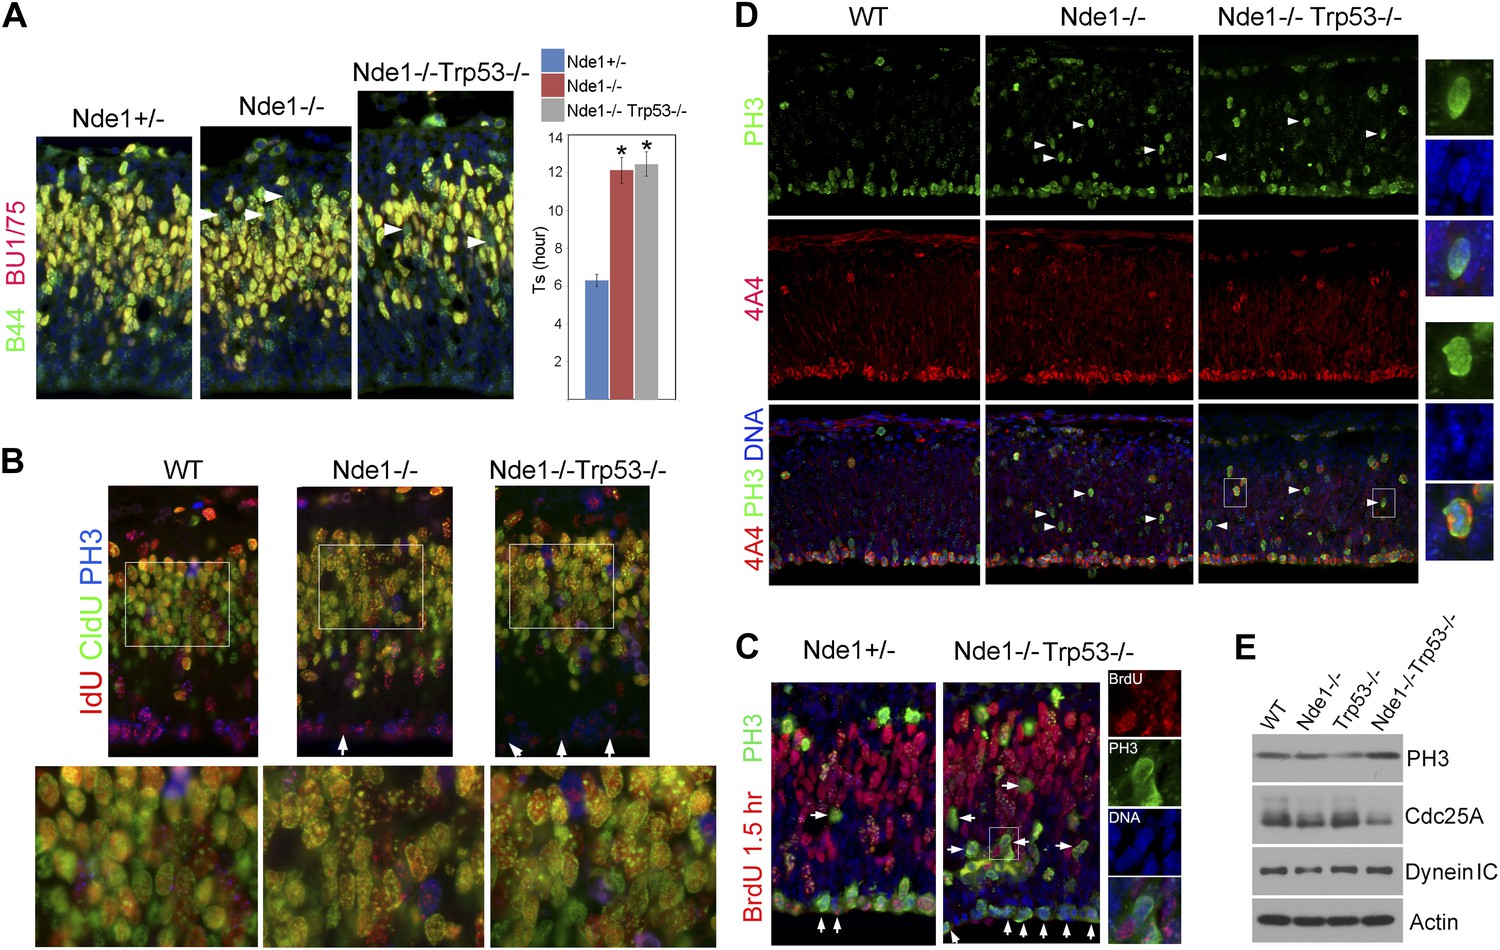
Persistent cell cycle stress and genotoxicity in Nde1 mutants after p53 abrogation.
(A) Representative images of B44 (green, recognizes both IdU and BrdU) and BU1/75 (red, recognizes only BrdU) double immunostained neocortical sections from IdU (2 hr), BrdU (30 min) sequential labeling experiments to measure S phase duration (Ts). Cells that were stalled in the S phase zone (IdU+ BrdU−; green) are indicated by white arrows. Significant overall difference in Ts was found among wild-type, Nde1−/−, and Nde1−/−Trp53−/− progenitors by ANOVA (p < 0.0001). Pairwise comparisons indicated that Ts of Nde1−/−Trp53−/− progenitors was significantly longer than that of wild-type progenitors (*p < 0.0001) but not significantly different from that of the Nde1−/− progenitors (n.s., p = 0.74). Data are presented as mean ± SD. (B) Representative images of B44/IdU (red), BU1/75/CldU (green), and PH3 (blue) triple immunostaining of neocortical sections from embryos sequentially labeled by IdU (2 hr) and CldU (30 min). Note the enhanced CldU immunosignals at heterochromatin structures (higher magnification views) and reduced IdU immunosignals in PH3+ cells (arrows) in Nde1−/− and Nde1−/−Trp53−/− cortical neural progenitors. (C) Immunohistological analysis of BrdU (red)–PH3 (green) co-labeled cells 1.5 hr after BrdU pulse. Arrows indicate PH3+ cells with very few BrdU foci, suggesting hindered BrdU incorporation at the end of S phase. Higher magnification views of a BrdU–PH3 double positive Nde1−/−Trp53−/− cell with uncondensed DNA are also shown. (D) Double immunostaining with G2/M marker PH3 (green) and M phase marker phospho-vimentin 4A4 (red) showing increased PH3+4A4− G2 population in Nde1−/− and Nde1−/−Trp53−/− progenitors (arrows). Higher magnification views of selected Nde1−/−Trp53−/− cells are included to show uncondensed DNA in PH3+4A4− but condensed DNA in PH3+4A4+ cells. (E) Immunoblotting analysis of neocortical lysates showing elevated PH3 and increased Cdc25A degradation in the Nde1−/−Trp53−/− mutant brain. β-actin (Actin) and dynein intermediate chain (Dynein IC) were used as loading controls.
Figure 6—figure supplement 1
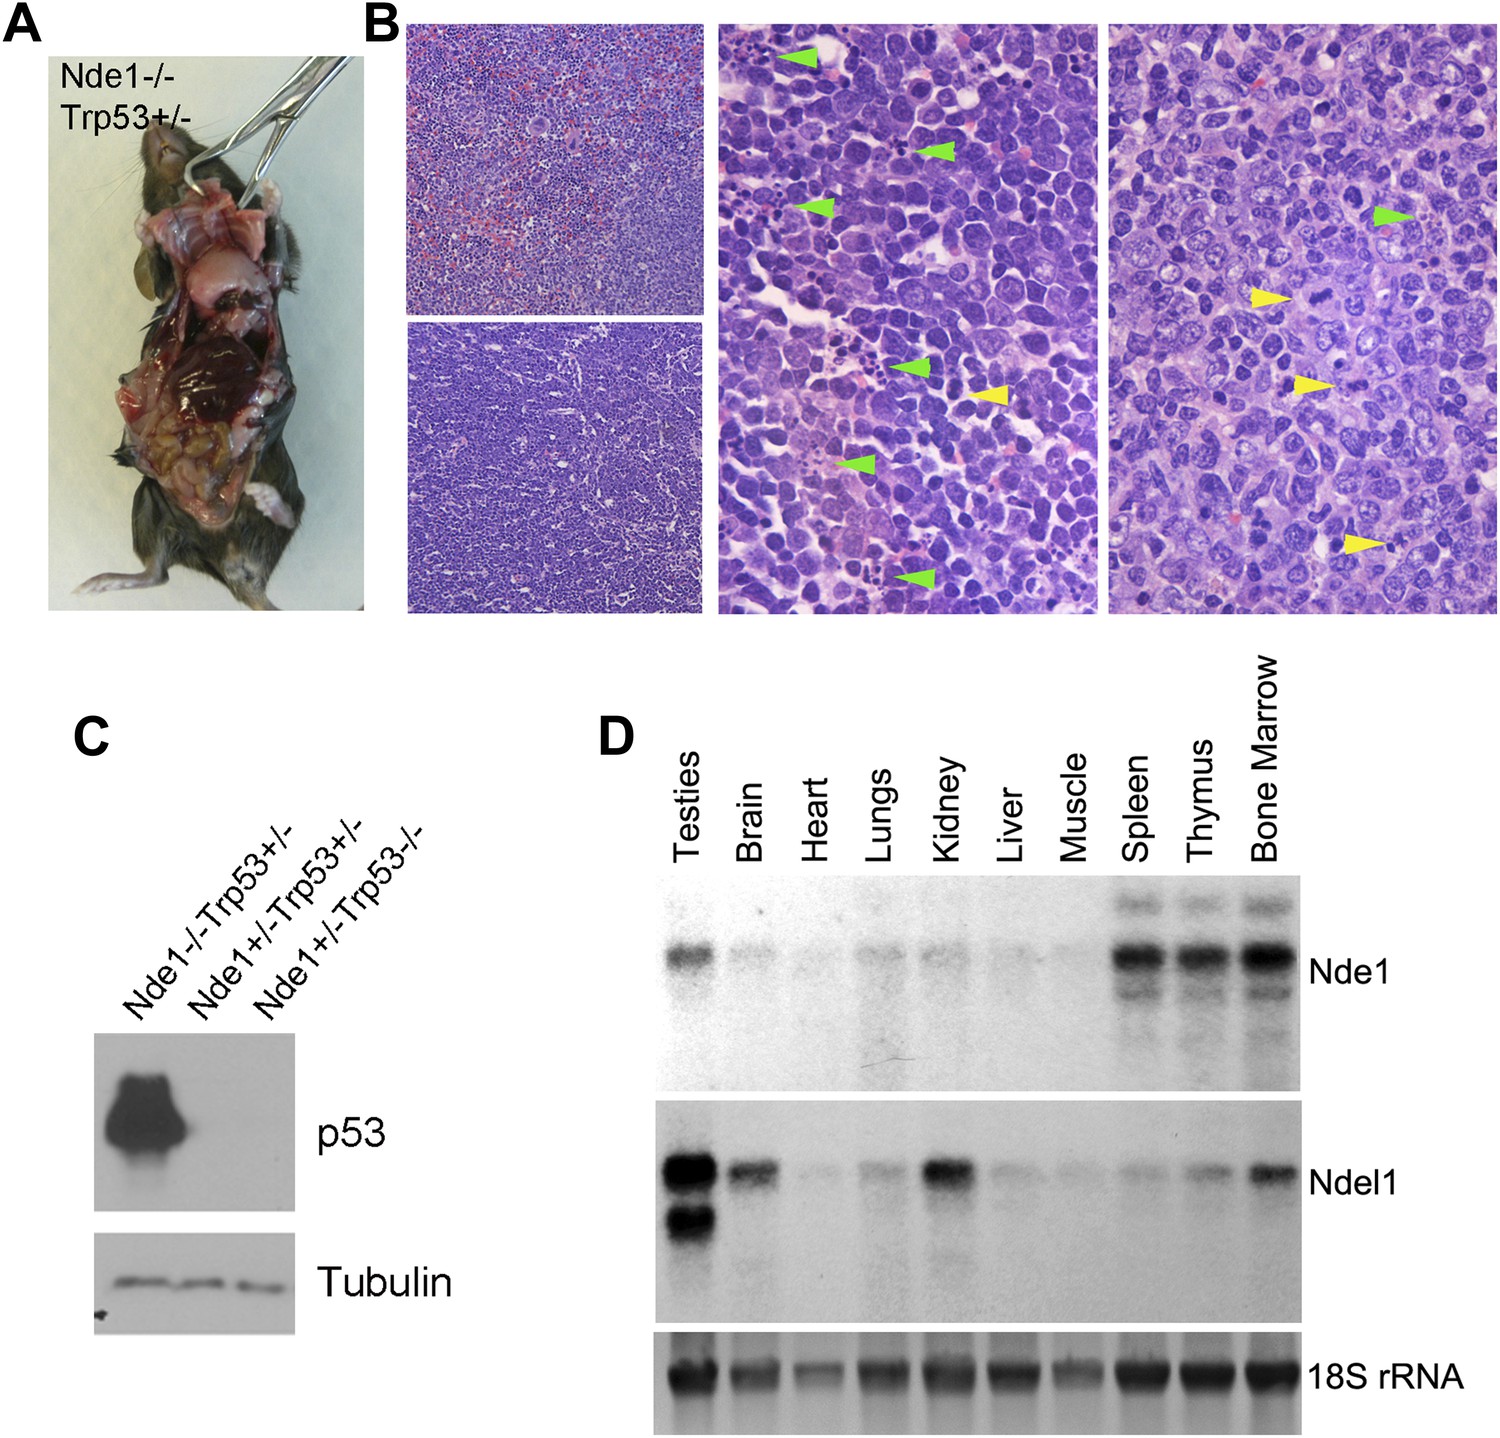
Lymphomagenesis and remarkably increased p53 in Nde1−/−Trp53+/− thymic lymphoma.
(A) Representative T cell thymic lymphoma of Nde1−/−Trp53+/− mice at 3 months. (B) Representative image of H&E stained Nde1−/−Trp53+/− lymphoma. Apoptotic cells with fragmented nuclei are indicated by green arrows; mitotic figures are indicated by yellow arrows. (C) Immunoblotting analysis of Nde1−/−Trp53+/− lymphoma and normal thymus tissues show remarkable elevation of p53 in the tumor tissue. Note that the level of p53 in control thymus tissue was almost undetectable. (D). Northern blot analysis of Nde1 and Ndel1 mRNA from adult mouse tissues. Note the high Nde1 expression in hematopoietic tissues.
Figure 7 with 2 supplements
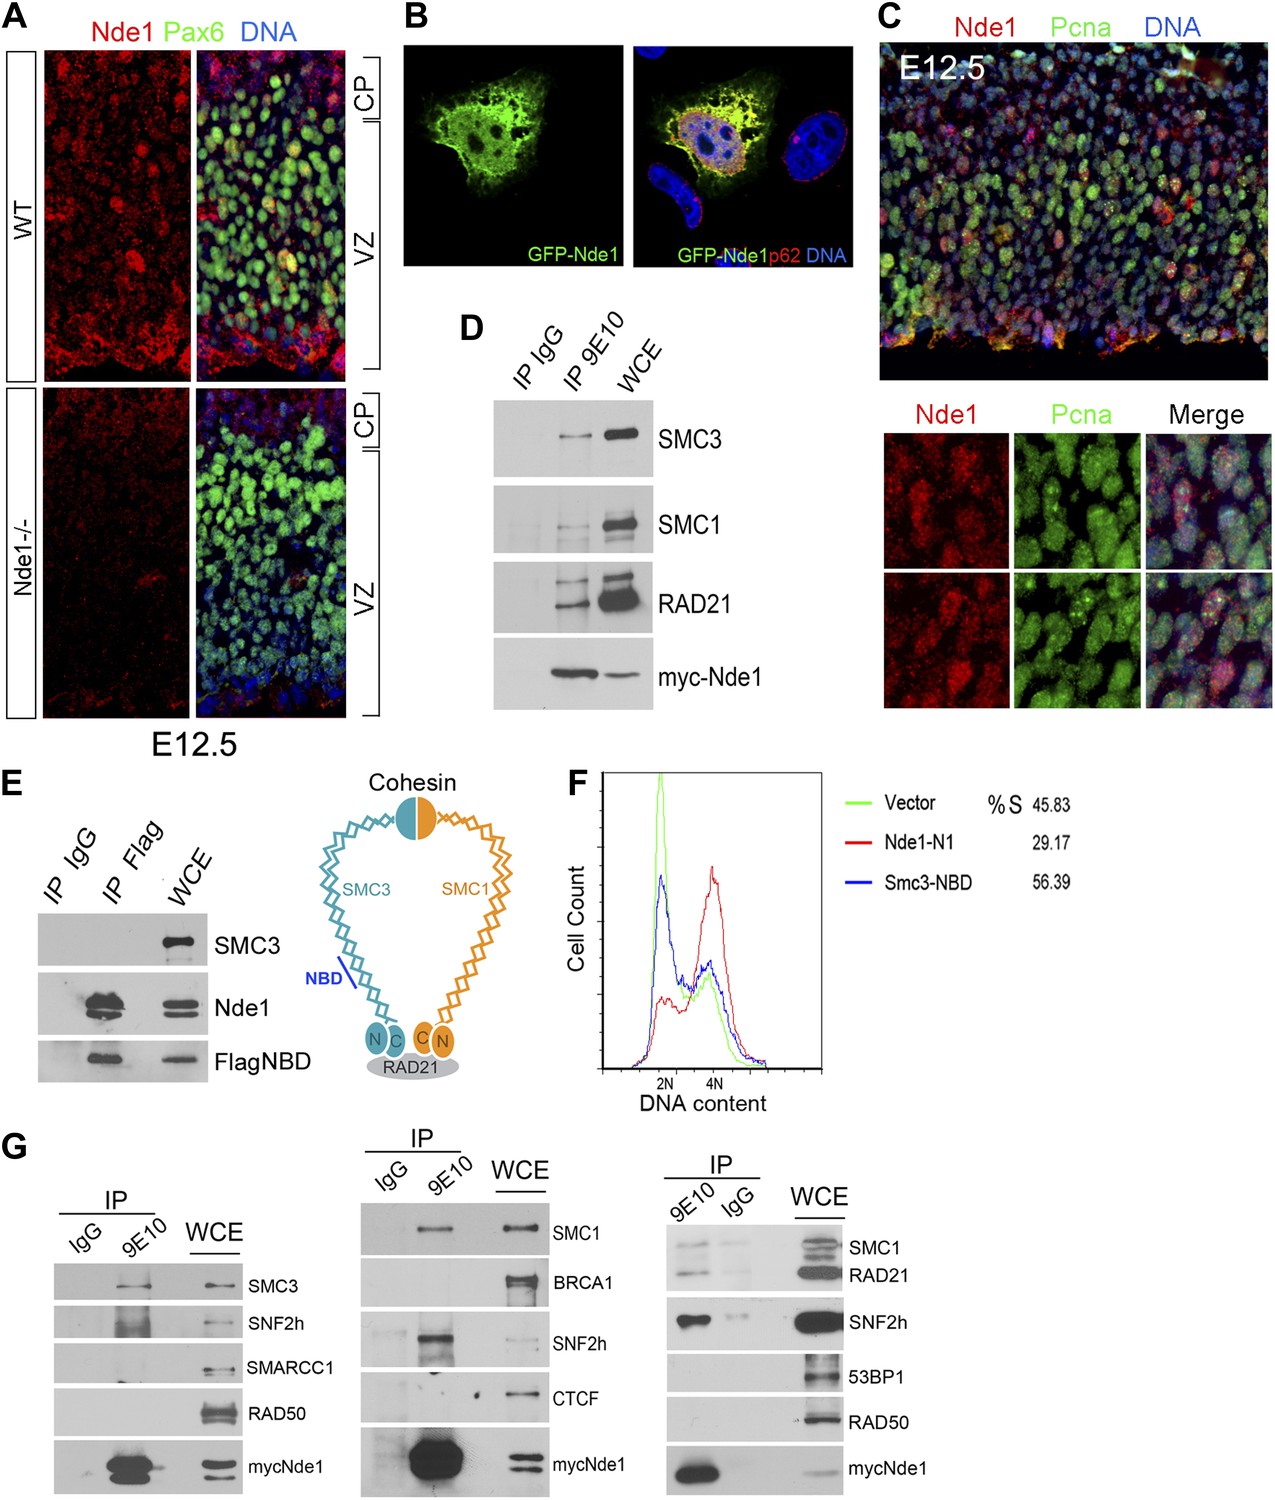
Identification of a nuclear pool of Nde1 that interacts with the cohesin complex.
(A) Double immunohistological staining with antibodies to Nde1 (red) and Pax6 (green) reveals the presence of Nde1 in the nucleus of cells in the neocortical VZ. Notice the detection of Ndel1 in the cortical neurons of the Nde1−/− brain due to the cross reactivity of anti-NDE1/Nde1 to Ndel1. (B) Immunofluorescence confocal image of GFP-Nde1 (green) transfected HeLa cells showing nuclear targeting. Cell nuclei are highlighted by co-staining with Nucleoporin p62 at the nuclear envelope (red) as well as with Hoechst (blue). (C) Immunohistological analysis reveals enhanced nuclear Nde1 (red) in S phase neural progenitors (identified by Pcna foci in green). (D) Co-immunoprecipitation of the cohesin complex with Nde1. Myc-Nde1 was transfected in 293T cells and immunoprecipitated by the anti-myc 9E10 antibody or mouse IgG. The presence of SMC3, SMC1, and RAD21 in the Myc-Nde1 immunocomplex is shown by immunoblotting. (E) Binding of SMC3 NBD with Nde1. Flag-NBD of SMC3 was co-transfected with GFP-Nde1 in 293T cells and immunoprecipitated by the Flag antibody and mouse IgG. The presence of GFP-Nde1 and the absence SMC3 in the Flag-NBD immunocomplex are shown by immunoblotting. A diagram of the cohesin complex and the Nde1 binding domain (NBD) of SMC3 is included. (F) Flow cytometry analysis of cell cycle DNA content of 293T cells transfected with the vector control, Flag-NBD, and MycNde1-N1, a Nde1 N-terminal fragment that was previously shown to induce G2/M arrest by blocking Nde1 dimerization. (G) Nde1 co-complexes with cohesin and its associated chromatin remodeler SNF2h. Myc-Nde1 transfected in 293T was immunoprecipitated by the anti-myc 9E10 antibody using the mouse IgG as negative control. After the positive identification of core subunits of cohesin in the Myc-Nde1 immunocomplex, the immunoblots were re-probed with antibodies to several cohesin interacting proteins. SNF2h was consistently found to co-complex with Nde1 and cohesin.
Figure 7—figure supplement 1
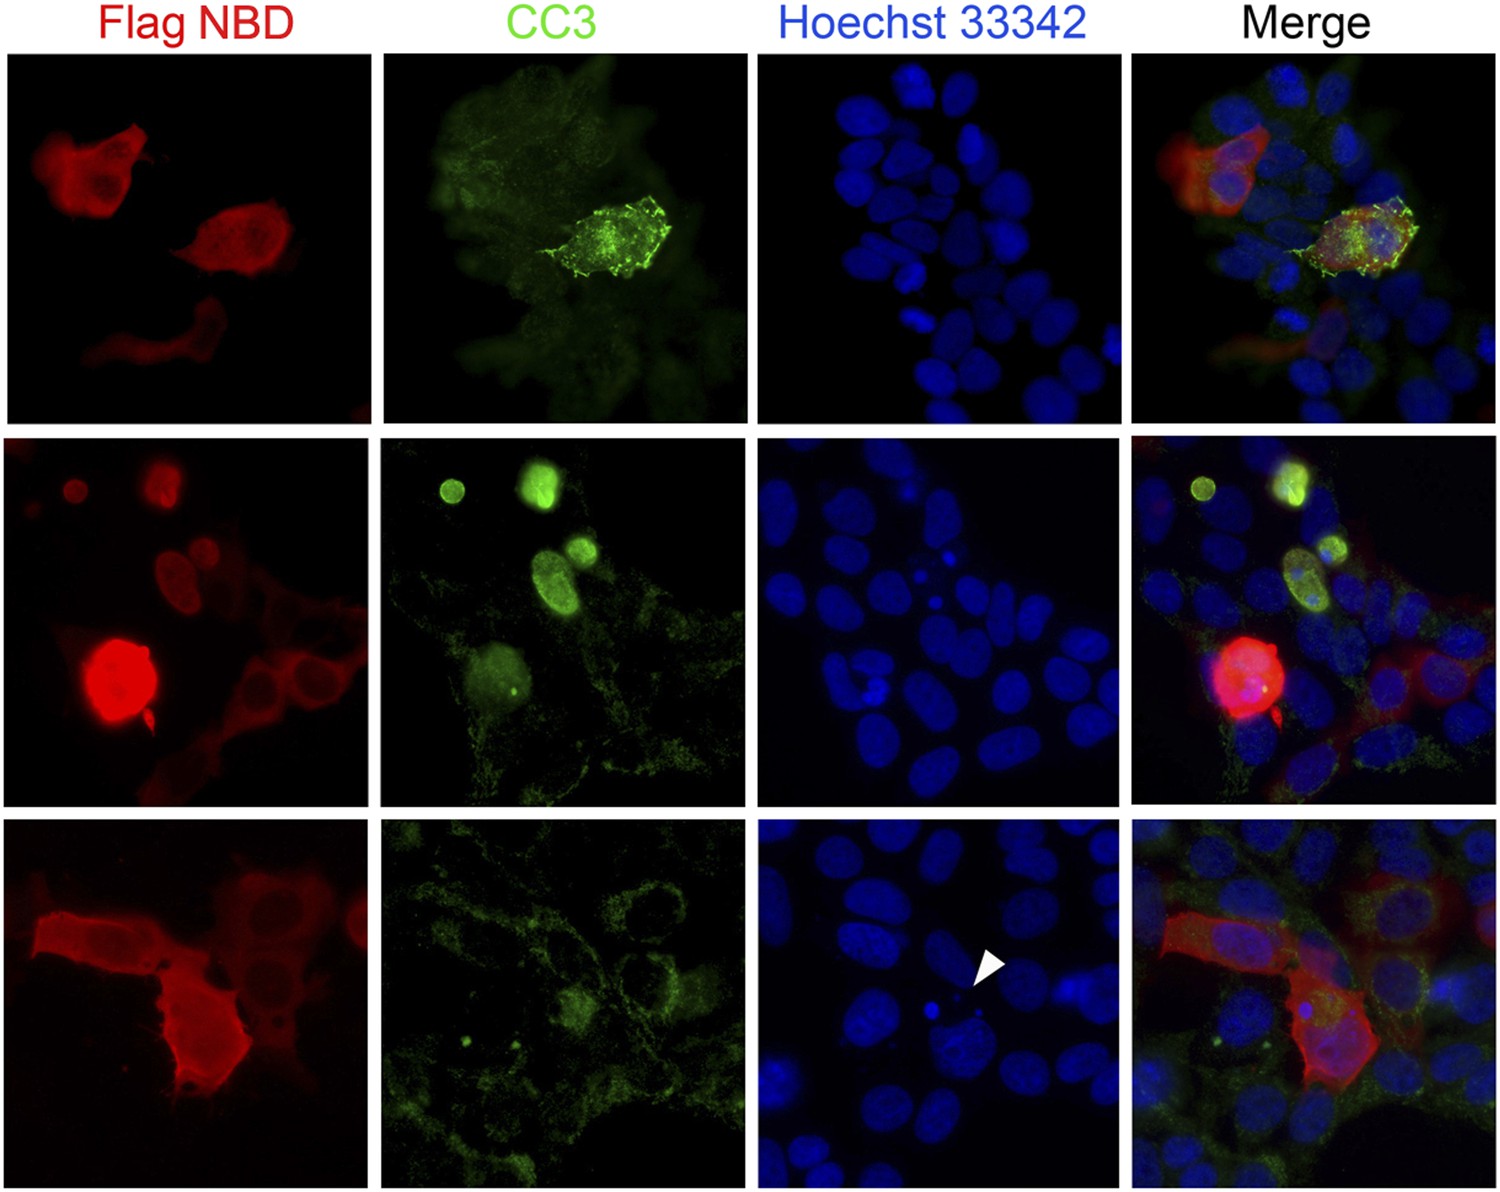
Blocking Nde1–cohesin interaction results in apoptosis.
Immunofluorescence analysis of 293T cells transfected by SMC3 Flag-NBD (red) showing increased apoptosis indicated by cleaved caspase 3 immunoreactivities (CC3, green) and micronuclei indicated by Hoechst (blue, arrow).
Figure 7—figure supplement 2
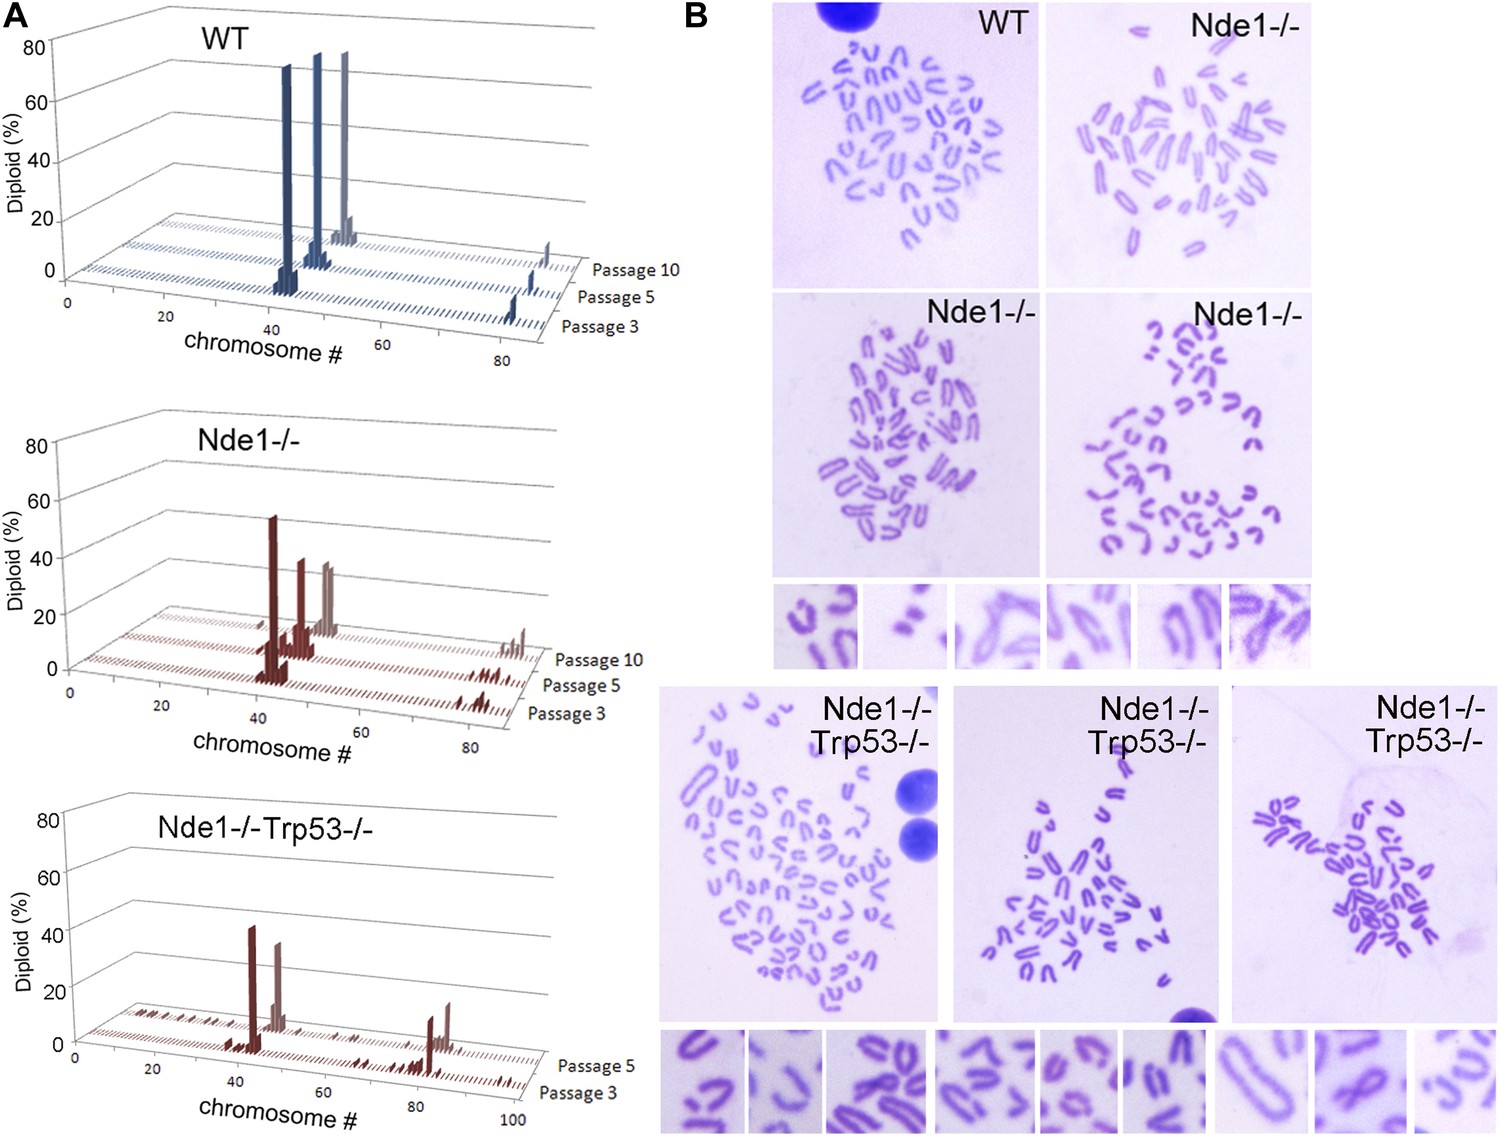
Increased genomic instability of Nde1 mutant MEFs.
(A) Karyotyping analysis shows the rapid development of aneuploidy in Nde1−/− and Nde1−/−Trp53−/− MEFs. Chromosome number distributions (% of total diploid cells) of wild-type and Nde1−/− MEF lines from passage 3 to passage 10, as well as Nde1−/−Trp53−/− MEFs from passage 3 to passage 5 are presented. (B) Examples of Giemsa stained wild-type, Nde1−/− and Nde1−/−Trp53−/− mitotic spreads; as well as high magnification images of chromosome aberrations observed in Nde1−/− and Nde1−/−Trp53−/− MEFs at passage 5.
Figure 8
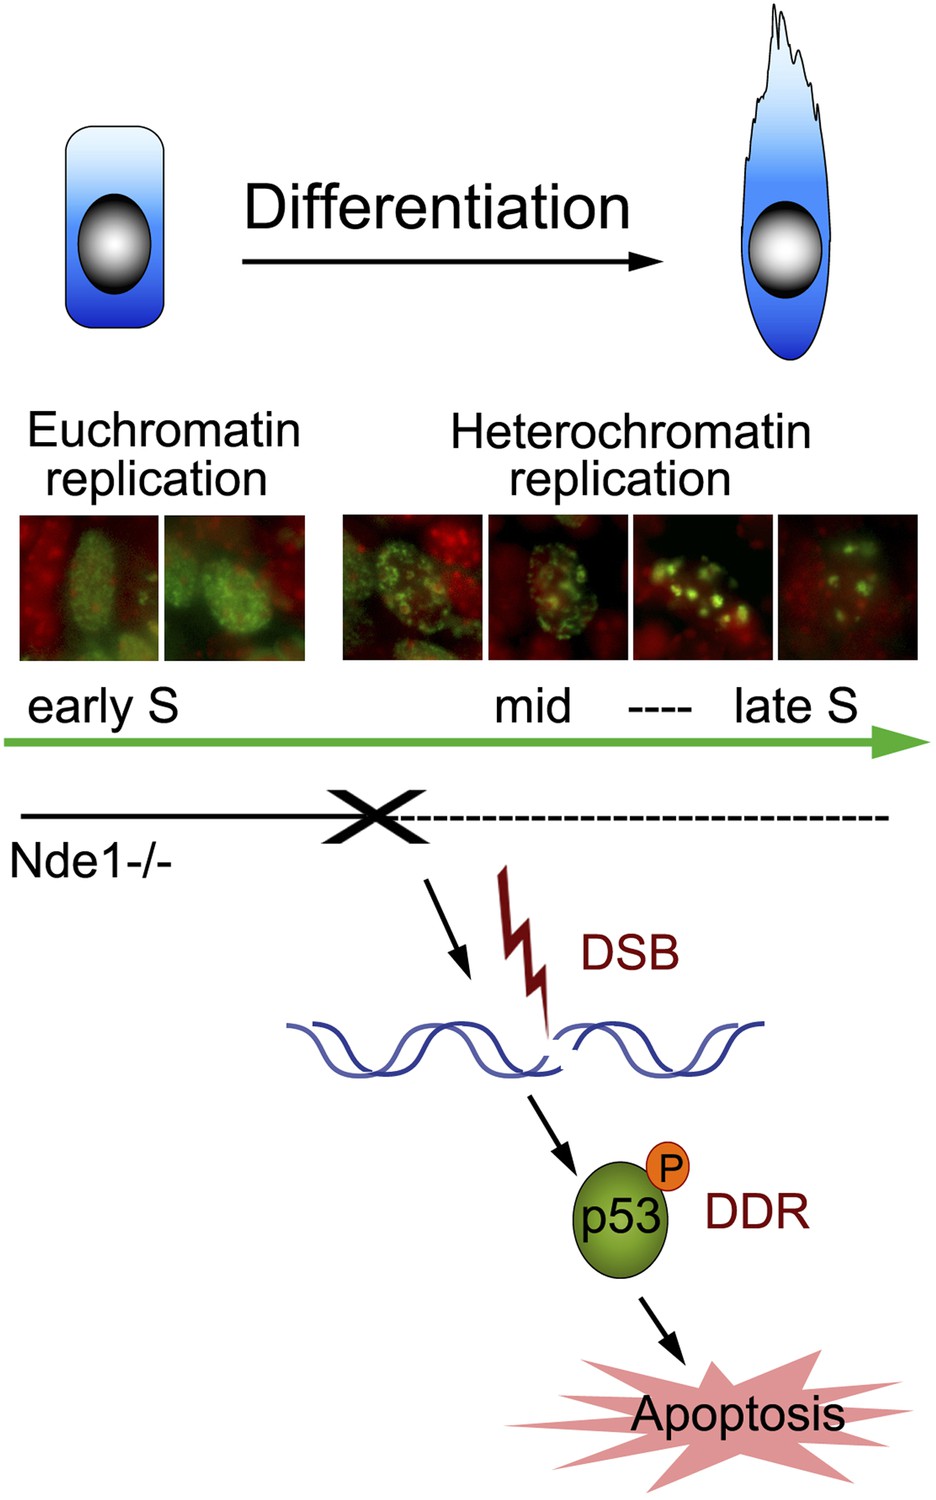
Nde1's role in maintaining genome integrity during early neural differentiation.
During early neural differentiation, Nde1 mutant progenitors experience catastrophic DNA damage concurrent with mid-late S phase, when heterochromatic replication occurs. This evokes a DNA damage response which leads to the activation of p53-dependent apoptosis and results in the reduction of neurons in cortical layer II/III.
Download links
A two-part list of links to download the article, or parts of the article, in various formats.
Downloads (link to download the article as PDF)
Open citations (links to open the citations from this article in various online reference manager services)
Cite this article (links to download the citations from this article in formats compatible with various reference manager tools)
The scaffold protein Nde1 safeguards the brain genome during S phase of early neural progenitor differentiation
eLife 3:e03297.
https://doi.org/10.7554/eLife.03297


