Epsin deficiency impairs endocytosis by stalling the actin-dependent invagination of endocytic clathrin-coated pits
- Howard Hughes Medical Institute, Yale University School of Medicine, United States
- Johns Hopkins University, United States
- UT Southwestern Medical Center, United States
Figures
Figure 1 with 1 supplement

Mitotic defects in epsin TKO fibroblasts.
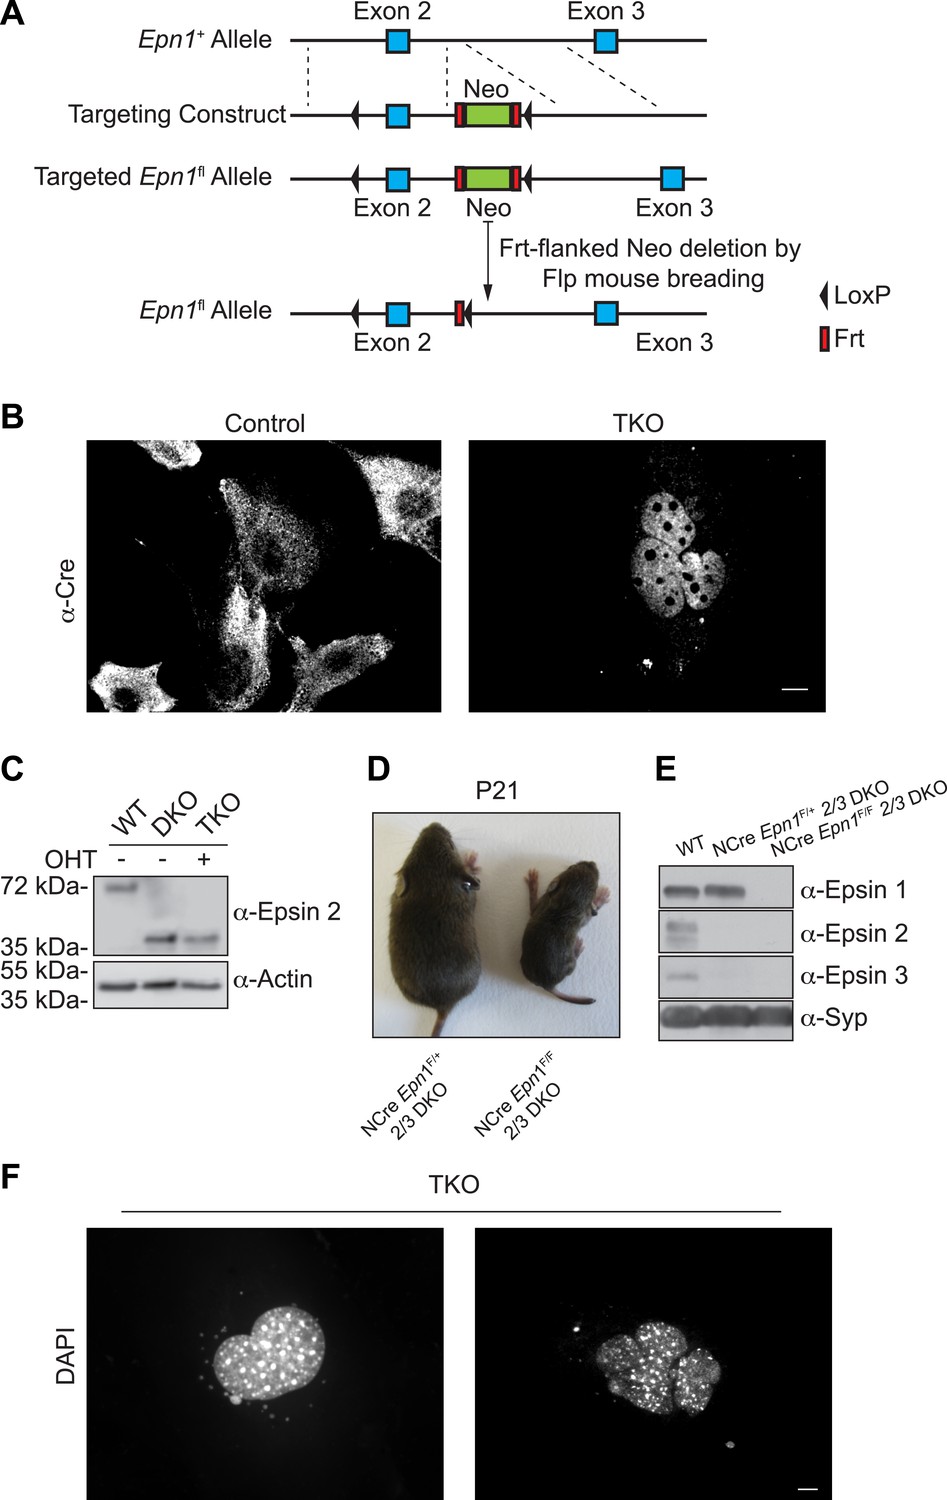
(A) Anti-epsin 1 immunoblot shows the disappearance of epsin 1 from Epn1loxP/loxP; Epn2−/−; Epn3−/−; Cre-ER+/0 cells after 7-day treatment with 4-hydroxy-tamoxifen (OHT). Tubulin was used as a loading control (top). Densitometric analysis of the epsin 1 band during OHT-treatment (bottom). (B) Anti-epsin immunoblots with isoform-specific antibodies showing OHT-treatment for 7 days results in the loss of epsin 1 in epsin 2/3 double knock-out (DKO) thus generating triple KO (TKO) cells. Wild type (WT) cell lysate was used as a control. (C) Anti-epsin 1 immunofluorescence shows that the typical punctate epsin 1 signal of WT cells (top) was completely absent in TKO cells (bottom). The perimeter of the TKO cell is indicated by a dotted white line and demonstrates a very large size relative to WT cells. The insets show higher magnification of the boxed regions. (D) DAPI staining showing single nuclei in WT and multiple nuclei in a TKO cell. The inset of the WT field shows the accumulation of AuroraB kinase immunoreactivity at the mid-body during cytokinesis. (E) The increase in cell number during a 3-day incubation is lower in TKO cells. Cells were counted at day 7 and 9 after addition of OHT (**p < 0.01, Student's t test, n = 3 experiments). (F) As shown by a morphometric analysis, cytokinesis events are only rarely observed in TKO cells. Scale bar represents 10 μm. Data are represented as mean ± SEM. See also Figure 1—figure supplement 1.
Figure 1—figure supplement 1
The generation of triple KO cells, nestin Cre brain specific triple KO mice, and the observation of nuclear defect in TKO cells.
(A) Homologous recombination of the floxed-gene targeting vector at the Epn1 locus. (B) Cre recombinase immunostaining of MEFs before and after OHT treatment showing the translocation of Cre from the cytosol (control: epsin 2 and 3 DKO cells) into the nucleus (TKO) after the chemical treatment. (C) WT, epsin 2 and 3 double KO (DKO), and epsin TKO cell lysates were subjected to epsin-2 immunoblotting. A 40-kDa fragment, corresponding to a C-terminal portion of the epsin 2, was identified in DKO and TKO. Actin was used as a loading control. (D) Nestin Cre brain specific epsin TKO (NCre Epn1F/F 2/3 DKO) mouse and control littermate (heterozygous for epsin 1 and double KO for epsin 2 and 3, NCre Epn1F/+ 2/3 DKO) at P21. Note the significantly smaller size of the TKO. (E) Brain lysates from 4-week-old WT, Epn1loxP/+; Epn2−/−; Epn3−/−; Nestin-CRE+/0 (NCre Epn1F/+ 2/3 DKO) and Epn1loxP/loxP; Epn2−/−; Epn3−/−; Nestin-CRE+/0, (NCre Epn1F/F 2/3 DKO, Epsin TKO) mice were analyzed by epsin isoform-specific immunoblotting. Synaptophysin (Syp) was used as loading control. (F) DAPI staining of different nuclear morphologies identified in epsin TKO MEFs. The absence of epsin generates cells that often contain abnormally shaped nuclei (left panel) or multiple clusters of nuclei (right panel). Scale bars represent 10 μm.
Figure 2 with 1 supplement
Absence of epsin stalls endocytic clathrin-coated pit maturation at an early stage.
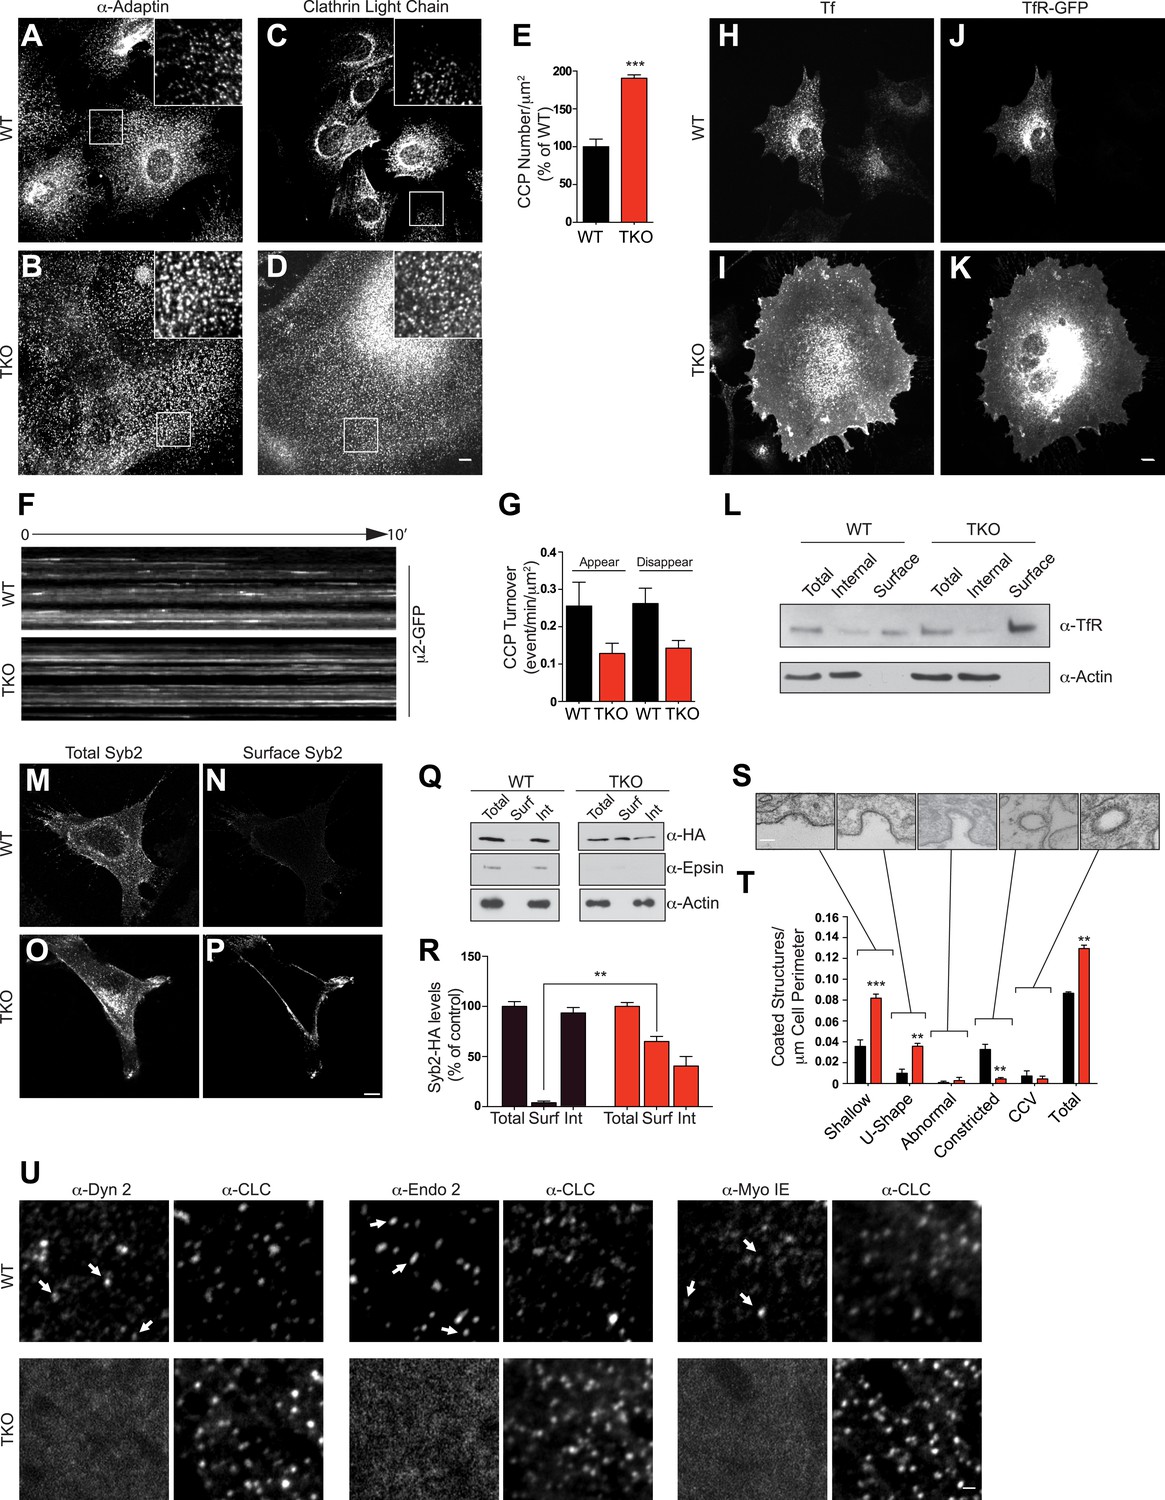
Confocal microscopy. (A–D) Immunofluorescence staining for α-adaptin (A and B) and clathrin light chain (C and D) indicates an increase of clathrin-coated pits (CCPs) number in cells that lack all three epsins. In TKO cells, clathrin-coated pits generally occur in small clusters. Insets show the boxed regions at high magnification. Note the large size of TKO cells relative to control. (E) CCP number in WT and TKO cells as assessed by α-adaptin immunofluorescence (***p < 0.001, Student's t test, n = 10 cells/genotype). (F) Kymographs from a time series of WT and TKO cell expressing μ2-adaptin-GFP. Each line represents a single μ2-GFP spot. Note the short length of the lines for WT, reflecting the turnover of the pits and the continuous lines in TKO cells, reflecting an arrest of the pit maturation. (G) Clathrin-coated pit turnover (appearance and disappearance events) as analyzed by spinning-disk confocal imaging of μ2-adaptin-GFP fluorescence in WT and TKO cells (n = 5 cells/genotype). (H and I) Impaired uptake of pre-bound Alexa594-transferrin (Tf) in TKO cells during a 15-min incubation. In WT, the bulk of Tf was internalized, while in TKO Tf remained at the cell surface. (J and K) Transferrin receptor (TfR)-GFP predominantly localizes in intracellular vesicles in WT but at the cell surface in TKO cells. (L) A surface biotinylation assay reveals elevated amounts of endogenously expressed TfR at the plasma membrane of TKO cells relative to WT, as assessed by anti-TfR immunoblotting of streptavidin affinity-purified material. (M–P) Increased surface localization of stably expressed Syb2-HA in TKO fibroblasts as shown by total (M–O) and surface-only (N–P) immunofluorescence. (Q and R) A surface biotinylation performed as in (L) demonstrating an increased fraction of cell surface exposed Syb2-HA in TKO cells relative to WT (**p < 0.01, Student's t test, n = 4 experiments, Surf: surface, Int: internal). (S and T) Representative electron microscopy images of different stage endocytic clathrin-coated intermediates in TKO cells (S) and quantification of the corresponding stages (T, **p < 0.01, ***p < 0.001, n = 33 cells/genotype, one-way ANOVA). (U) Comparative analysis of the localization of clathrin immunoreactivity (CLC) with the localization of dynamin 2, endophillin 2, and myosin 1E immunoreactivities. In WT cells, these three proteins co-localize with a subset of clathrin-coated pits (examples are indicated by small white arrows), which represent late-stage pits. In TKO cells, where more numerous clathrin-coated pits are observed, the punctate localization of dynamin 2, endophillin 2, and myosin 1E is completely lost. Scale bars: 10 μm for (A–D, H–K), 20 μm for (M–P), 5 μm for (U), and 200 nm for (S). In E, G, R, and T black bars indicate WT and red bars epsin TKO. See also Figure 2—figure supplement 1.
Figure 2—figure supplement 1
Endocytic defect in epsin TKO cells is not due to alteration in endocytic protein levels and it is rescued by epsin1–GFP.
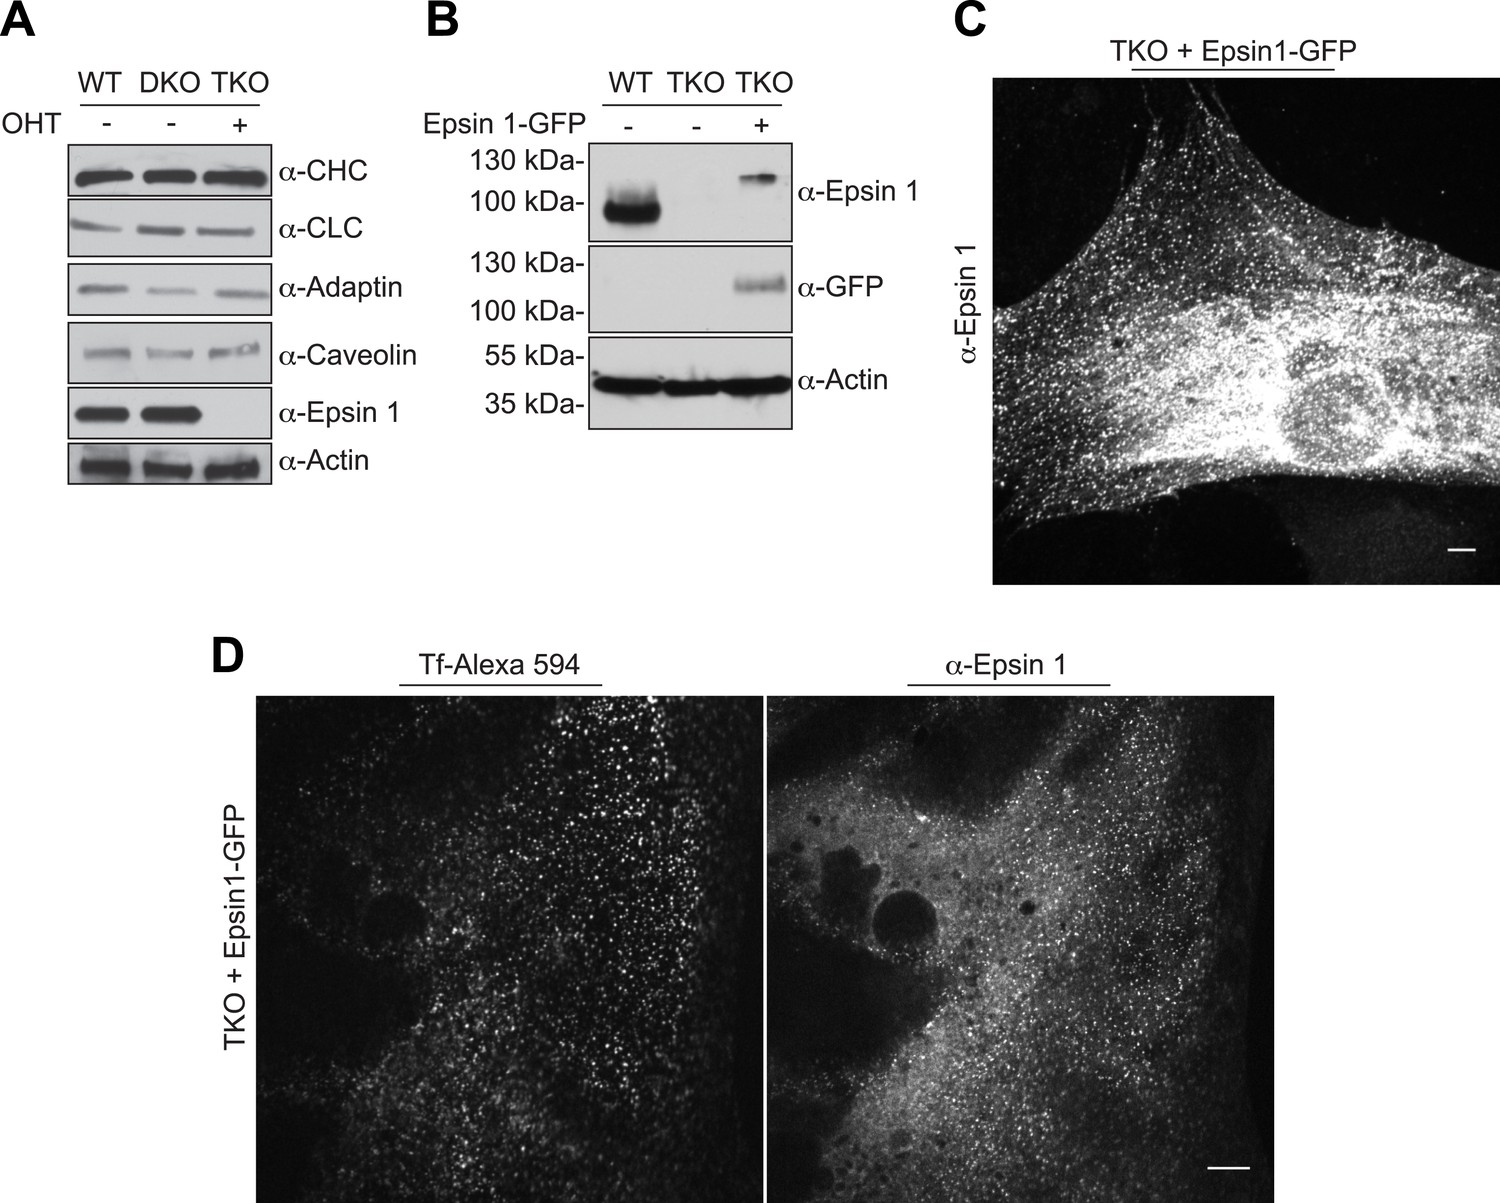
(A) Immunoblotting comparison of the levels of the indicated clathrin-coated pit proteins in WT, epsin DKO, and epsin TKO cell lysates shows that the levels of clathrin light and heavy chain (CLC and CHC), α-adaptin and caveolin were unaffected by the absence of epsin. Epsin 1 immunoblotting was used to confirm the efficiency of the OHT treatment while actin was used as a loading control. (B) WT, epsin TKO, and epsin 1-GFP transfected epsin TKO cell lysates were subjected to immunoblotting for epsin 1 and GFP, showing the presence of epsin (and GFP) immunoreactvity in TKO only after transfection. Actin was used as loading control. (C) Anti-epsin 1 immunostaining of an epsin TKO cell overexpressing epsin 1–GFP shows the typical epsin punctate signal. (D) Reintroduction of epsin 1 in TKO cells by overexpression of epsin1–GFP cDNA (right panel) rescued the internalization of transferrin inside the cell (left panel) after 30 min of incubation on ice followed by 15 min of incubation at 37°C. Scale bars are 10 μm.
Figure 3
Abnormal actin distribution in epsin deficient cells.
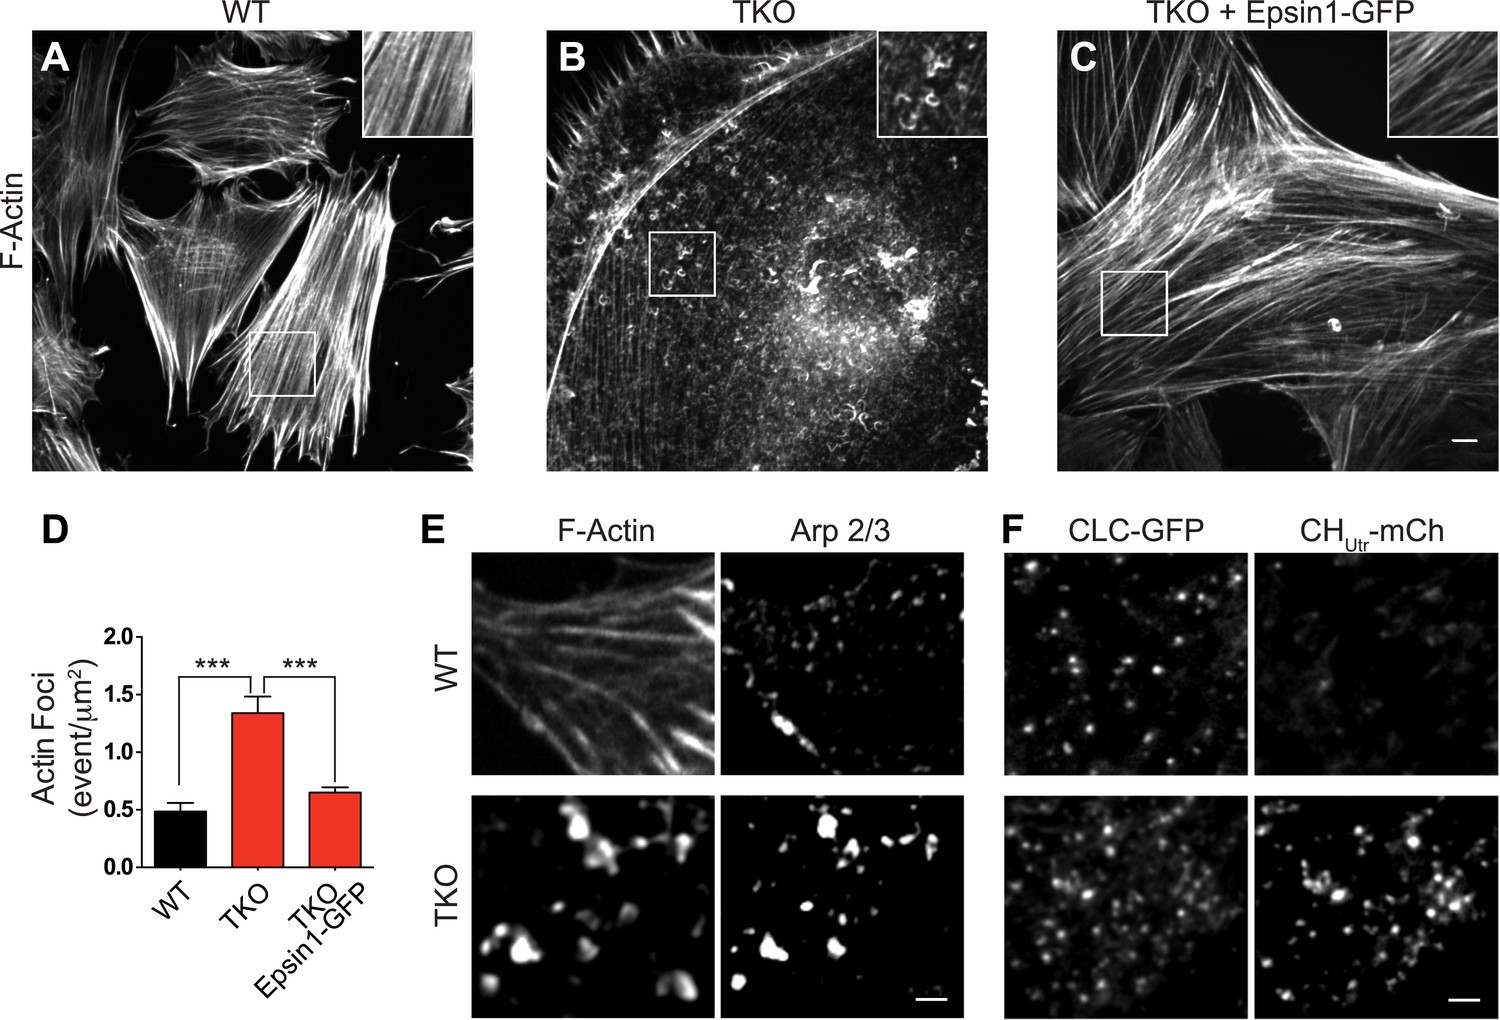
(A–C) Confocal microscopy images. Phalloidin staining of WT and epsin TKO cells shows a major loss of stress fibers with a corresponding accumulation of elongated F-actin foci (see inset) in TKO cells. These changes were rescued by the expression of epsin1–GFP (C). (D) Quantification of the actin foci shown in (A–C, ***p < 0.001, n = 8 cells/conditions, one-way ANOVA). (E) Phalloidin staining and Arp 2/3 immunoreactivity in a WT and a TKO cell showing the co-localization of Arp 2/3 with the actin foci, as visualized by confocal microscopy. (F) TIRF microscopy of WT and TKO cells expressing clathrin light chain–GFP (CLC–GFP) and the F-actin binding protein utrophin–mCherry (CHUtr–mCh). Note the increase in F-actin (CHUtr–mCh signal) typically surrounding the clathrin-coated pits, in the cortical region (TIRF plane) of the TKO cell. Virtually all pits are positive for CHUtr–mCh. Scale bars: 10 μm for (A–C), 5 μm for (E and F). Data are represented as mean ± SEM.
Figure 4
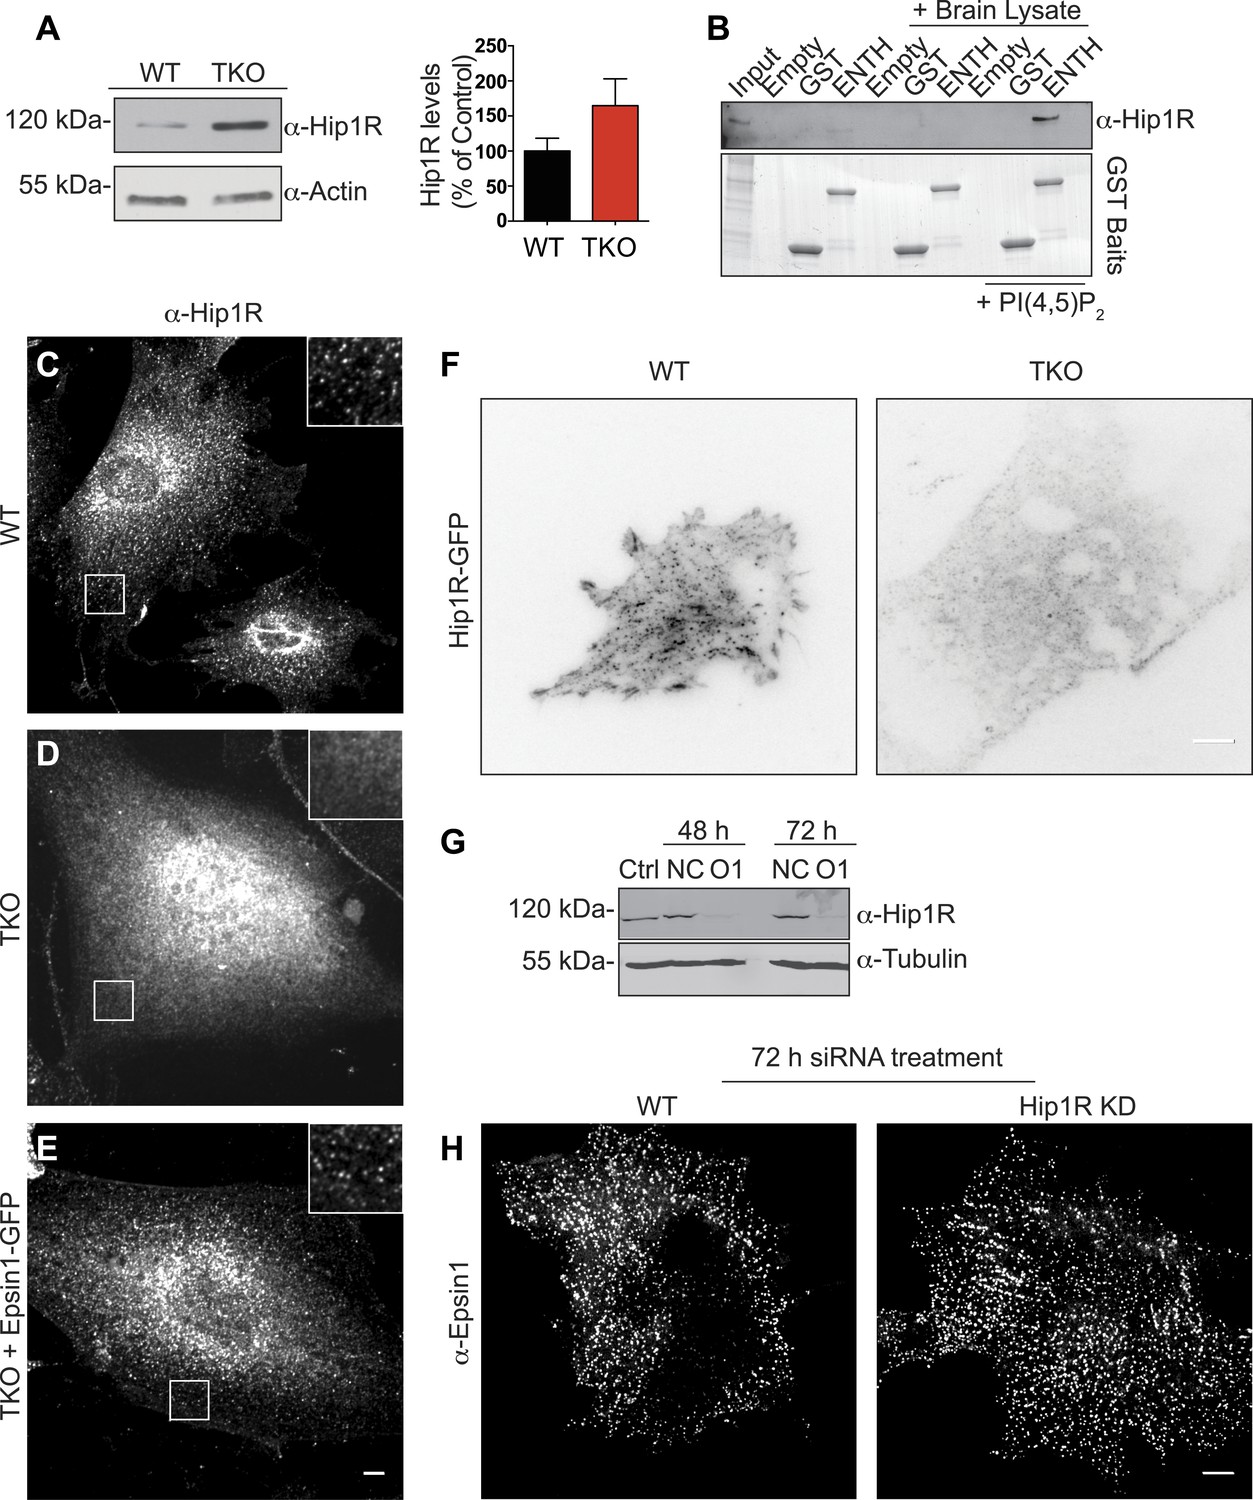
Epsin is required for the recruitment of Hip1R at the endocytic clathrin-coated pits.
(A) Immunoblot analysis of Hip1R (left) shows an increase (as quantified in the right) of its levels in epsin TKO cells. (B) Pull down experiments from rat brain homogenate, using ENTH–GST or GST alone as bait, shows the affinity-purification of Hip1R in the presence of diC8-PI(4,5)P2 [PI(4,5)P2, top]. Coomassie blue stained gel of the baits (bottom). (C–E) Anti-Hip1R immunofluorescence of representative WT and TKO cells. The clathrin-coated pit pattern of Hip1R in WT (see also high magnification insets) was replaced by a diffuse localization in the TKO cell, but was rescued by expression of epsin1–GFP. (F) WT and TKO cells were transfected with Hip1R–GFP and imaged by live TIRF microscopy (fluorescence is shown in black). The punctate accumulation (clathrin-coated pits) of Hip1R at the cortex of WT was lost in the TKO cell. (G and H) siRNA-mediated knockdown of Hip1R (G, Ctrl: non-transfected control; NC: scramble control; O1: Hip1R specific double-stranded siRNA) does not affect epsin localization in HeLa cells as shown by epsin immunofluorescence (H). Scale bars represent 10 μm. Data are represented as mean ± SEM.
Figure 5 with 1 supplement
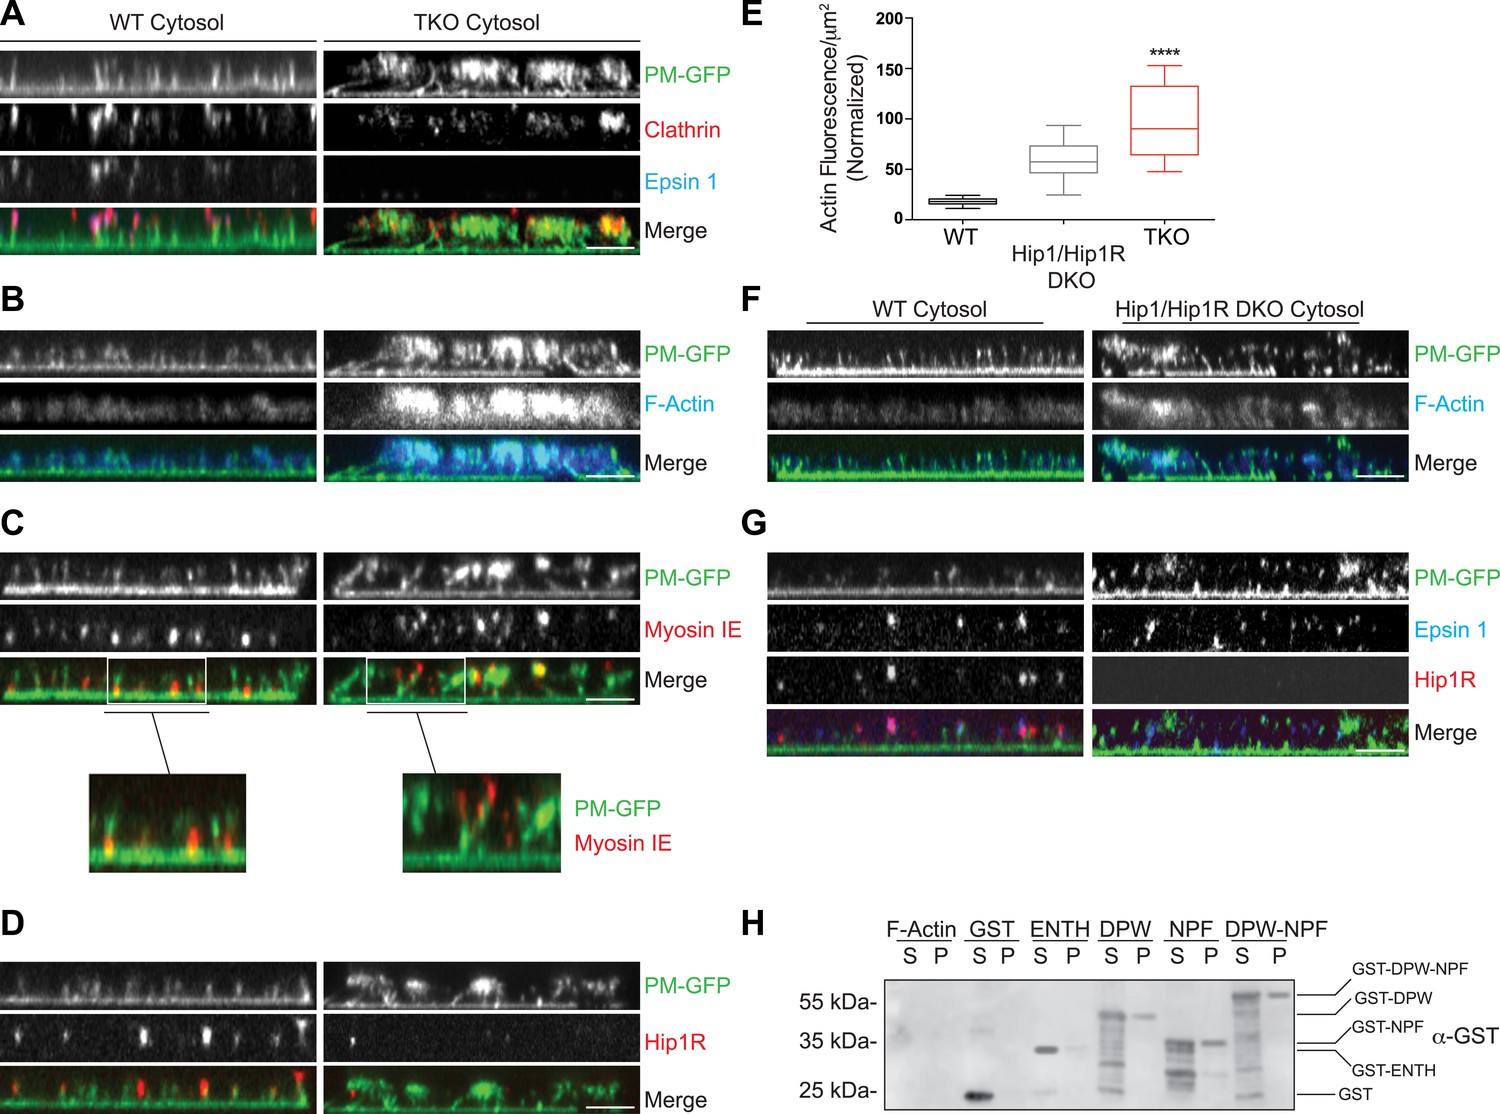
Coupling of clathrin-dependent budding to actin dynamics in a cell-free assay is perturbed by the absence of epsin.
Plasma membrane sheets of PTK2 cells expressing PM-anchored GFP (PM–GFP) were incubated in the presence of WT, epsin TKO or Hip1/Hip1R double KO (DKO) brain cytosol, and nucleotides as described in Wu et al. (2010), fixed, immunostained, and observed by confocal microscopy. Views orthogonal to the substrate are shown. (A) Immunofluorescence staining for clathrin light chain and epsin 1. The GFP-positive columns represent narrow tubular invaginations of the plasma membrane capped by clathrin-coated pits, as revealed by the presence of clathrin and epsin immunoreactivity (Wu et al., 2010). In the control preparation (left) tubules are straight and perpendicular to the substrate, while in the preparation incubated with TKO cytosol (right, note the absence of epsin immunoreactivity) they have a more disordered orientation. (B) Phalloidin staining of the membrane sheets revealing a well-organized actin scaffold around the tubules after incubation with WT cytosol (left) and an exaggerated and disorganized F-actin network in sheets incubated with TKO cytosol (right). (C) Myosin 1E immunoreactivity localizes at the bottom of tubular invaginations in sheets incubated with WT cytosol (left), and at the tip of the invaginations after incubation with TKO cytosol (right). Details of the sheets are shown at high magnification below the main panels. (D) Hip1R immunoreactivity is present at the tip of tubular invaginations in the control samples (left), but is absent in sheets incubated with epsin TKO cytosol (right). (E) Quantification of F-actin polymerization upon incubation with the cytosol of the three tested genotypes (WT, epsin TKO, and Hip1/Hip1R DKO). The average phalloidin fluorescence per unit area of membrane sheets was calculated (n = 10 sheets/conditions, ****p < 0.0001, one-way ANOVA). (F) Phalloidin staining of sheets incubated with Hip1/Hip1R double KO (right) cytosol reveals an exaggerated and disorganized F-actin network relative to WT (left), but not as prominent as that observed in preparations incubated with epsin TKO cytosol. (G) Immunofluorescence staining for epsin 1 and Hip1R shows that the presence of epsin 1 at the tips of the invagination is not strongly modified by the absence of Hip1 and Hip1R. (H) The disordered C-terminal tail of epsin binds F-actin. GST fused epsin 1 fragments (ENTH domain, DPW, NPF, and DPW-NPF containing regions) were incubated (5 μM final concentration) with previously polymerized F-actin (15 μM) and then subjected to ultracentrifugation followed by SDS-PAGE and anti-GST immunoblotting of the supernatant (S) and pellet (P) materials. Scale bars: 5 μm. Data are represented as mean ± SEM. See also Figure 5—figure supplement 1.
Figure 5—figure supplement 1
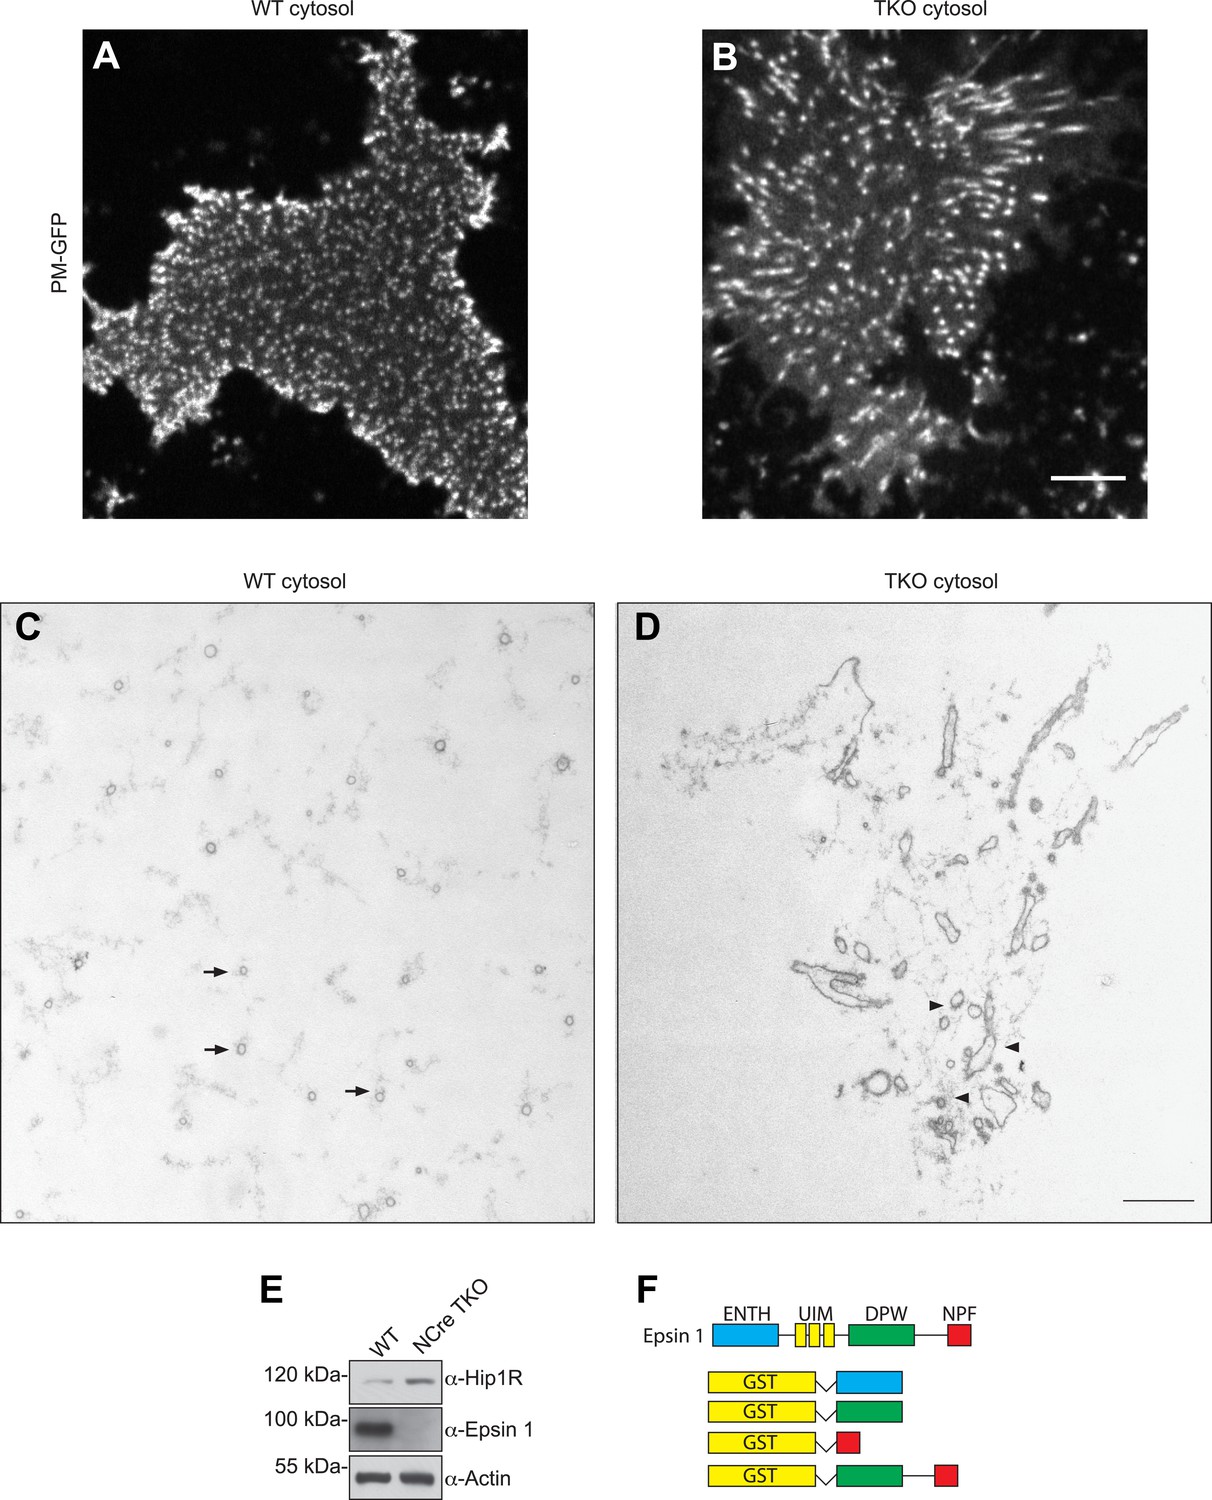
Nestin Cre epsin TKO brain cytosol has increased Hip1R level and disrupted membrane tubulation in a cell-free assay.
(A and B) En face views of fixed membrane sheets from PM–GFP stably expressing PTK-2 cells after incubation with WT or espin TKO brain cytosol in the presence of ATP and GTPγS. In the WT-incubated sample, each of the GFP positive puncta corresponds to a clathrin-capped invagination that grows perpendicular to the plasma membrane plane (A), while this orientation is lost when membrane sheets are incubated with epsin TKO brain cytosol (B). (C and D) Representative transmission electron microscopy images of membrane sheets incubated with WT (C) or epsin TKO (D) brain cytosol in sections parallel to the substrate. Note the regularly spaced tubules interspersed in a well-organized actin meshwork (arrows) in the WT incubated sample (C), while in the absence of epsins the tubules are irregular, obliquely cut, and surrounded by a dense actin matrix (D, arrowheads). (E) Immunoblotting shows the increase in total Hip1R levels in brain-specific epsin TKO (NCre TKO) compared to WT brain lysate. (F) Epsin GST recombinant fragments used in the co-sedimentation assay with F-actin as shown in Figure 5H. Scale bar represents 10 μm in (A) and (B) and 1 μm in (C) and (D).
Figure 6 with 1 supplement
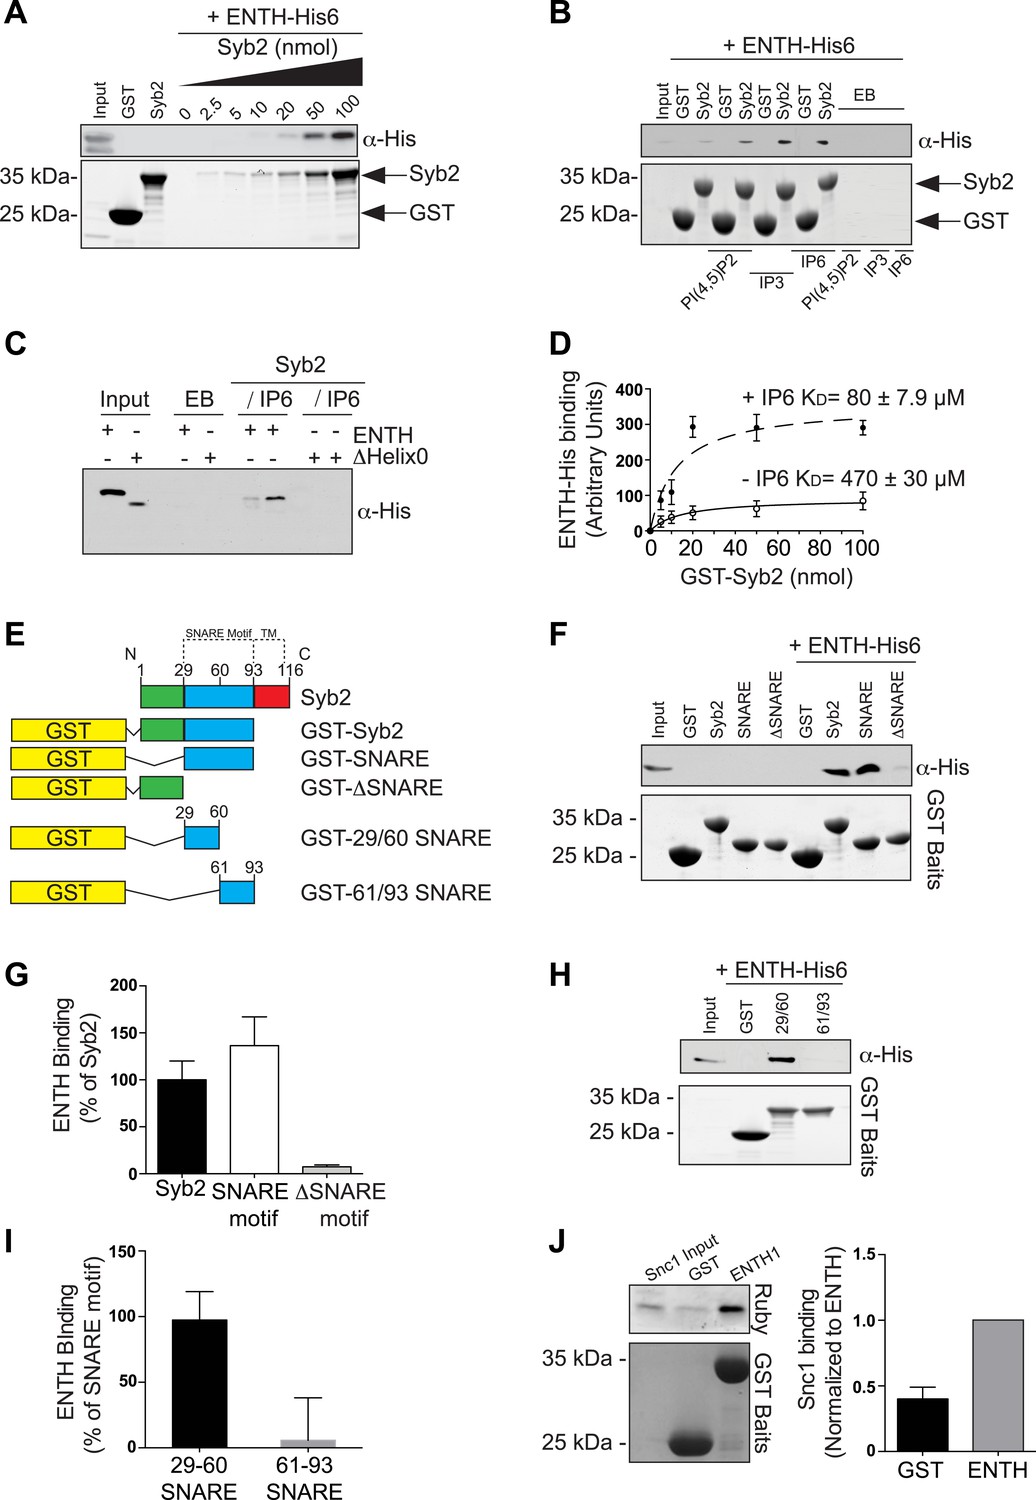
Epsin directly binds synaptobrevin 2/VAMP2.
(A) Interaction of purified epsin ENTH–His6 (800 ng) with increasing amounts of GST-cytosolic portion of synaptobrevin2 (Syb2) as revealed by anti-His immunoblotting of bound material in a GST pull-down (top). Coomassie blue stained gel of the baits (bottom). (B) The interaction of epsin ENTH–His6 with equal amounts of GST–Syb2 (Syb2) is enhanced by the presence of soluble diC8-PI(4,5)P2 (PI(4,5)P2), IP3 or IP6 (final concentration 50 μM). Top: anti-His immunoblotting. Bottom: Coomassie blue stained gel of the baits. EB: empty beads. (C) The interaction of epsin ENTH–His6 with equal amounts of GST–Syb2 is lost in a construct missing the N-terminal helix zero (ΔHelix0) irrespective of the presence of IP6 (final concentration 50 μM). EB: empty beads. (D) Quantitative analysis of the binding of ENTH–His6 to increasing amounts of GST–Syb2 in the presence or absence of IP6, as revealed by densitometry of anti-His immunoreactivity in western blots of bound material. KDs are also indicated. (E) Schematic representation of constructs used for (F–I). SNARE motif and transmembrane region (TM) are denoted by dotted lines. (F and G) Pull-down of ENTH–His6 by GST fusions of different cytosolic fragments of Syb2. Anti-His immunoblotting (F) shows binding only to SNARE motif containing fragments (top). Coomassie blue stained gel of the baits (Bottom). Quantitative analysis of the results is shown in (G). (H and I) ENTH–His6 domain binding to SNARE motif fragments (H) and corresponding quantification (I). Anti-His immunoblotting detects ENTH interaction with the N-terminal portion of the SNARE motif. (J) Purified yeast His-Snc1 binds a GST fusion of the ENTH domain of Ent1 (yeast epsin 1) in a pull down assay (top). Coomassie blue stained gel of the baits (Bottom). Corresponding quantification is shown. Data are represented as mean ± SEM. See also Figure 6—figure supplement 1.
Figure 6—figure supplement 1
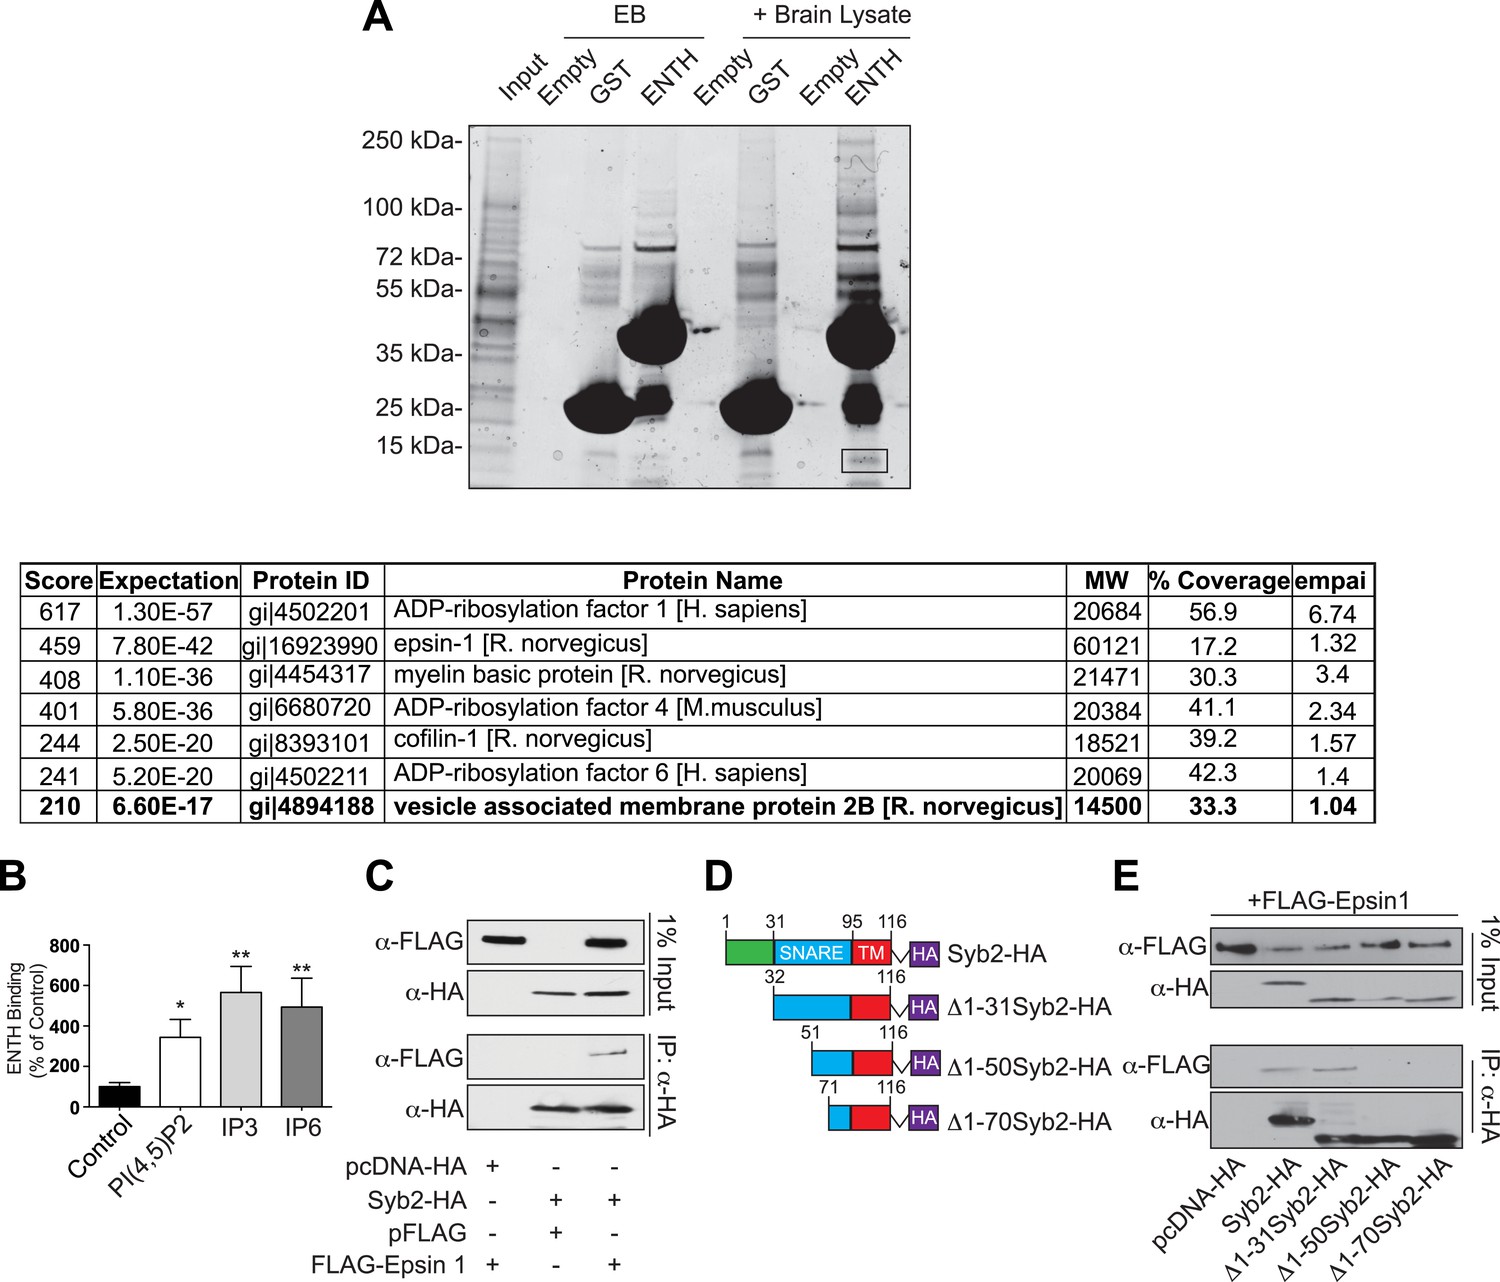
Epsin binding to Syb2: mass spectroscopy analysis and interaction in intact cells.
(A) GST pull-down from mouse brain lysate using epsin ENTH domain or GST (negative control) as bait (top). Empty beads (EB) indicate the samples incubated in beads + buffer only. The band surrounded by a black square contains Syb2 as demonstrated by mass spectroscopy (bottom). (B) Quantification of the ENTH–Syb2 binding described in Figure 6C (*p < 0.05, **p < 0.01, n = 4, one-way ANOVA). Data are represented as mean ± SEM. (C) HeLa cells transfected with the indicated cDNAs were lysed, and the extracts were subjected to anti-HA immunoprecipitation (IP). Samples were processed for immunoblotting with anti-HA or anti-FLAG antibodies demonstrating the interaction between epsin and Syb2 in intact cells. (D) Schematic representation of HA recombinant truncation mutants of Syb2 transfected into HeLa cells for co-immunoprecipitation experiments. (E) Extract from HeLa cells transfected with the indicated Syb2 truncated recombinant proteins and FLAG-epsin 1 were subjected to anti-HA immunoprecipitation (IP) and immunoblotted with anti-HA or anti-FLAG antibodies. Epsin preferentially binds constructs including the N-terminal portion of the SNARE motif of Syb2 also in intact cells.
Figure 7
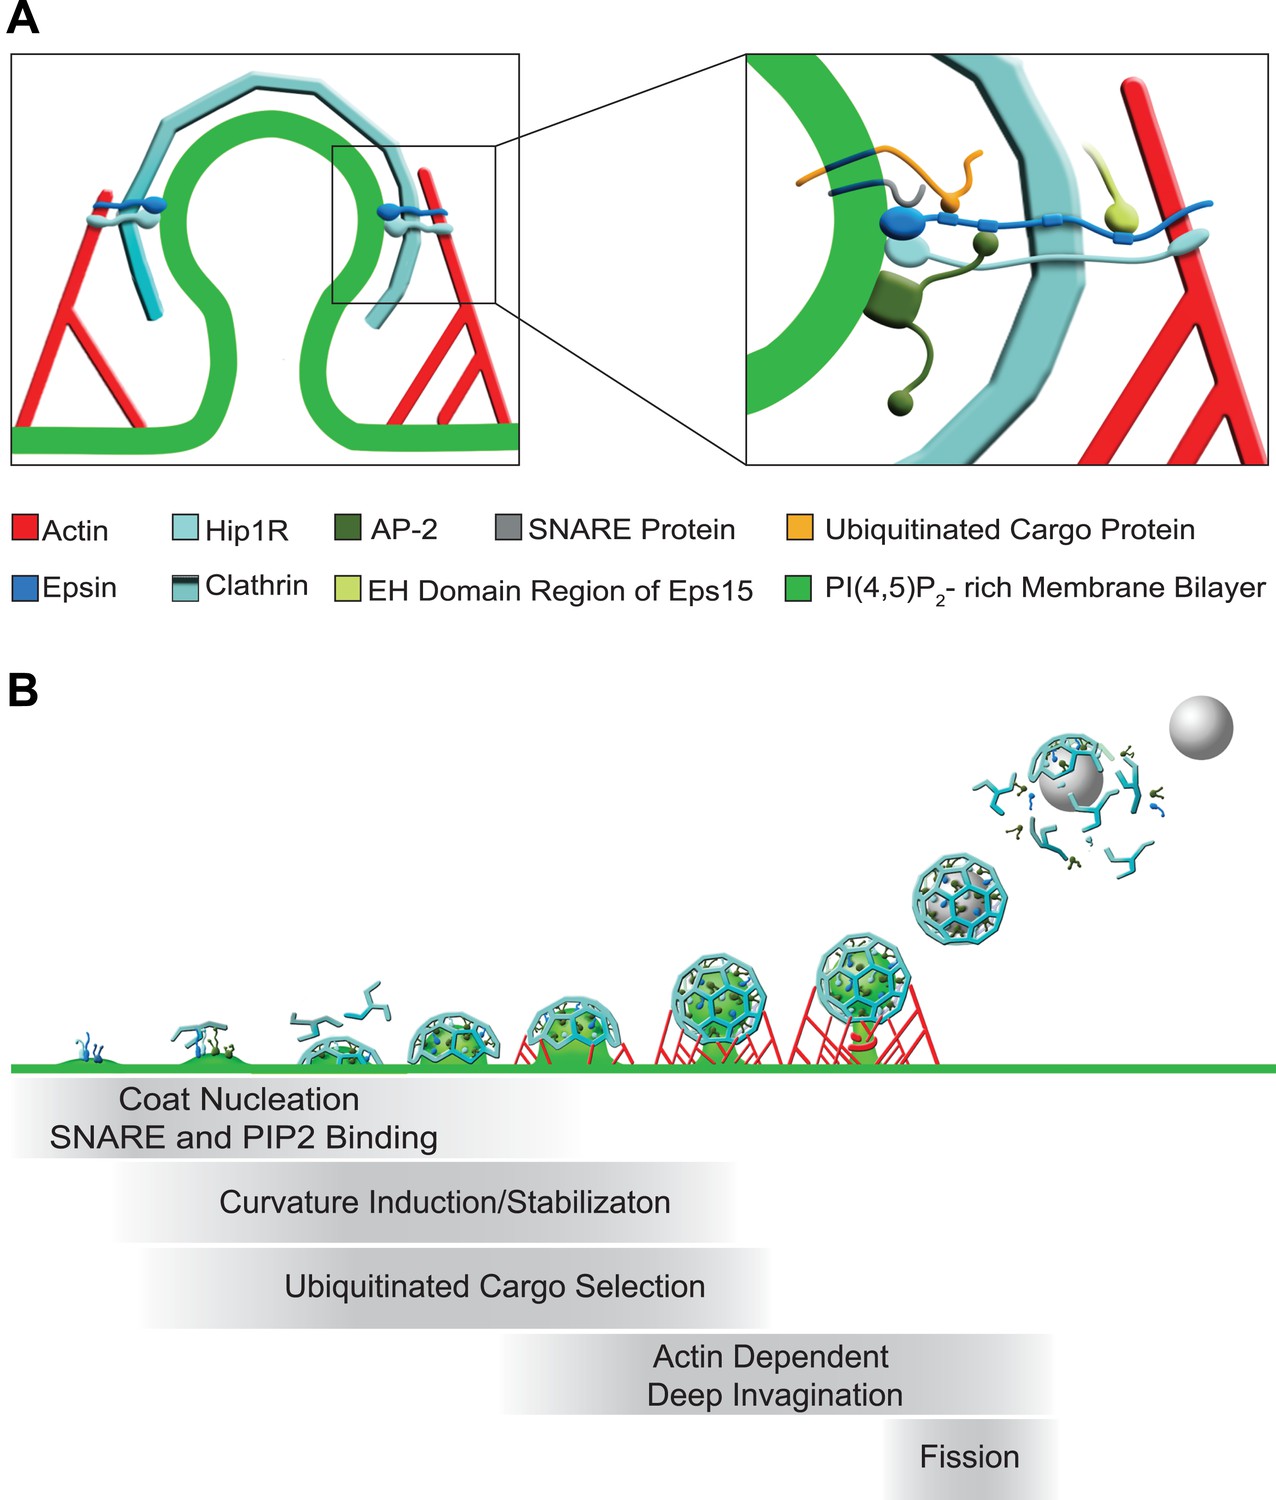
Functions of epsin in clathrin-mediated endocytosis.
(A) Schematic representation of the role of epsin in the coupling of the endocytic clathrin coat to actin in cooperation with Hip1R (left). This coupling helps invaginate the pit. Only epsin localized at the equator of the bud is shown to emphasize its actin-related function in pit invagination, but epsin is not restricted to the equator. Higher magnification representation of the interactions of epsin (right): the N-terminal ENTH domain binds (1) the PI(4,5)P2-rich membrane bilayer of the plasma membrane (and partially penetrates it), (2) the ANTH domain of Hip1R, and (3) synaptobrevin2/VAMP2; its tail binds (1) ubiquitinated cargo proteins (via UIMs), (2) AP-2 and clathrin heavy chain (via DPF/DPW motifs and ‘clathrin boxes’, respectively), and (3) the EH domain region of Eps15 (via NPF motifs). Epsin's tail also binds F-actin and co-operates with the THATCH domain of Hip1R in the coupling of the actin cytoskeleton to the clathrin-coated pit. In both fields Hip1R is depicted as a monomer but functions as a dimer, or heterodimer with Hip1. (B) Schematic representation of the multiple functions of epsin in clathrin-mediated endocytosis. Epsin participates in the early stages of the reaction as a coat nucleator, curvature inducer/sensor and also helps coupling bud formation to SNARE incorporation. As the coat matures, ubiquitinated cargo is recruited. Additionally, the link between epsin/Hip1R and actin is required for the deep invagination of the pit, and this is the process at which the action of epsin becomes essential. Subsequently, the force produced by actin and the bilayer destabilizing properties of epsin's ENTH domain may co-operate with dynamin in fission.
Download links
A two-part list of links to download the article, or parts of the article, in various formats.
Downloads (link to download the article as PDF)
Open citations (links to open the citations from this article in various online reference manager services)
Cite this article (links to download the citations from this article in formats compatible with various reference manager tools)
Epsin deficiency impairs endocytosis by stalling the actin-dependent invagination of endocytic clathrin-coated pits
eLife 3:e03311.
https://doi.org/10.7554/eLife.03311


