A Ras-like domain in the light intermediate chain bridges the dynein motor to a cargo-binding region
- Howard Hughes Medical Institute, University of California, San Francisco, United States
Figures
Figure 1 with 3 supplements
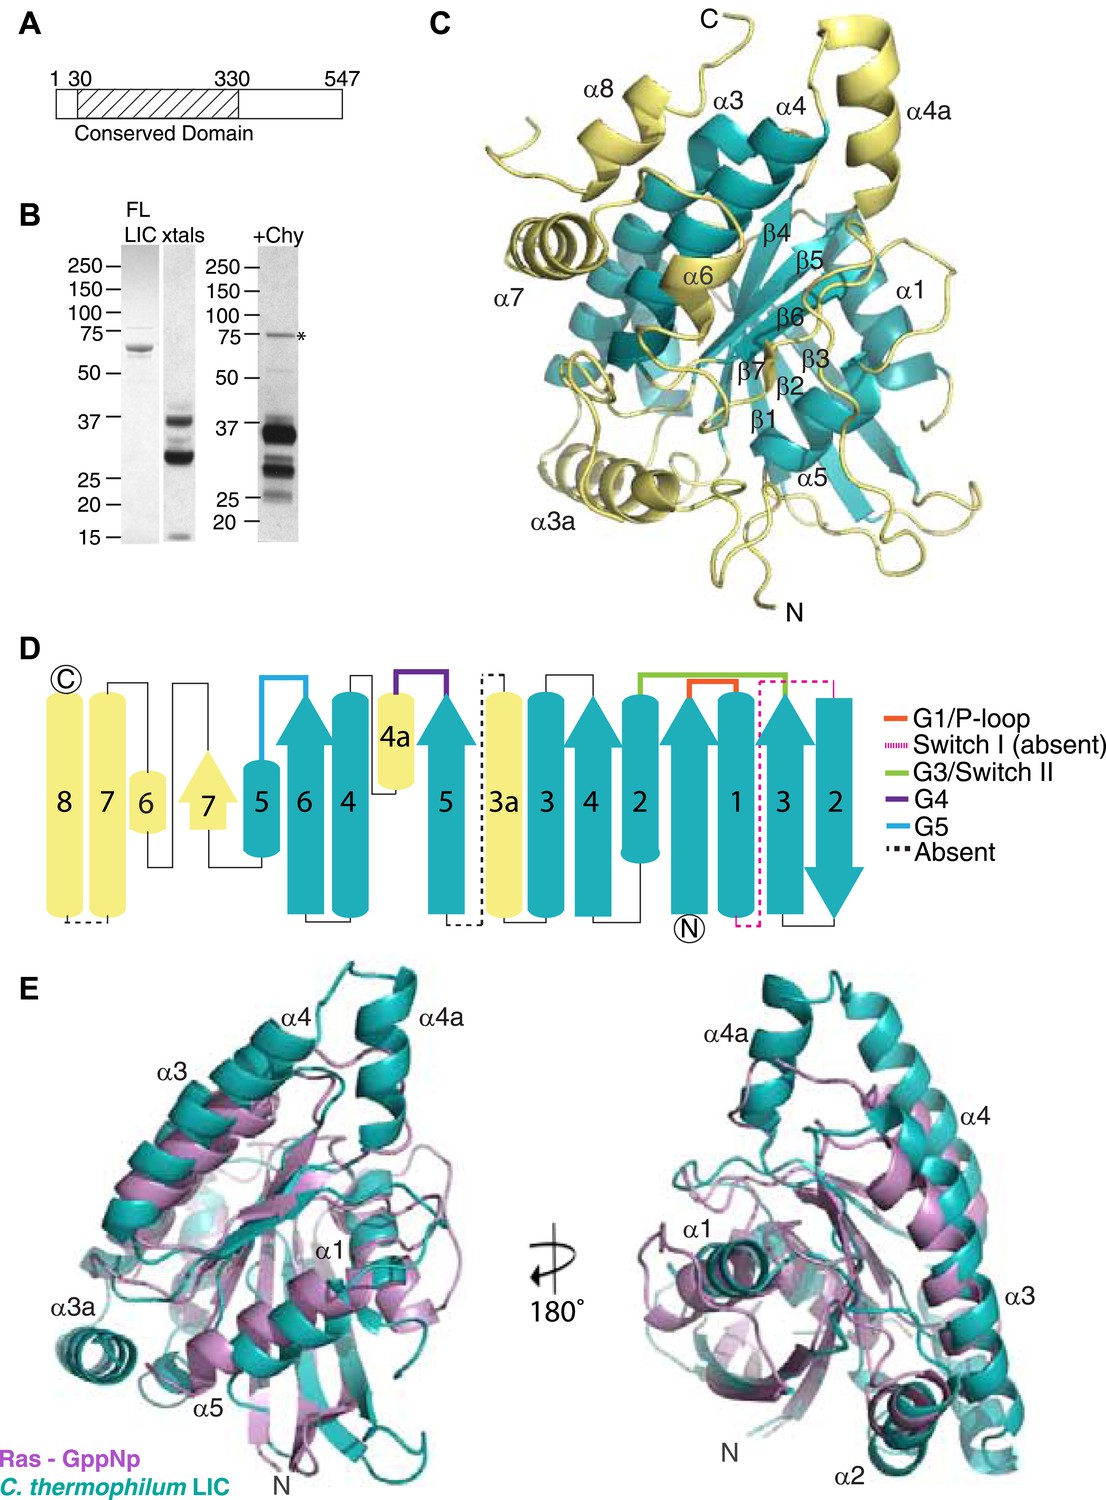
The dynein light intermediate chain has a Ras-like fold.
(A) Diagram depicting the approximate range of conservation among all LICs (residue numbers with respect to the C. thermophilum LIC sequence). (B) The purified full-length C. thermophilum LIC (FL LIC) and the crystallized protein (xtals) were resolved on an SDS-PAGE gel and silver-stained, revealing proteolysis during crystallization. Proteolysis with chymotrypsin (+Chy) (overnight at 1:250 moles protease: LIC) produced similar sized fragments to those seen in the crystal. The asterisk marks a contaminating 75 kDa protein. (C) The 2.1 Å structure of the C. thermophilum LIC is shown with the N-terminus oriented to the front and the C-terminus towards the back. β-strands and α-helices are labeled with respect to comparable elements in Ras. Elements that align with Ras are teal, and elements not found in Ras are yellow. (D) A topology map of LIC secondary structure is shown, and the color scheme corresponds to (C). Numbers with ‘a’ are additional inserts not seen in Ras. The P-loop, switch 1, switch 2, G4, and G5 motifs are labeled based on where they are found structurally (not based on sequence). Regions absent from the electron density are labeled with a dashed line. (E) Structural alignment of LIC with Ras-GMPPNP (PDB 52P1) (Pai et al., 1990). Alignment was performed using chimera after removing the C-terminal helices and loops in the LIC structure.
Figure 1—figure supplement 1
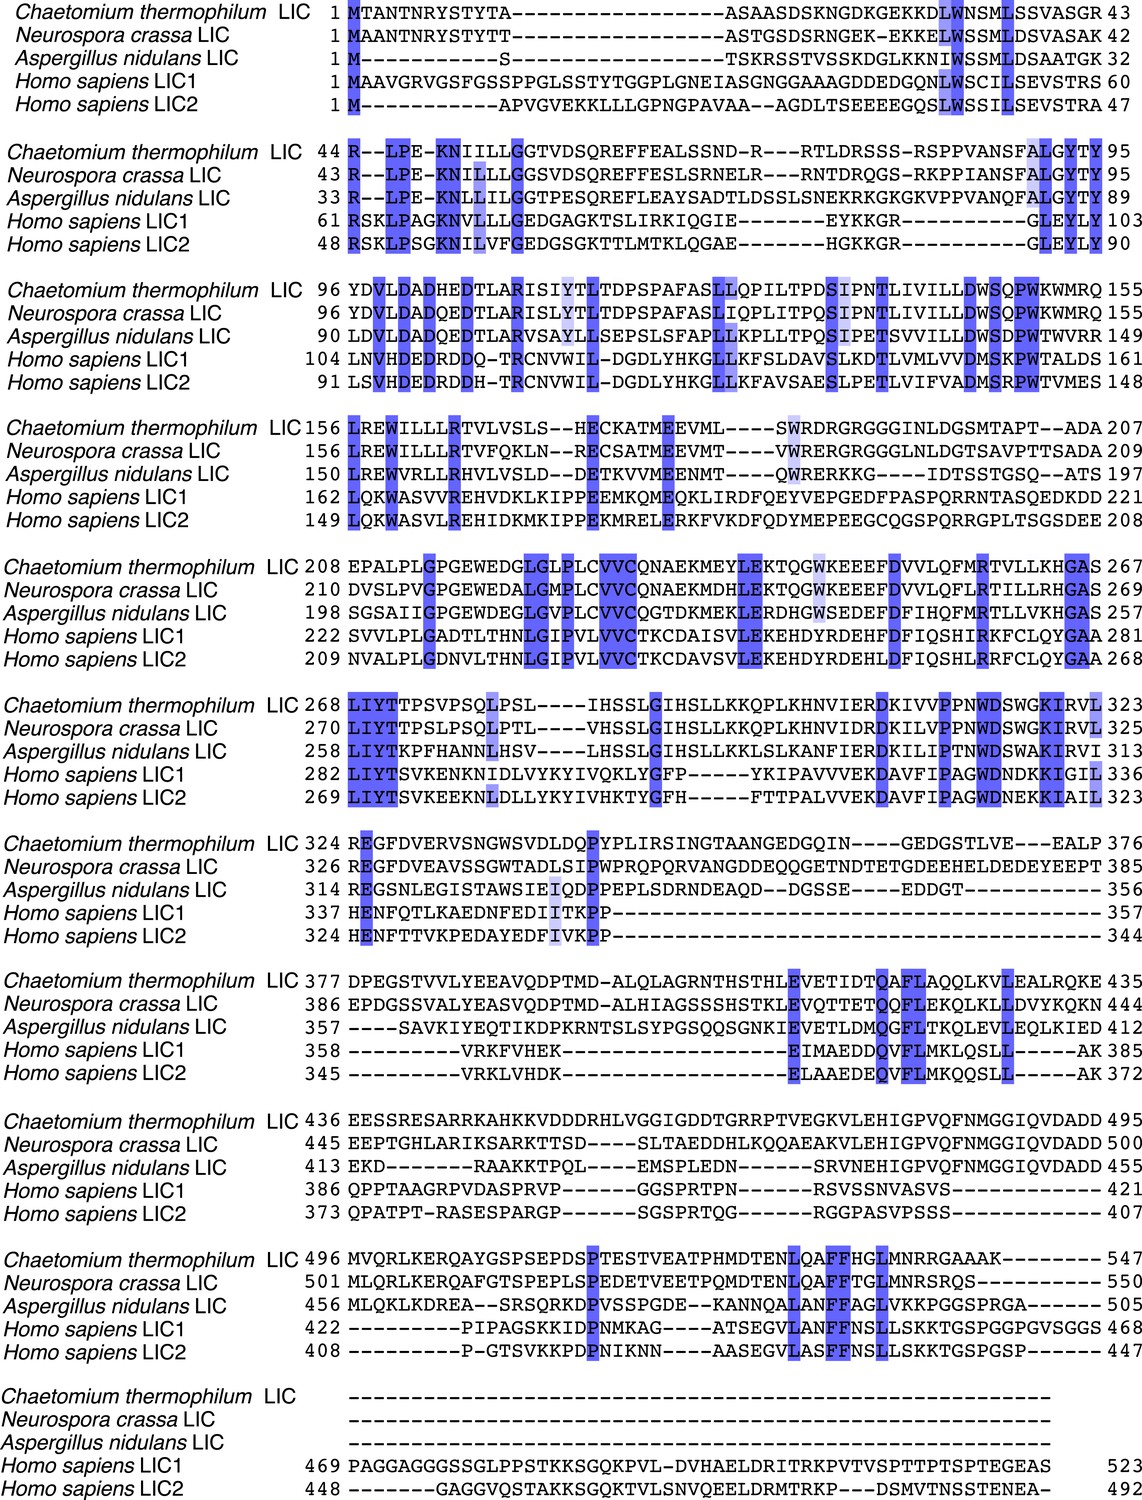
Sequence alignment of full-length LICs.
The full-length sequences of C. thermophilum LIC, Neurospora crassa LIC, Aspergillus nidulans LIC, H. sapiens LIC1, and H. sapiens LIC2 were aligned using MafftWS (algorithm E-INS-I, accuracy oriented) (Katoh and Standley, 2013). Percentage identity is depicted with a gradation of blue shading (dark blue is 100% identical).
Figure 1—figure supplement 2
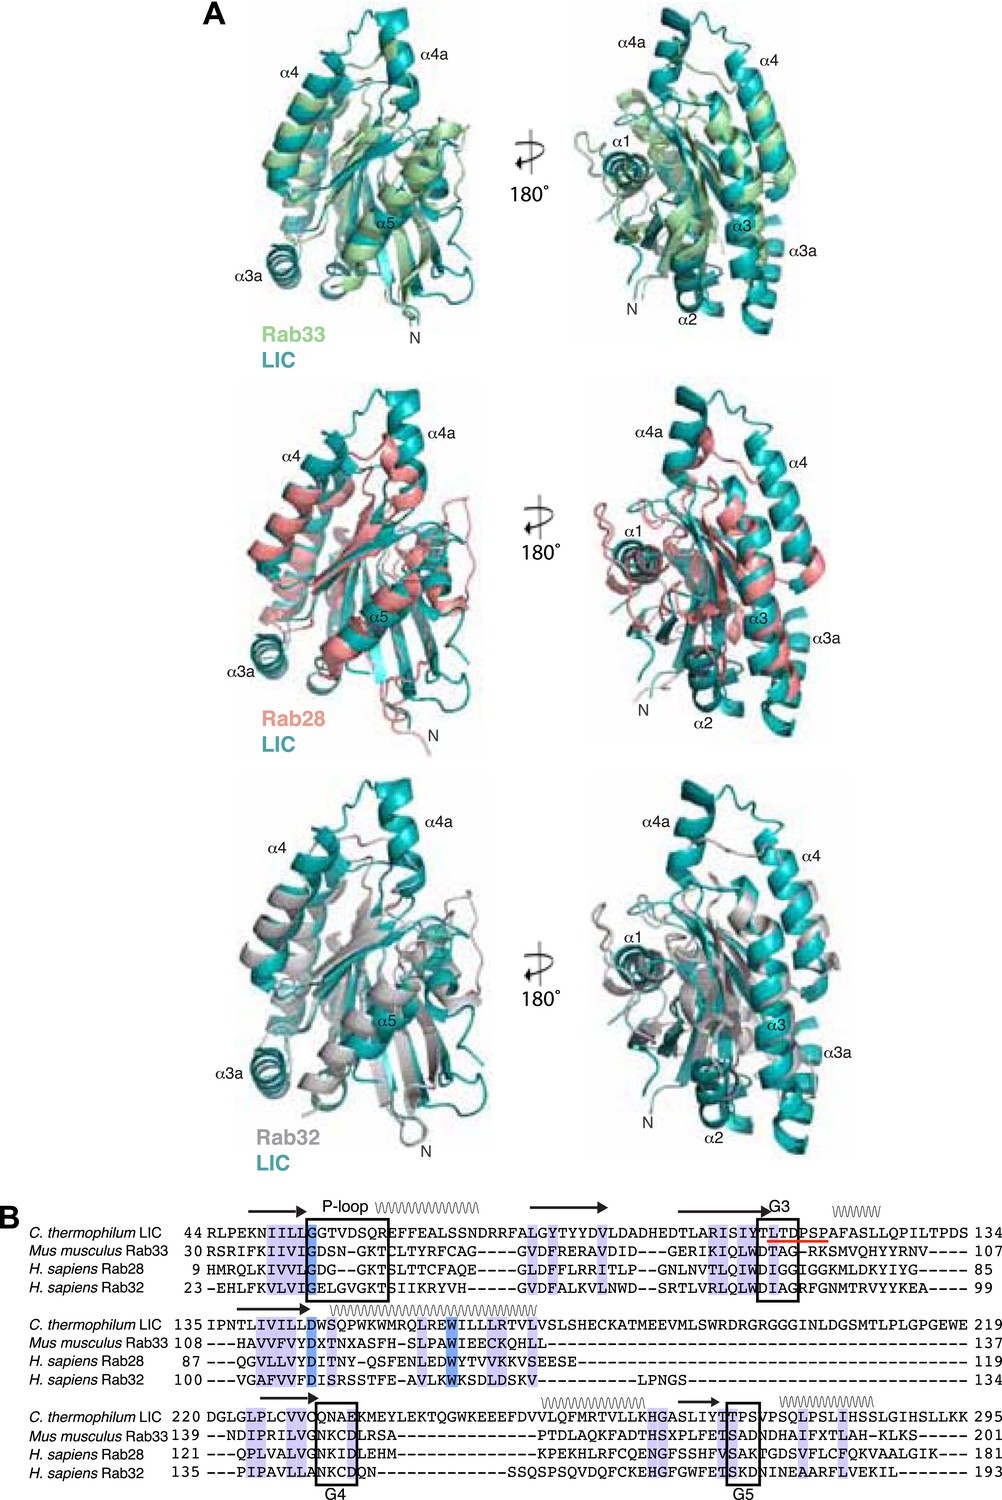
Structural and sequence similarity with the Rabs.
A) The C. thermophilum LIC G domain was aligned with Mus musculus Rab33 (PDB: 2G77), H. sapiens Rab28 (PDB: 3E5H), and H. sapiens Rab32 (PDB: 4CYM) using the Dali server (Holm and Rosenstrom, 2010). Only the core of the LIC G domain is shown as in Figure 1E. (B) The sequences of C. thermophilum LIC and the Rabs in (A) were structurally aligned by the Dali server (Holm and Rosenstrom, 2010). If at least two of the three Rabs have amino acids that are similar to the aligned C. thermophilum LIC residue, the column is shaded light purple; if all proteins have an identical residue, the column is shaded blue. Common secondary structure and the G motifs are denoted. The switch 2 loop (G3 motif) is much longer in the C. thermophilum LIC structure and is underlined in red.
Figure 1—figure supplement 3
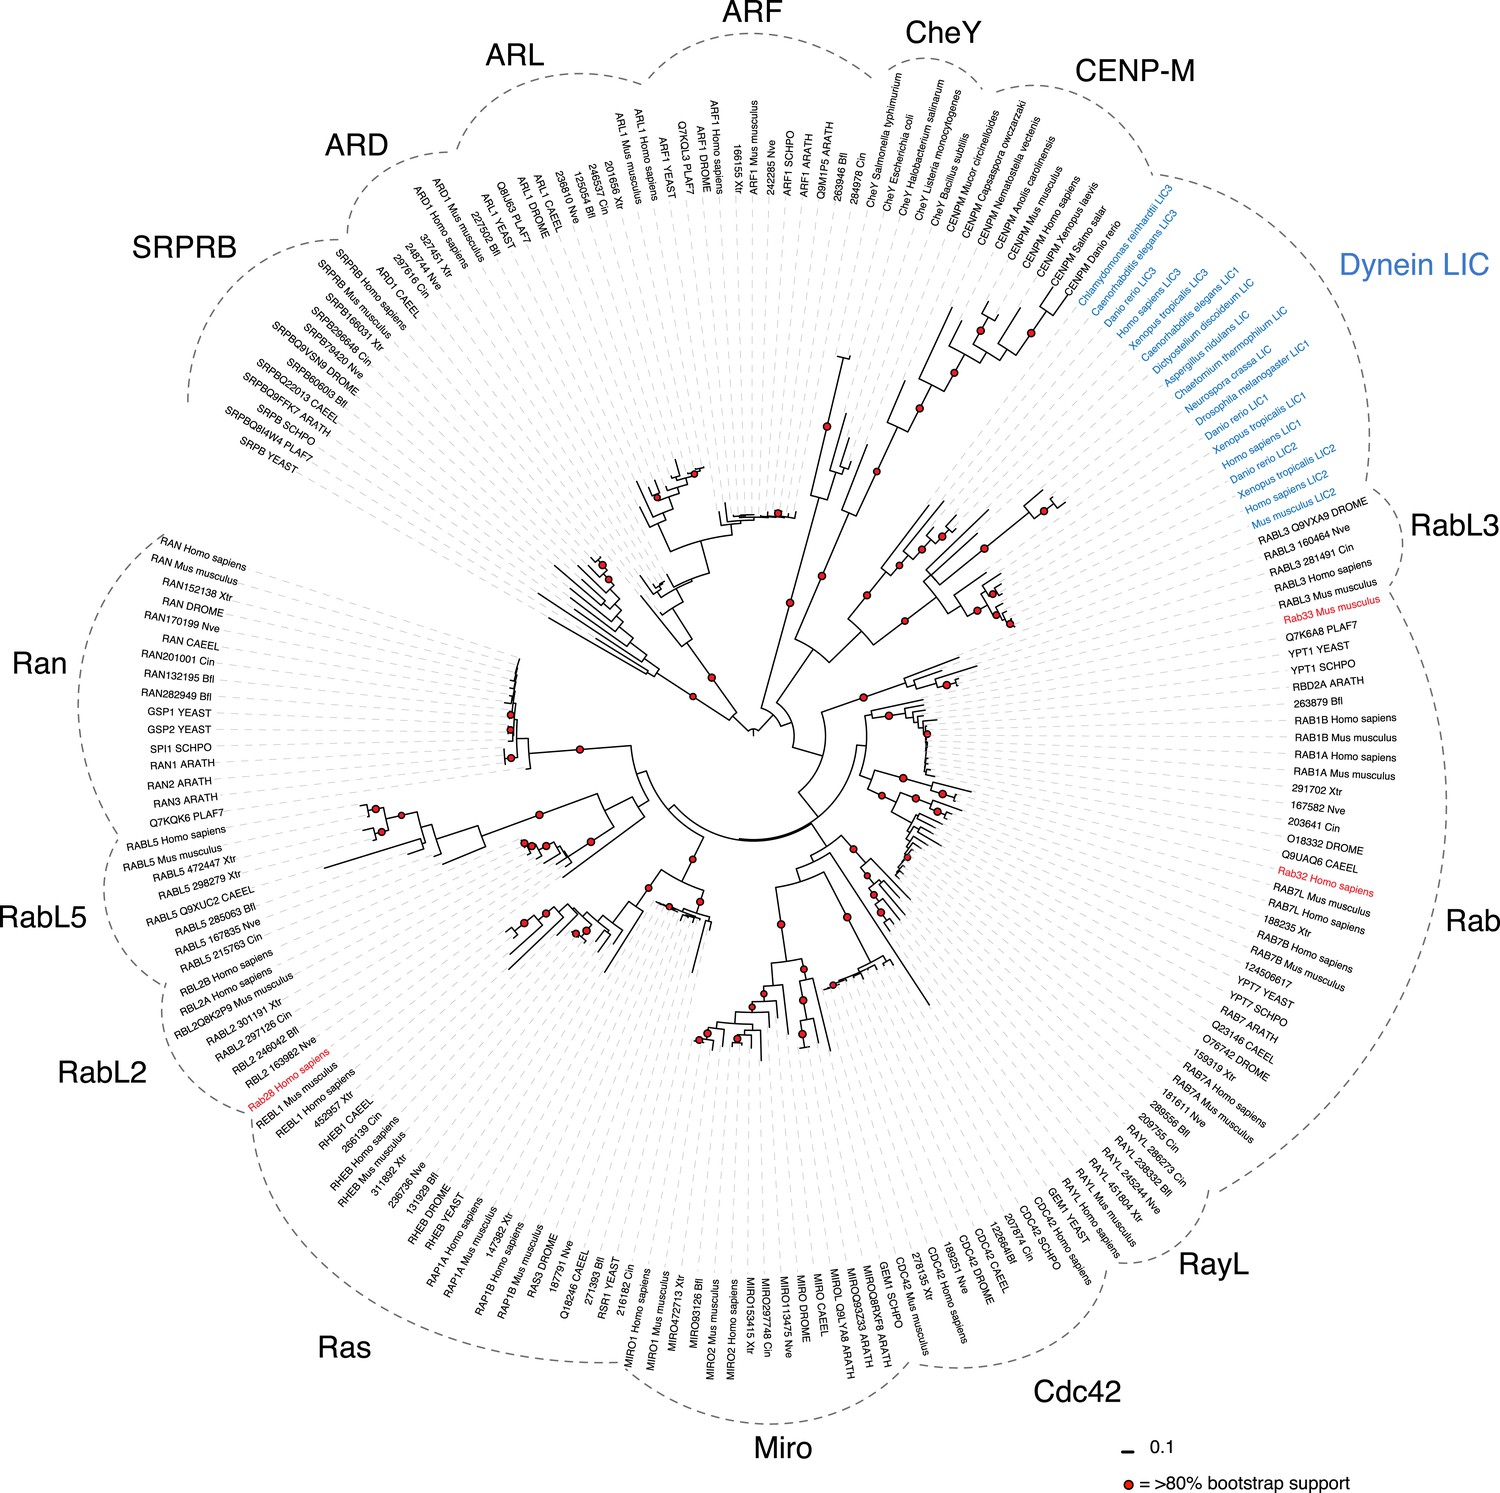
Phylogenetic analysis of the LIC in the Ras superfamily.
An unrooted maximum likelihood phylogenetic tree of 198 sequences was generated by PhyML to reveal the placement of dynein LIC in the Ras superfamily. The red circles denote branches with greater than 80% bootstrap support (300 bootstraps total). The Dali server's top three hits for structure similarity to the C. thermophilum LIC structure are red. Ras subfamilies are labeled, and the LICs are denoted in blue. The abbreviations are as follows: ARATH, Arabidopsis thaliana; PLAF7, Plasmodium falciparum; SCHPO, Schizosaccharomyces pombe; CAEEL, Caenorhabditis elegant; DROME, Drosophila melanogaster; Nve, Nematostella vectensis; Bfl, Branchiostoma floridae; Cin, Ciona intestinalis; Xtr, Xenopus tropicalis. The numbers adjacent to the three-lettered codes Nve, Bfl, Xtr, and Cin are accession numbers found in the DOE Joint Genome Institute database. The uppercase abbreviations are Uniprot codes.
Figure 2 with 1 supplement
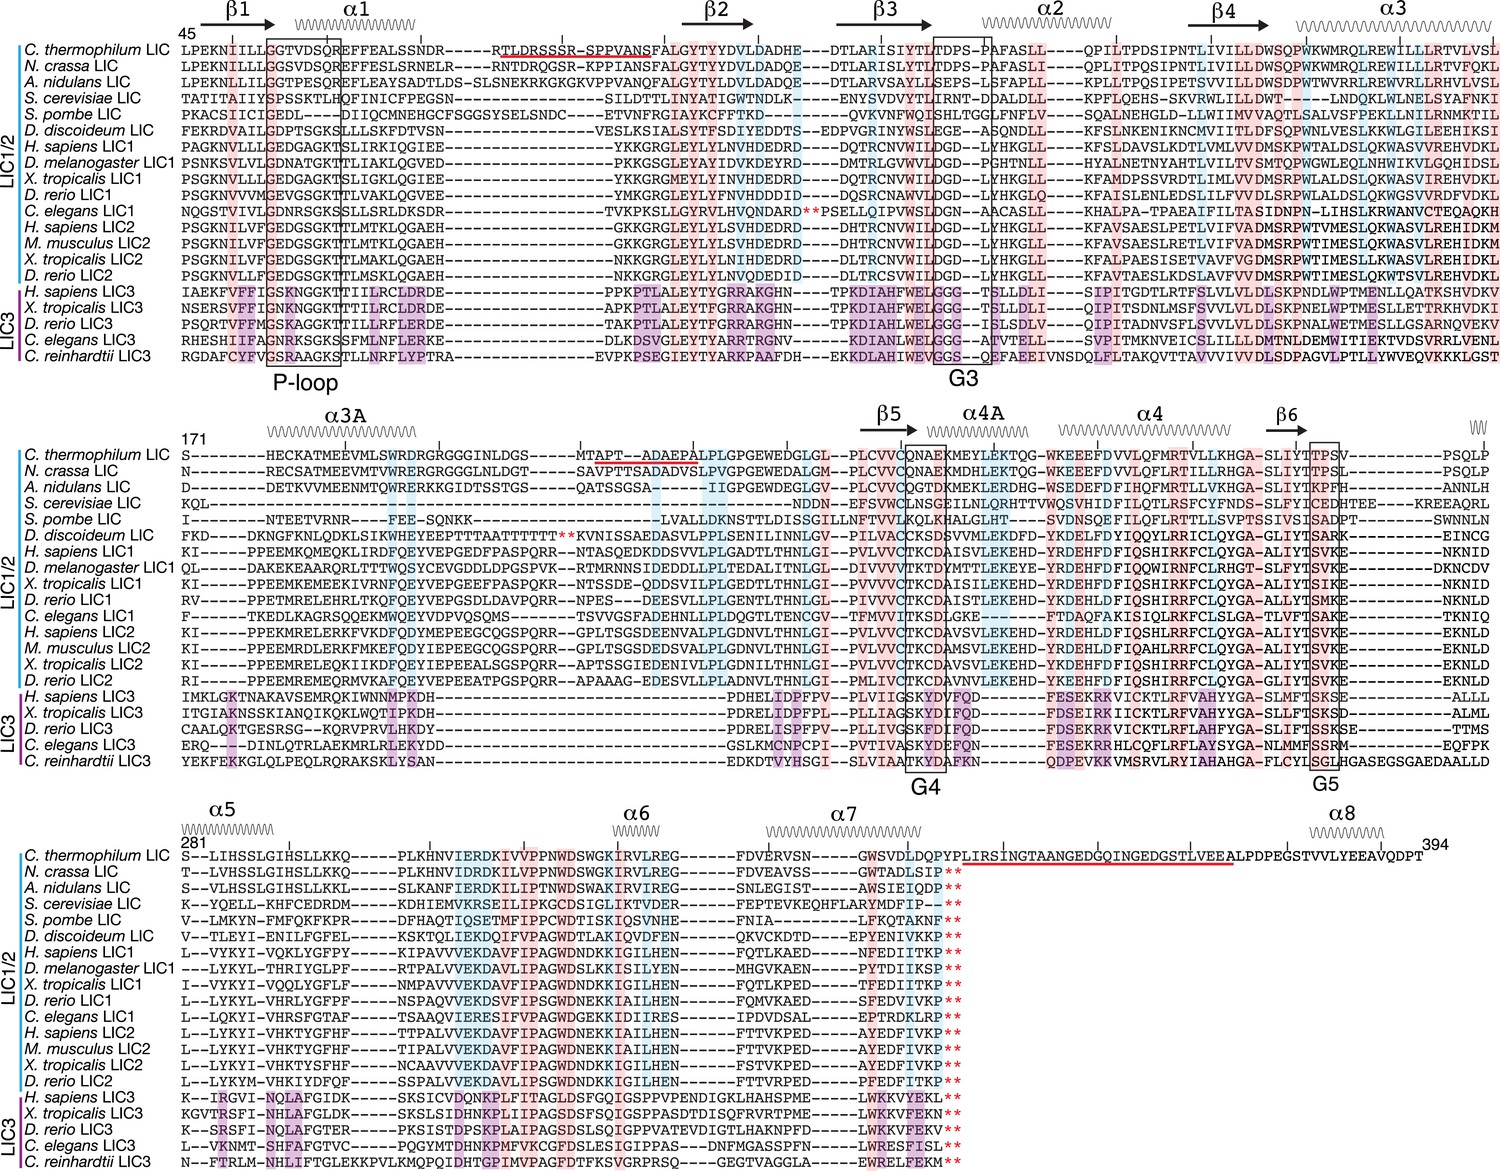
Conservation of LIC sequences and alignment with the LIC structure.
20 LICs were aligned via Promals (Pei and Grishin, 2007) (the C. thermophilum LIC pdb aided the alignment), and only the conserved sequence of the G domain is shown with the numbering based on C. thermophilum LIC. The P-loop, G3, G4, and G5 motifs were identified by the LIC structure and are labeled. The secondary structure of the C. thermophilum LIC is depicted above the sequences, and the residues missing in the structure are underlined in red. The red asterisks denote where sequence was taken out for space. Residues that were 80% conserved among only LIC1 and 2 sequences (12 out of 15), only LIC3s (4 out of 5), or universally conserved among all LICs (16 out of 20) are highlighted light blue, purple, and pink, respectively. Only the C. thermophilum LIC sequence extends to 394; all the other sequences were truncated with respect to C. thermophilum LIC, a.a. 343, because their predicted α-helix 8 extends beyond the alignment shown here.
Figure 2—figure supplement 1
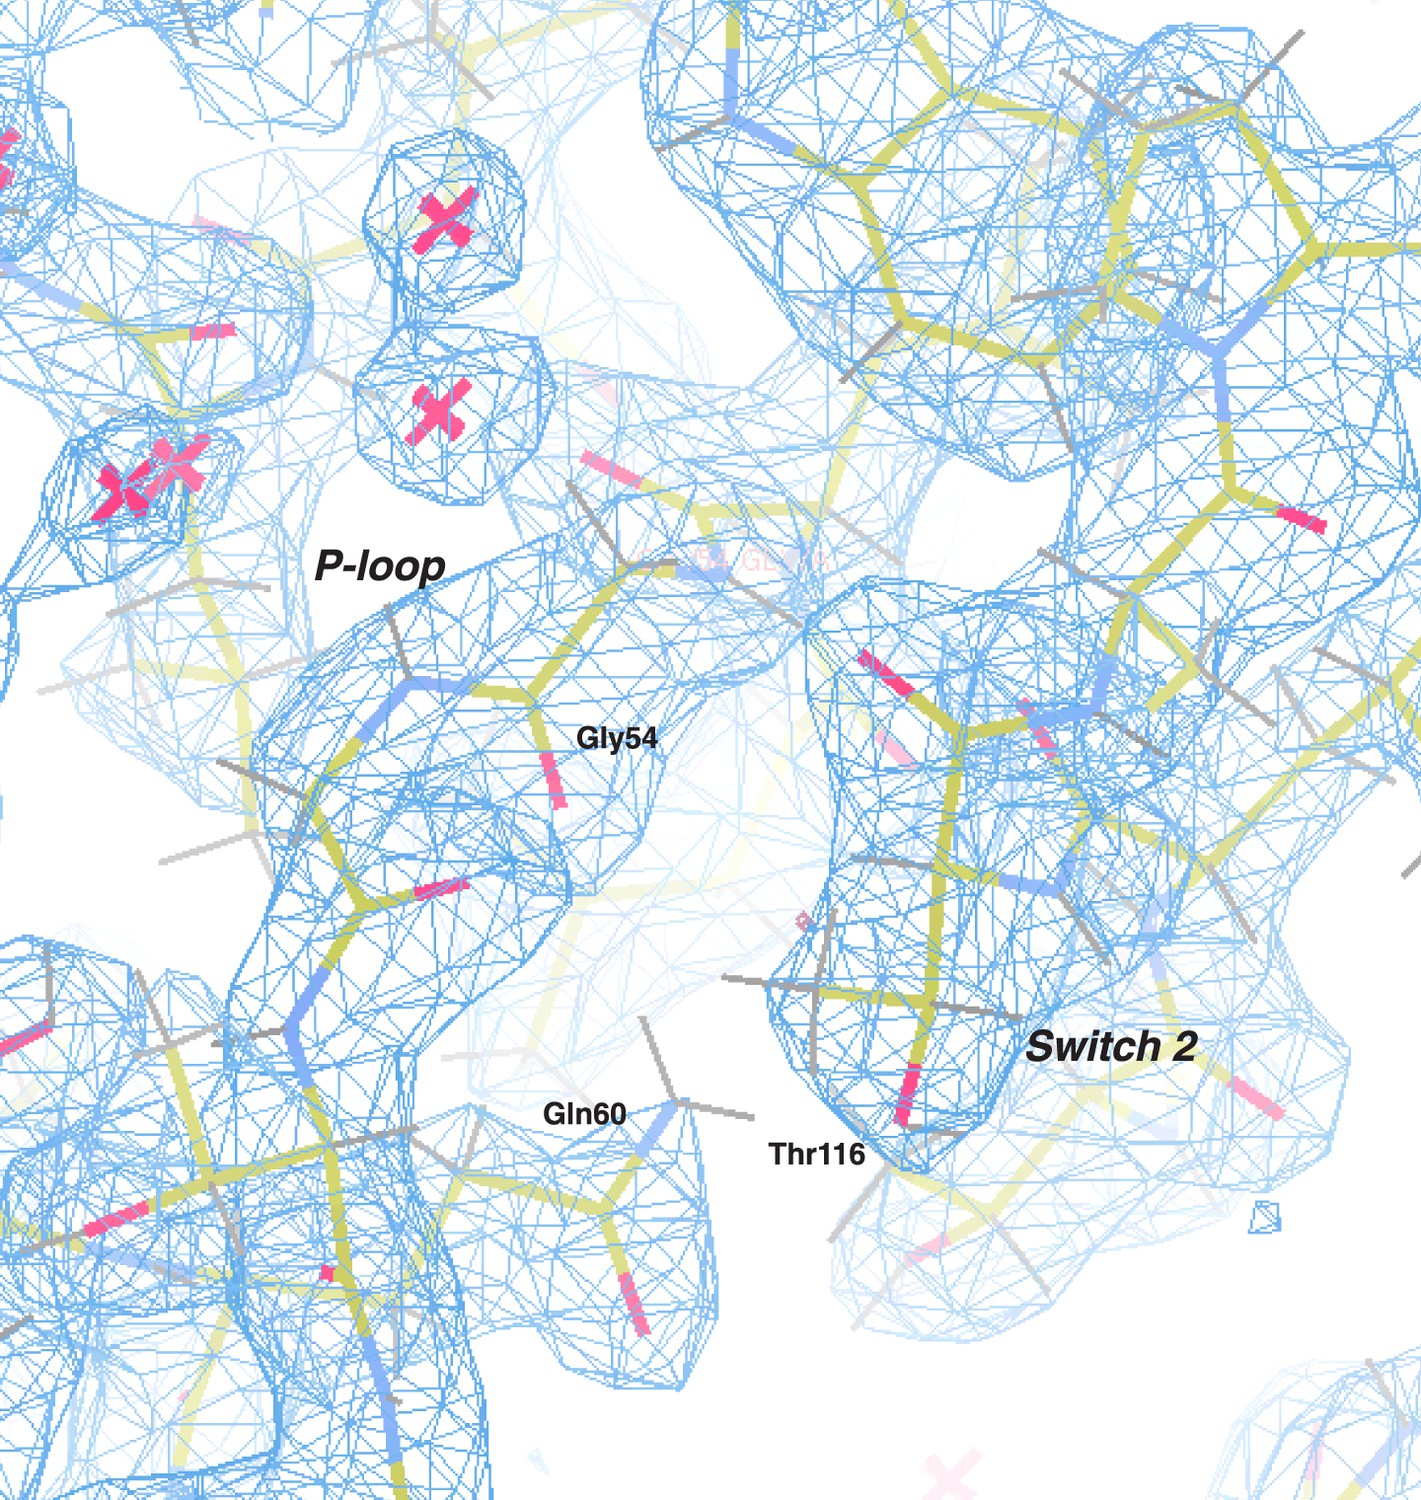
Electron density map of the P-loop and switch 2.
The 2Fo − Fc electron density map (blue) of the C. thermophilum LIC G domain is shown (contoured at 1.50 σ) with all protein atoms visible (the color scheme: oxygen in red, nitrogen in blue, carbon in yellow, and hydrogen in gray). Gly54 and Gln60 of the P-loop and Thr116 of switch 2 are labeled. Molecules of water are depicted as pink crosses.
Figure 3
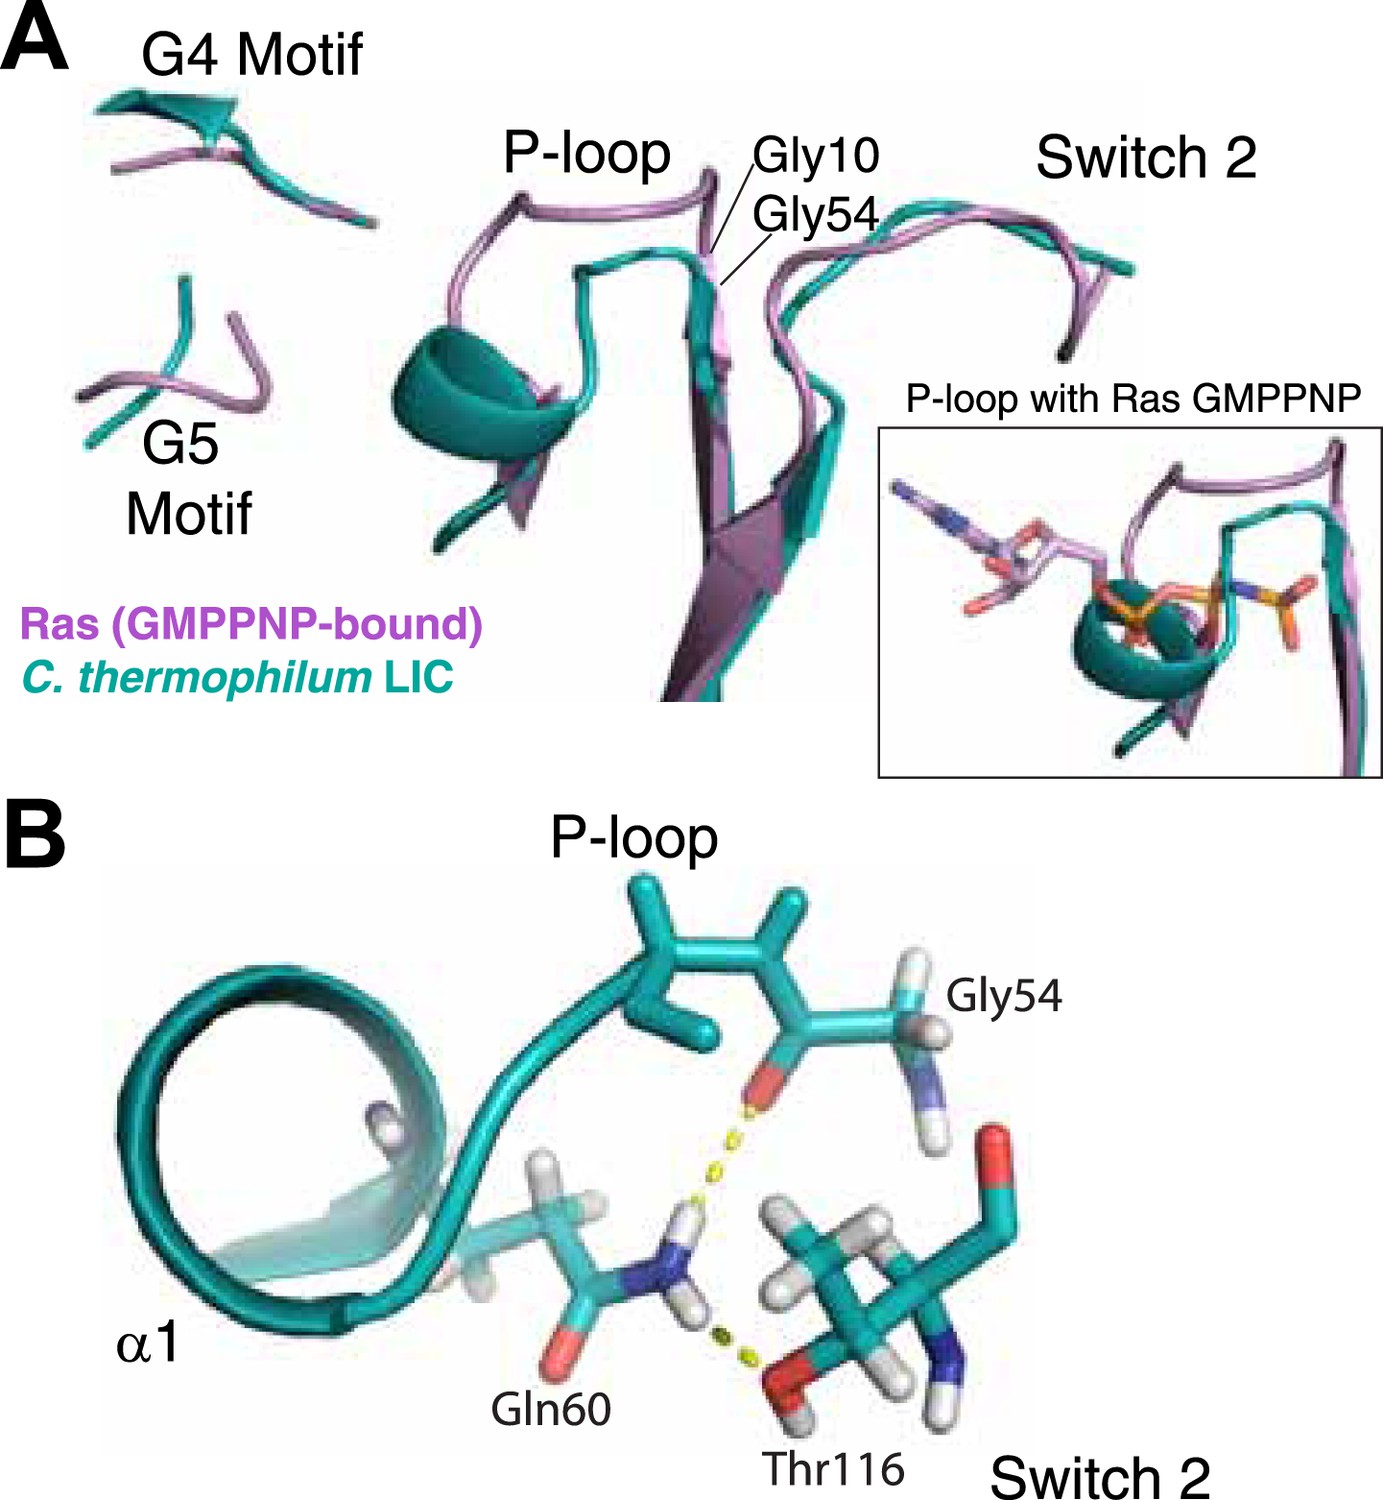
The LIC G domain binding pocket exhibits a closed conformation that is not compatible with nucleotide binding.
(A) The C. thermophilum LIC was aligned with Ras-GMPPNP (PDB 5P21) and a view of the GTP-binding pocket is shown with corresponding G motifs labeled. GMPPNP is not shown. The inset shows the aligned P-loops with Ras in complex with GMPPNP. (B) Interactions between the P-loop and switch 2 of C. thermophilum LIC are shown with a dashed yellow line.
Figure 4 with 4 supplements
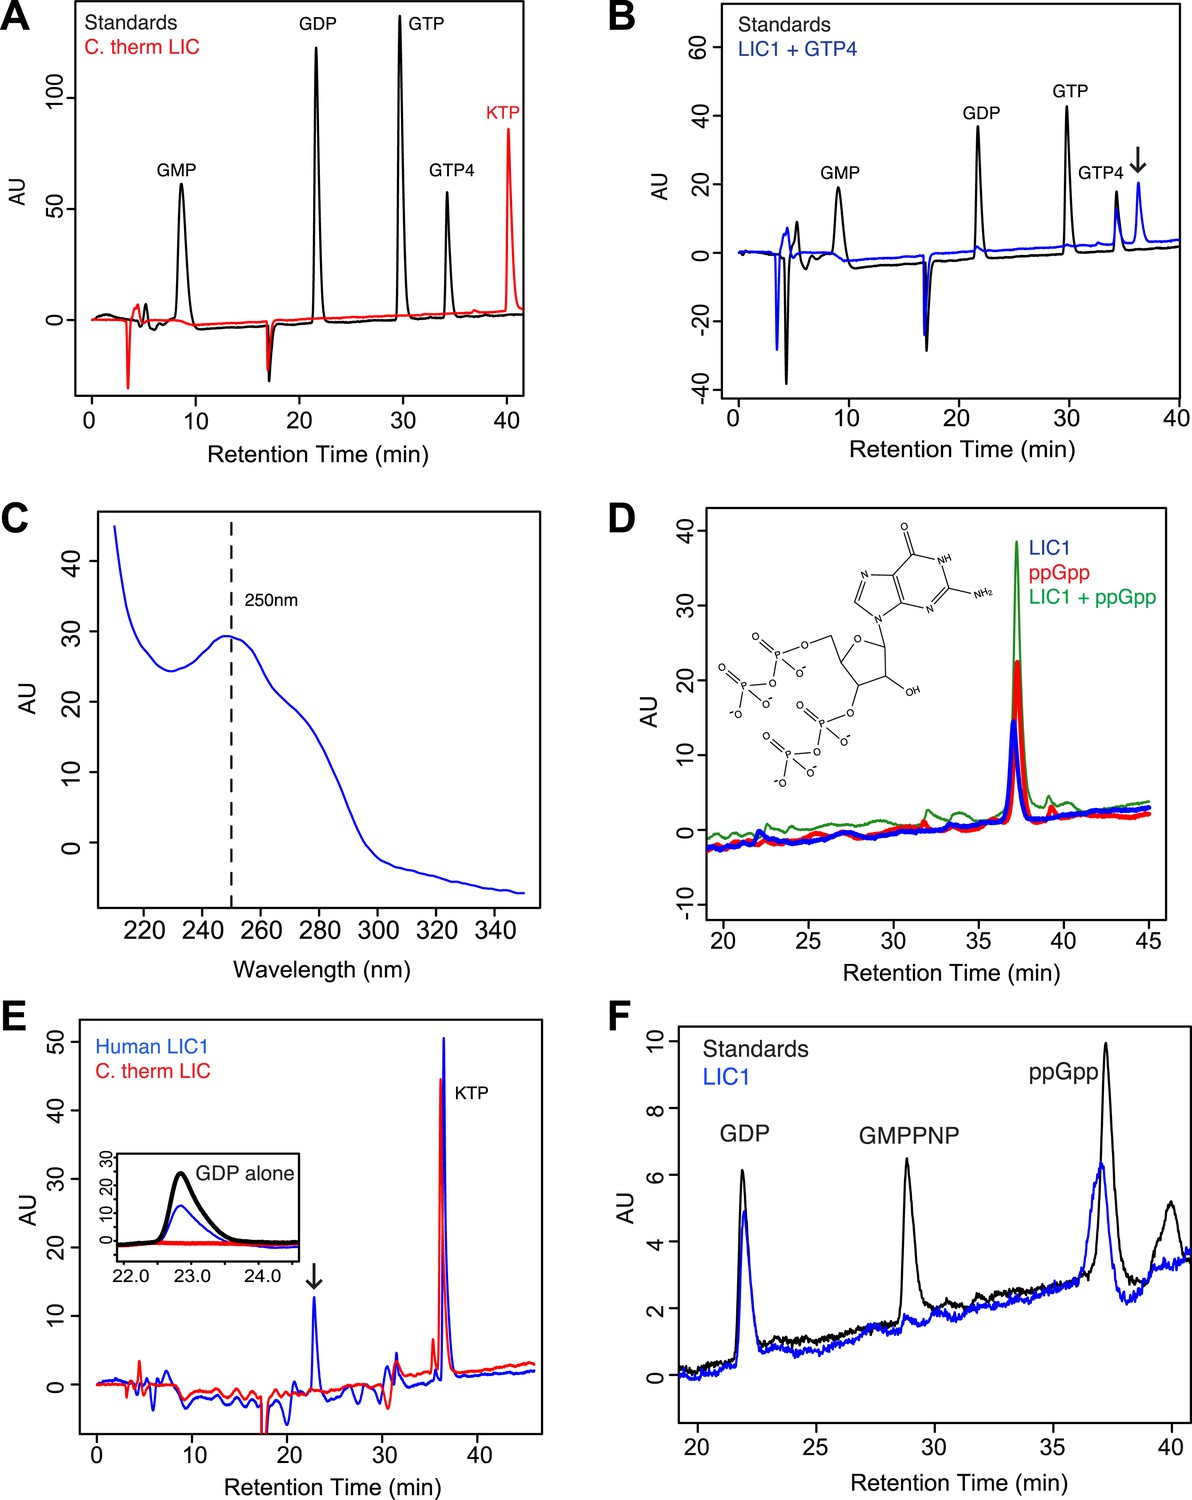
The human LIC1 G domain binds guanine nucleotide.
(A) The C. thermophilum LIC G domain (a.a. 45–394) was injected on the C18 column with an increasing gradient of acetonitrile and detection with a wavelength of 260 nm. Standards are at 1 mM, and kinetin triphosphate (KTP), a non-biological nucleotide (Hertz et al., 2013), was added for an internal control. KTP was used as a positive control for sample injection because it elutes after all other nucleotides due to its high negative charge. (B) The human LIC1 G domain (amino acids 65–354) was analyzed by RPLC as done in (A). Nucleotide standards are at 0.5 mM, and the LIC was simultaneously injected with an equal concentration of guanosine tetraphosphate (GTP4) for an internal reference. An arrow indicates LIC nucleotide. (C) The wavelength spectrum of the LIC nucleotide in (B, arrow) is shown from 210 nm to 350 nm. (D) The human LIC1 G domain at 150 µM and ppGpp at 150 µM were analyzed by RPLC separately. LIC1 and ppGpp, each at 150 µM were then injected simultaneously. The structure of guanosine-3ʹ,5ʹ-bisdiphosphate (ppGpp) is shown. (E) The human LIC1 G domain and C. thermophilum LIC G domain were incubated with 5 mM EDTA and 1 mM GDP for 1 hr at room temperature. An excess of MgCl2 was then added at a final concentration of 10 mM and the resulting protein, with KTP as an internal control, was analyzed by RPLC. The inset shows the GDP standard alone superimposed with the two chromatograms. (F) The human LIC1 G domain (150 µM) was incubated with 5 mM EDTA, 0.5 mM GDP, and 5 mM GMPPNP for 1 hr at room temperature and analyzed by RPLC as done in (E).
Figure 4—figure supplement 1
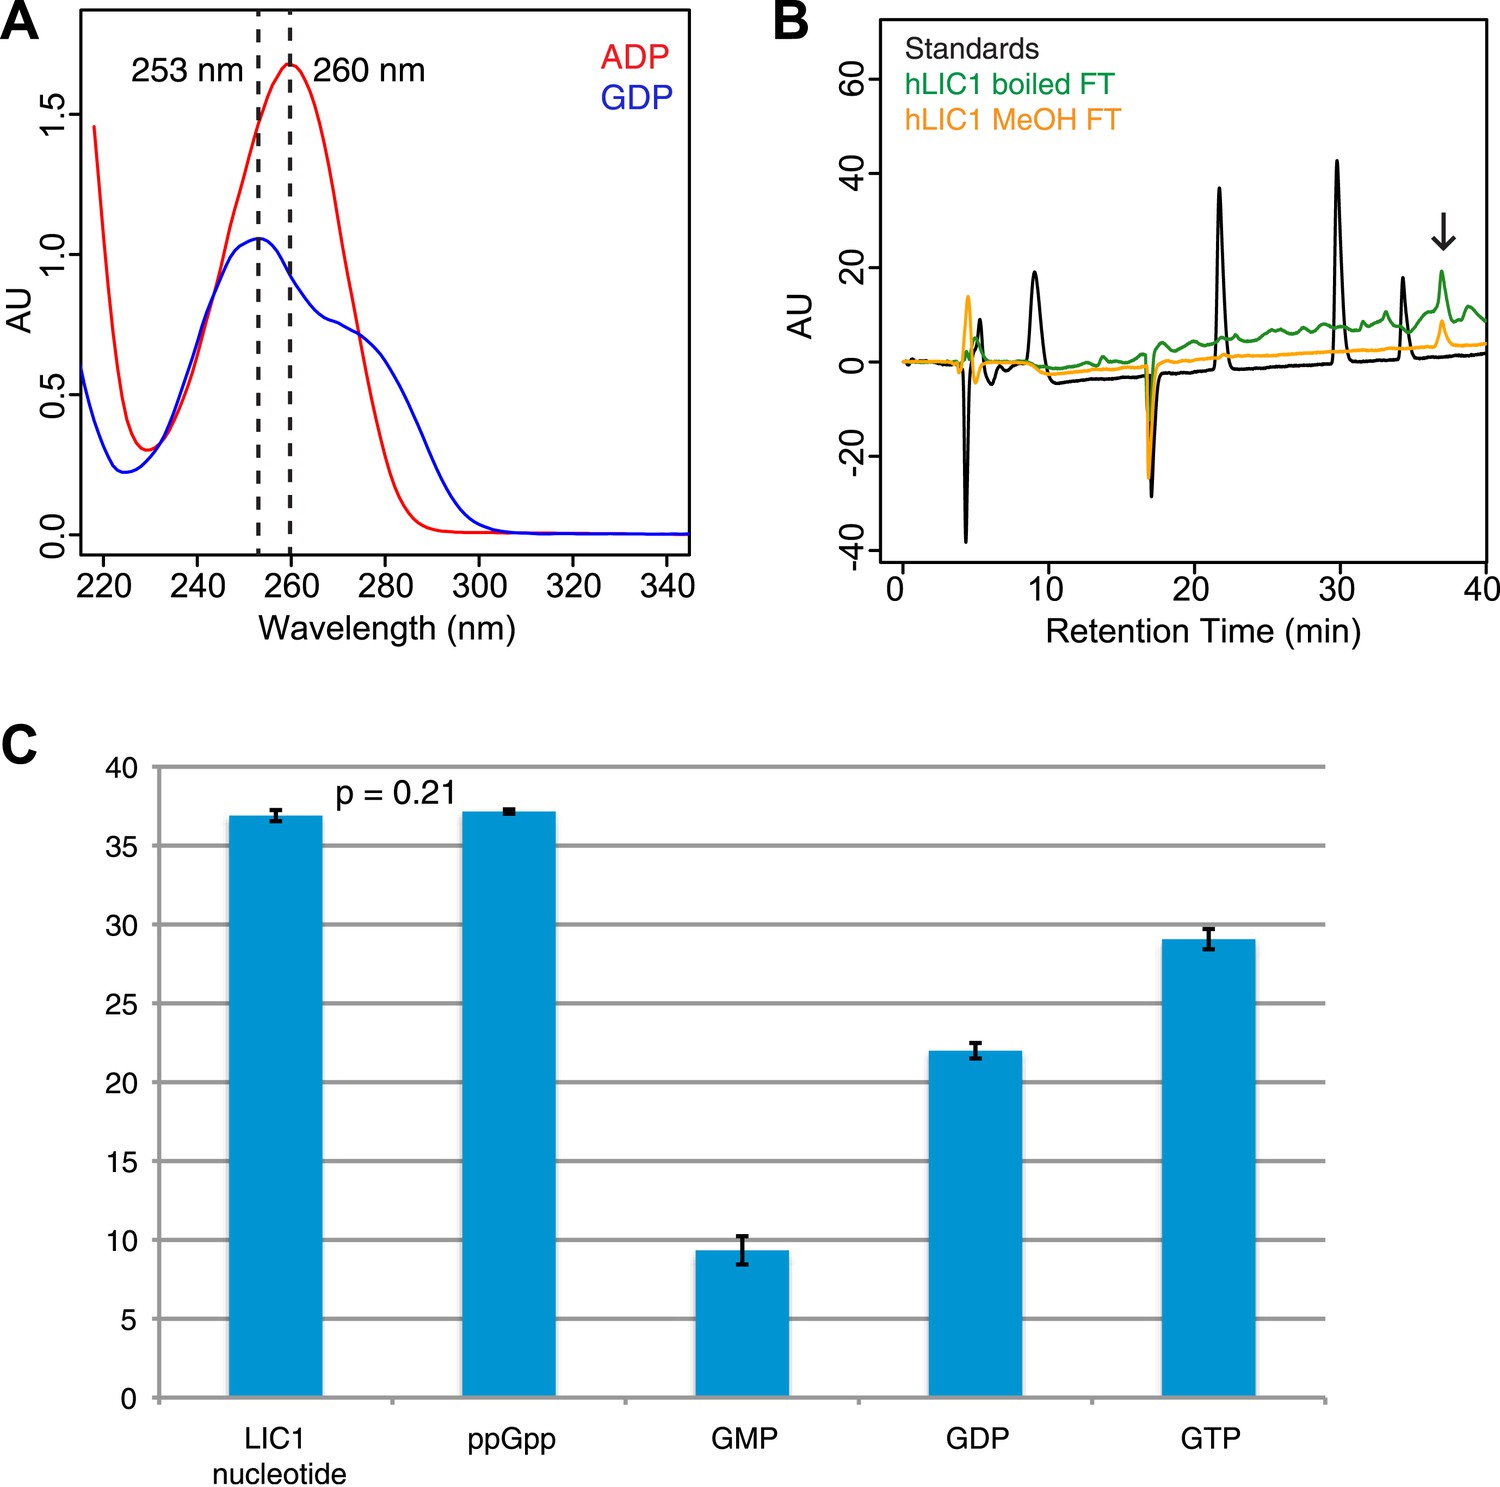
Guanine nucleotide extraction from human LIC1.
(A) The absorbance of ADP and GDP was measured with a wavelength spectrum ranging from 215 nm to 350 nm. (B) The human LIC1 G domain was boiled for 10 min or methanol-extracted (by adding an equal volume of 100% methanol). The protein was filtered from the supernatant with a 10 kDa molecular-weight cutoff concentrator, and the flow-through was analyzed by RPLC. The extracted nucleotide is denoted with an arrow. (C) The average retention time and standard deviation of each nucleotide from all RPLC runs are displayed (n = 5 for LIC nucleotide, n = 4 for commercial ppGpp, n = 3 for GMP, n = 5 for GDP, and n = 5 for GTP). A t test was done with the human LIC1 nucleotide and the commercial ppGpp, resulting in p = 0.21.
Figure 4—figure supplement 2
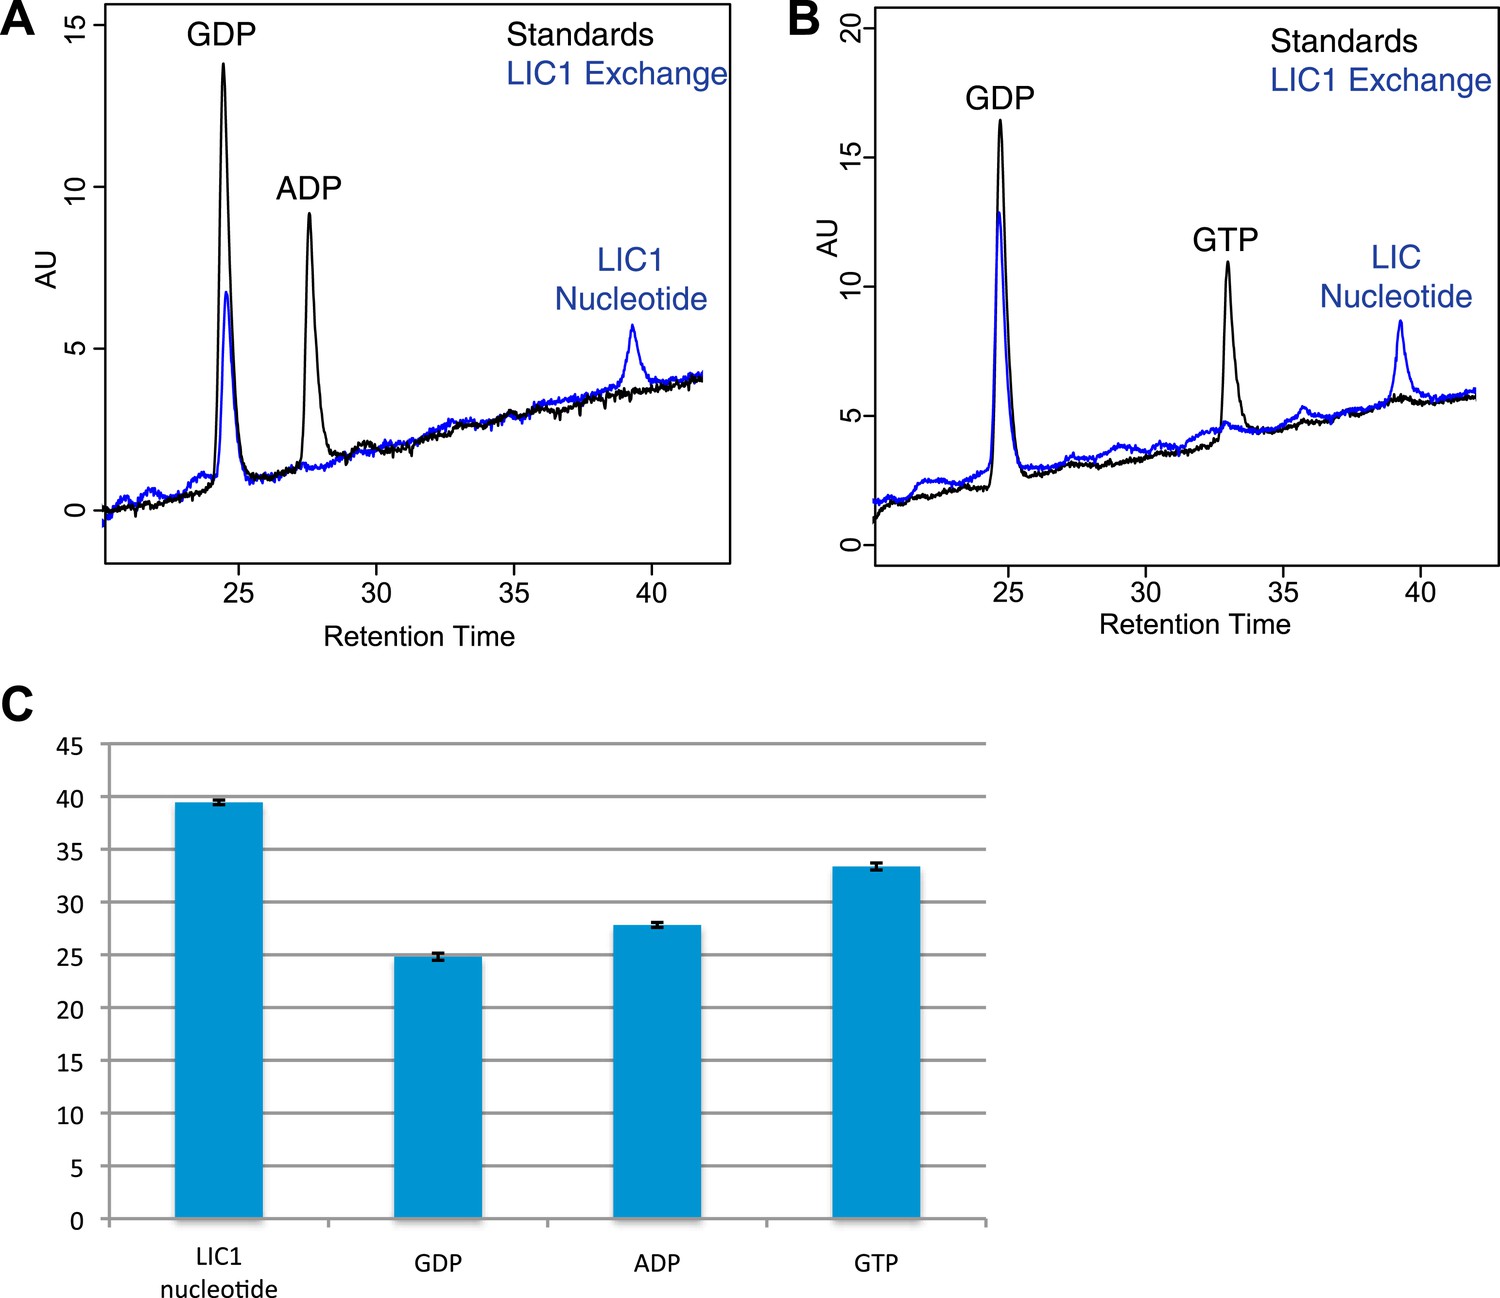
Nucleotide exchanges with GTP and ADP.
(A) The human LIC1 G domain (150 µM) was incubated with 5 mM EDTA, 0.5 mM GDP, and 5 mM ADP for 1 hr at room temperature. MgCl2 was then added at a final concentration of 10 mM, followed by buffer exchange and RPLC analysis. (B) The human LIC1 G domain was incubated with 0.5 mM GDP and 5 mM GTP and analyzed as done in (A). (C) The dead volume of the RPLC equipment was increased, leading to increased retention times of all nucleotides in comparison to data collected for Figure 4. The average and standard deviation of the retention time were calculated for each standard and the LIC1 nucleotide (n = 5 for LIC nucleotide, n = 9 for GDP, n = 5 for GTP, n = 3 for ADP).
Figure 4—figure supplement 3
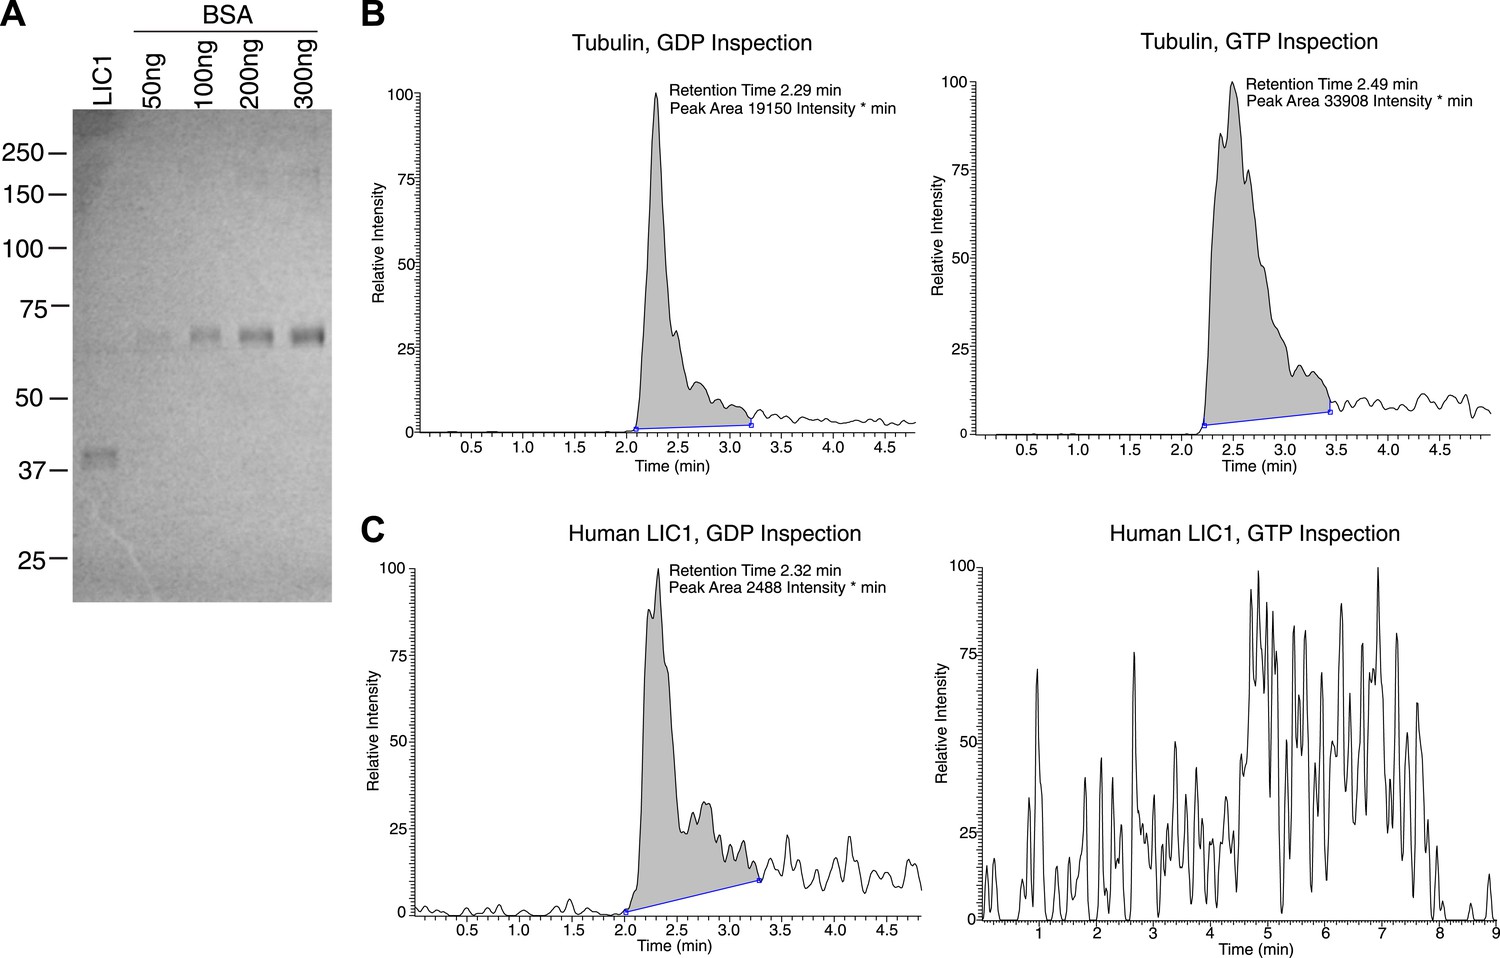
Human LIC1 co-purifies with GDP from human cells.
(A) Strep-tagged human LIC1 (a.a. 1–354) was purified from HEK-293T cells using Strep-Tactin beads. A sample (1 μL) of the final concentrated LIC1 (50 μL total) is displayed beside varying amounts of BSA. The 1/50th sample of purified human LIC1 is approximately 150 ng, which allows for an estimation of approximately 7.5 μg total. (B) Purified porcine brain tubulin (175 μg) was buffer exchanged into 50 mM NH4OAc, concentrated to approximately 3.5 μg/μl. A 10 μl sample of a 4-fold dilution was analyzed by LC-MS for GDP and GTP based on mass, fragmentation and retention time. In the final scan, GDP and GTP (with approximate retention times of 2.3 min and 2.5 min, respectively) were both detected. (C) The 7.5 μg of human LIC1 shown in (A) was buffer exchanged into 50 mM NH4OAc and concentrated to approximately 188 ng/μl. LC-MS analysis was conducted as done with tubulin in (B). A distinct peak was seen for GDP, yet only background noise was present in the scan for GTP.
Figure 4—figure supplement 4
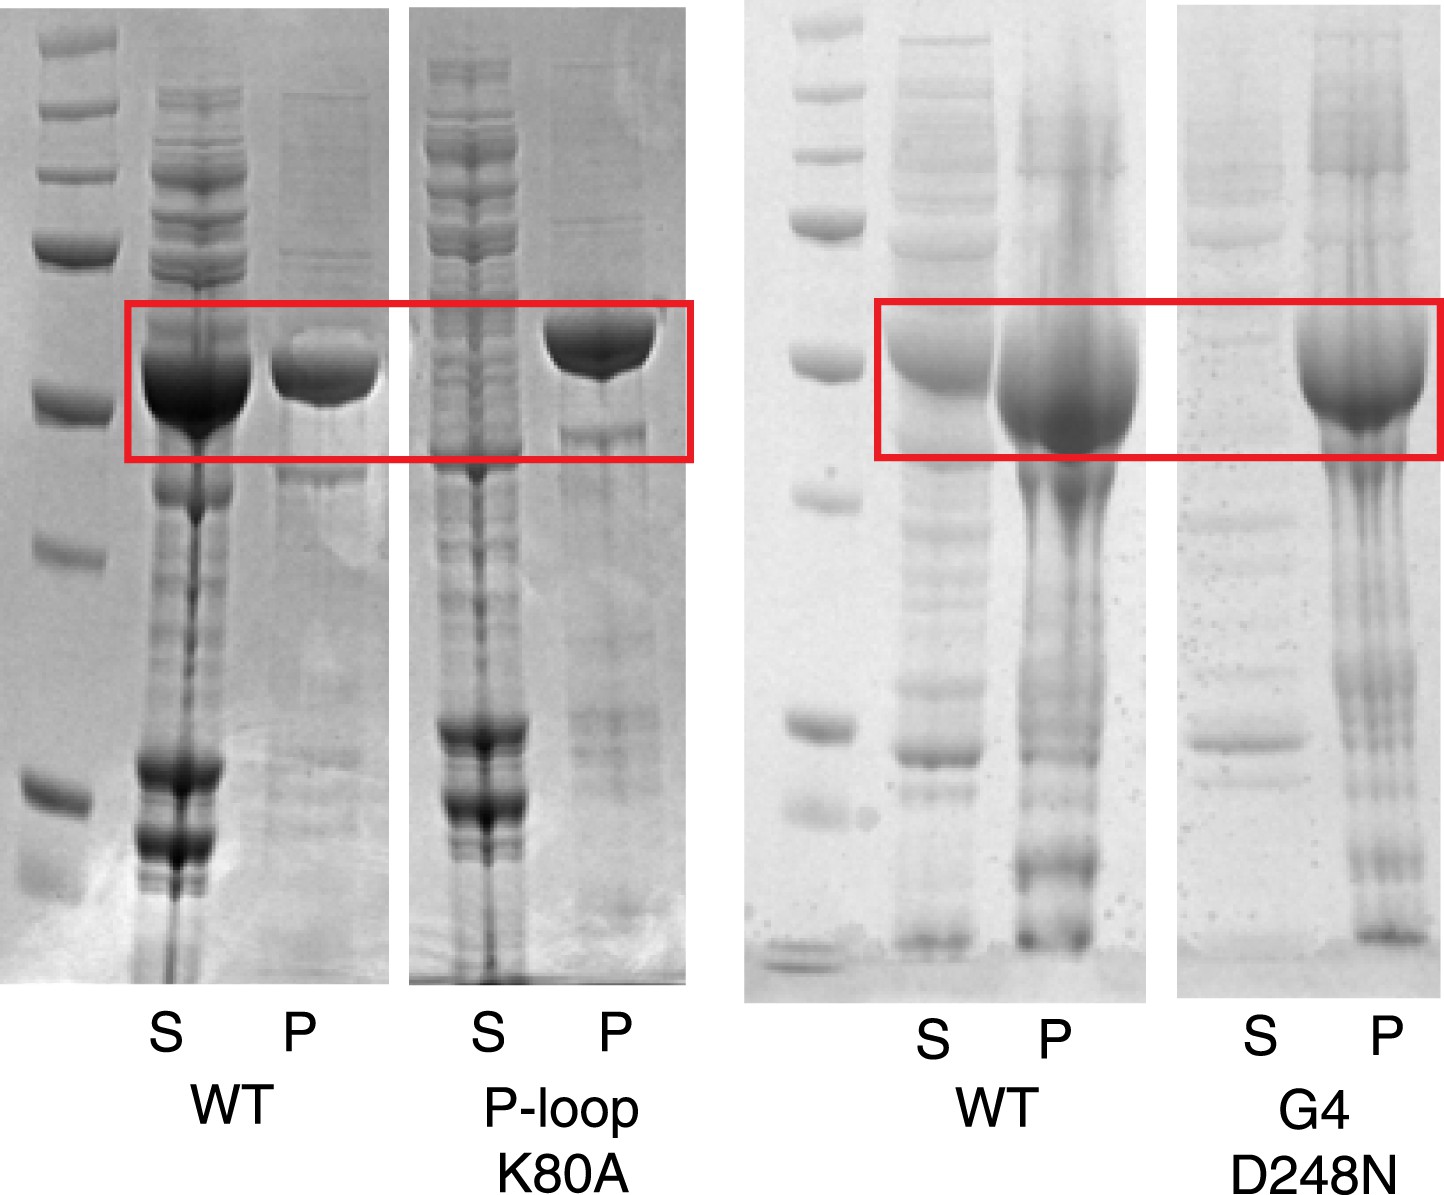
Instability of human LIC1 G domain without nucleotide.
Point mutations were made in the human LIC1 G domain (a.a. 65–354), specifically K80A of the P-loop and D248N of the G4 motif. The mutants and wild-type protein (WT) were expressed in BL21 DE3 RIPL cells for 4 hr following induction with 0.5 mM IPTG. The test expressions of the mutants were analyzed following lysis and centrifugation. Samples of the pellet (P) and supernatant (S) were resolved by SDS-PAGE and Coomassie stained. The red boxes indicate LIC1. The results show that the K80A and D248N mutants are mostly insoluble when expressed in bacteria.
Figure 5

The G domain contains the binding interface of the dynein heavy chain.
(A) The conservation of residues shown in Figure 2 is mapped onto the surface of the C. thermophilum LIC G domain. The surface is shown in two different orientations with each orientation showing universally conserved residues (pink) and LIC1/2-specific residues (blue) vs LIC3-specific residues (purple). The LIC is oriented either toward the N-terminus or toward the C-terminal loops (as in Figure 1C). Conserved amino acids and the corresponding residue numbers are labeled according to the C. thermophilum LIC sequence. (B) HA-tagged fragments of human LIC1 (a.a. 1–389, 389–523) were expressed in HEK-293T cells, immunoprecipitated with an anti-HA antibody, and immunoblotted for the dynein heavy chain or HA tag. The asterisk denotes a non-specific band that reacts with the anti-HA antibody. (C) HA-tagged double and triple mutants of human LIC1 were expressed, immunoprecipitated, and analyzed as in (B) with additional immunoblotting for the dynein intermediate chain. The residue numbers shown correspond to human LIC1. Homo sapiens (H.s.) LIC1 residues correspond to C. thermophilum (C.t.) LIC as follows: H.s. D110, D112, D113 = C.t. D102, E104, D105; H.s. Y101, Y103, W120 = C.t. Y93, Y95, Y113; H.s. V316A, E317A, D319A = C.t. I303, E304, D306; H.s. E317A, K332A = C.t. E304, K319; H.s. R260A, E262A, E338A = C.t. E325, E248, K246.
Figure 6 with 2 supplements

The LIC C-terminus alone binds Rab effectors.
(A) Human GST-tagged full-length LIC and LIC truncations, including the G domain (a.a. 1–389) and the C-terminus (a.a. 389–523), were purified from E. coli bound to glutathione beads and incubated with recombinant GFP-FIP3. The beads were centrifuged, washed, and probed with an anti-GFP antibody to assess binding of the GFP-tagged protein. (B) The same experiment in (A) was done with GFP-RILP. (C) The same experiment in (A) was done with GFP-BicD2. (D) A model depicts the LIC G domain bound to the dynein heavy chain (HC) with the C-terminus bound to a Rab effector, allowing for membrane transport by dynein.
Figure 6—figure supplement 1
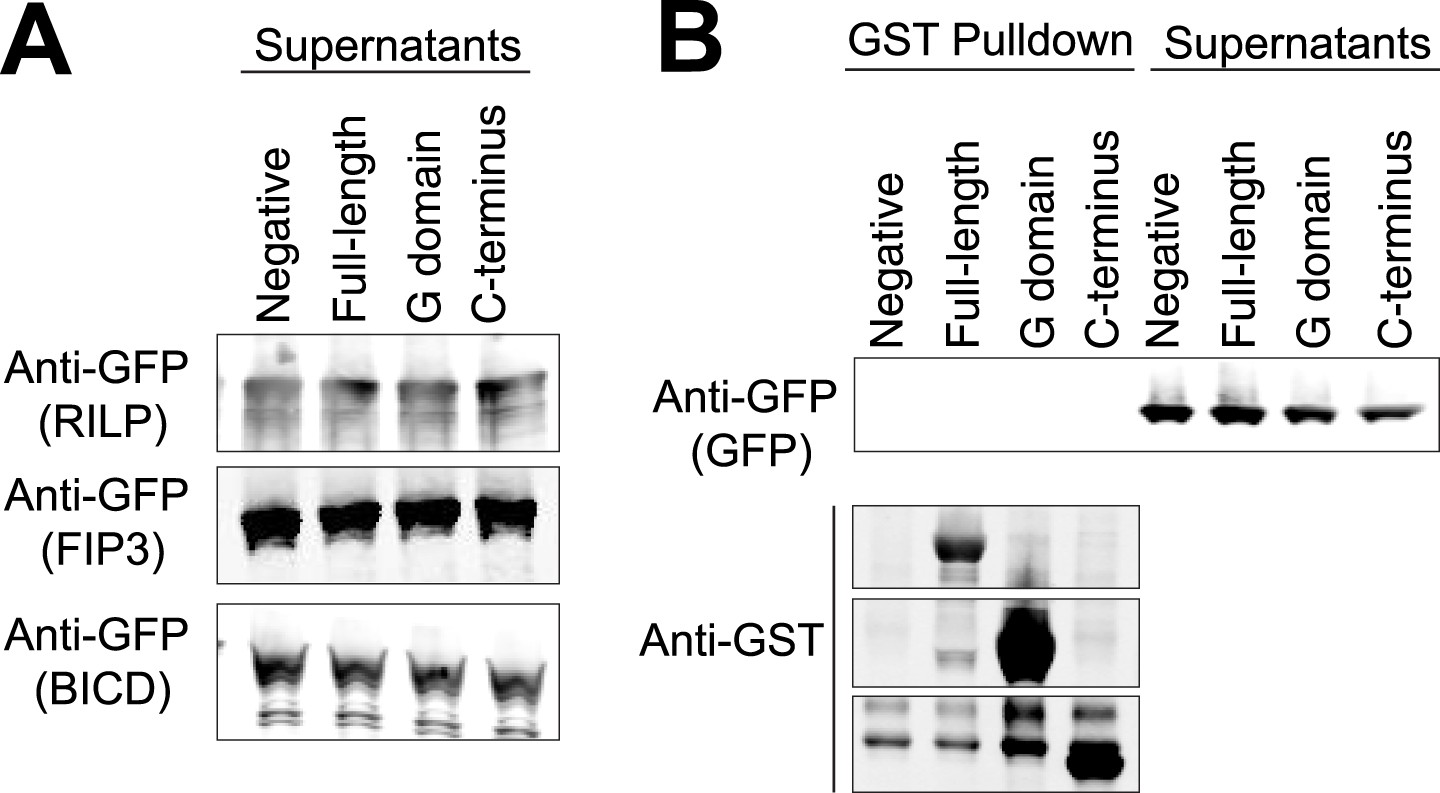
Controls for GST pulldowns.
(A) The supernatants following the three GST pulldowns shown in Figure 6 were probed with anti-GFP to show the unbound prey (FIP3, RILP, and BicD2). (B) A GST pulldown was done as in Figure 6A–C except with superfolder GFP alone. This negative control was done in parallel with the pulldown in Figure 6C.
Figure 6—figure supplement 2
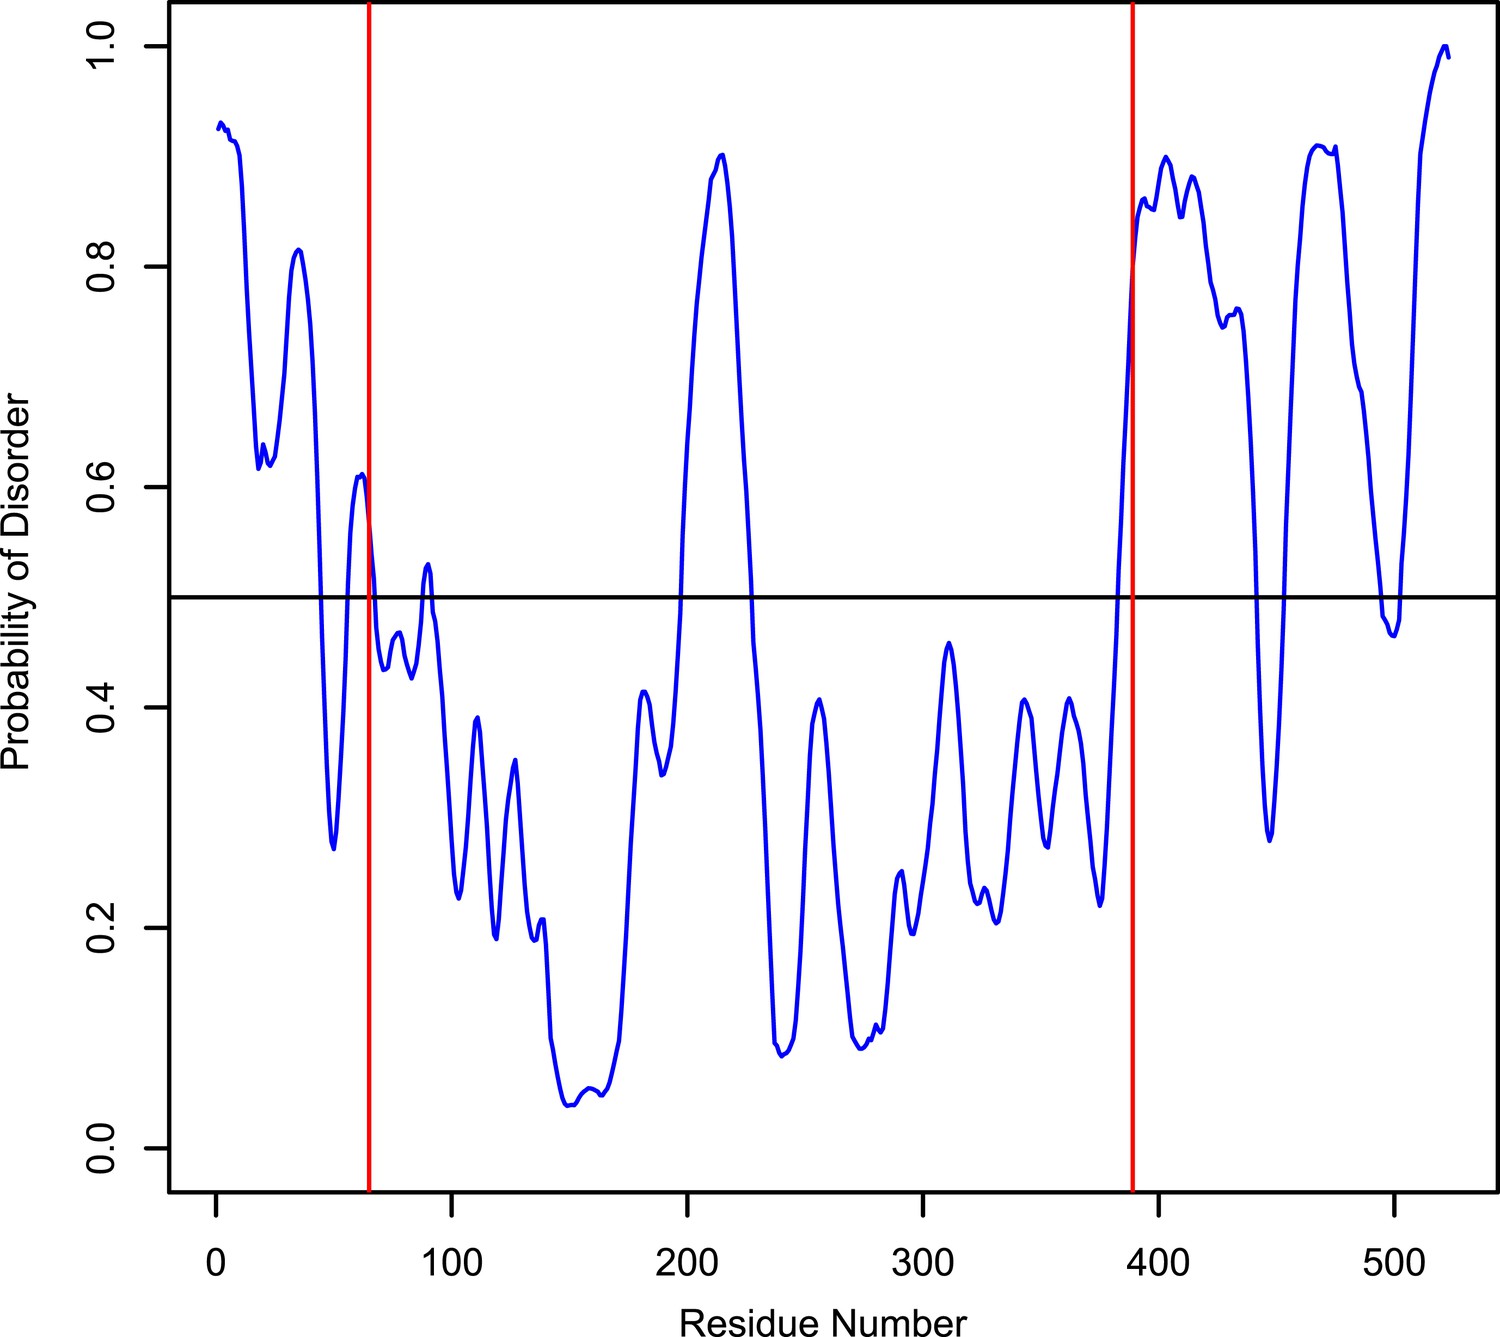
Disorder probability of human LIC1.
The Protein Disorder Prediction System (PrDOS) (Ishida and Kinoshita, 2007) was used to assess the probability of disorder of full-length human LIC1. The red lines, at residues 65 and 389, indicate the approximate range of where the G domain exists.
Author response image 1

Tables
Table 1
Crystallographic data and refinement statistics
| Native | SeMet | ||
|---|---|---|---|
| Data collection | |||
| Space group | C 2 2 21 | P3221 | |
| Cell dimensions | |||
| a, b, c (Å) | 59.37, 138.67, 112.54 | 58.81, 58.81, 198.23 | |
| α, β, γ (°) | 90, 90, 90 | 90.00, 90.00, 120.00 | |
| Peak | Remote | ||
| Wavelength | 1.115869 | 0.97973 | 0.95696 |
| Resolution (Å) | 50–2.10 (2.15–2.10)* | 50–3.50 (3.56–3.50)* | 50–3.50 (3.56–3.50)* |
| I/σI | 12.3 (1.7)* | 12.1 (1.6)* | 11.9 (1.5)* |
| Completeness (%) | 99.9 (99.7)* | 99.8 (96.8)* | 99.8 (98.0)* |
| Redundancy | 7.3 (7.4)* | 21.1 (11.9)* | 21.0 (12.0)* |
| †Rsym | 0.18 (1.35)* | 0.23 (0.68)* | 0.24 (0.73)* |
| ‡Rpim | 0.07 (0.48)* | 0.11 (0.22)* | 0.11 (0.23)* |
| CC1/2 | 99.6 (53.3)* | ||
| Phasing | |||
| Resolution | 50–4.2 | ||
| No. of SeMet sites | 4 | ||
| Initial figure of merit | 0.32 | ||
| Refinement | |||
| Resolution (Å) | 50–2.10 | ||
| No. reflections | 27,513 | ||
| §Rwork/Rfree | 17.4/22.0 | ||
| No. non-hydrogen atoms | |||
| Protein | 2428 | ||
| Water | 122 | ||
| B-factors | |||
| Protein | 35.6 | ||
| Water | 33.1 | ||
| R.m.s deviations | |||
| Bond lengths (Å) | 0.012 | ||
| Bond angles (°) | 1.23 | ||
| Ramachandran favored (%) | 98.0 | ||
| Ramachandran outliers (%) | 0.0 | ||
| PDB code | 4W7G | ||
-
*
Numbers in parentheses refer to the highest resolution shell.
-
†
Rsym = ∑hkl∑i|Ii(hkl) − 〈Ihkl〉|/∑hkl∑i Ii(hkl), where Ii(hkl) is the scaled intensity of the ith measurement of a reflection and 〈Ihkl〉 is the average intensity for that reflection.
-
‡
Rpim = ∑hkl [1/(n−1)]1/2 ∑i∣Ii(hkl) − 〈Ihkl〉∣/∑hkl∑i Ii(hkl), where n is the number of times a single reflection has been observed.
-
§
R = ∑hkl∣Fobs, hkl − Fcalc, hkl∣/∑hkl∣Fobs,hkl∣x 100, where Rfree was calculated on a test set comprising approximately 6% of the data excluded from refinement.
Download links
A two-part list of links to download the article, or parts of the article, in various formats.
Downloads (link to download the article as PDF)
Open citations (links to open the citations from this article in various online reference manager services)
Cite this article (links to download the citations from this article in formats compatible with various reference manager tools)
A Ras-like domain in the light intermediate chain bridges the dynein motor to a cargo-binding region
eLife 3:e03351.
https://doi.org/10.7554/eLife.03351


