Lis1 regulates dynein by sterically blocking its mechanochemical cycle
- Harvard University, United States
- Harvard Medical School, United States
- University of Leeds, United Kingdom
Figures
Figure 1 with 2 supplements
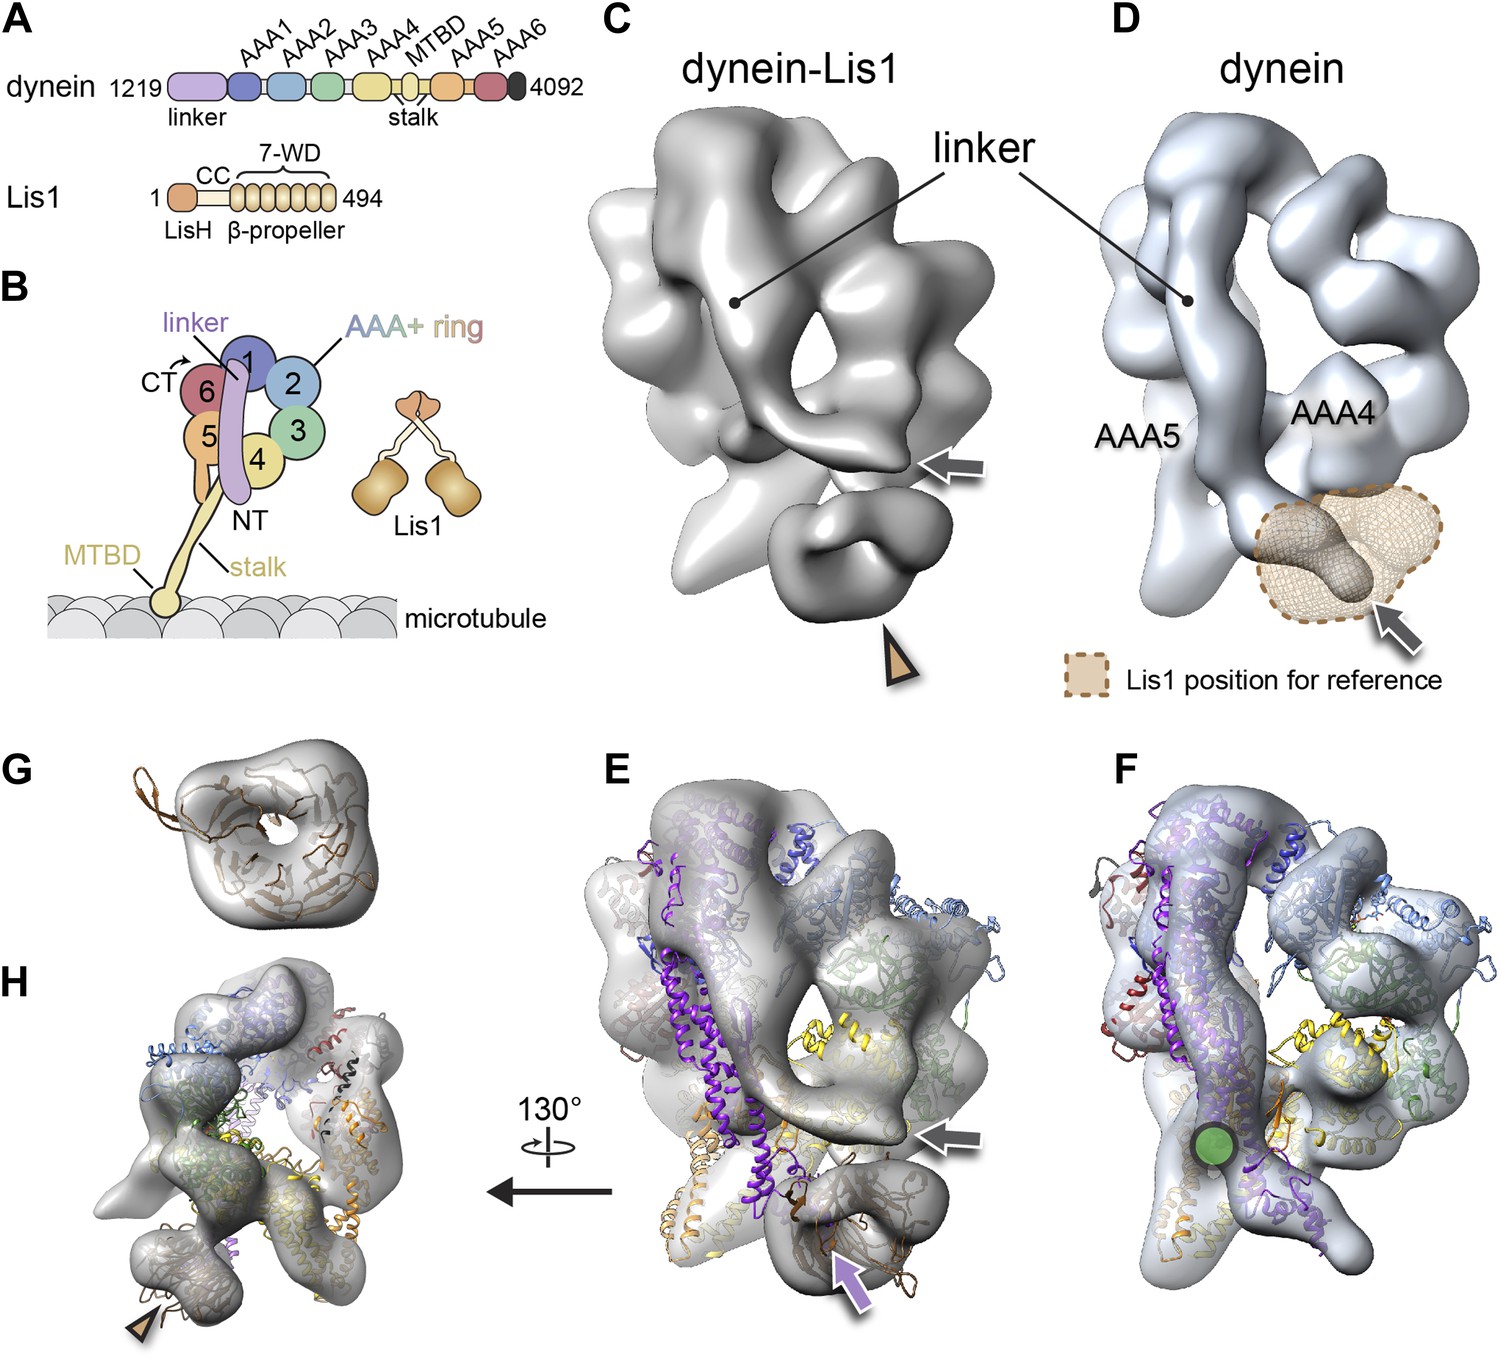
The binding of Lis1 to dynein changes the position of dynein's linker domain.
(A) Domain organization of dynein and Lis1 constructs used in this study. Dynein's AAA+ domains are labeled AAA1–6. MTBD: microtubule binding domain; CC: coiled coil; LisH: Lis-homology (dimerization) motif. (B) Schematic representation of dynein and Lis1, color-coded as in (A) and throughout the paper. NT: N terminus; CT: C terminus. (C) Cryo-NS EM reconstruction of the dynein motor domain in complex with Lis1 and (D) of the motor domain alone. AAA4 and AAA5 are labeled. A density present only in the dynein–Lis1 map is highlighted in (C) (brown arrowhead). The linker occupies different positions in the two maps (compare labeled densities and gray arrows), and its position in the dynein alone map is sterically incompatible with Lis1, as indicated by a semi-transparent Lis1 density. (E) Structural model of dynein's motor domain docked into the EM maps of dynein–Lis1 and (F) dynein alone. The model was built from crystal structures of the S. cerevisiae dynein ring (PDB ID: 4AKG [Schmidt et al., 2012]) and D. discoideum linker aligned to the yeast linker position (PDB ID: 3VKG [Kon et al., 2012]), the D. discoideum linker being closer in length to that in our EM construct. In (E), a homology model of the S. cerevisiae Lis1 β-propeller (brown) has been docked into the new density highlighted in (C). The linker domain in the EM map (gray arrow) is shifted away from its position in the crystal structure (purple arrow), which protrudes from the EM density and clashes with the Lis1 density. In contrast, the linker is within the EM density in the dynein alone map (F). Green circle: location of known interactions between the linker and AAA5 module in dynein (Schmidt et al., 2012). (G) Close-up view of the Lis1 density with homology model docked in, viewed along the axis indicated by the arrowhead in (C). (H) A rotated, smaller view of (E), showing the interface between Lis1 (brown arrowhead) and dynein.
Figure 1—figure supplement 1
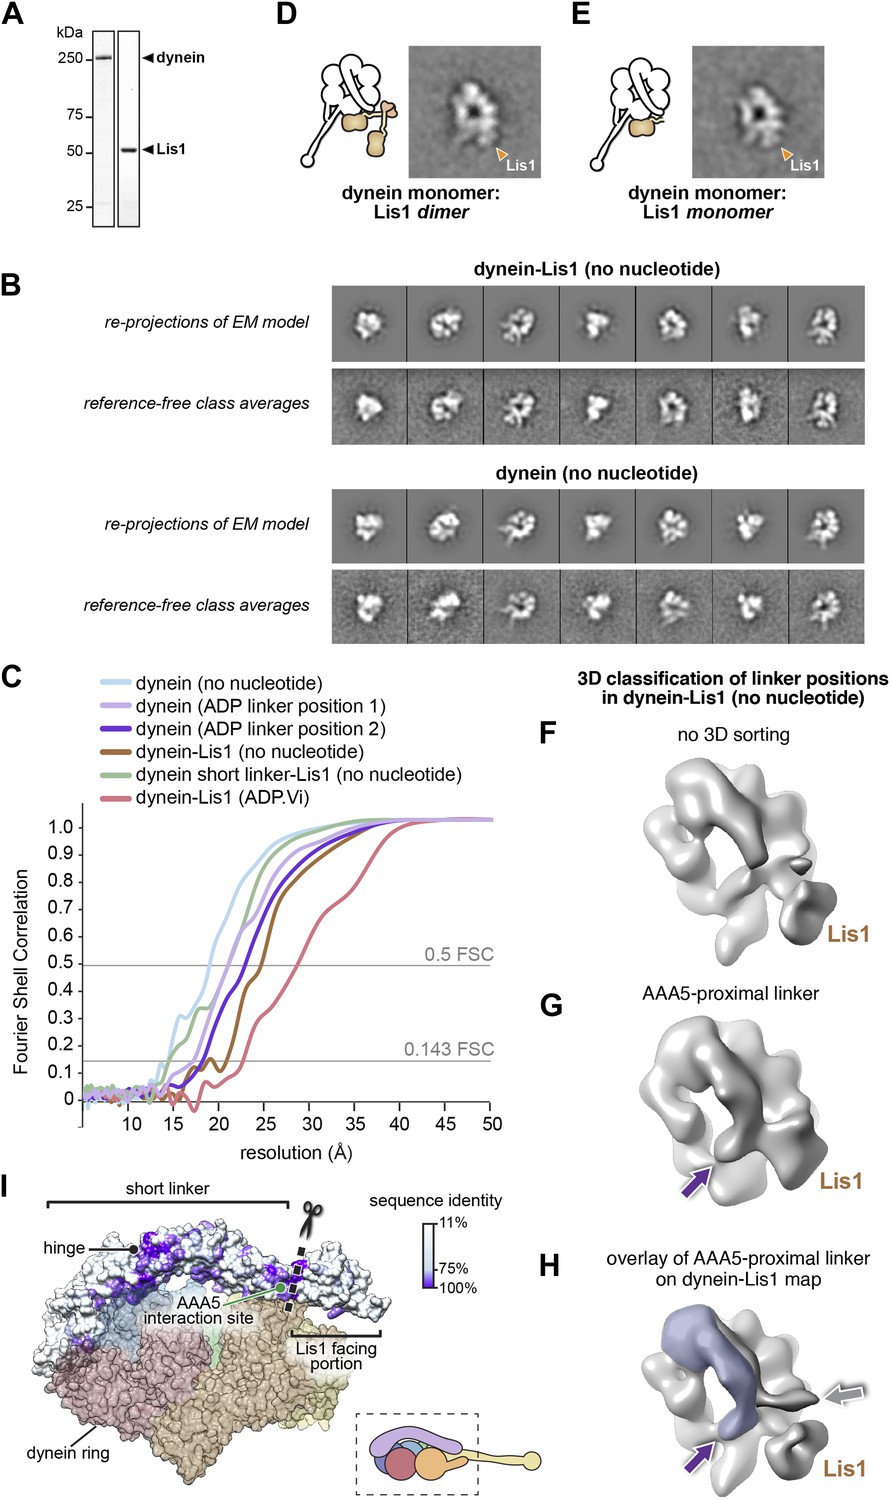
Three-dimensional (3D) classification and refinement of the dynein and dynein–Lis1 reconstructions.
(A) SDS-PAGE of dynein and Lis1, affinity purified from S. cerevisiae. (B) Comparison between re-projections of the dynein and dynein–Lis1 reconstructions and the best-matching reference-free class averages (no nucleotide conditions). (C) Fourier Shell Correlation plots for all EM maps presented. The plots are shown as a function of resolution (1/frequency). The thresholds for the 0.5 FSC and 0.143 FSC criteria are shown. (D and E) Class averages of monomeric dynein in complex with dimeric (D) or monomeric (E) Lis1, with a schematic representation alongside each. (F–H) 3D classification of linker positions in the dynein–Lis1 (no nucleotide) data set. (F) A reconstruction using the entire data set without sorting out linker conformations. The N-terminus of the linker is mostly averaged out in this map. (G) 3D class average of a subset of dynein motors whose linkers are located on the AAA5 proximal side of Lis1. The purple arrow points to the N-terminus of the linker. (H) The linker density from (G) was overlaid on the dynein–Lis1 structure (Figure 1C) to highlight the different positions adopted by the linker in the presence of Lis1. The purple and gray arrows point to the N-terminus of the linker domain in the two conformations. The Lis1 density is indicated in all three maps. (I) A side view of the dynein motor domain in surface representation with the linker domain colored by conservation (100%, purple; 11%, white). The alignment was carried out using cytoplasmic dynein from the following species: M. musculus, H. sapiens, S. cerevisiae, C. albicans, A. fumigatus, A. nidulans, D. discoideum, D. melanogaster, and C. elegans using Muscle (Edgar, 2004). For orientation, a cartoon representation of the view is shown bottom right. The truncation site for the short linker dynein is marked with a dashed line and scissors (see Figure 5).
Figure 1—figure supplement 2
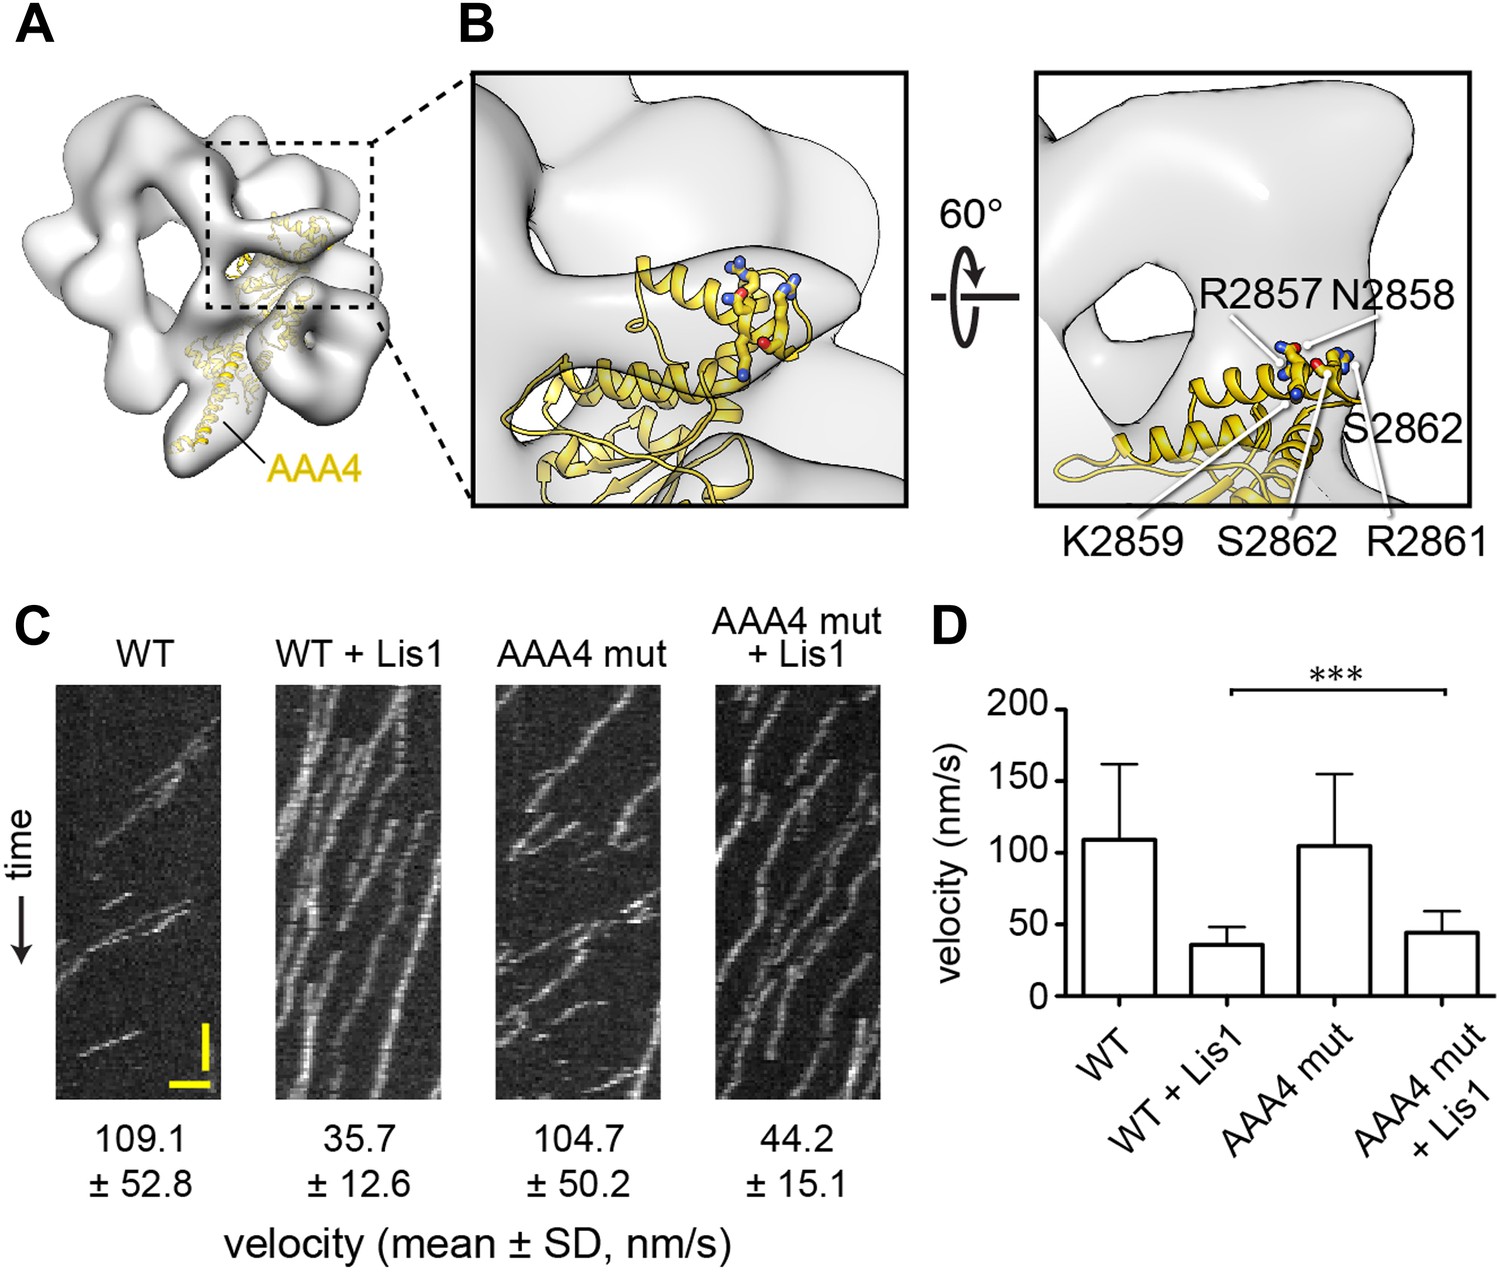
The linker's displaced position in the presence of Lis1 does not appear to involve a specific interaction with AAA4.
(A) Zoomed out view of dynein–Lis1; only the portion of the crystal structure corresponding to AAA4 is displayed, in yellow (PDB ID: 4AKG [Schmidt et al., 2012]). (B) Close-up of the N-terminal portion of the linker (left) and a view rotated by 60° (right). The latter shows a density connecting the linker and AAA4. Residues in an AAA4 helix that are located in the density connecting AAA4 to the linker are shown in atomic representation, colored by element, and labeled. (C) Kymographs of in vitro motility experiments with TMR-labeled wild-type GST-dynein331kDa or mutant GST-dynein331kDa with the five residues labeled in (C) changed to alanine (AAA4 mut). Assays were performed with dynein alone or in the presence of 200 nM Lis1. Horizontal scale bar = 2 μm, vertical = 30 s. (D) Histogram of mean velocities for each experiment ± S.D., N = 228–612, ***p < 0.0001.
Figure 2 with 2 supplements
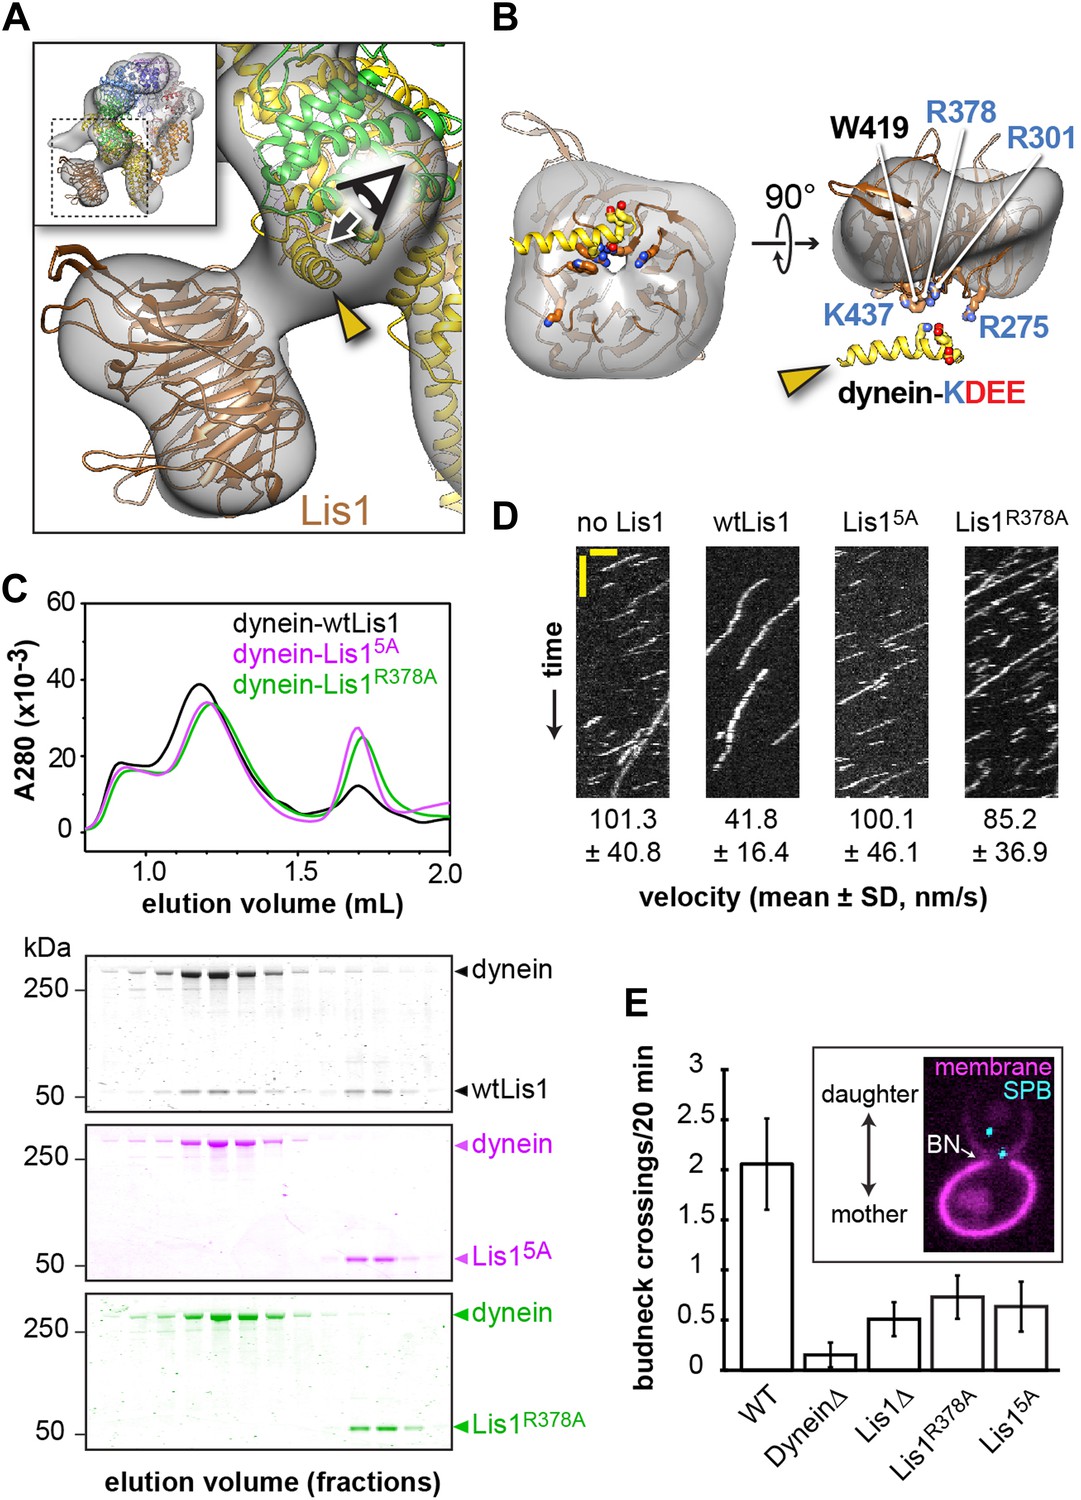
Disrupting the putative dynein–Lis1 interface impairs Lis1's ability to bind to and regulate dynein.
(A) The Lis1 β-propeller engages dynein primarily at a surface helix connecting AAA3 and AAA4 (yellow arrowhead, see Video 3). Inset: a zoomed out view. (B) (Left) View along the axis highlighted in (A) by the eye/arrow; (right) rotated view. Except for the helix (yellow), the dynein density was removed for clarity. Five conserved residues on Lis1 that were mutated to alanine, either in combination (Lis15A) or individually, are labeled and shown in atomic representation. Also displayed are residues (KDEE) in dynein known to be involved in the interaction with Lis1 (Huang et al., 2012). Basic and acidic residues are labeled in blue and red, respectively. (C) No co-migration of dynein and Lis1 was detected by size-exclusion chromatography with the Lis15A and Lis1R378A mutants. Traces show elution profiles of GST-dynein331kDa (‘dynein’) with wild-type Lis1 (black), Lis15A (purple) and Lis1R378A (green). SDS-PAGE for collected fractions are shown below. (D) Kymographs of in vitro motility experiments with TMR-labeled GST-dynein331kDa alone or in the presence of 200 nM wild-type or mutant Lis1. Horizontal scale bar = 2 μm, vertical = 20 s, N = 274–542. (E) In vivo spindle oscillation assays comparing S. cerevisiae strains carrying either wild-type or mutant Lis1 or full deletions of dynein or Lis1. Inset is a Z-projection of a dividing cell with markers for the membrane (purple) and spindle pole bodies (SPBs) (cyan). BN = bud neck. Bud neck crossings by the SPBs were counted over 20 min. WT N = 53, DyneinΔ N = 32, Lis1Δ N = 55, Lis1R378A N = 58, Lis15A N = 47. For each strain the mean and SE are shown.
Figure 2—figure supplement 1

Probing of the proposed dynein–Lis1 interface by mutagenesis.
(A) Sequence identity (100%, purple; 0%, white) mapped onto the Lis1 homology model. The alignment was carried out with the following species: M. musculus, H. sapiens, S. cerevisiae, A. nidulans, D. discoideum, D. melanogaster, X. laevis, C. elegans, and D. rerio using Muscle (Edgar, 2004). (B) The Lis1 homology model was docked into the dynein–Lis1 map in two possible orientations, with either the top (middle panel) or bottom (right panel) face interacting with dynein. The rotations relating the two orientations are indicated. A cross-correlation coefficient calculated for each fit is shown below the structures. These coefficients were calculated between the Lis1 EM density and the homology model filtered to the same resolution (21 Å) (as implemented in UCSF Chimera [Pettersen et al., 2004]). (C) Size-exclusion chromatography traces for wild-type and Lis1 mutants. (D) SDS-PAGE of size-exclusion chromatography fractions for GST-dynein331kDa (shortened to ‘dynein’ in the figure) mixed with wild-type of mutant Lis1.
Figure 2—figure supplement 2

Velocity distributions for dynein alone or in the presence of wild-type or mutant Lis1.
Histogram showing the velocity distribution of single TMR-labeled GST-dynein331kDa molecules in the absence of Lis1 (black) and with 200 nM wild-type Lis1 (light gray), Lis1R378A (medium gray) and Lis15A (dark gray). Velocity distributions were unimodal and could be well fit by a single Gaussian (R2 values between 0.8221 and 0.9937).
Figure 3 with 1 supplement

Lis1 sterically blocks the linker domain's normal position on dynein's ring in ADP and no nucleotide conditions but does not prevent it from reaching the pre-powerstroke position at AAA2.
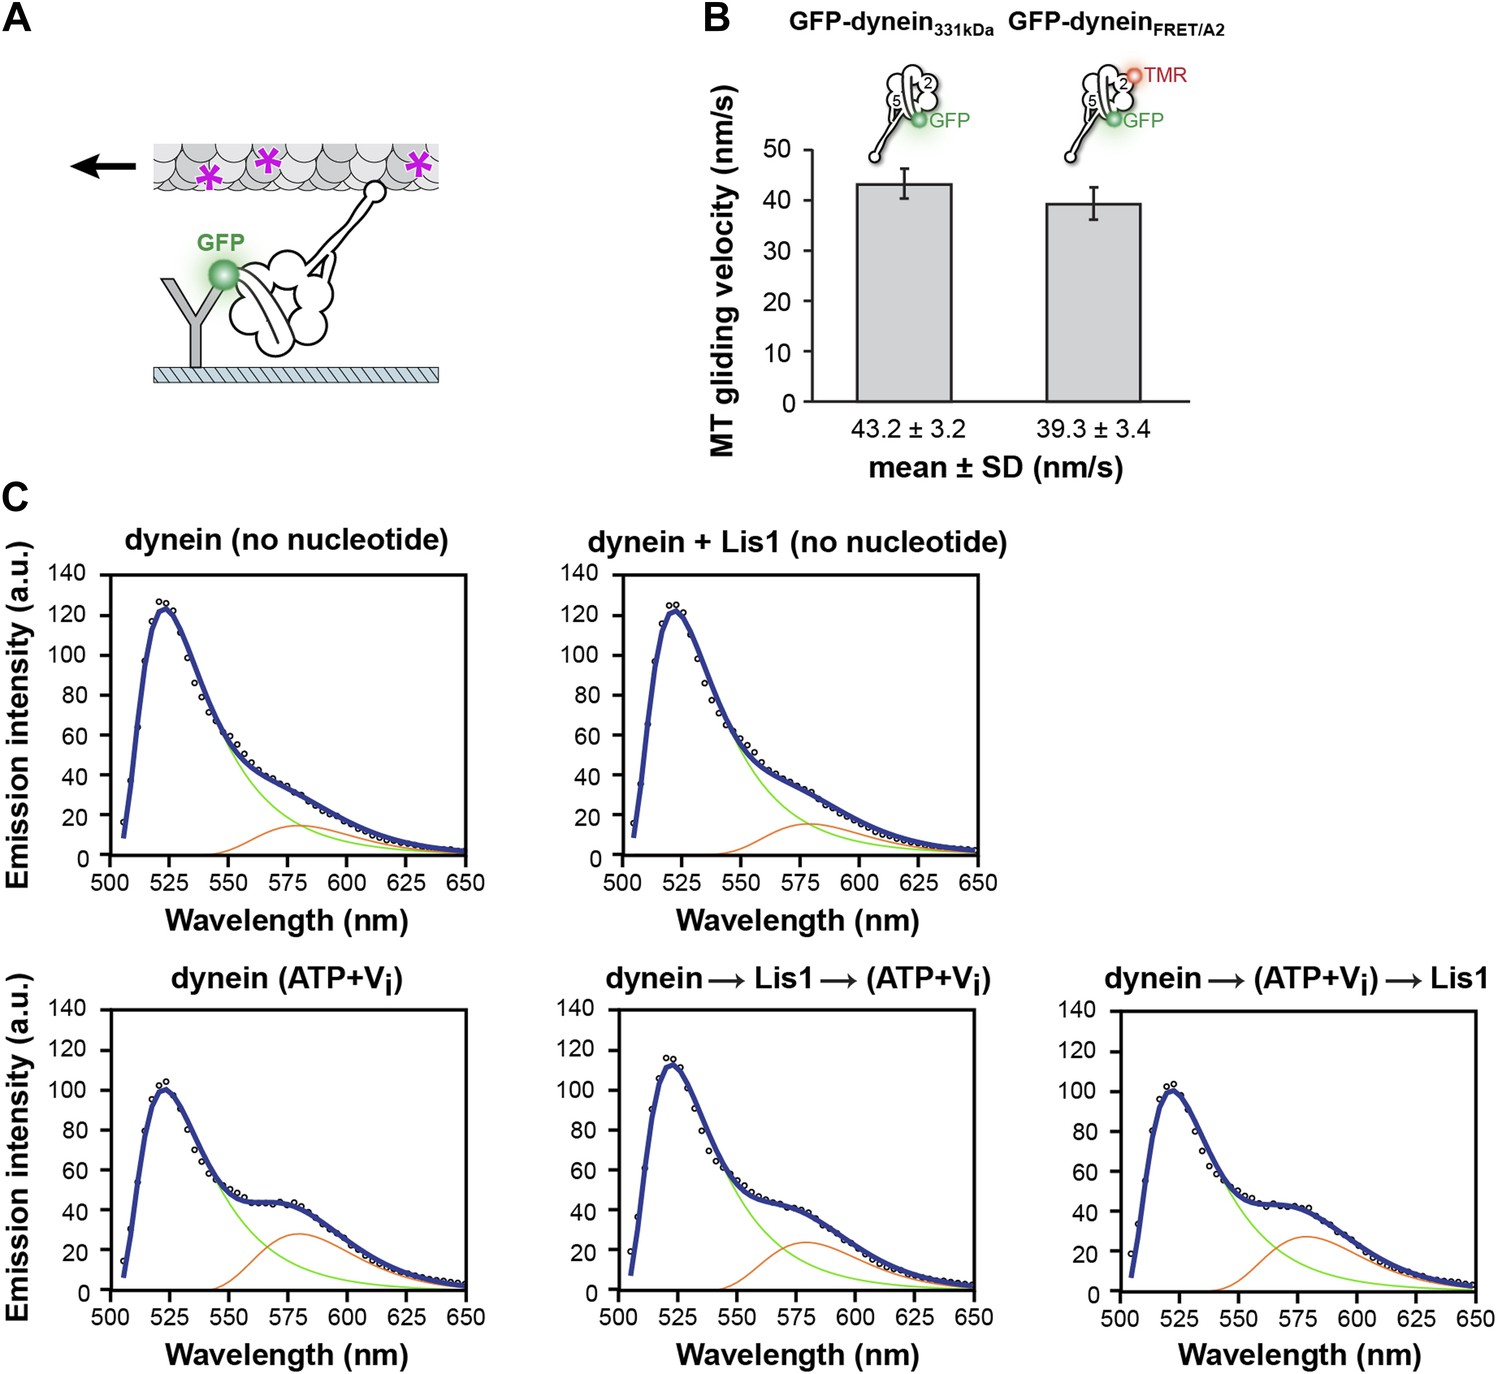
(A) Cryo-NS maps of S. cerevisiae dynein in 100 μM ADP displaying the linker next to either AAA5 (left) or AAA4 (right). The S. cerevisiae linker domain (lacking nucleotide at AAA1, PDB ID: 4AKG [Schmidt et al., 2012]) and the D. discoideum linker domain (with ADP at AAA1, PDB ID: 3VKG [Kon et al., 2012]) are displayed in purple ribbon representation and have been docked into the linker-AAA5 and linker-AAA4 maps, respectively. To enable unambiguous comparison of linker positions between the EM density and crystal structure, we aligned each EM map to the corresponding dynein motor domain crystal structure after computationally removing the linker. (B) The dynein maps in no nucleotide (blue) and ADP (purple) conditions (the latter with the linker at the AAA4 location) are overlaid to compare linker positions. The location of Lis1 in the dynein–Lis1 map is shown as a transparent brown density. Both linker positions are sterically incompatible with the presence of Lis1. Note: since the ADP AAA5 linker position is the same as that seen under no nucleotide conditions, we only show the ADP map with the linker at AAA4. (C) Schematic representation of the dynein FRET construct used to test dynein's linker swing in the presence of Lis1. eGFP (green sphere–donor) was fused to the N-terminus of the linker domain, and TMR (red sphere–acceptor) was inserted into the AAA2 domain in the ring. A pre-powerstroke linker position, where the linker moves close to AAA2 in ATP plus vanadate (Vi) conditions, would display an increased FRET efficiency between the two fluorophores (bottom) relative to the no nucleotide state, where the linker is docked at AAA5 (top). (D) FRET efficiency between the eGFP and TMR fluorophores in the absence or presence of 200 μM ATP + Vi and 840 nM Lis1, ***p < 0.001. The order of addition for the reactions containing ATP + Vi and Lis1 is indicated by arrows. Averages of three experiments ± SD are shown. (E) Cryo-NS reconstruction of dynein–Lis1 in ATP + Vi conditions with the crystal structure of the motor domain docked in (PDB ID: 4AKG [Schmidt et al., 2012]). The Lis1 density is indicated. (F) At lower contour levels, the N-terminal portion of the linker can be resolved (purple arrow).
Figure 3—figure supplement 1
FRET analysis of linker movement towards the pre-powerstroke position in the presence of Lis1.
(A) Diagram of a microtubule-gliding assay. Monomeric GFP-dynein molecules are immobilized on the coverslip via anti-GFP antibodies (Y shape). Dynein-driven gliding of fluorescently labeled (purple asterisks) microtubules is visualized using TIRF microscopy. (B) A dynein FRET construct with CoA-TMR inserted into its AAA2 domain (GFP-dyneinFRET/A2) has a microtubule gliding activity similar to that of a control construct lacking it (GFP-dynein331kDa). (C) Fitted FRET emission spectra for dynein in different nucleotide conditions (no nucleotide or 200 μM ATP + Vi) and with 0 nM or 840 nM Lis1. Arrows indicate the order of addition for the last two plots. Emission spectra for eGFP and TMR used for the fit are shown as green and red traces, respectively.
Figure 4 with 1 supplement
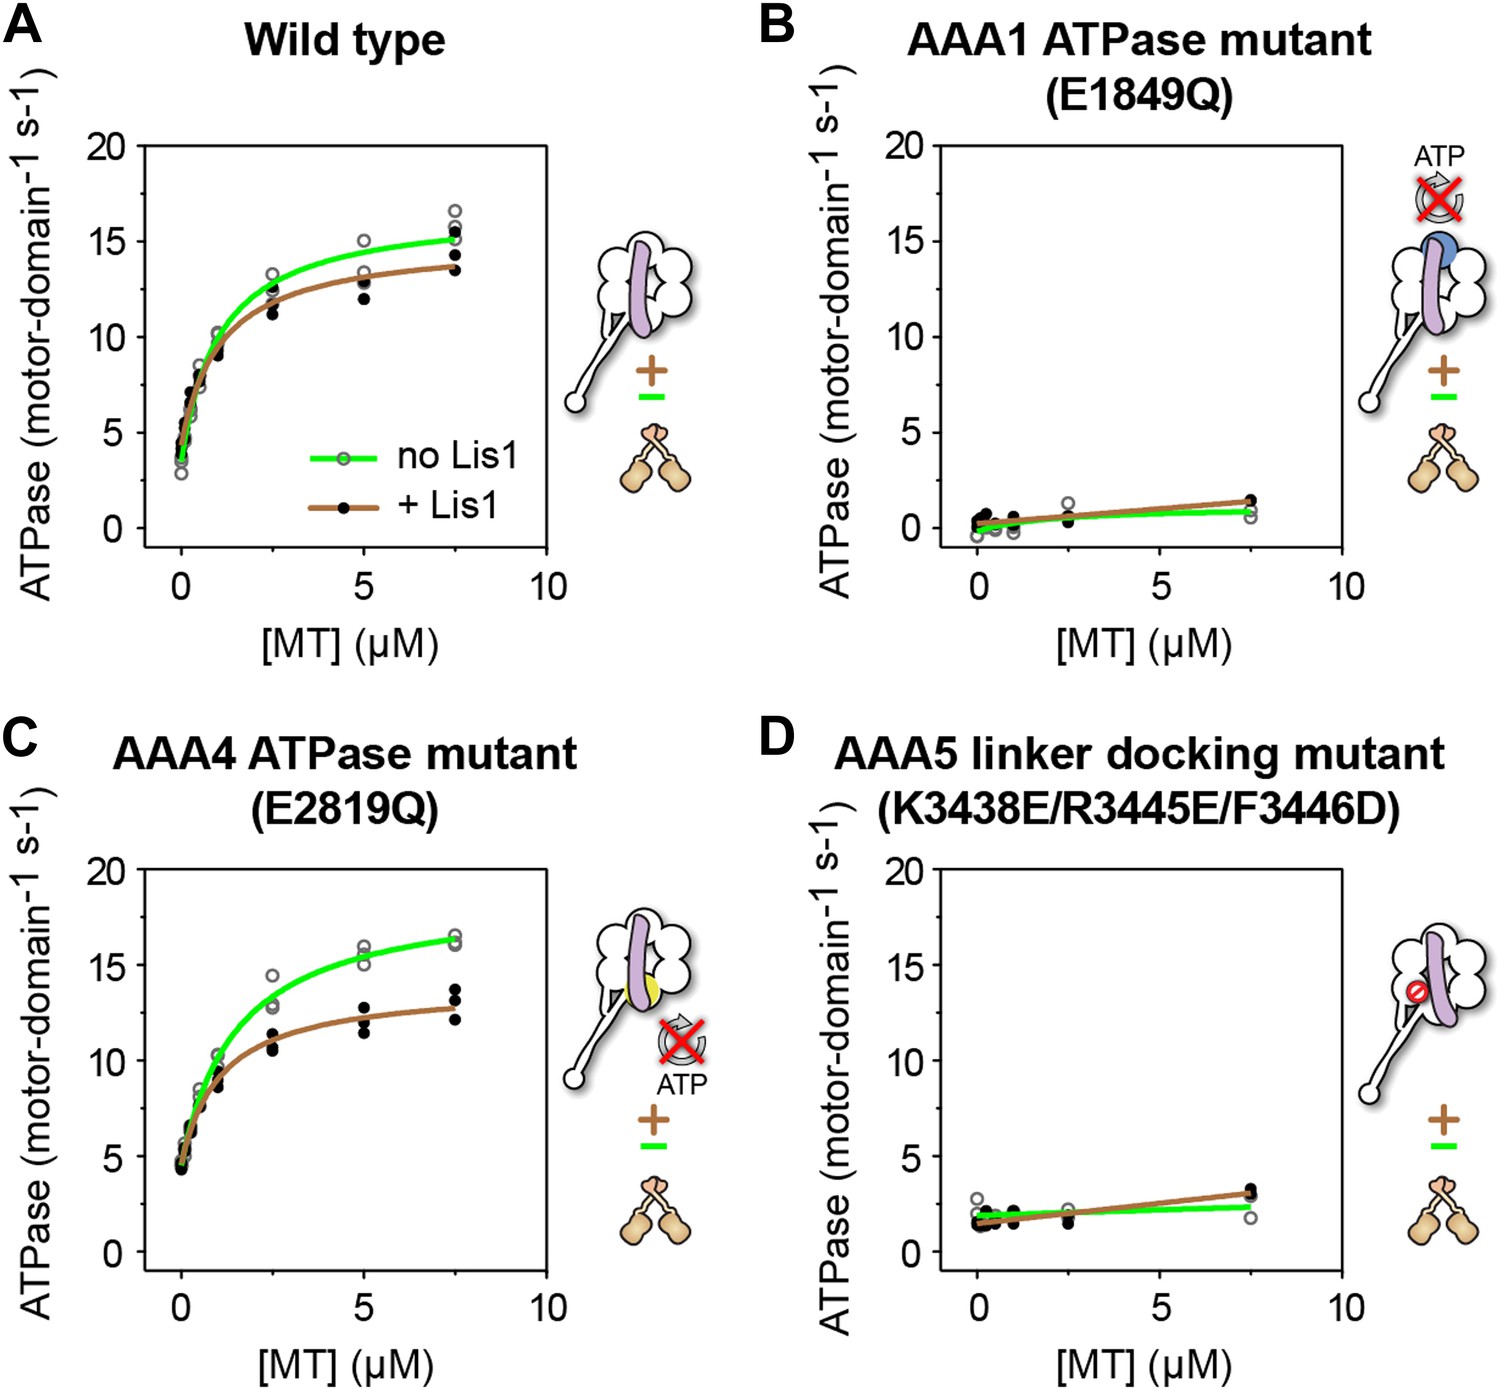
ATP turnover in the presence of Lis1 requires a hydrolysis-competent AAA1 and a functional AAA5 linker-docking site.
Microtubule-stimulated ATPase activity of dynein monomers carrying (A) wild-type AAA+ modules, (B) a hydrolysis deficient E1849Q mutation in AAA1 (Kon et al., 2004), (C) a hydrolysis deficient E2819Q mutation in AAA4 (Cho et al., 2008), (D) AAA5 mutations (K3438E, R3445E, F3446D) that prevent linker docking (Schmidt et al., 2012). ATPase traces are of dynein alone (light green) or in the presence of 140 nM Lis1 (brown). Measurements were done in triplicate (A and C) or duplicate (B and D) from one preparation. Diagrams of the dynein constructs used to generate the plots are shown next to them. See Table 3 for fit equation and rate quantifications.
Figure 4—figure supplement 1
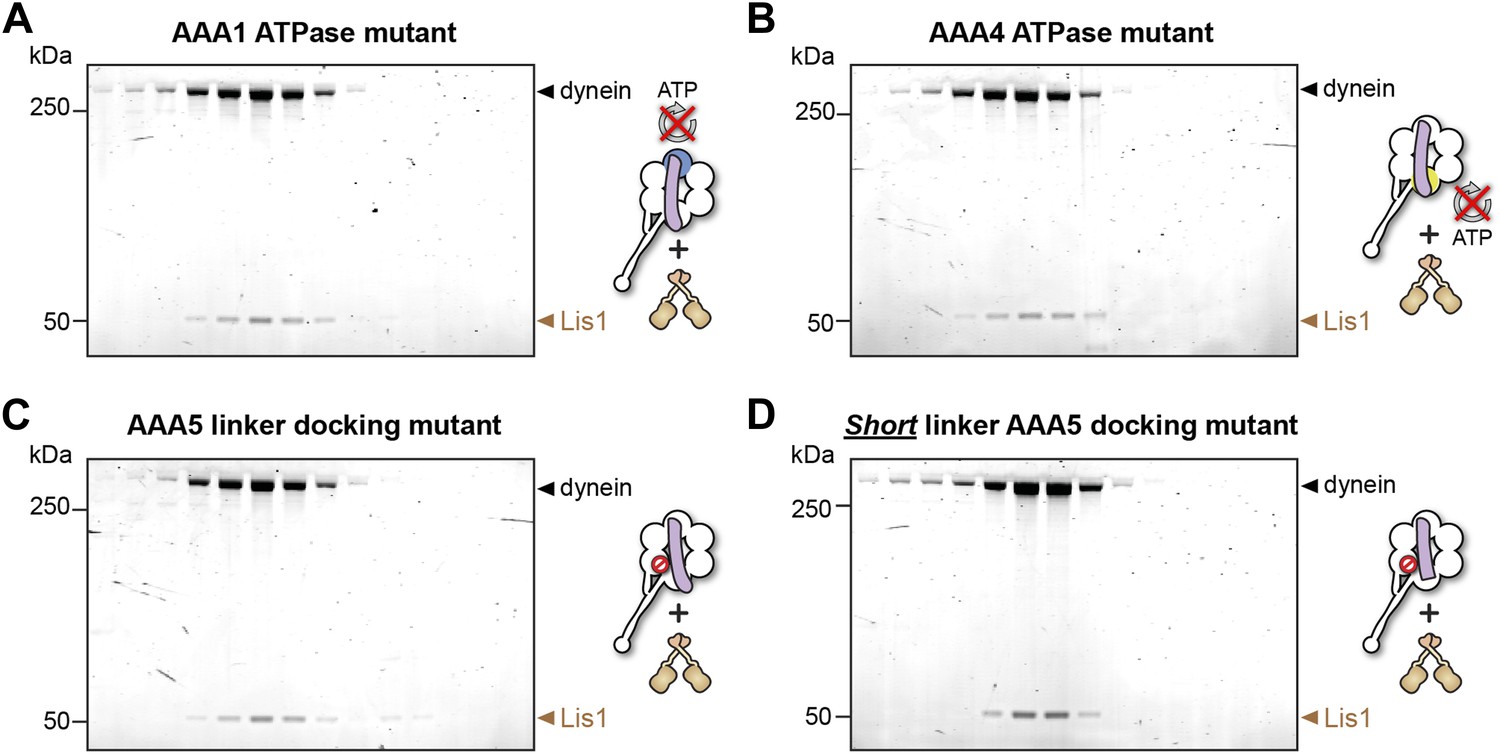
Lis1 binds to dynein ATPase mutants.
(A–D) SDS-PAGE of fractions eluted from size-exclusion chromatography runs of Lis1 mixed with each of the dynein constructs used in the ATPase assays. Lis1 co-elutes with all of the constructs.
Figure 5 with 1 supplement

A shortened linker that can physically bypass Lis1 renders dynein Lis1 insensitive.
(A) A short linker construct was designed by docking the crystal structure of the D. discoideum linker (purple ribbon) (PDB ID: 3VKG [Kon et al., 2012]) into our EM map of dynein alone and overlaying the position of Lis1 (brown mesh). Truncating the linker at residue 1365 (dashed line) yields a linker that is functional (see Figure 5—figure supplement 1) but that can no longer contact Lis1. (B) Cryo-NS reconstruction of the short linker dynein–Lis1 complex; the linker assumes the same conformation with Lis1 bound as in the absence of Lis1. (C) Diagram of the single-molecule microtubule release assay we used to test Lis1 regulation of dynein. Release from microtubules of TMR-labeled (red asterisk) dynein monomers on addition of ATP is monitored by TIRF microscopy. (D) Diagrams of predicted outcomes. Dynein's linker domain in purple, microtubule in gray, Lis1 in brown. (i) Dynein monomers release from microtubules in ATP conditions in the absence of Lis1. (ii) Our model proposes that Lis1 sterically blocks a full-length linker from assuming the normal conformation on dynein's ring, keeping dynein bound to the microtubule. (iii) In the absence of Lis1, shortening the linker would have no effect on dynein's mechanochemical cycle. (iv) Our model predicts that a shortened linker that can bypass the Lis1 steric block should render dynein insensitive to Lis1. (E) Kymographs of TMR-labeled full-length (left) or short linker (right) dynein molecules. After pre-binding to microtubules, release of dynein molecules is monitored after addition of 5 mM ATP, with and without 300 nM Lis1. Kymographs correspond to the dynein constructs shown in (D). Scale bar = 5 s. (F) Quantification of the kymographs in (D), showing the duration of microtubule attachment after addition of ATP, in the absence (gray) or presence (brown) of Lis1. Data were binned into 1 s intervals and the histograms show alternating no Lis1 and +Lis1 bars. Rare attachments longer than 10 s were excluded from the analysis and plot, N = 179–183.
Figure 5—figure supplement 1
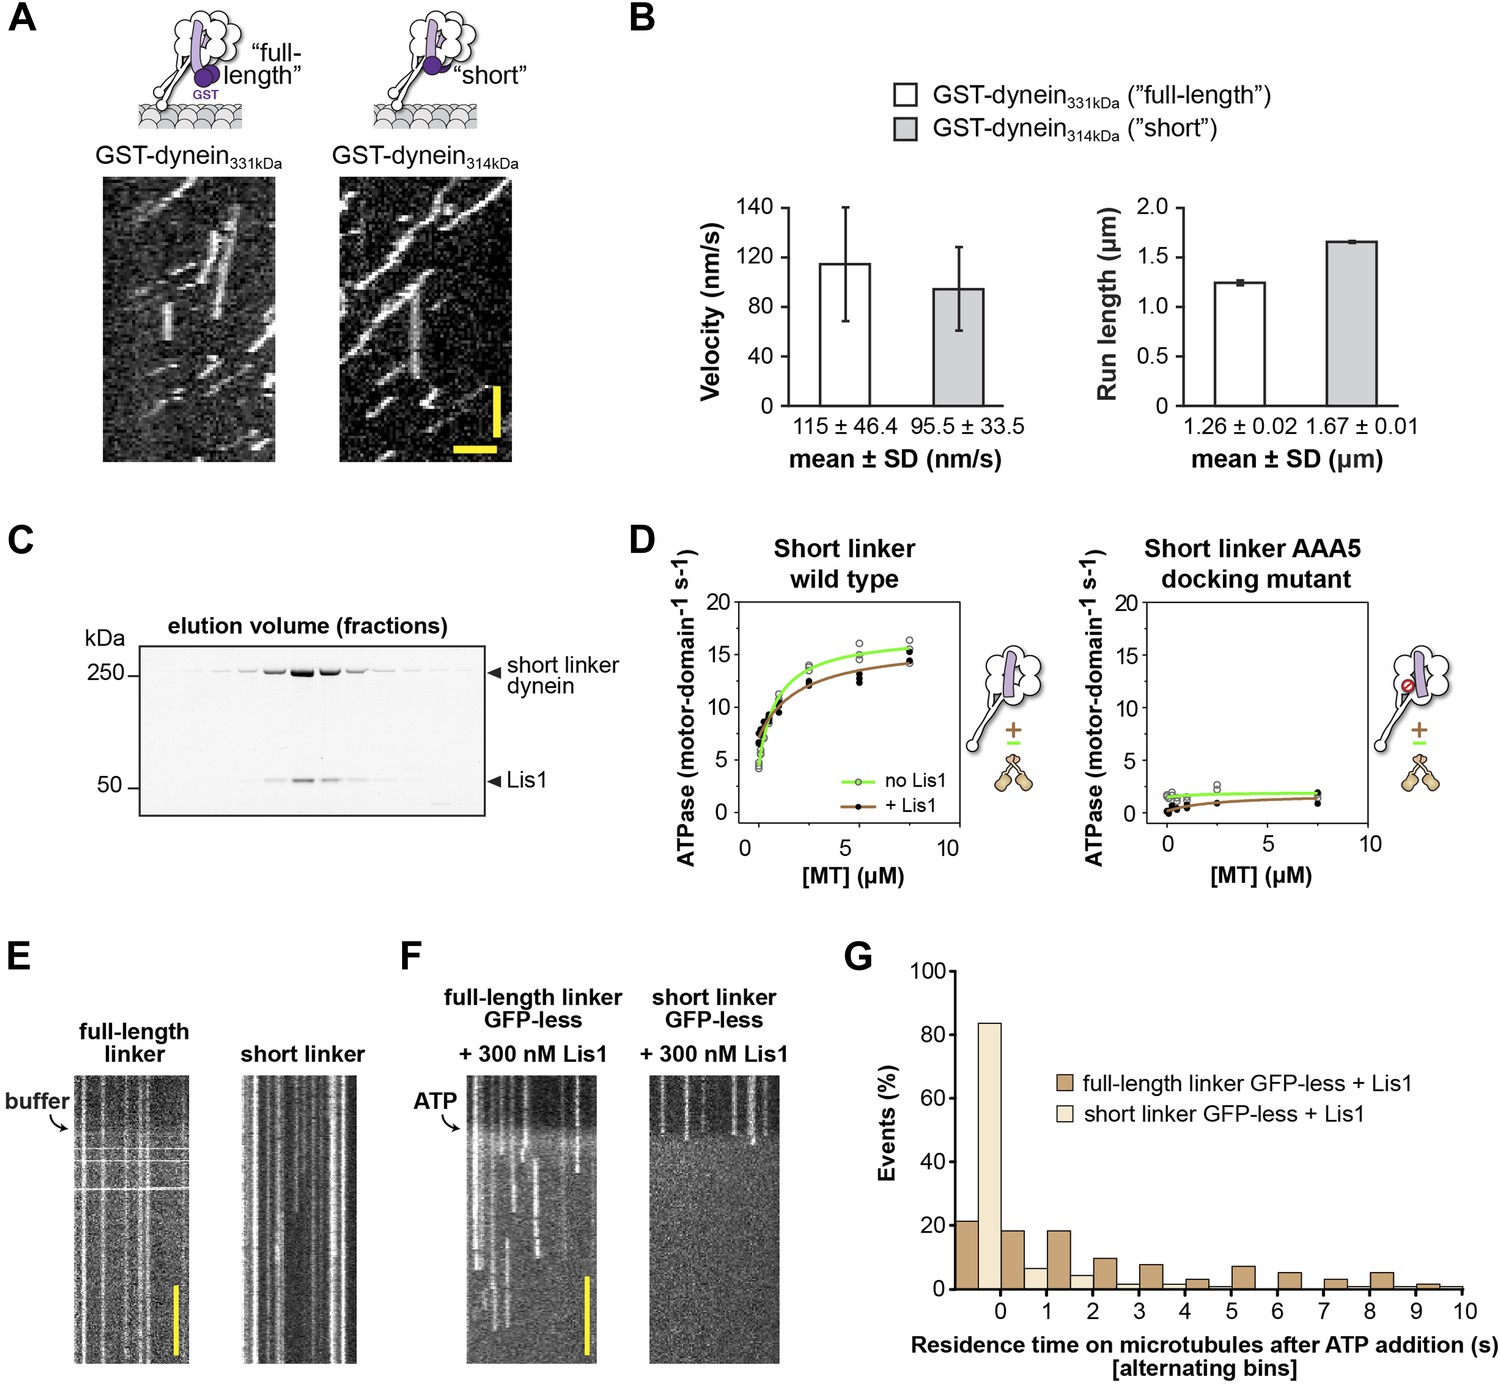
The short linker dynein construct shows robust motility, hydrolyzes ATP, and binds Lis1.
(A) Single-molecule motility assays. Kymographs of GST-dimerized full-length and short linker dyneins. Horizontal scale bar = 2 μm, vertical = 30 s. (B) Velocity and run length for short linker and full-length linker dyneins. Similar values are seen for the two constructs, N = 265–333. (C) SDS-PAGE of elution fractions from size-exclusion chromatography of monomeric short linker dynein mixed with Lis1. Lis1 co-migrates with short linker dynein. (D) Microtubule-stimulated ATPase activity of short linker dynein with either wild-type AAA+ modules (left) or with mutations (K3438E, R3445E, F3446D) that prevent linker docking at AAA5 (Schmidt et al., 2012) (right). ATPase traces are of dynein alone (light green) or in the presence of 140 nM Lis1 (brown). Measurements were done in triplicate (wild type) or duplicate (AAA5 mutant) from one preparation. Diagrams of the dynein constructs used to generate the plots are shown next to them. (E) Addition of buffer lacking ATP to flow chambers containing TMR-labeled full-length or short linker dynein does not cause microtubule detachment. Scale bar = 5 s. (F) The short linker construct used in Figure 5 contains an N-terminal GFP connected to the short linker via 3 HA tags. We expected the GFP to be flexible in its location relative to dynein based on previous EM studies (Roberts et al., 2009) and the fact that it is averaged out in our 3D reconstruction of dynein (Figure 1D). However, to rule out interference from GFP, we also carried out the microtubule release assays with a GFP-less construct. We observed the same results: addition of ATP to GFP-less dyneins in the presence of 300 nM Lis1 caused short-linker dyneins to release from the microtubule while full-length dyneins remain attached. Scale bar = 5 s. (G) Quantification of the kymographs in (F), showing the duration of microtubule attachment of full-length (light brown) or short linker (dark brown) dynein molecules after addition of ATP, in the presence of 300 nM Lis1. Data were binned into 1 s intervals and the histograms show alternating full-length and short linker dynein bars. Rare attachments longer than 10 s were excluded from the analysis and plot, N = 141–197.
Figure 6
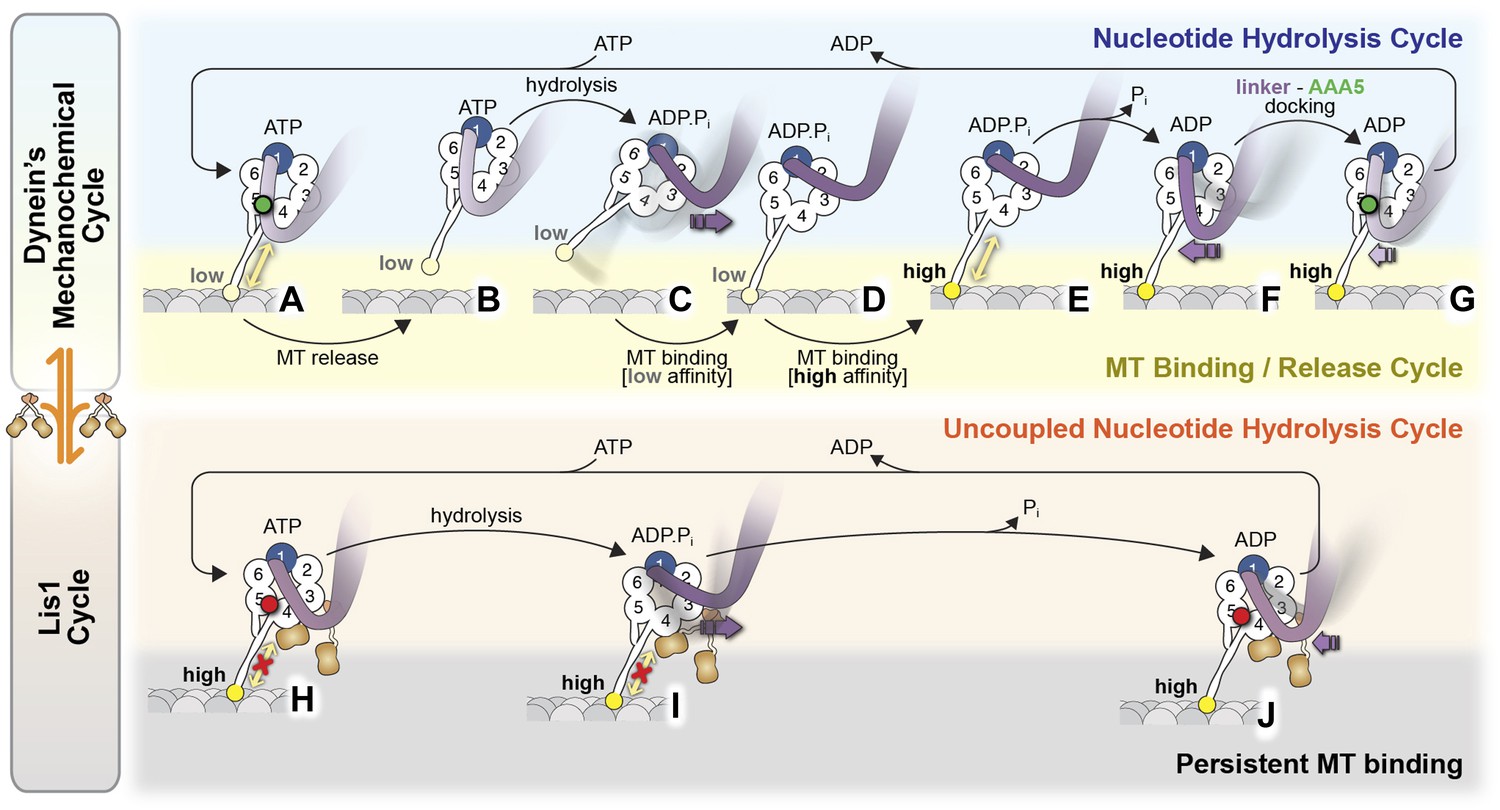
Model for the regulation of dynein by Lis1.
(A–G) Current view of dynein's mechanochemical cycle. (A) ATP binding to AAA1 induces the low-affinity conformation in dynein's microtubule-binding domain and (B) release from the microtubule. (C) The linker domain changes its position from AAA5 towards AAA2, the ‘pre-powerstroke’ and ATP is hydrolyzed. (D) Binding of dynein to a new site on the microtubule triggers a change in the microtubule-binding domain to its high affinity conformation (E). (F) Release of Pi results in the ‘powerstroke’, a movement of the linker back towards AAA5. (G) Docking of the linker at AAA5 is thought to promote nucleotide exchange at AAA1, resetting the motor for a new cycle. (H–J) Model for the Lis1-regulated cycle. Lis1 prevents the linker from completing its normal conformational cycle, keeping dynein in a persistent microtubule-attached state, despite continuing ATP hydrolysis. (H) Binding of Lis1 to dynein blocks the linker from docking onto the ring at AAA5, preventing the conformational changes in the stalk and microtubule binding domain that ultimately result in dynein's release from the microtubule. (I) The linker is still capable of moving to the pre-powerstroke position at AAA2 in the presence of Lis1, and ATP is hydrolyzed. (J) Presumably, by analogy to the dynein alone cycle, Pi release triggers the power-stroke, but Lis1 sterically blocks the linker's normal position on dynein's ring in the ADP state. Our current understanding of Lis1 regulation does not yet explain the mechanism of nucleotide exchange at AAA1.
Videos
Video 1
The three-dimensional structure of dynein–Lis1.
The movie shows the 3D reconstruction of dynein in complex with Lis1 with 360° rotation about the Y-axis. After this rotation, the EM density is made transparent to display the docked dynein crystal structure model and Lis1 homology model and is again rotated by 360° about the Y-axis.
Video 2
The three-dimensional structure of dynein.
The movie shows the 3D reconstruction of dynein alone with 360° rotation about the Y-axis. After this rotation, the EM density is made transparent to display the docked dynein crystal structure model and is again rotated by 360° about the Y-axis.
Video 3
The dynein–Lis1 interface.
The movie shows the 3D reconstruction of dynein–Lis1, with the crystal structure of the dynein motor domain and the Lis1 homology model docked in. After a few frames, the EM density disappears to show only the atomic structures and the view changes to show the interaction between dynein and Lis1 in closer detail, finishing with an open-book view of Lis1. The conserved residues that were mutated in Lis1 are annotated as well as the conserved residues in the AAA4 helix in dynein that have been shown to be necessary for Lis1 binding. Note: the rotational fit of the Lis1 propeller within the Lis1 EM density is uncertain at the current resolution of the dynein–Lis1 map.
Tables
Table 1
Yeast strains
| Strain | Genotype | Figure(s) |
|---|---|---|
| Reference | ||
| RPY753 | MATa, his3-11,15, ura3-1, leu2-3,112, ade2-1, trp1-1, pep4Ä::HIS5, prb1Ä, PGAL1-ZZ-Tev-GFP-3xHA-GST-DYN1331kDa-gs-DHA, pac1Ä::URA3, ndl1Ä::cgLEU2 | Figure 2, Figure 2—figure supplement 1,2, Figure 5—figure supplement 1 |
| Huang et al., 2012 | ||
| RPY816 | MATa, his3-11,15, ura3-1, leu2-3,112, ade2-1, trp1-1, pep4Ä::HIS5, prb1Ä, PGAL1-ZZ-Tev-PAC1, dyn1Ä::cgLEU2, ndl1Ä::HygroR | Figures 1–5, Figure 2—figure supplement 1,2, Figure 1—figure supplement 1, Figure 4—figure supplement 1, Figure 5—figure supplement 1 |
| Julie Huang, Harvard Medical School | ||
| RPY842 | MATa, his3-11,15, ura3-1, leu2-3,112, ade2-1, trp1-1, pep4Ä::HIS5, prb1Ä, PGAL1-ZZ-Tev-PAC1-g-1xFLAG-ga-SNAP-KanR, dyn1Ä::cgLEU2, ndl1Ä::HygroR | Figures 3,5, Figure 3—figure supplement 1, Figure 5—figure supplement 1 |
| Huang et al., 2012 | ||
| RPY844 | MATa, his3-11,15, ura3-1, leu2-3,112, ade2-1, trp1-1, pep4Ä::HIS5, prb1Ä, PAC11-13xMYC-TRP1, PGAL1-ZZ-Tev-GFP-3xHA-DYN1331kDa, pac1Ä::HygroR | Figures 1,4, Figure 1—figure supplement 1, Figure 3—figure supplement 1 |
| Huang et al., 2012 | ||
| RPY1198 | MATa, his3-11,15, ura3-1, leu2-3,112, ade2-1, trp1-1, pep4Ä::HIS5, prb1Ä, PAC11-13xMYC-TRP1, PGAL1-ZZ-Tev-GFP-3xHA-DYN1331kDa-gs-DHA-KanR, pac1Ä::HygroR | Figure 5, Figure 5—figure supplement 1 |
| Huang et al., 2012 | ||
| RPY1245 | MATa, ura3-52, lys2-801, leu2-Ä1, his3-Ä200, trp1-Ä63, SPC110-GFP::TRP1, HXT1-tdTomato::HIS3 | Figure 2 |
| Jeff Moore, University of Colorado | ||
| RPY1248 | MATa, ura3-52, lys2-801, leu2-Ä1, his3-Ä200, trp1-Ä63, SPC110-GFP::TRP1, HXT1-tdTomato::HIS3, dyn1Ä::URA3 | Figure 2 |
| This work | ||
| RPY1302 | MATa, his3-11,15, ura3-1, leu2-3,112, ade2-1, trp1-1, pep4Ä::HIS5, prb1Ä, PAC11-13xMYC-TRP1, PGAL1-ZZ-Tev-DYN1331kDa, pac1Ä::HygroR | Figures 1,3 |
| This work | ||
| RPY1400 | MATa, his3-11,15, ura3-1, leu2-3,112, ade2-1, trp1-1, pep4Ä::HIS5, prb1Ä, PAC11-13xMYC-TRP1, PGAL1-ZZ-Tev-GFP-3xHA-DYN1331kDa-L2441ybbR, pac1Ä::HygroR | Figure 3, Figure 3—figure supplement 1 |
| This work | ||
| RPY1422 | MATa, his3-11,15, ura3-52, leu2-3,112, ade2-1, trp1-1, pep4Ä::HIS5, prb1Ä, PGAL1-ZZ-Tev-GFP-3xHA-DYN1314kDa-gs-DHA, pac1Ä::HygroR | Figures 4,5, Figure 4—figure supplement 1, Figure 5—figure supplement 1 |
| This work | ||
| RPY1436 | MATa, his3-11,15, ura3-52, leu2-3,112, ade2-1, trp1-1, pep4Ä::HIS5, prb1Ä, PAC11-13xMYC-TRP1, PGAL1-ZZ-Tev- DYN1314kDa, pac1Ä::HygroR | Figure 5 |
| This work | ||
| RPY1439 | MATa, his3-11,15, ura3-1, leu2-3,112, ade2-1, trp1-1, pep4Ä::HIS5, prb1Ä, PGAL1-ZZ-Tev-GFP-3xHA-GST-DYN1314 kDa-gs-DHA-KanR, pac1Ä:URA3, ndl1Ä::cgLEU2 | Figure 5—figure supplement 1 |
| This work | ||
| RPY1509 | MATa, his3-11,15, ura3-1, leu2-3,112, ade2-1, trp1-1, pep4Ä::HIS5, prb1Ä, PAC11-13xMYC-TRP1, PGAL1-ZZ-Tev-DYN1331kDa-gs-DHA-KanR, pac1Ä::HygroR | Figure 5—figure supplement 1 |
| This work | ||
| RPY1510 | MATa, his3-11,15, ura3-1, leu2-3,112, ade2-1, trp1-1, pep4Ä::HIS5, prb1Ä, PAC11-13xMYC-TRP1, PGAL1-ZZ-Tev-DYN1314kDa-gs-DHA-KanR, pac1Ä::HygroR | Figure 5—figure supplement 1 |
| This work | ||
| RPY1523 | MATa, ura3-52, lys2-801, leu2-Ä1, his3-Ä200, trp1-Ä3, SPC110-GFP::TRP1, HXT1-tdTomato::HIS3, pac1Ä::URA3 | Figure 2 |
| This work | ||
| RPY1524 | MATa, ura3-52, lys2-801, leu2-Ä1, his3-Ä200, trp1-Ä63, SPC110-GFP::TRP1, HXT1-tdTomato::HIS3, PAC1R378A | Figure 2 |
| This work | ||
| RPY1525 | MATa, ura3-52, lys2-801, leu2-Ä1, his3-Ä200, trp1-Ä63, SPC110-GFP::TRP1, HXT1-tdTomato::HIS3, PAC1R275A,R301A,R378A,W419A,K437A | Figure 2 |
| This work | ||
| RPY1543 | MATa, his3-11,15, ura3-1, leu2-3,112, ade2-1, trp1-1, pep4Ä::HIS5, prb1Ä, PGAL1-ZZ-Tev-PAC1R275A, dyn1Ä::cgLEU2, ndl1Ä::HygroR | Figure 2—figure supplement 1 |
| This work | ||
| RPY1544 | MATa, his3-11,15, ura3-1, leu2-3,112, ade2-1, trp1-1, pep4Ä::HIS5, prb1Ä, PGAL1-ZZ-Tev-PAC1R378A, dyn1Ä::cgLEU2, ndl1Ä::HygroR | Figure 2, Figure 2—figure supplement 1,2 |
| This work | ||
| RPY1545 | MATa, his3-11,15, ura3-1, leu2-3,112, ade2-1, trp1-1, pep4Ä::HIS5, prb1Ä, PGAL1-ZZ-Tev-PAC1W419A, dyn1Ä::cgLEU2, ndl1Ä::HygroR | Figure 2—figure supplement 1 |
| This work | ||
| RPY1546 | MATa, his3-11,15, ura3-1, leu2-3,112, ade2-1, trp1-1, pep4Ä::HIS5, prb1Ä, PGAL1-ZZ-Tev-PAC1K437A, dyn1Ä::cgLEU2, ndl1Ä::HygroR | Figure 2—figure supplement 1 |
| This work | ||
| RPY1547 | MATa, his3-11,15, ura3-1, leu2-3,112, ade2-1, trp1-1, pep4Ä::HIS5, prb1Ä, PGAL1-ZZ-Tev-PAC1 R275A,R301A,R378A,W419A,K437A, dyn1Ä::cgLEU2, ndl1Ä::HygroR | Figure 2, Figure 2—figure supplement 1,2 |
| This work | ||
| RPY1548 | MATa, his3-11,15, ura3-1, leu2-3,112, ade2-1, trp1-1, pep4Ä::HIS5, prb1Ä, PGAL1-ZZ-Tev-PAC1R301A, dyn1Ä::cgLEU2, ndl1Ä::HygroR | Figure 2—figure supplement 1 |
| This work | ||
| RPY1553 | MATa, his3-11,15, ura3-1, leu2-3,112, ade2-1, trp1-1, pep4Ä::HIS5, prb1Ä, PAC11-13xMYC-TRP1, PGAL1-ZZ-Tev-GFP-3xHA-DYN1331kDaE1849Q, pac1Ä::HygroR | Figure 4, Figure 4—figure supplement 1 |
| This work | ||
| RPY1554 | MATa, his3-11,15, ura3-1, leu2-3,112, ade2-1, trp1-1, pep4Ä::HIS5, prb1Ä, PAC11-13xMYC-TRP1, PGAL1-ZZ-Tev-GFP-3xHA-DYN1331kDaE2819Q, pac1Ä::HygroR | Figure 4, Figure 4—figure supplement 1 |
| This work | ||
| RPY1555 | MATa, his3-11,15, ura3-52, leu2-3,112, ade2-1, trp1-1, pep4Ä::HIS5, prb1Ä, PGAL1-ZZ-Tev-GFP-3xHA-DYN1314kDaK3438E,R3445E,F3446D-gs-DHA, pac1Ä::HygroR | Figure 4—figure supplement 1, Figure 5—figure supplement 1 |
| This work | ||
| RPY1557 | MATa, his3-11,15, ura3-1, leu2-3,112, ade2-1, trp1-1, pep4Ä::HIS5, prb1Ä, PAC11-13xMYC-TRP1, PGAL1-ZZ-Tev-GFP-3xHA-DYN1331kDaK3438E,R3445E,F3446D-gs-DHA-KanR, pac1Ä::HygroR | Figure 4, Figure 4—figure supplement 1 |
| This work | ||
| RPY1623 | MATa, his3-11,15, ura3-1, leu2-3,112, ade2-1, trp1-1, pep4Ä::HIS5, prb1Ä, PGAL1-ZZ-Tev-GFP-3xHA-GST- DYN1331kDaR2857A,N2858A,K2859A,R2861A,S2862A-gs-DHA, pac1Ä::URA3, ndl1Ä::cgLEU2 | Figure 1—figure supplement 2 |
| This work |
-
DYN1, PAC11, PAC1, and NDL1 encode the dynein heavy chain, dynein intermediate chain, Lis1 and Nudel orthologs, respectively. DHA, SNAP, and ybbR refer to the HaloTag (Promega), SNAP-tag (NEB), and ybbR tag (Yin et al., 2005), respectively. TEV indicates a Tev protease cleavage site. PGAL1 denotes the galactose promoter, which was used for inducing strong expression of Lis1 and dynein motor domain constructs. Genes encoding proteases Pep4 and Prb1 were deleted as noted. Amino acid spacers are indicated by g (glycine), ga (glycine-alanine), and gs (glycine-serine).
Table 2
Dynein:Lis1 ratios in complexes purified by size-exclusion chromatography
| GST-dynein331kDa | Lis1 | Lis1 (normalized to WT ratio) | |
|---|---|---|---|
| WT Lis1 | 0.82 ± 0.01 | 0.18 ± 0.01 | 1.00 |
| Lis1R275A | 0.85 ± 0.01 | 0.15 ± 0.01 | 0.80 |
| Lis1R301A | 0.88 ± 0.01 | 0.12 ± 0.01 | 0.62 |
| Lis1R378A | 1.00 ± 0.00 | 0.00 ± 0.00 | 0.00 |
| Lis1W419A | 1.00 ± 0.00 | 0.00 ± 0.00 | 0.00 |
| Lis1K437A | 0.85 ± 0.01 | 0.15 ± 0.01 | 0.80 |
| Lis15A | 1.00 ± 0.00 | 0.00 ± 0.00 | 0.00 |
-
In relation to Figure 2 and Figure 2—figure supplement 1. Fractions were run on SDS-PAGE, stained with SYPRO red, and the bands corresponding to GST-dynein331kDa and wild-type/mutant Lis1 were quantified using ImageJ. The quantification was done using three adjacent lanes corresponding to the peak from size-exclusion. Values are averages of the three lanes ± SD. The ratio for each mutant normalized against that of wild-type Lis1 is also shown.
Table 3
ATPase assay rate measurements
| Sample | Km(MT)(ìM) | kbasal(Motor domain−1.s−1) | kcat(Motor domain−1.s−1) |
|---|---|---|---|
| Full-length linker | 1.06 ± 0.16 | 3.51 ± 0.31 | 16.75 ± 0.49 |
| +Lis1 | 1.09 ± 0.20 | 4.36 ± 0.30 | 15.06 ± 0.49 |
| Short linker | 0.92 ± 0.10 | 4.45 ± 0.22 | 16.98 ± 0.32 |
| +Lis1 | 2.05 ± 0.44 | 7.14 ± 0.21 | 16.12 ± 0.61 |
| Full-length linker, AAA4 ATPase mutant (E2819Q) | 1.55 ± 0.14 | 4.53 ± 0.17 | 18.80 ± 0.38 |
| +Lis1 | 1.10 ± 0.15 | 4.60 ± 0.19 | 13.93 ± 0.31 |
-
Data were fit to the following equation: kobs = (kcat − kbasal) − [MT]/(Km(MT) + [MT]) + kbasal. Km(MT) is the microtubule concentration that gives half-maximal activation. Values are the averages of triplicate readings ± SE of the fit.
Download links
A two-part list of links to download the article, or parts of the article, in various formats.
Downloads (link to download the article as PDF)
Open citations (links to open the citations from this article in various online reference manager services)
Cite this article (links to download the citations from this article in formats compatible with various reference manager tools)
Lis1 regulates dynein by sterically blocking its mechanochemical cycle
eLife 3:e03372.
https://doi.org/10.7554/eLife.03372


