Synthetic CpG islands reveal DNA sequence determinants of chromatin structure
- University of Edinburgh, United Kingdom
- Technische Universitaet Dresden, Germany
Figures
Figure 1 with 2 supplements
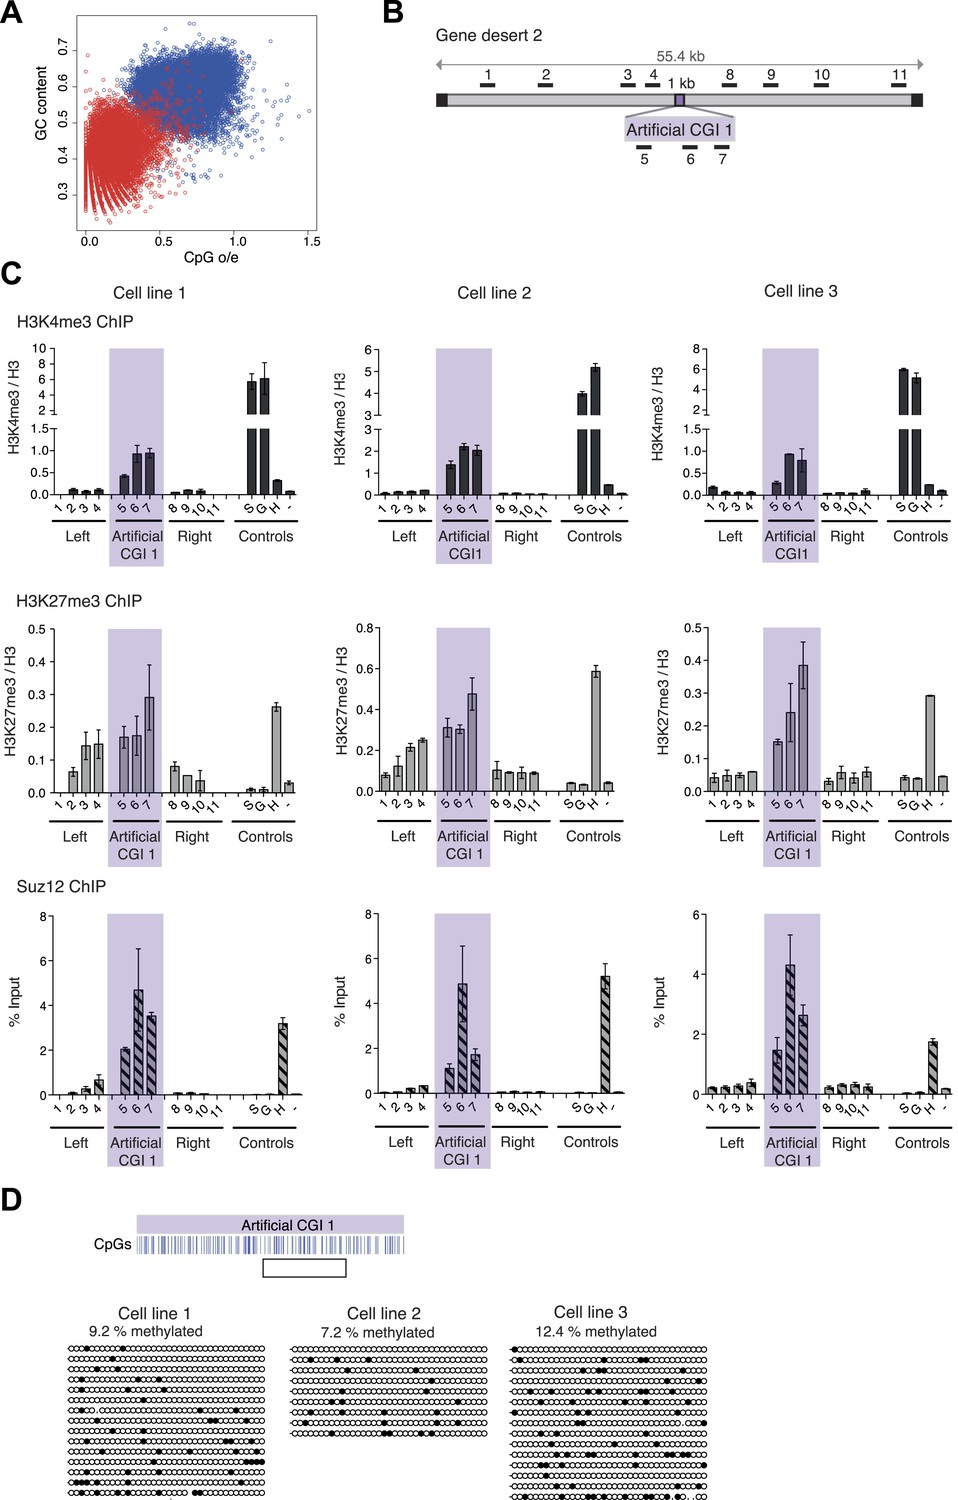
A novel bivalent chromatin domain is formed at promoter-less artificial CGI-like sequences integrated within a gene desert in mouse ESCs.
(A) CpG frequency and G + C content of CGIs in the mouse genome (blue circles) and an equivalent number of equal-sized (1000 base pair) random fragments of bulk genomic DNA (red circles). (B) Map of human gene desert 2 (grey bars; Chr1:81,106,616-81,153,886) showing the integration site of the Artificial CGI-like construct (purple box). Black boxes at the ends indicate bacterial BAC sequences. Black bars above indicate the position of Q-PCR amplicons (not to scale). (C) Representative anti-H3K4me3 and H3K27me3 ChIP profiles (normalized to H3 ChIP) and Suz12 ChIP profiles (% Input; n = 3) for three independently transfected cell lines. Shaded box includes primers spanning the Artificial CGI. ChIP control amplicons are derived from the TSS of the active genes Sox2 (S) and GAPDH (G); the TSS of bivalent gene Hoxc8 (H) and an inconspicuous negative control region on mouse chromosome 15 (−). Error bars indicate the standard deviation of PCR replicates. (D) Bisulfite sequencing of the three cell lines shown in (C). In the map above, blue strokes show CpGs in the CGI-like insert and the clear box indicates the bisulfite amplicon. Methylated and unmethylated CpGs are depicted as filled and open circles, respectively.
-
Figure 1—source data 1
Table showing properties of constructs used in these studies, including length, base composition and CpG frequency (observed over expected CpG ratio; o/e) of all tested constructs. Note that the o/e ratio takes the overall G + C content into account and therefore the High CpG/ Low G + C sequences have a high o/e ratio.
- https://doi.org/10.7554/eLife.03397.004
Figure 1—figure supplement 1
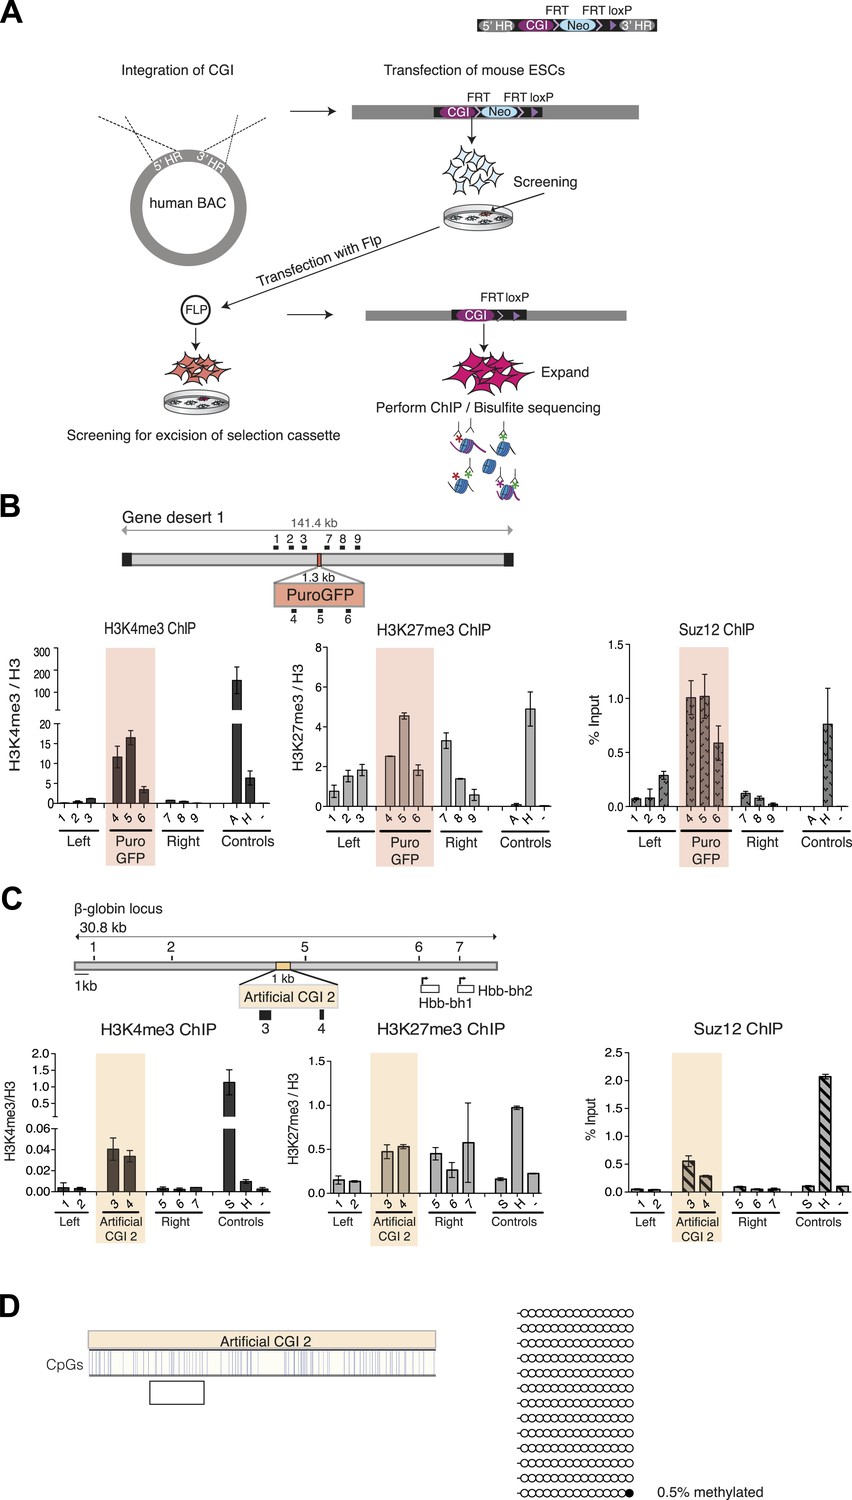
Bivalent chromatin at artificial CGI-like sequences in mouse ESCs.
Schematic representation of the experimental protocol for insertion of artificial CGIs into the mouse ESC genome. A linearized plasmid containing the CGI like sequence, a selection cassette flanked by FRT sites, a single LoxP site and 5′ and 3′ homology regions were integrated into a human gene desert within a BAC via recombineering. The linearized BAC was then transfected into mouse ESCs. Colonies containing the BAC were screened for clones with low copy number integration and transfected with Flp to excise the selection cassette. Successful excision was confirmed by PCR and Southern blotting. Selected clones were used for analysis of chromatin modification and DNA methylation. (B) Diagram above shows the CGI like sequence PuroGFP integrated into a human gene desert 1 (mChr18:36,042,881-36,175,341) and the position of primer pairs used for ChIP (not to scale). Representative H3K4me3, H3K27me3 and Suz12 ChIP qPCR experiments (n = 2). The shaded box includes primers spanning the PuroGFP construct. (C) Diagram above indicates the mouse ß-globin locus showing the integration site of the Artificial CGI 2 construct. Black bars indicate position of primers used for qPCR. H3K4me3, H3K27me3 and Suz12 ChIP analysis are shown for a representative cell line (data for 2 other cell lines not shown). Shading indicates primers spanning the Artificial CGI 2. (D) Bisulfite sequencing of the Artificial CGI 2 construct. In the map above, blue strokes show CpGs in the CGI-like insert and the clear box indicates the bisulfite amplicon. Methylated and unmethylated CpGs are depicted as filled and open circles, respectively. ChIP control amplicons as described in Figure 1C but including the TSS of the active gene ß-actin. Error bars indicate standard deviation of PCR replicates.
Figure 1—figure supplement 2
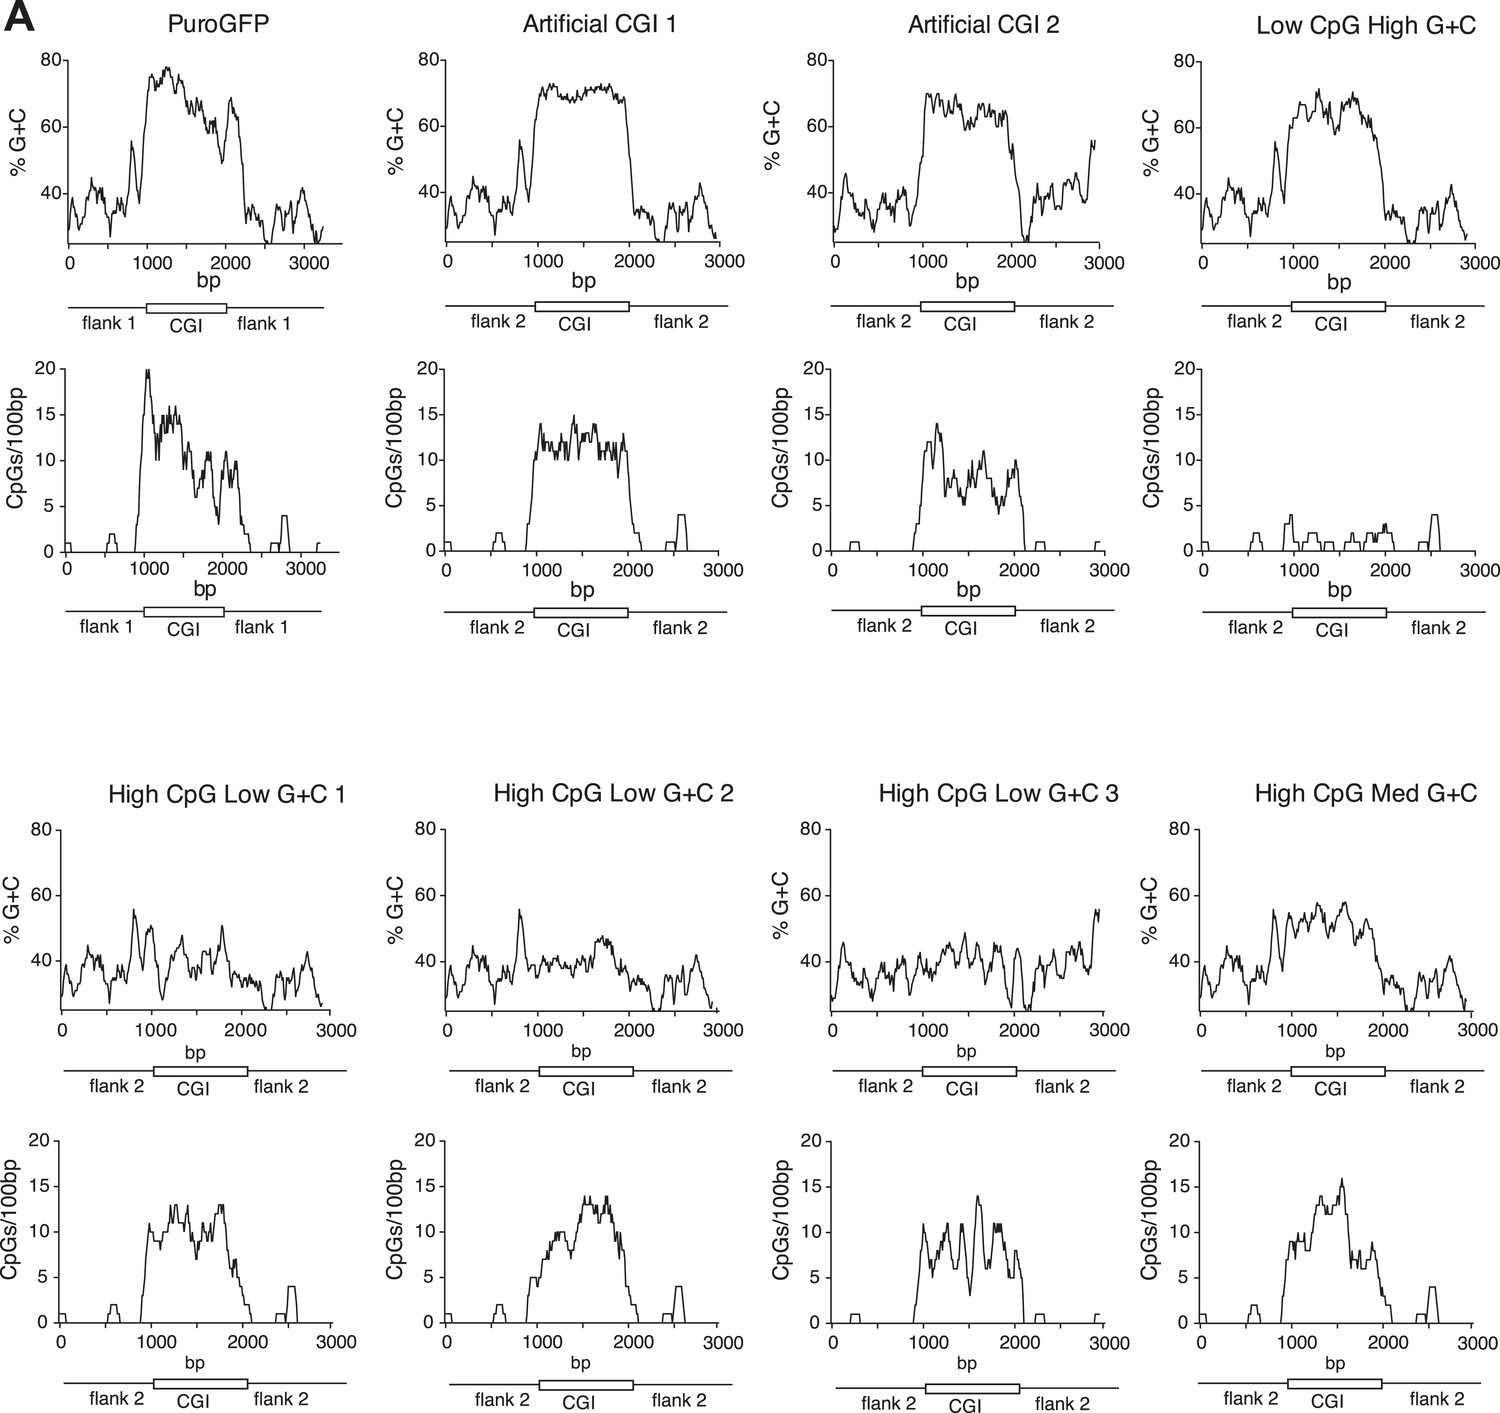
Synthetic DNA elements with different sequence properties.
(A) Sequence profiles of CGI-like constructs flanked on either side by 1 kb of human gene desert. Upper panels: % G + C plots; lower panels: CpGs-per-100 bp plots. X-axis length shows length in base pairs (bp).
Figure 2 with 1 supplement
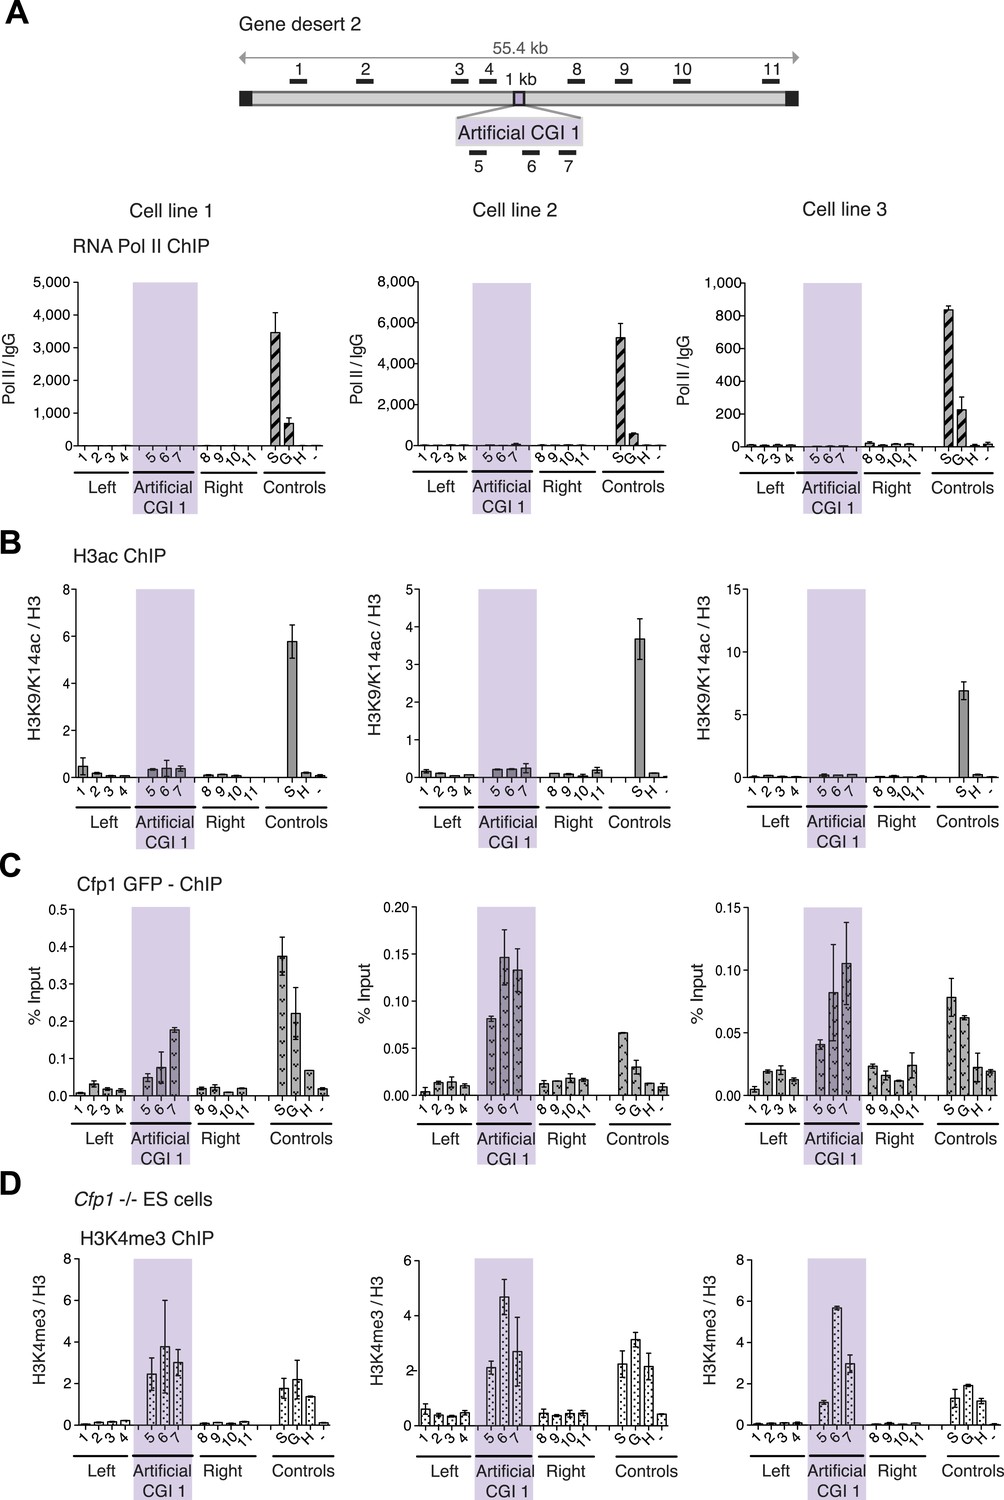
H3K4me3 at a promoter-less artificial CGI forms independently of Cfp1 and RNA polymerase II.
(A) Map of gene desert 2 with integrated Artificial CGI-like construct labeled as in Figure 1B. Representative ChIP with an antibody specific for the N-terminus of RNA polymerase II for three independent cell lines (% Input over IgG; n = 2). (B) Representative anti-H3K9/K14 acetylation ChIP profiles for three independently transfected cell lines normalized to H3 ChIP (n = 2). (C) Mouse ES cells expressing GFP-tagged Cfp1 were transfected with Artificial CGI construct and bound Cpf1 was assayed by ChIP with anti-GFP antibodies in three independent cell lines (n = 2). (D) Representative anti-H3K3me3 ChIP for three independent Cfp1−/− mouse ES cells transfected with the Artificial CGI construct (n = 2). Control ChIP amplicons are as in Figure 1C. Error bars indicate standard deviation of PCR replicates.
Figure 2—figure supplement 1
H3K4me3 at an artificial CGI independent of Cfp1 and RNA polymerase II.
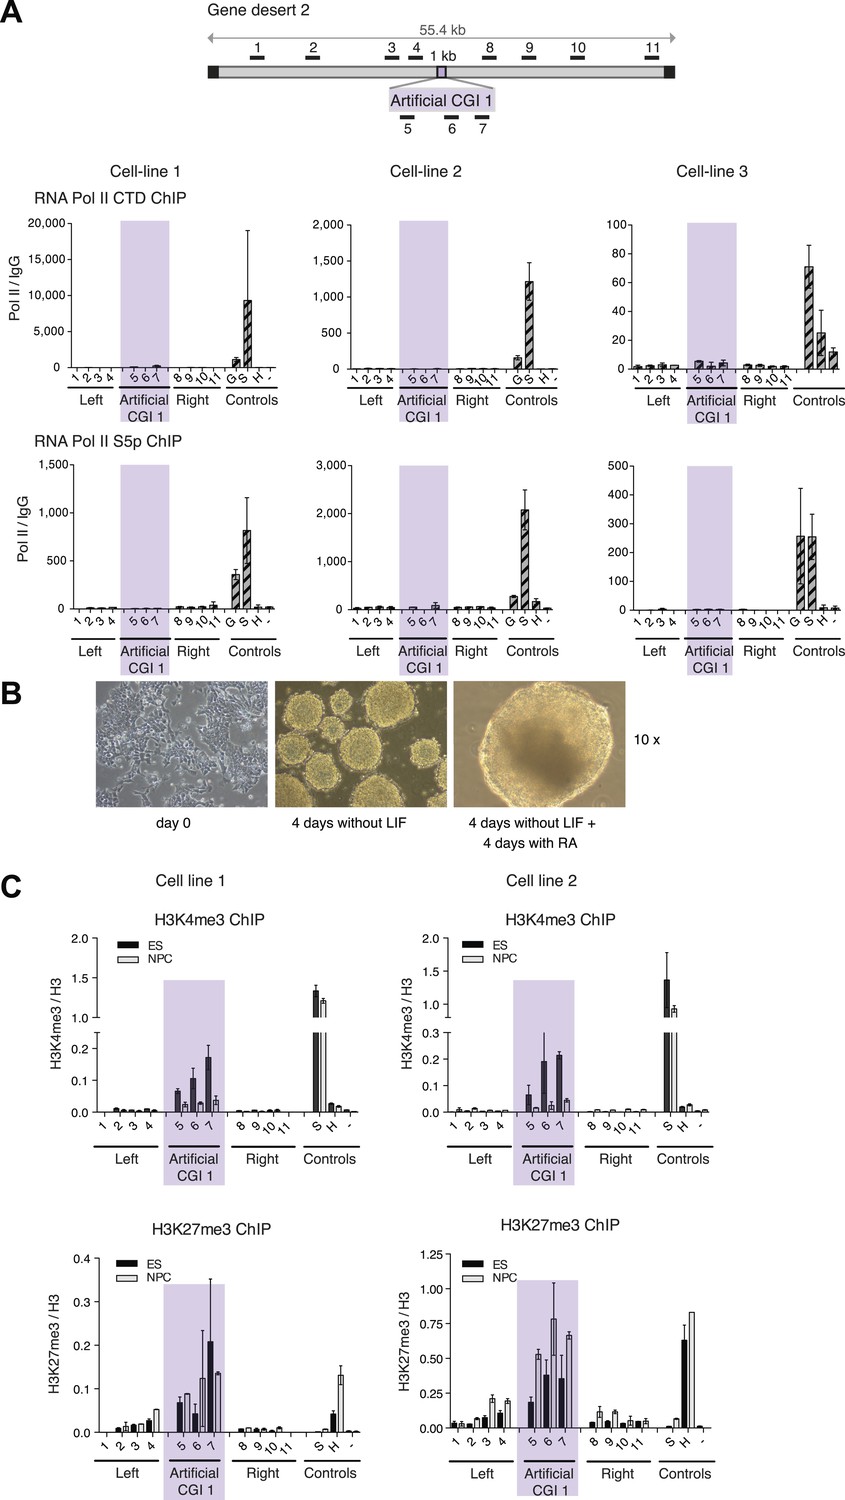
(A) Scheme above shows gene desert 2 (mChr1:81,106,616-81,153,886) with integration site of the Artificial CGI-like construct (See Figure 1B). Representative ChIP with an antibody specific for the unphosphorylated C-terminus of RNA Pol II and the Serine 5 phosphorylated C-terminus of RNA Pol II for three independent cell lines (n = 2). Shaded bar indicates primers spanning the Artificial CGI. (B) Undifferentiated mouse ES cells were cultured for 4 days without LIF and then another 4 days in the presence of retinoic acid (RA). All panels photographed at 10× magnification. (C): H3K4me3 and H3K27me3 in ESCs vs neural precursor cells for two independent cell lines (n = 2). Error bars indicate standard deviation of PCR replicates.
Figure 3
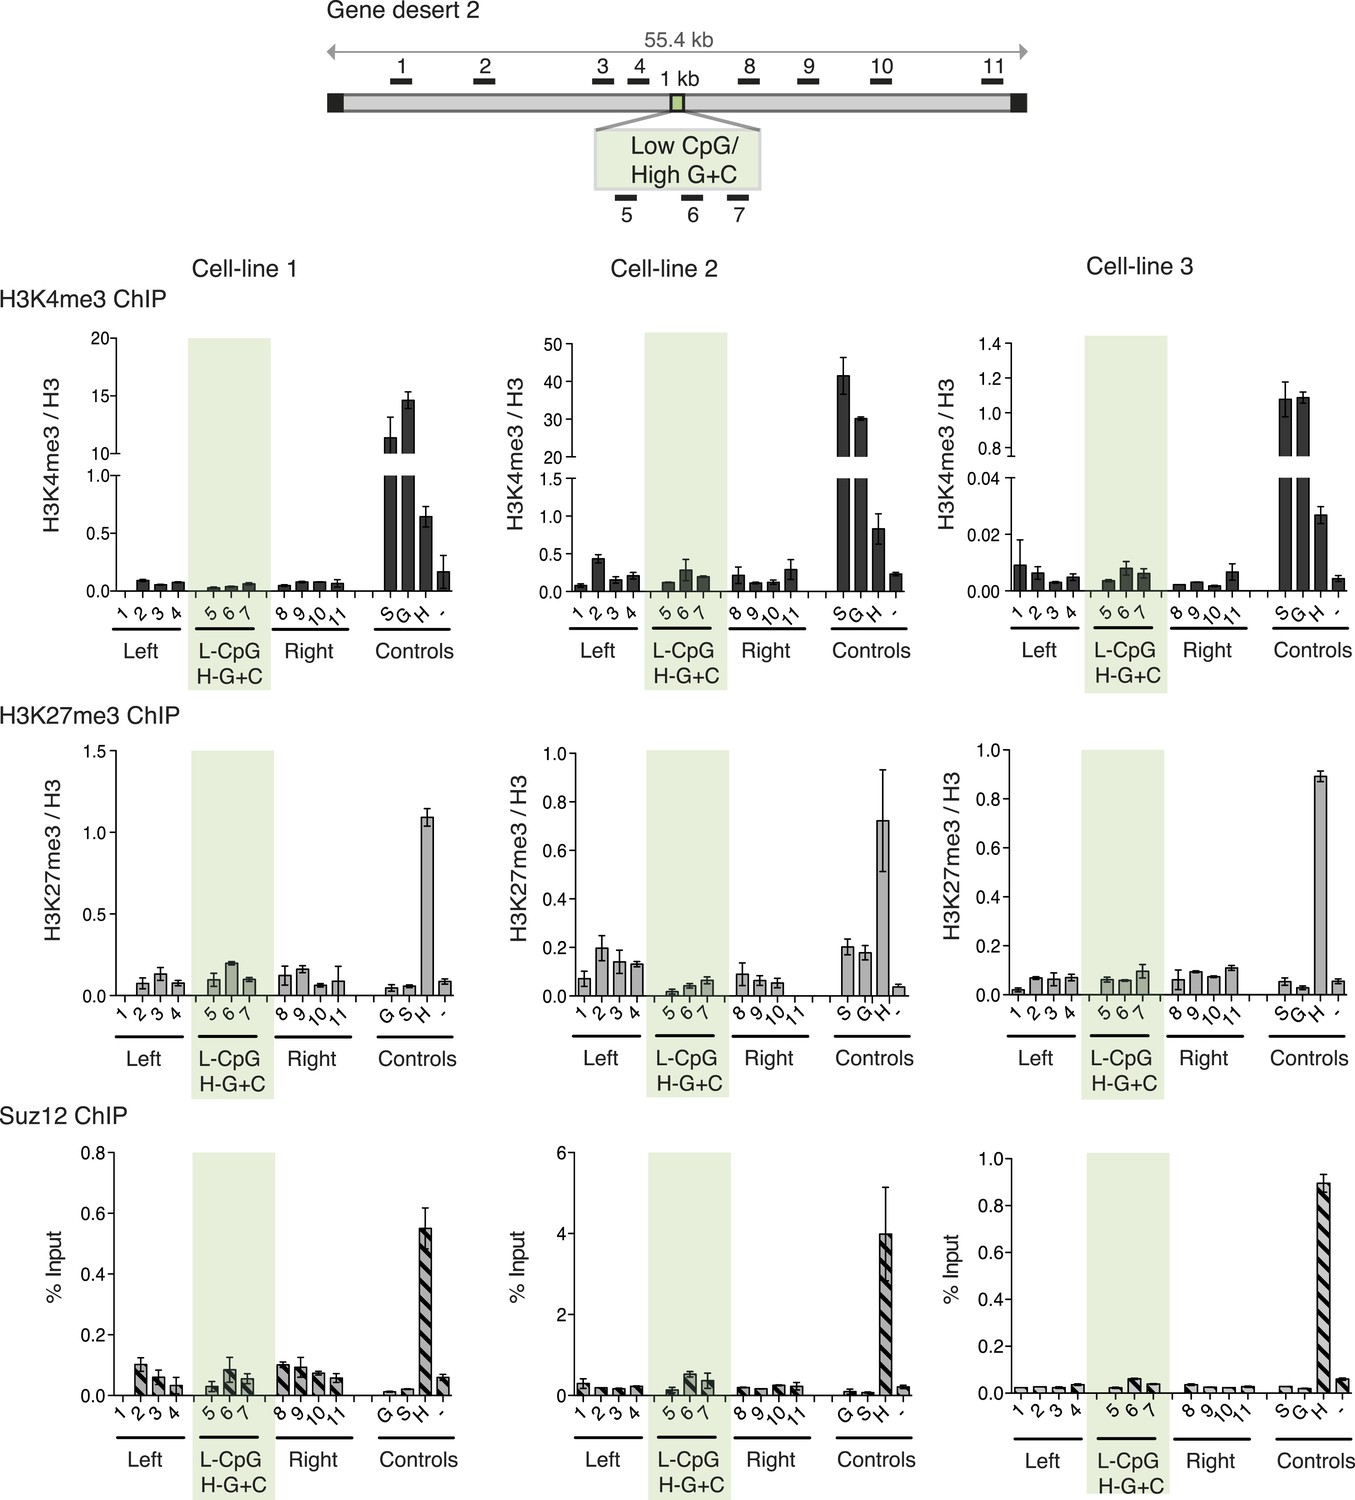
High G + C content is not sufficient to create a bivalent chromatin domain.
Map of gene desert 2 showing the integration site of the Low CpG / High G + C (L-CpG / H-G + C) construct labeled as in Figure 1B. Representative anti-H3K3me3 and H3K27me3 ChIP profiles (normalized to H3) and Suz12 ChIP profiles (% Input; n = 3) are shown for three independent transfected cell lines. Shaded bar includes primers spanning the Low CpG / High G + C construct. Control ChIP amplicons are as in Figure 1C. Error bars indicate standard deviation of PCR replicates.
Figure 4 with 3 supplements
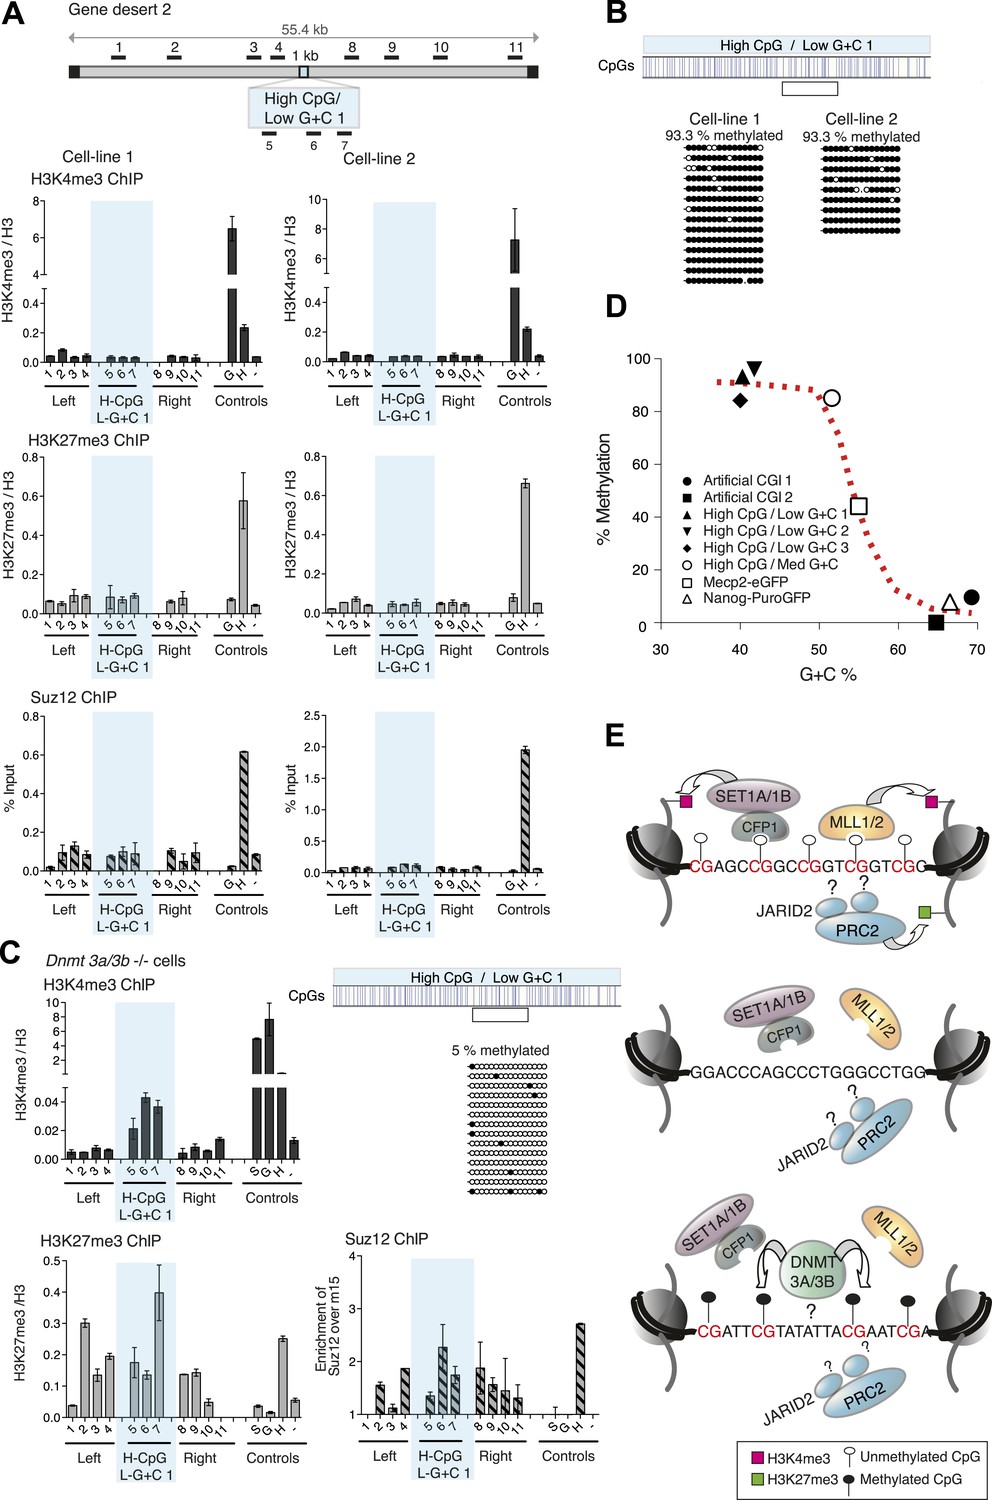
CpG-rich DNA sequences on an A + T-rich background fail to form bivalent chromatin and reproducibly acquire DNA methylation.
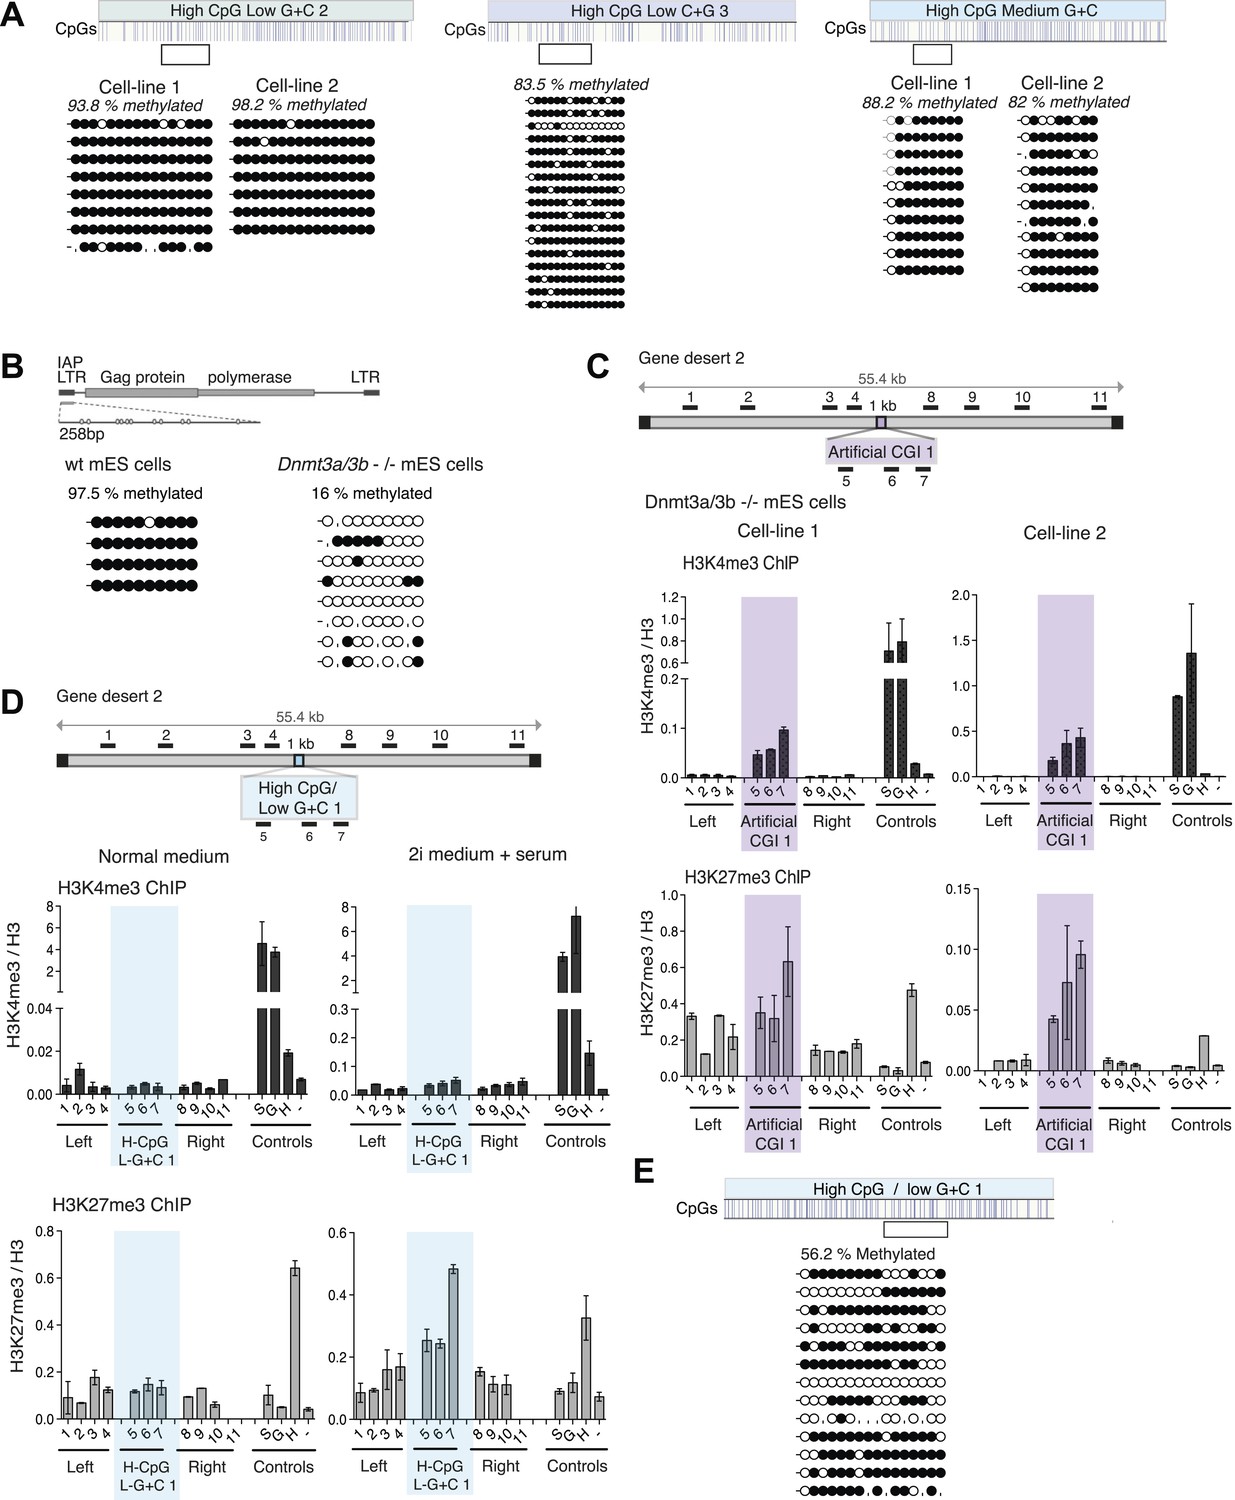
(A) Above: Map of gene desert 2 indicating the integration site of the High CpG / Low G + C 1 (H-CpG / L-G + C 1) construct as in Figure 1B. Representative anti-H3K4me3, H3K27me3 and Suz12 ChIPs shown (n = 3) for each of two independently transfected cell lines (Third line not shown). The shaded bar includes primers spanning the High CpG / Low G + C 1 construct. (B) Bisulfite sequence analysis of the two cell lines shown in (A). Clear box indicates bisulfite amplicon. In the map above, blue strokes show CpGs in the CGI-like insert and the clear box indicates the bisulfite amplicon. Methylated and unmethylated CpGs are depicted as filled and open circles, respectively. (C) The High CpG / Low G + C construct was integrated into Dnmt 3a−/− Dnmt 3b−/− double mutant mouse ES cells. Representative H3K4me3, H3K27me3 and Suz12 ChIPs are shown (n = 3). Upper right panel shows bisulfite sequence analysis of a cell line containing the High CpG / Low G + C construct in Dnmt 3a/b −/− cells, presented as in panel (B). (D) The relationship between G + C content of constructs analysed in this study and their DNA methylation status. Data for Mecp2-eGFP and Nanog-PuroGFP refer to cell lines reported previously (Thomson et al., 2010), but reanalyzed for this study. (E) Diagrams depicting the influence of CGI sequence composition on chromatin structure. Upper panel: Sequences with high CpG frequency and high C + G content attract both H3K4 and H3K27 methyltransferase to establish bivalent chromatin domains and they remain unmethylated. SET1A/1B and MLL1/2 complexes contain CXXC domains that may target H3K4me3 to CGIs. The mechanism by which the PRC2 complex is targeted is unknown. Middle panel: Without CpGs, H3K4 and K27 methyltransferases are not recruited even when the DNA is G + C-rich. Lower panel: A + T-rich DNA fails to form a bivalent chromatin structure, even when the CpG density is high and is consistently subject to de novo methylation.
Figure 4—figure supplement 1
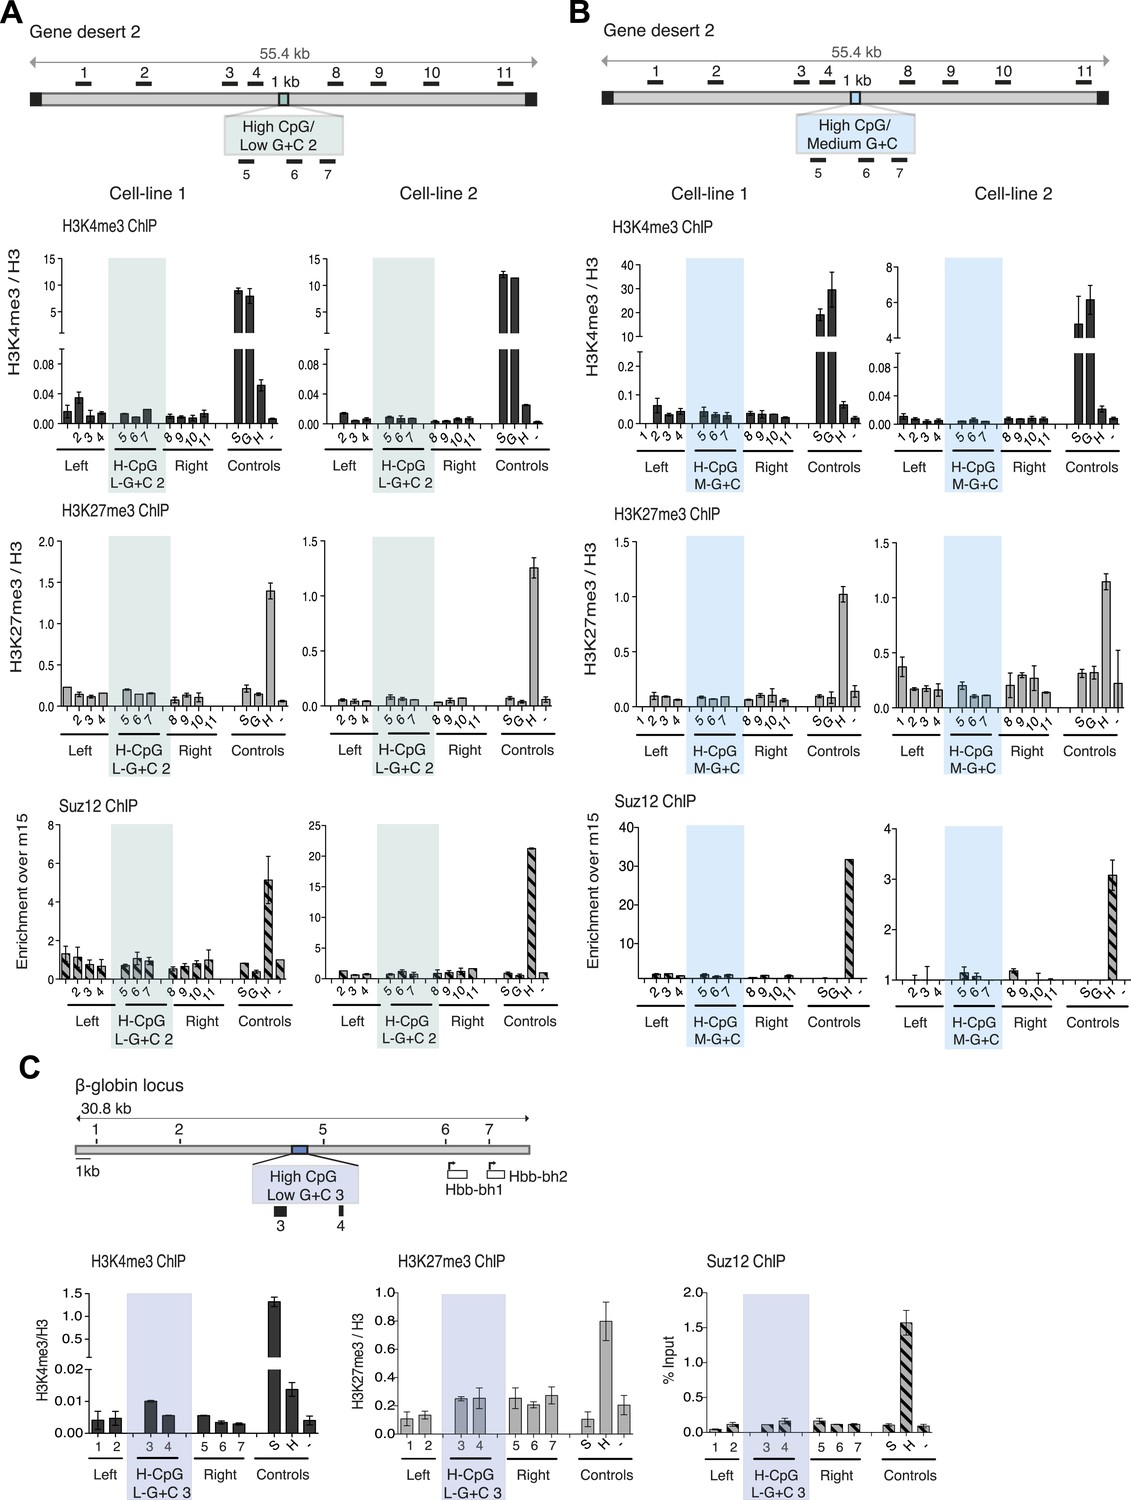
CpG-rich, A + T-rich DNA sequences do not form bivalent chromatin.s.
(A and B) Above: diagrams (See Figure 1B) of gene desert 2 with (A) inserted A + T-rich, CpG-rich construct #2 (H-CpG/L-G + C 2) and (B) medium-A + T, CpG-rich construct (H-CpG/M-G + C). Below: representative anti-H3K3me3 and H3K27me3 ChIP normalized to H3 and Suz12 ChIP shown as enrichment over the negative control region (n = 3) for two independently transfected cell lines for each construct. Shaded bars indicate primers spanning the CGI-like constructs. (C) Scheme showing the mouse ß-globin locus (See Figure 1—figure supplement 1) with integration site of the A + T-rich, CpG rich construct #3 (H-CpG/L-G + C 3) construct. Black bars indicate position of primers used for Q-PCR. Representative H3K4me3 and H3K27me3 ChIP analyses (data for cell lines 2 and 3 not shown). Shaded bar indicates primers spanning the H-CpG/L-G + C 3 construct.
Figure 4—figure supplement 2
DNA methylation at CpG-rich, A + T-rich DNA sequences blocks bivalent chromatin.
(A) Bisulfite sequence analysis of the H-CpG/L-G + C 2 and 3 and H-CpG/M-G + C constructs. Clear box indicates bisulfite amplicon and blue vertical lines show position of CpGs. Methylated CpGs are depicted as filled black circles, unmethylated CpGs as empty white circles. (B) Bisulfite sequence analysis of IAP elements in wt vs Dnmt 3a/3b knockout mouse ES cells. (C) Dnmt 3a/3b knockout cells can form bivalent chromatin when transfected with the Artificial CGI 1 (see Figure 1C). Representative H3K3me3 and H3K27me3 ChIP normalized to H3 for 2 independent cell lines. (D) Partial loss of DNA methylation causes increased H3K27me3 at the A + T-rich, CpG-rich CGI 1, but does not show elevated H3K4me3. Wt mouse ESCs were transfected and grown for 10 days in either normal medium or medium + 2i inhibitors. Representative H3K3me3 and H3K27me3 ChIP normalized to H3 shown (second cell line not shown). (E) Bisulfite sequencing of the H-CpG/L-G + C 1 after 10 days in medium +2i shows reduced DNA methylation at the inserted DNA.
Figure 4—figure supplement 3
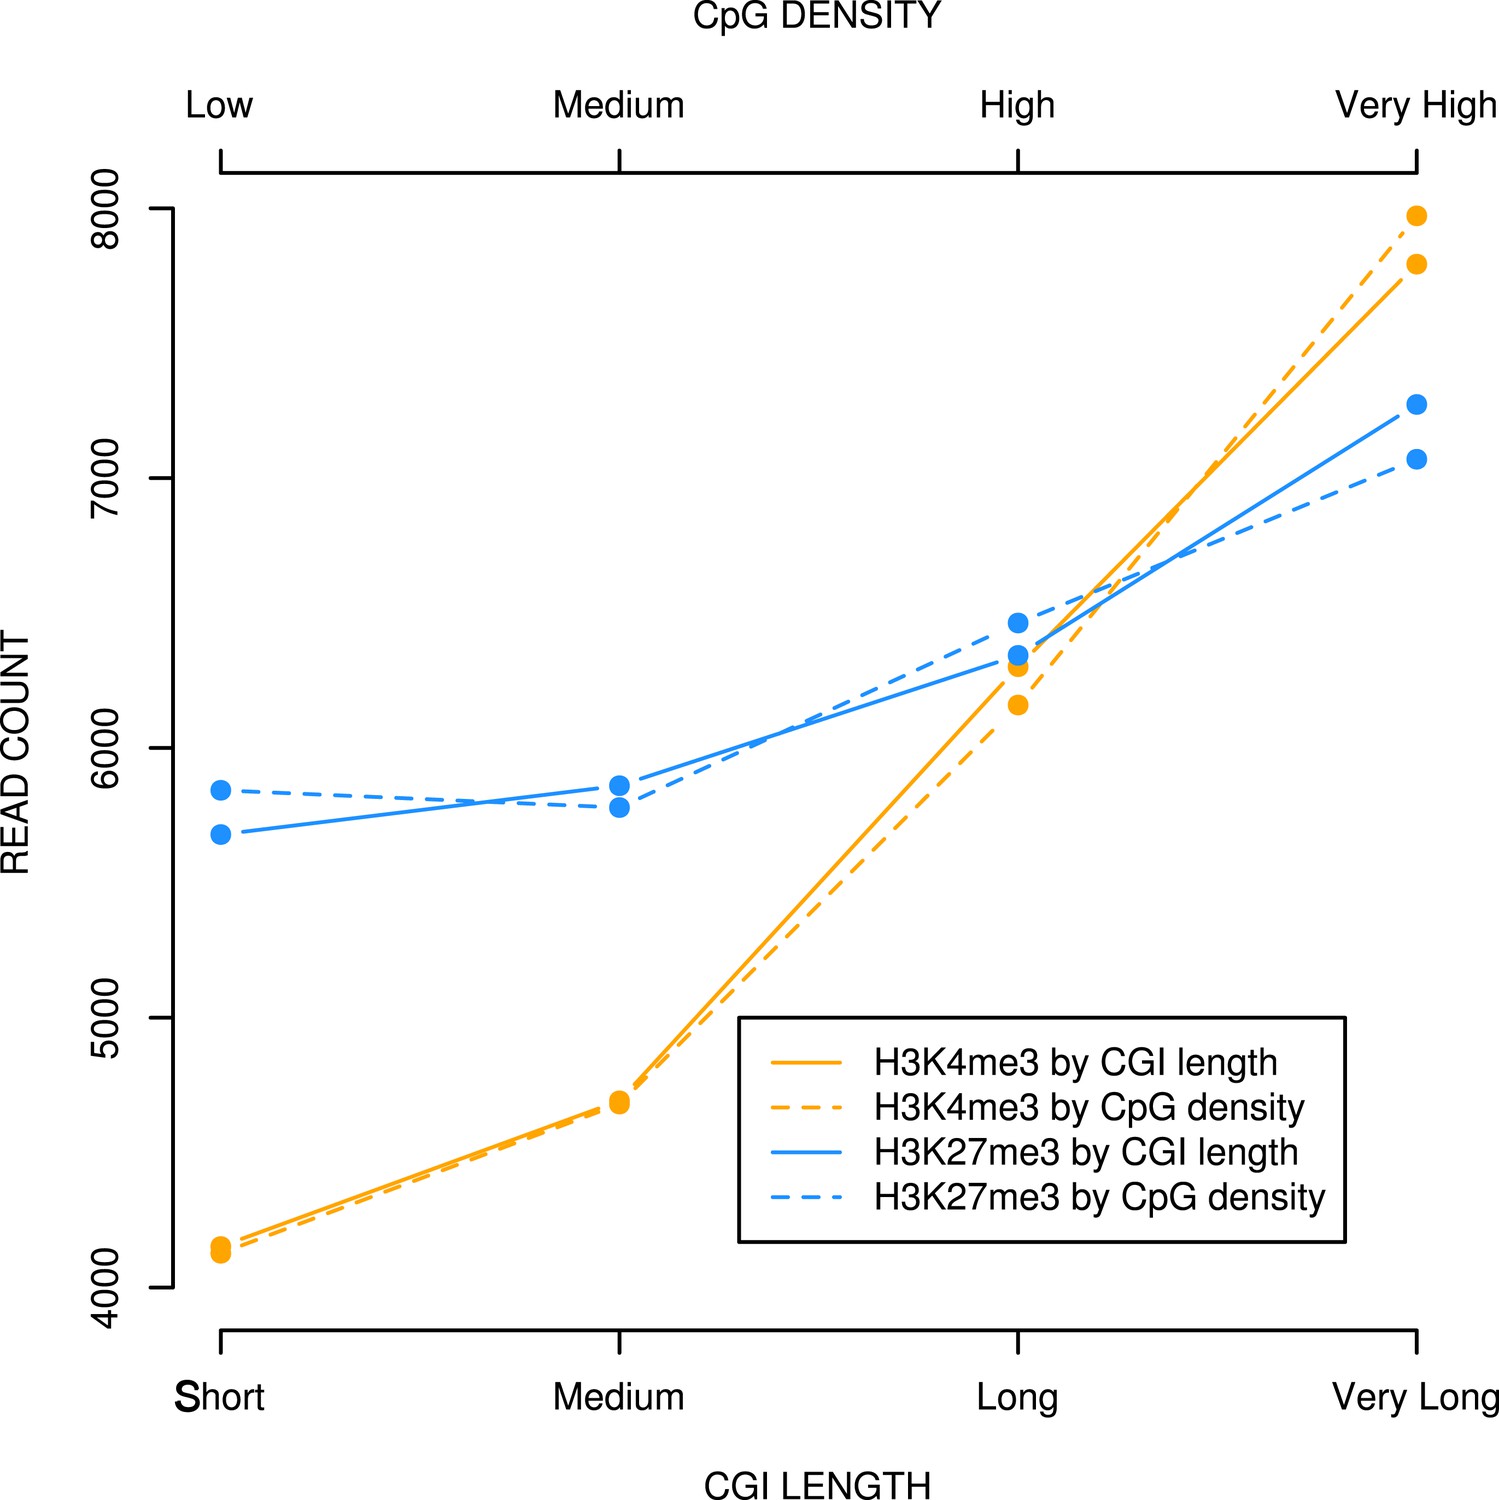
CpG density and CGI length at bivalent CGIs correlate positively with H3K4me3 and H3K27me3 levels in mouse ESCs.
Bivalent CGIs identified in published ChIPseq analyses (Denissov et al., 2014; Marks et al., 2012) were divided into four equal bins based on length or CpG density and plotted against levels of H3K4me3 or H3K27me3 (read counts).
Additional files
-
Supplementary file 1
CGI-like DNA sequences.
- https://doi.org/10.7554/eLife.03397.014
-
Supplementary file 2
Primers.
- https://doi.org/10.7554/eLife.03397.015
Download links
A two-part list of links to download the article, or parts of the article, in various formats.
Downloads (link to download the article as PDF)
Open citations (links to open the citations from this article in various online reference manager services)
Cite this article (links to download the citations from this article in formats compatible with various reference manager tools)
Synthetic CpG islands reveal DNA sequence determinants of chromatin structure
eLife 3:e03397.
https://doi.org/10.7554/eLife.03397


