Sharpin prevents skin inflammation by inhibiting TNFR1-induced keratinocyte apoptosis
- University of Cologne, Germany
- Institute of Molecular Biotechnology, Austria
- Goethe University Medical School, Germany
Figures
Figure 1
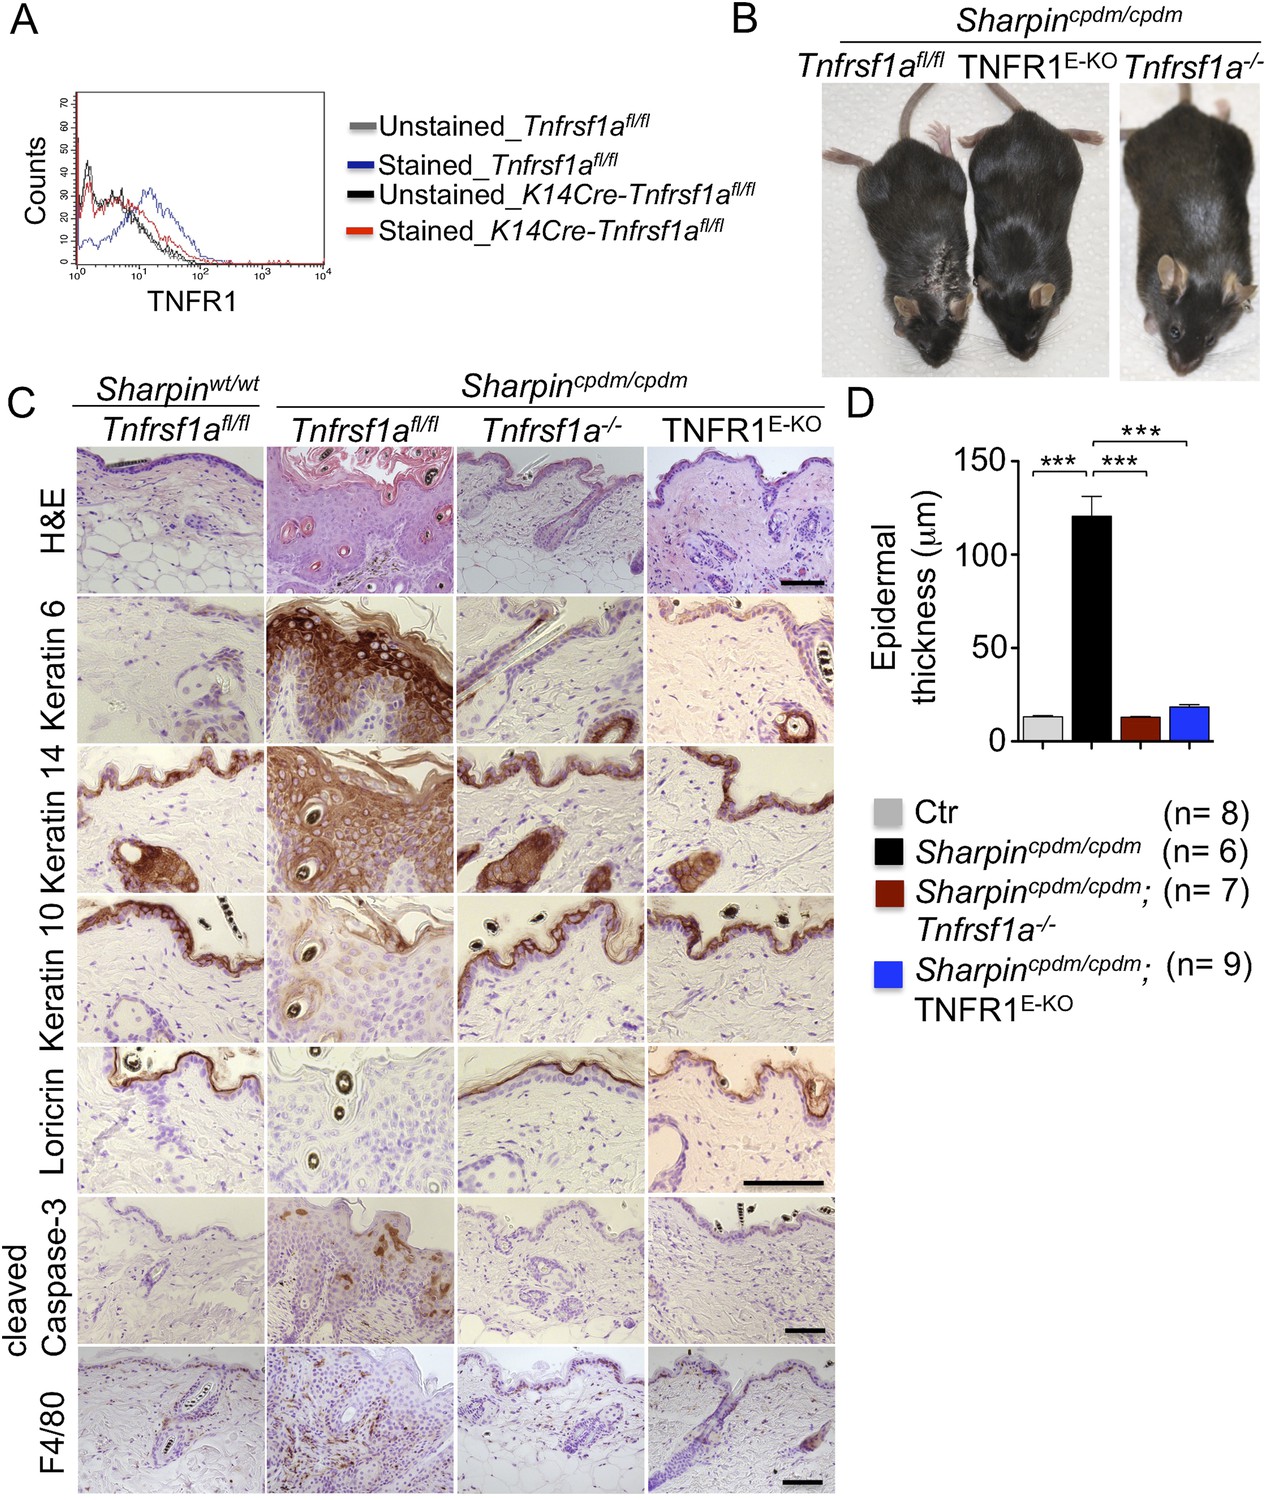
Tumor necrosis factor receptor 1 (TNFR1) signaling in keratinocytes triggers chronic proliferative dermatitis phenotype in Sharpincpdm/cpdm mice.
(A) Flow cytometric analysis of TNFR1 expression on the isolated keratinocytes from mice with the indicated genotypes. (B and C) Macroscopic pictures, Hematoxylin and Eosin staining (H&E), Keratin 6, 14, 10 and Loricrin as well as cleaved caspase-3 and F4/80 staining of the skin sections from 14-week-old littermate mice of the indicated genotypes. The scale bars are 100 μm. (D) Microscopic quantification of the epidermal thickness from 12–18-week-old mice of the indicated genotypes and their littermate controls (Ctr), which consisted of the following genotypes: Sharpincpdm/wt;Tnfrsf1a−/−, Sharpinwt/wt;Tnfrsf1a−/−, Sharpincpdm/wt;Tnfrsf1afl/fl, Sharpincpdm/wt;TNFR1E-KO, and Sharpinwt/wt;TNFR1E-KO. The Sharpincpdm/cpdm group consisted of Sharpincpdm/cpdm;Tnfrsf1afl/fl and Sharpincpdm/cpdm;Tnfrsf1afl/wt mice that were littermates of the Sharpincpdm/cpdm;TNFR1E-KO mice. The Sharpincpdm/cpdm;Tnfrsf1a−/− mice were derived from a different line and shown here is the picture and the staining from the age-matched mice. Bars represent mean values ± SEM. Statistical significance was determined using the Student's t test (***p ≤ 0.001).
Figure 2 with 1 supplement
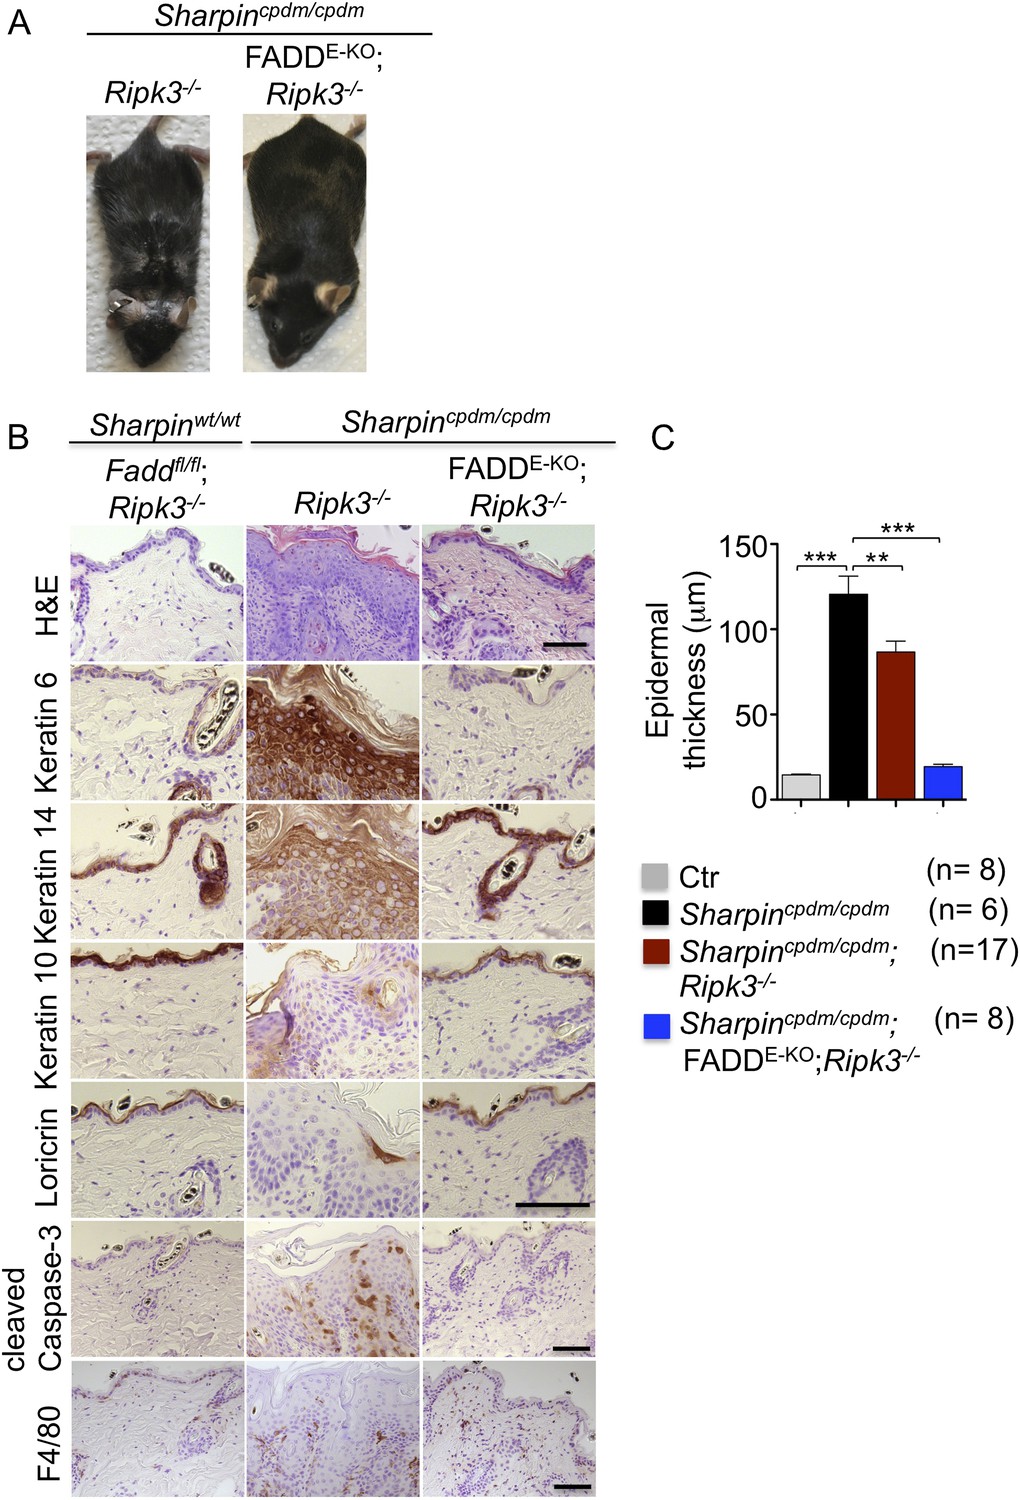
Fas-associated protein with death domain (FADD) deficiency in keratinocytes prevents skin inflammation in Sharpincpdm/cpdm mice.
(A and B) Macroscopic pictures, Hematoxylin and Eosin staining (H&E), Keratin 6, 14, 10 and Loricrin as well as cleaved caspase-3 and F4/80 staining of skin sections from 14-week-old mice of the indicated genotypes. The scale bars are 100 μm. (C) Microscopic quantification of the epidermal thickness from 12–18-week-old mice of the indicated genotypes and their littermate controls (Ctr), which consisted of the following genotypes: Sharpinwt/wt;Tnfrsf1afl/fl, Sharpincpdm/wt;Faddfl/fl;Ripk3−/−, Sharpinwt/wt;Faddfl/fl;Ripk3−/−, Sharpincpdm/wt;FADDE-KO;Ripk3−/− and Sharpinwt/wt;FADDE-KO;Ripk3−/−. The Sharpincpdm/cpdm group consisted of Sharpincpdm/cpdm;Tnfrsf1afl/fl and Sharpincpdm/cpdm;Tnfrsf1afl/wt mice that were littermates of the Sharpincpdm/cpdm;TNFR1E-KO mice. Sharpincpdm/cpdm;Ripk3−/− mice were derived from the same breeding line as Sharpincpdmcpdm;FADDE-KO;Ripk3−/− mice and consisted of the genotype Sharpincpdm/cpdm;Faddfl/fl;Ripk3−/−. Bars represent mean values ± SEM. Statistical significance was determined using the Student's t test (***p ≤ 0.001, **p ≤ 0.01).
Figure 2—figure supplement 1
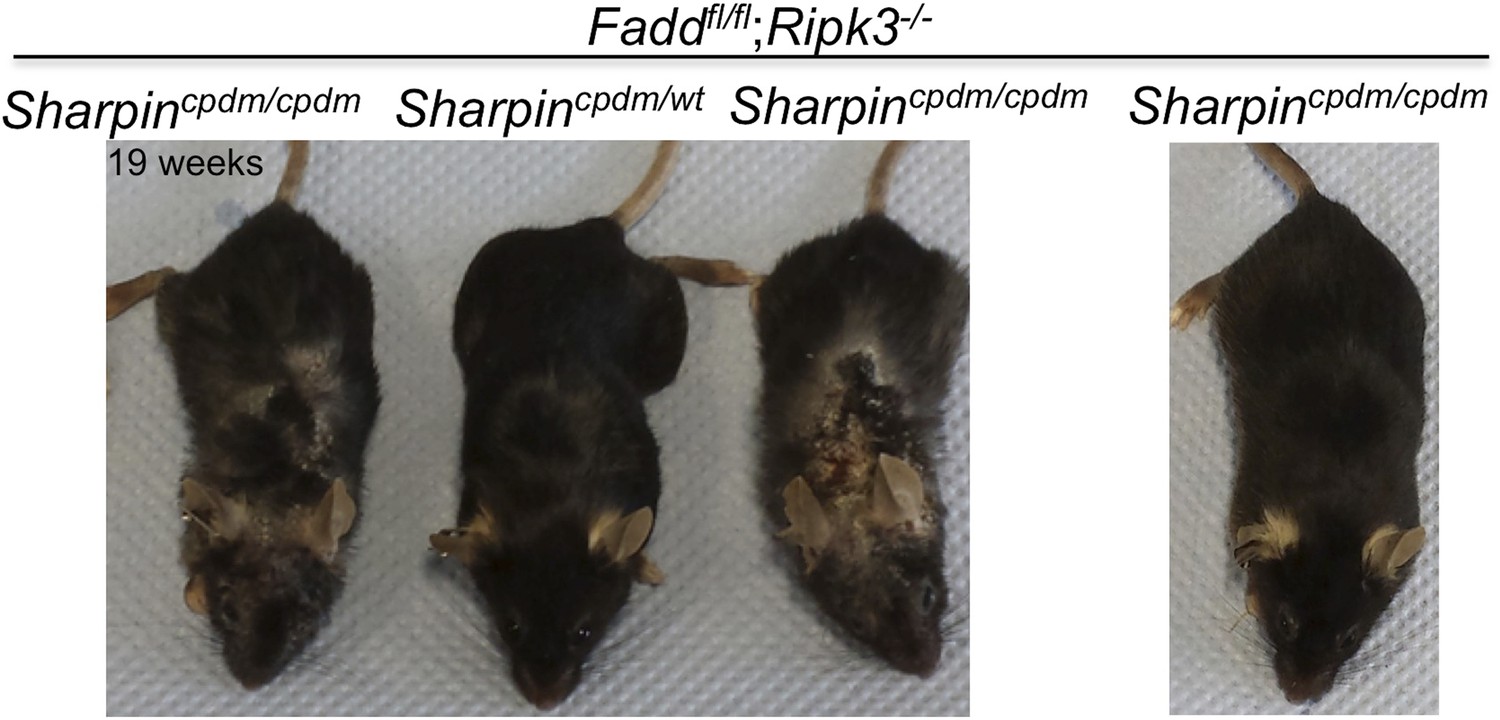
Variability among Sharpincpdm/cpdm;Ripk3−/− mice at a similar age.
The gross appearance of severe skin lesions in two Sharpincpdm/cpdm;Ripk3−/− mice at the age of 19 weeks (left) and a Sharpincpdm/cpdm;Ripk3−/− mouse at the same age with only a very mild phenotype (right).
Figure 3
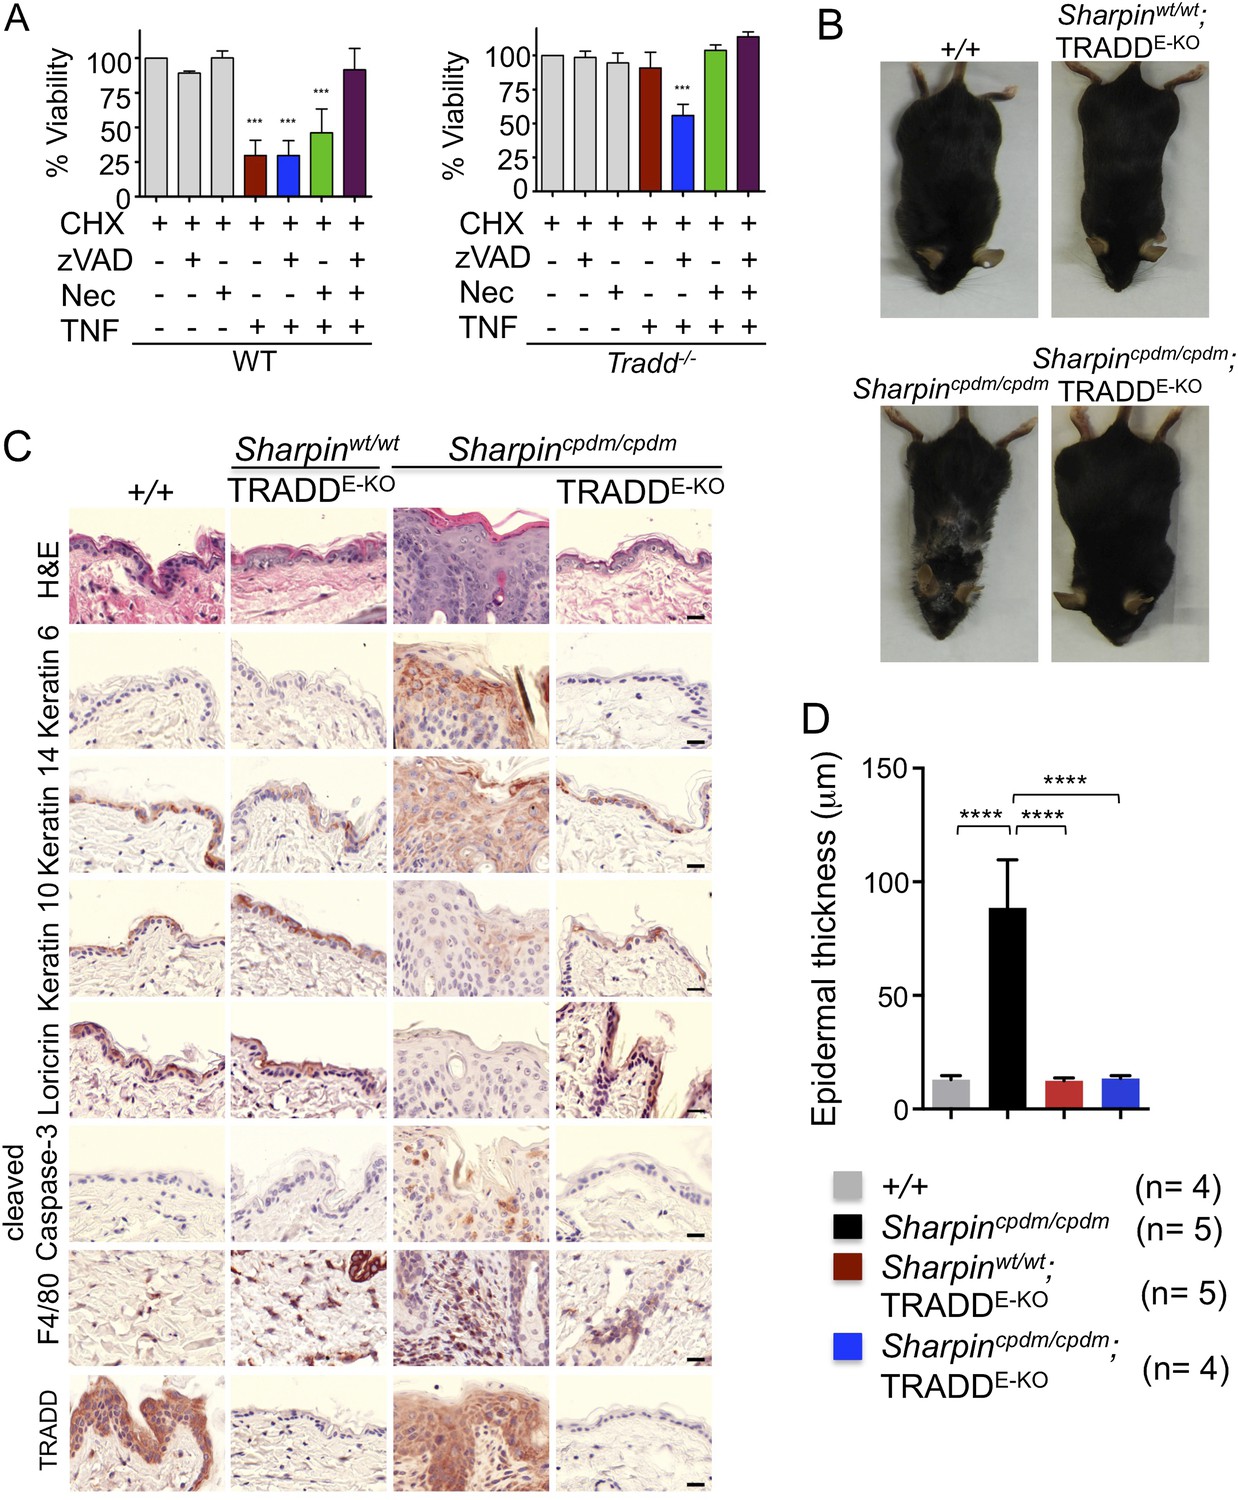
Tumor necrosis factor receptor 1-associated death domain (TRADD) deficiency in keratinocytes prevents skin inflammation in Sharpincpdm/cpdm mice.
(A) The percentage viability of wild type (WT) mouse embryonic fibroblasts (MEFs) (n = 3) and TRADD-deficient MEFs (n = 3) upon tumor necrosis factor (TNF), cycloheximide (CHX), caspase inhibitor (zVAD), and Necrostatin-1 (Nec) treatment alone or in combination for 20 hr and measurement by WST-1 assay. Bars represent average cell viability (± SD) of three independent experiments. (B and C) Macroscopic gross appearance of the WT (+/+) and littermate mice of the indicated genotype at the age of 12 weeks (B) and (H&E), Keratin 6, 14, 10 and Loricrin as well as cleaved caspase-3 and F4/80 staining of the skin sections from 12-week-old mice of the indicated genotypes (C). Scale bars in (C) are 100 μm. (D) Microscopic quantification of the epidermal thickness from 12-week-old littermate mice of Sharpincpdm/cpdm, Sharpinwt/wt;TRADDE-KO, Sharpincpdm/cpdm;TRADDE-KO and age-matched WT (+/+) is shown. Bars represent mean values ± SD. Statistical significance was determined using the one-way ANOVA test (****p ≤ 0.0001).
Figure 4
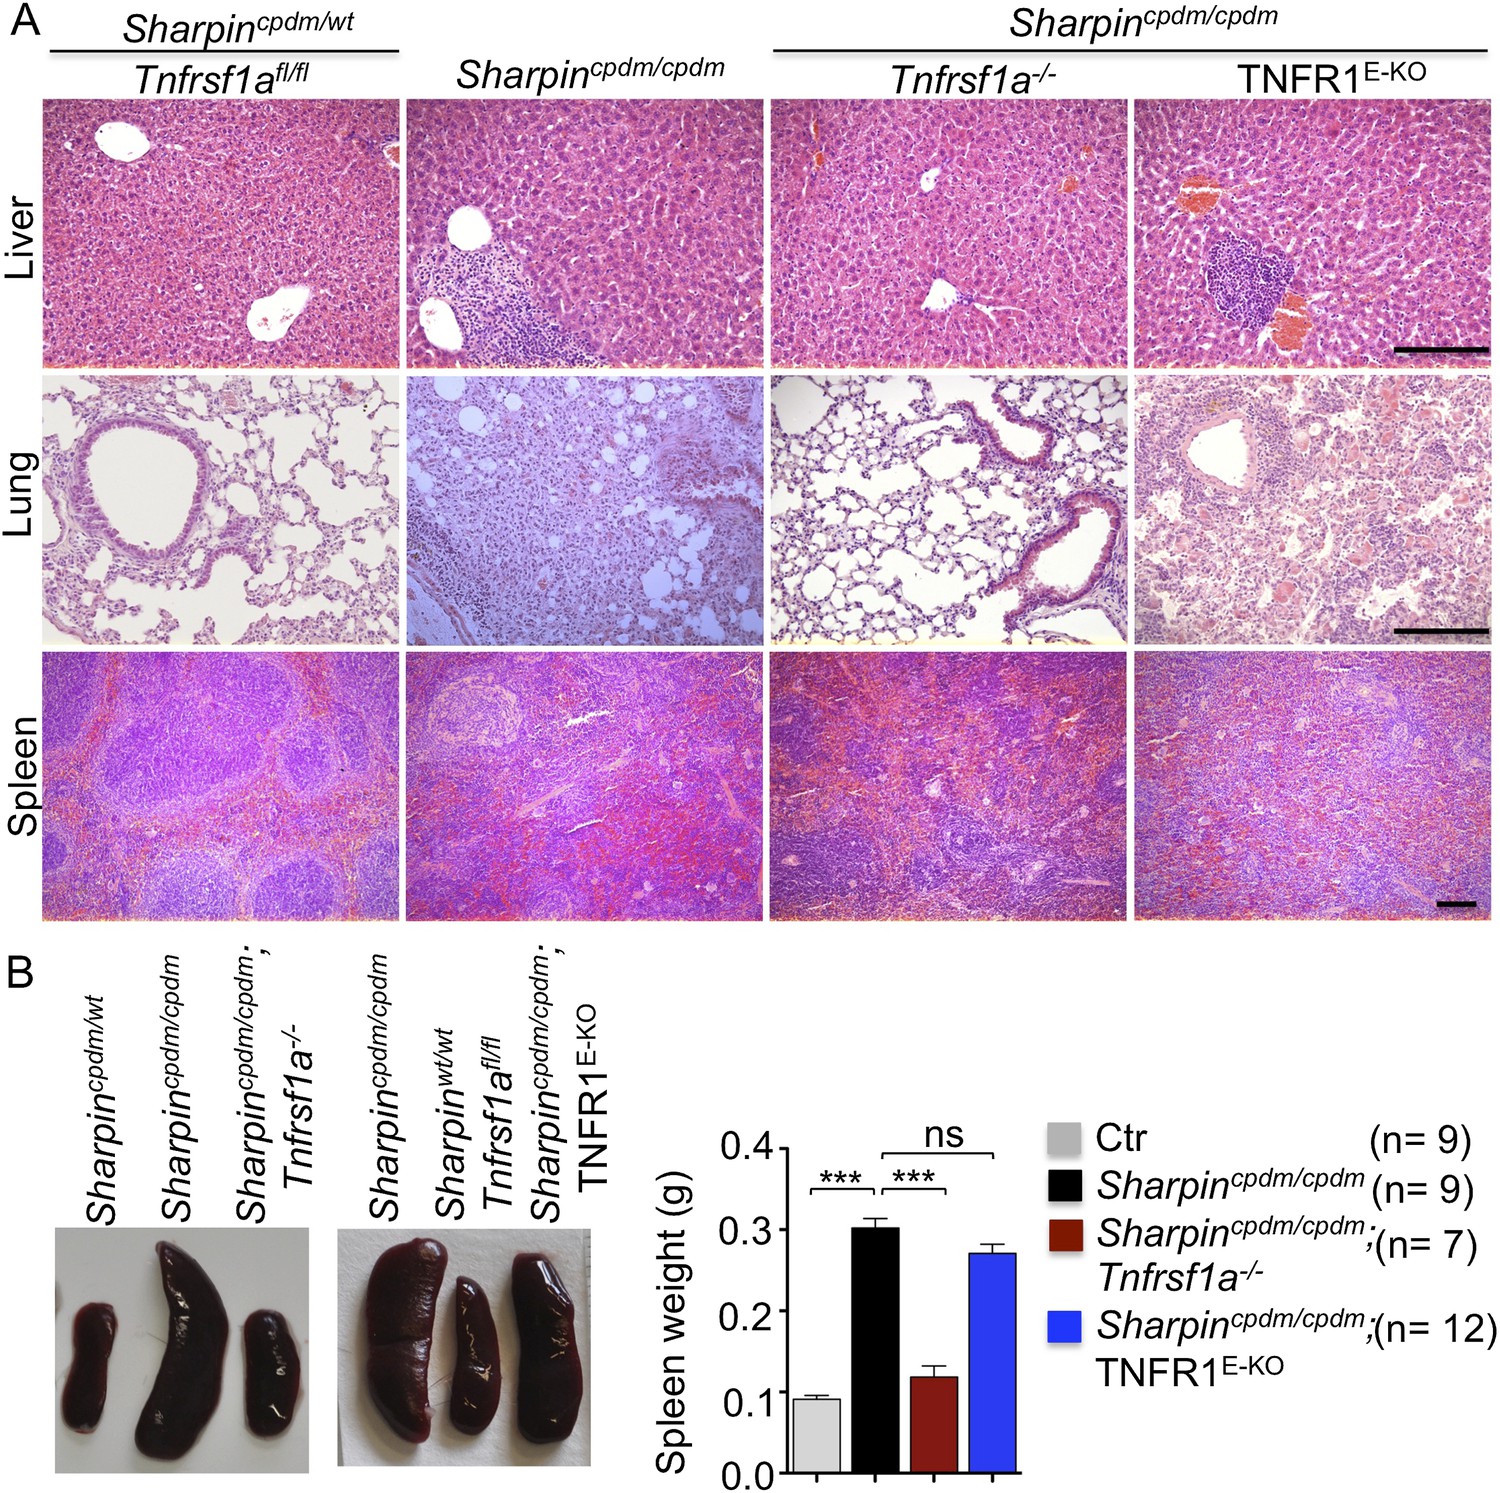
Tumor necrosis factor receptor 1 (TNFR1) deficiency in Sharpincpdm/cpdm mice rescues the inflammation of lung, liver and splenomegaly but not epidermal keratinocyte-restricted knockout of TNFR1.
(A and B) H&E staining of liver, lung and spleen, and macroscopic pictures of spleen from mice with the indicated genotypes as well as measurement of spleen weight from 12–18-week-old Sharpincpdm/cpdm, Sharpincpdm/cpdm;Tnfrsf1a−/−, and Sharpincpdm/cpdm;TNFR1E-KO mice and their littermate controls (Ctr), which consisted of the following genotypes: Sharpincpdm/wt;Tnfrsf1a−/−, Sharpinwt/wt;Tnfrsf1a−/−, Sharpincpdm/wt;Tnfrsf1afl/fl, Sharpincpdm/wt;TNFR1E-KO, and Sharpinwt/wt;TNFR1E-KO. The Sharpincpdm/cpdm group consisted of Sharpincpdm/cpdm;Tnfrsf1afl/fl and Sharpincpdm/cpdm;Tnfrsf1afl/wt mice that were littermates of the Sharpincpdm/cpdm;TNFR1E-KO mice. Scale bars in (A) are 100 μm. Results are expressed as mean values ± SEM. Statistical significance was determined using unpaired Student's t test (two-tailed) (***p ≤ 0.001).
Figure 5 with 3 supplements
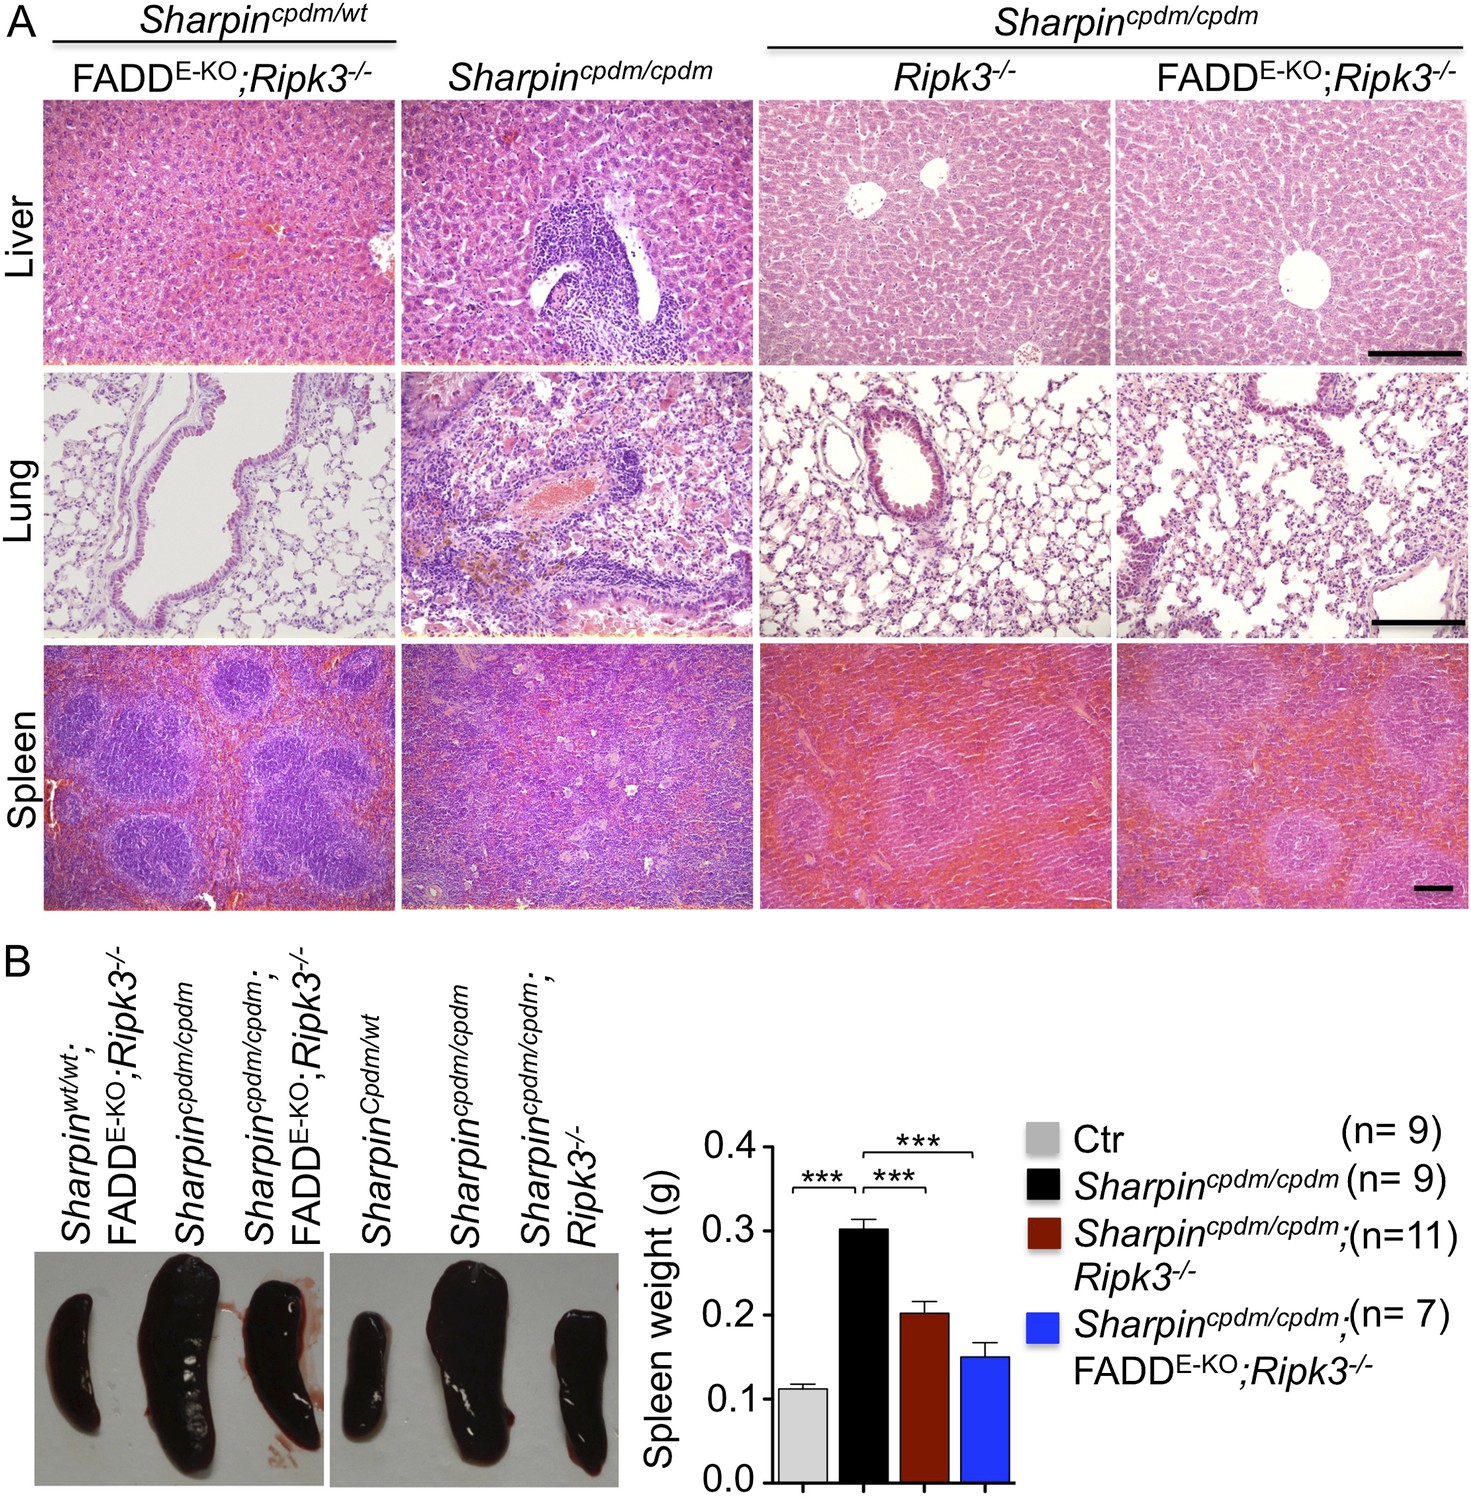
Receptor-interacting protein kinase 3 (Ripk3−/−) and epidermis-specific Fas-associated protein with death domain (FADD) together with Ripk3−/− (FADDE-KO;Ripk3−/−) in Sharpincpdm/cpdm mice partially rescues the inflammation of the lung, liver, and splenomegaly.
(A and B) H&E staining of liver, lung and spleen, and macroscopic pictures of spleen from mice with the indicated genotypes as well as measurement of spleen weight from 12–18-week-old Sharpincpdm/cpdm, Sharpincpdm/cpdm;Ripk3−/− and Sharpincpdm/cpdm;FADDE-KO;Ripk3−/− mice and their littermate controls (Ctr), which consisted of the following genotypes: Sharpinwt/wt;Tnfrsf1afl/fl, Sharpincpdm/wt;Faddfl/fl;Ripk3−/−, Sharpinwt/wt;Faddfl/fl;Ripk3−/−, Sharpincpdm/wt;FADDE-KO;Ripk3−/−, and Sharpinwt/wt;FADDE-KO;Ripk3−/−. The Sharpincpdm/cpdm group consisted of Sharpincpdm/cpdm;Tnfrsf1afl/fl and Sharpincpdm/cpdm;Tnfrsf1afl/wt mice that were littermates of the Sharpincpdm/cpdm;TNFR1E-KO mice. The Sharpincpdm/cpdm;Ripk3−/− mice were derived from the same breeding line as Sharpincpdmcpdm;FADDE-KO;Ripk3−/− mice and consisted of the genotype Sharpincpdm/cpdm;Faddfl/fl;Ripk3−/−. Scale bars in (A) are 100 μm. Results are expressed as mean values ± SEM. Statistical significance was determined using unpaired Student's t test (two-tailed) (***p ≤ 0.001).
Figure 5—figure supplement 1

Cell death in the spleen of Sharpincpdm/cpdm, Sharpincpdm/cpdm; Tnfrsf1a−/−, Sharpincpdm/cpdm;TNFR1E-KO, Sharpincpdm/cpdm;Ripk3−/− and Sharpincpdm/cpdm;FADDE-KO;Ripk3−/− mice.
(A and B) Cleaved caspase-3 (A) and TUNEL (B) staining on the spleen tissue sections from mice with the indicated genotypes between 12–18 weeks. The control mice compared were from the same breeding but not always littermates. Representative images are shown. The scale bars are 100 μm. Nuclei in (B) were visualized using DAPI.
Figure 5—figure supplement 2
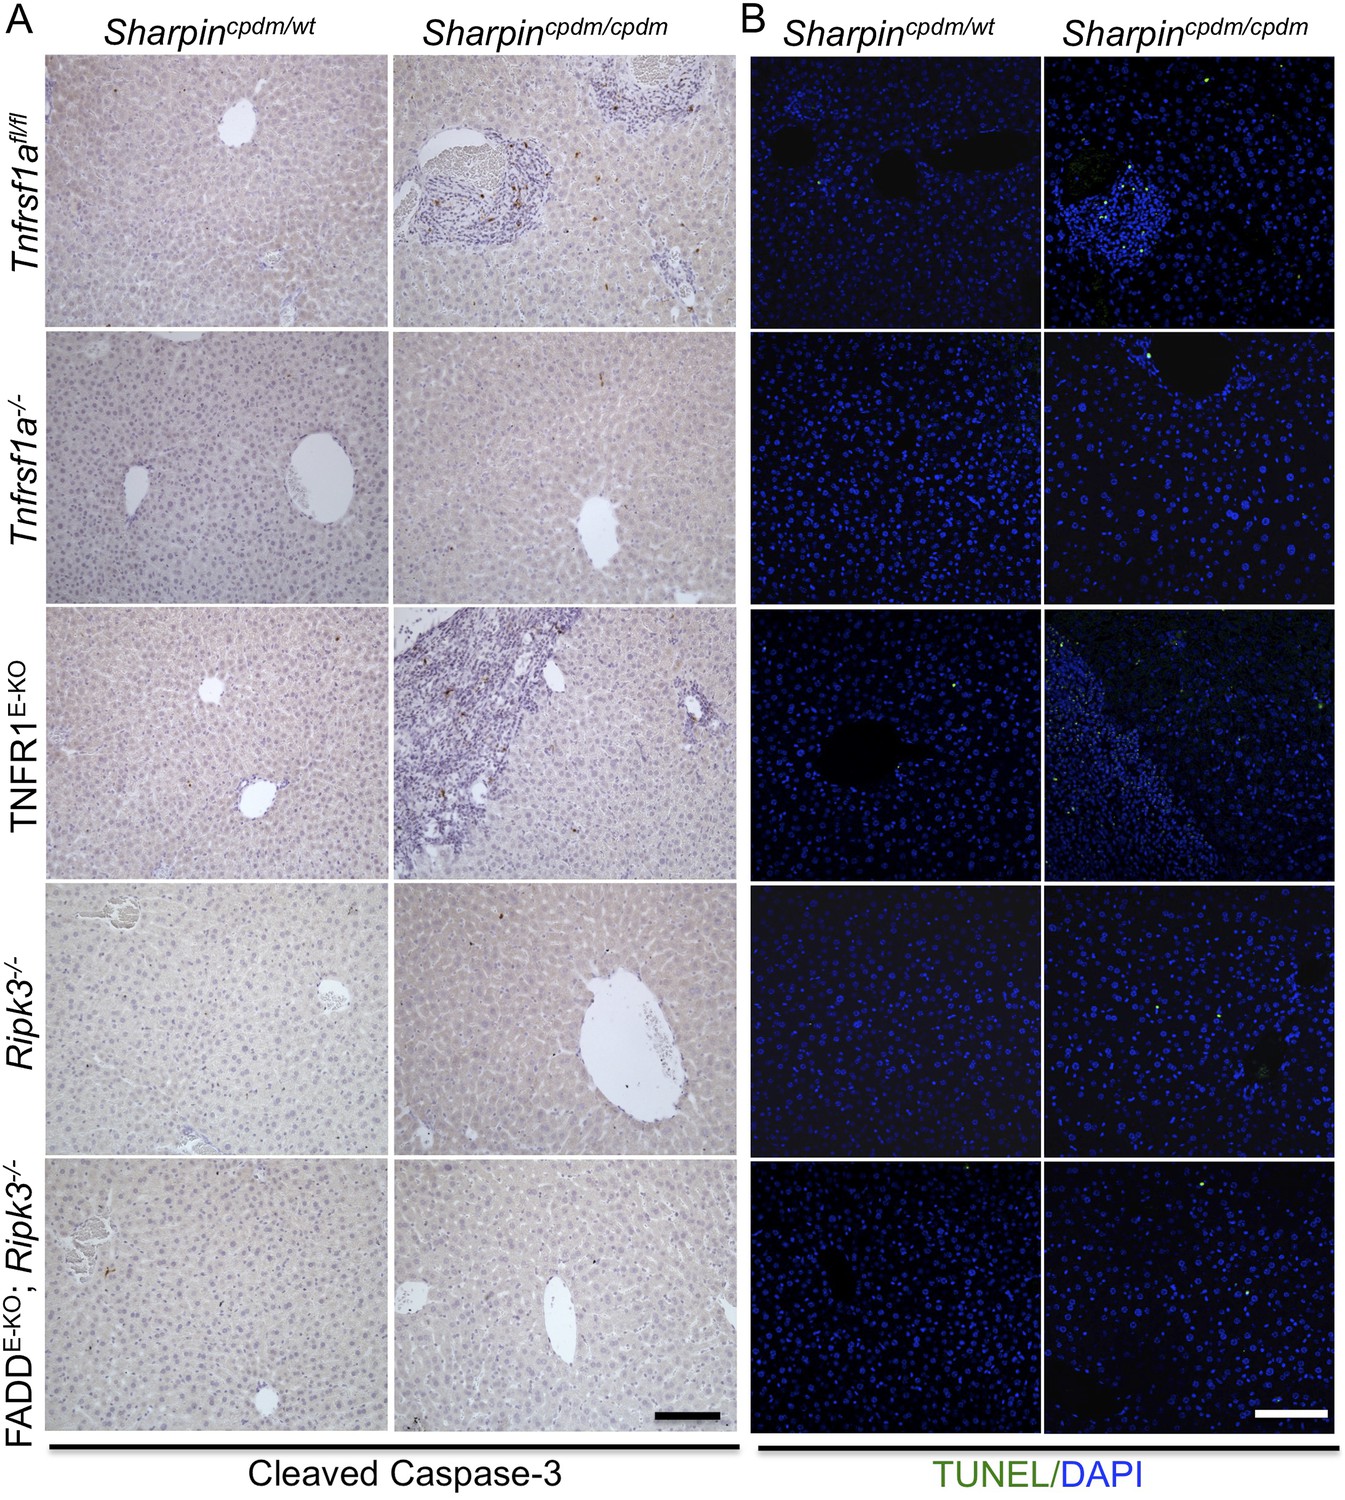
Cell death in the liver of Sharpincpdm/cpdm, Sharpincpdm/cpdm; Tnfrsf1a−/−, Sharpincpdm/cpdm;TNFR1E-KO, Sharpincpdm/cpdm;Ripk3−/− and Sharpincpdm/cpdm;FADDE-KO;Ripk3−/− mice.
(A and B) Cleaved caspase-3 (A) and TUNEL (B) staining of liver tissue sections from mice with the indicated genotypes between 12–18 weeks. The control mice compared were from the same breeding but not always littermates. Representative images are shown. The scale bars are 100 μm. Nuclei in (B) were visualized using DAPI.
Figure 5—figure supplement 3
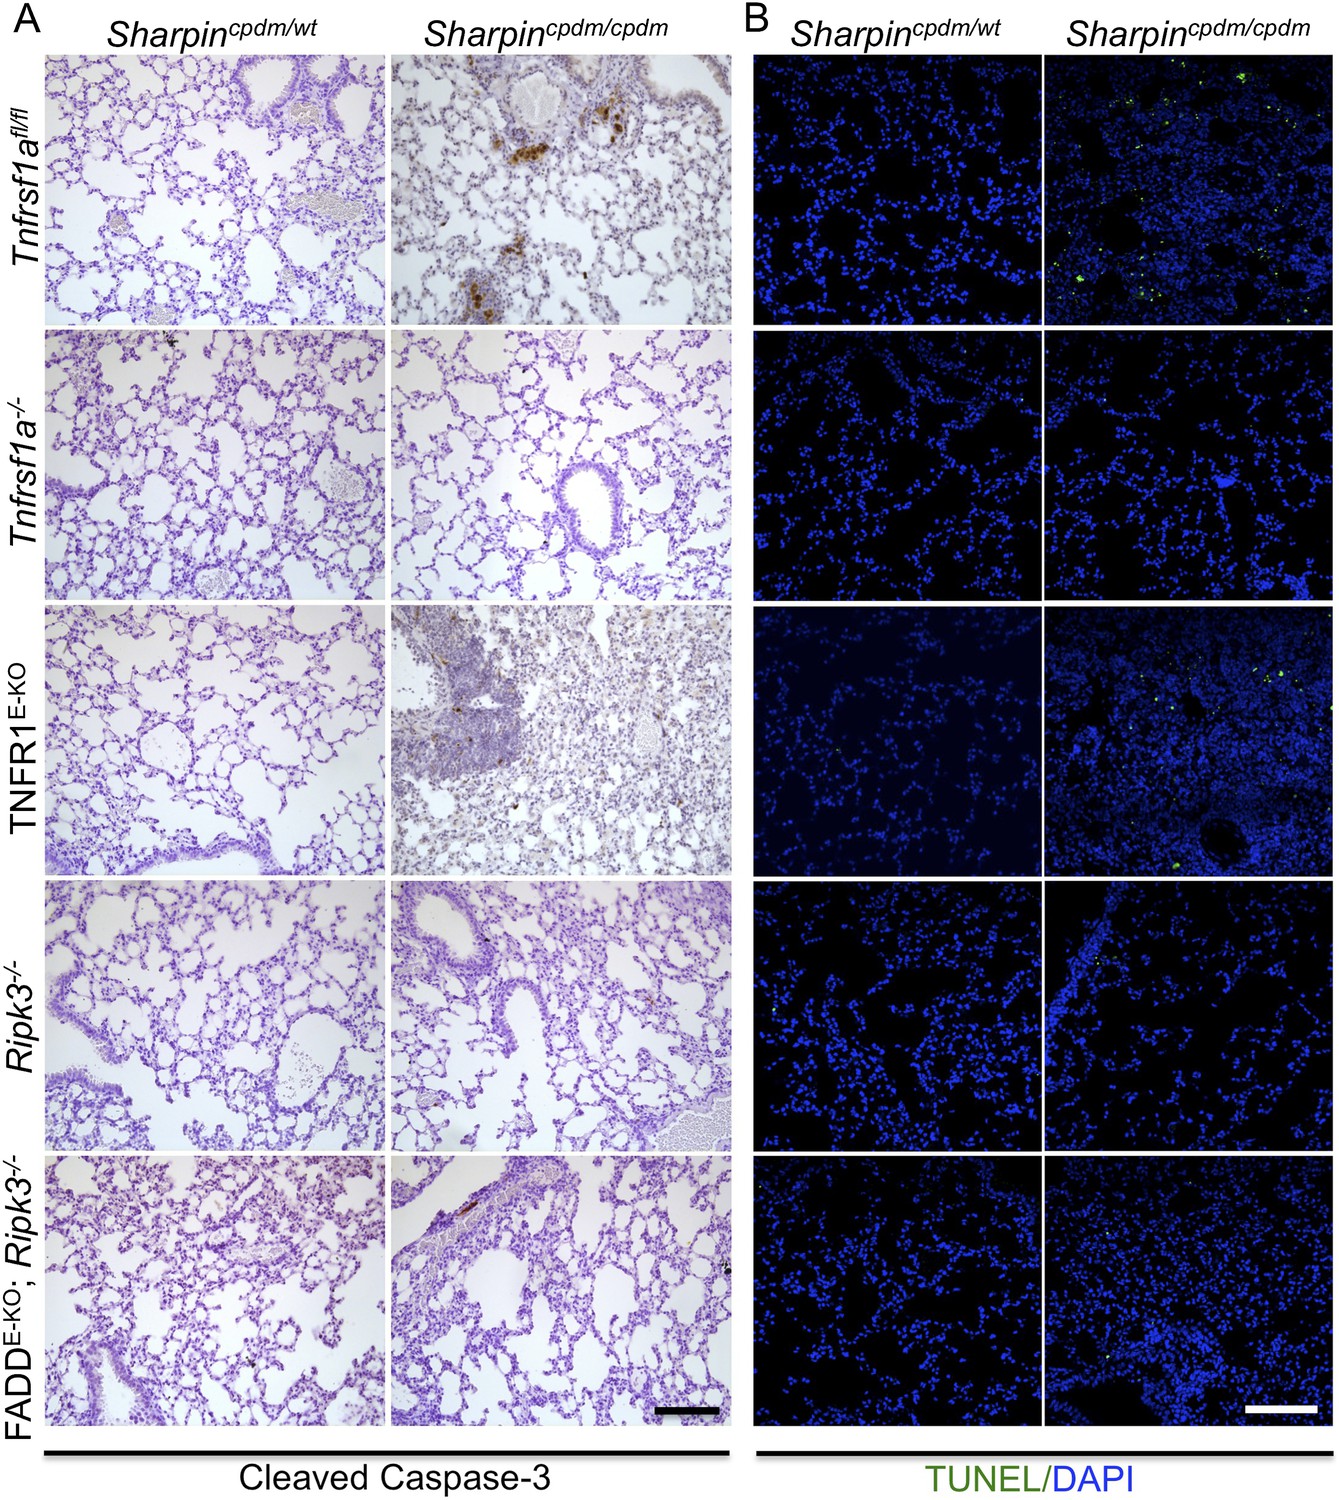
Cell death in the lung of Sharpincpdm/cpdm, Sharpincpdm/cpdm; Tnfrsf1a−/−, Sharpincpdm/cpdm;TNFR1E-KO, Sharpincpdm/cpdm;Ripk3−/− and Sharpincpdm/cpdm;FADDE-KO;Ripk3−/− mice.
(A and B) Cleaved caspase-3 (A) and TUNEL (B) staining of lung tissue sections from mice with the indicated genotypes between 12–18 weeks. The control mice compared were from the same breeding but not always littermates. Representative images are shown. The scale bars are 100 μm. Nuclei in (B) were visualized using DAPI.
Figure 6
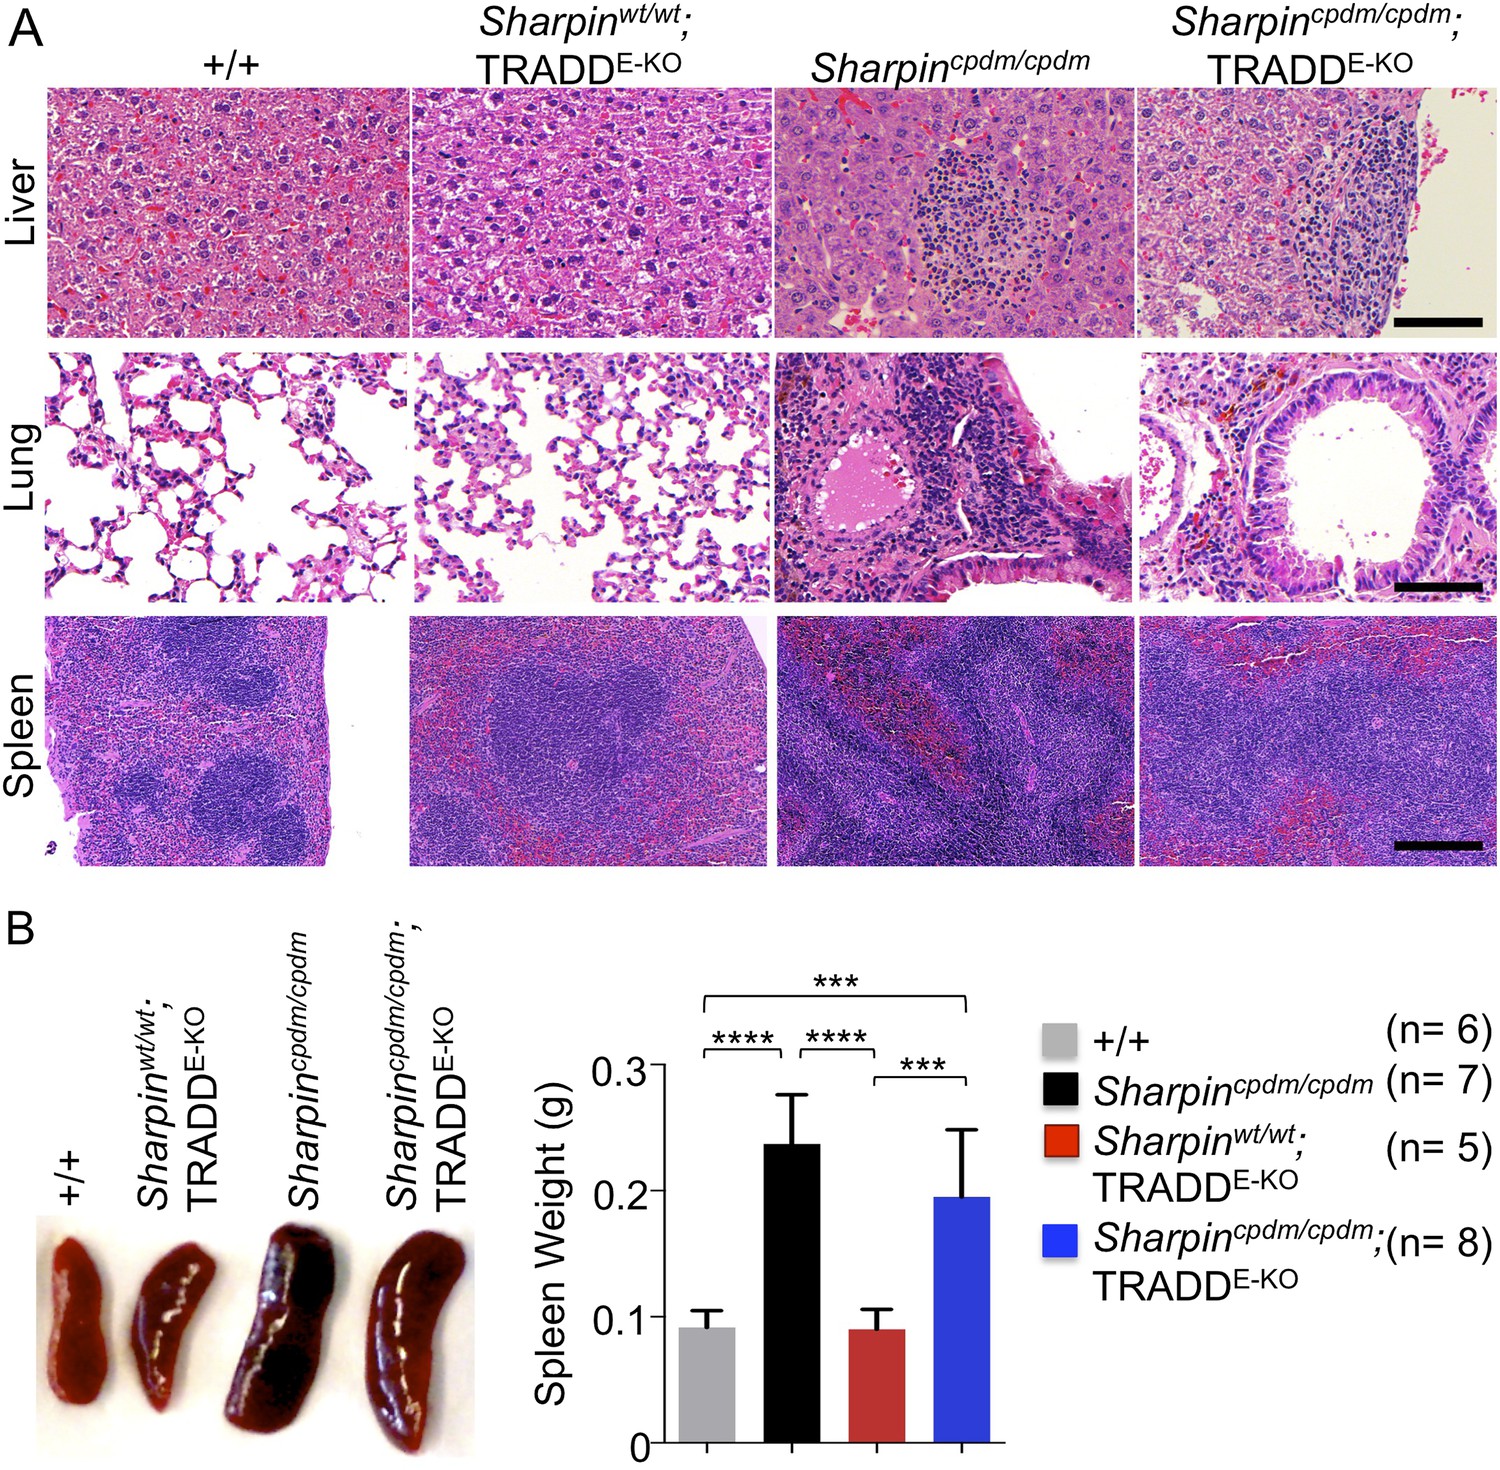
Epidermal keratinocyte-restricted knockout of tumor necrosis factor receptor 1-associated death domain (TRADD) (TRADDE-KO) in Sharpincpdm/cpdm mice has a minor effect on the inflammation of the lung, liver, and splenomegaly.
(A and B) H&E staining of liver, lung, and spleen and macroscopic pictures of spleen as well as measurement of spleen weight from mice with the indicated genotypes derived from wild type (+/+), Sharpincpdm/cpdm, TRADDE-KO or Sharpincpdm/cpdm;TRADDE-KO mice at the age of 12 weeks. The mice used here are the littermates. Scale bars in (A) are 100 μm. Results are expressed as mean values ± SD. Statistical significance was determined using ANOVA test (***p ≤ 0.001 and ****p ≤ 0.0001).
Figure 7
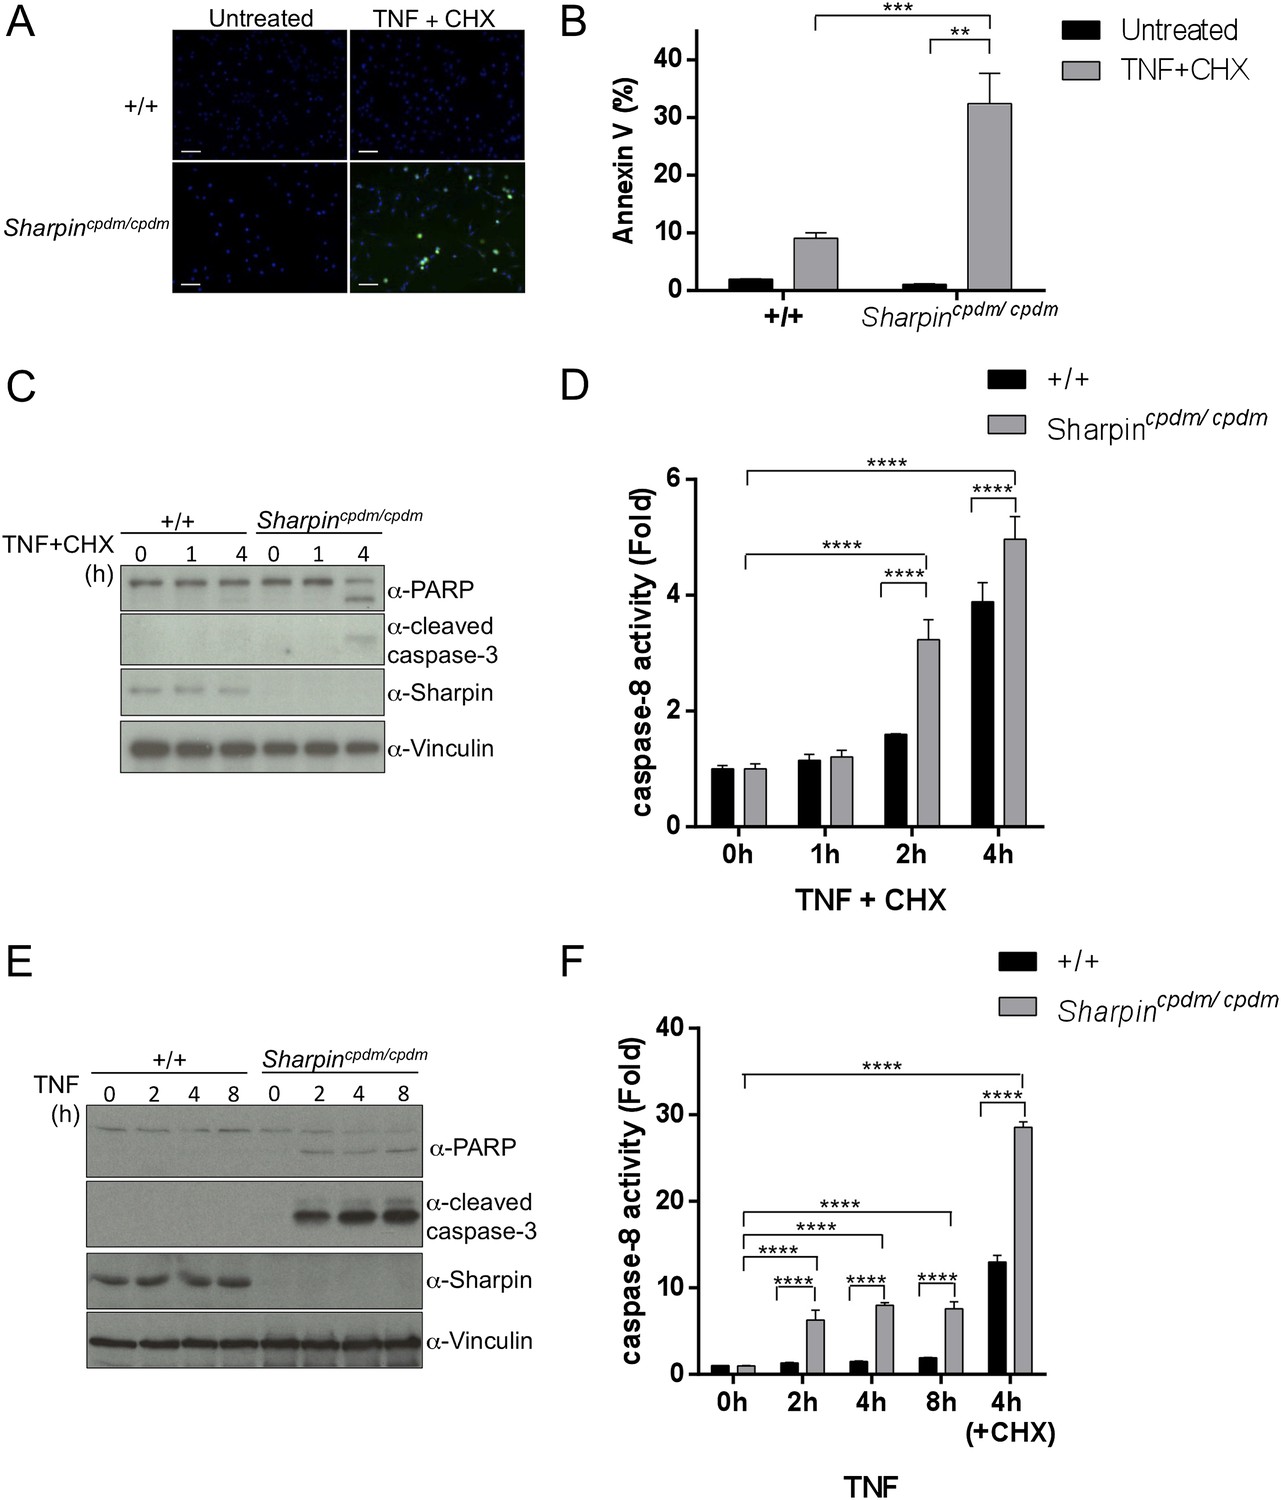
Sharpin regulates tumor necrosis factor (TNF)-induced apoptosis signaling cascade in mouse embryonic fibroblasts (MEFs).
(A–D) TNF- and cycloheximide (CHX)-induced apoptosis in wild type (+/+) or Sharpincpdm/cpdm MEFs. Apoptosis in MEFs stimulated with TNF (10 ng/ml) and CHX (1 μg/ml) for 4 hr was examined by immunofluorescent staining using α-cleaved caspase-3 antibody with Alexa488 conjugated secondary antibody (A), by fluorescence-activated cell sorting (FACS) analysis using annexin V staining (B), by immunoblotting using α-cleaved caspase-3 and α-Poly (ADP-ribose) polymerase (PARP) antibodies (C), or by caspase-8 activity assay measured using a luminol-based assay. Scale bars in (A) are 100 μm. (E and F) TNF-induced apoptosis in MEFs analyzed by immunoblotting (E) or by caspase-8 activity assay (F) as in (C and D). Results are expressed as mean values ± SD. Statistical significance was determined using ANOVA test (*p ≤ 0.05, **p ≤ 0.01, ***p ≤ 0.001, ****p ≤ 0.0001).
Figure 8 with 1 supplement
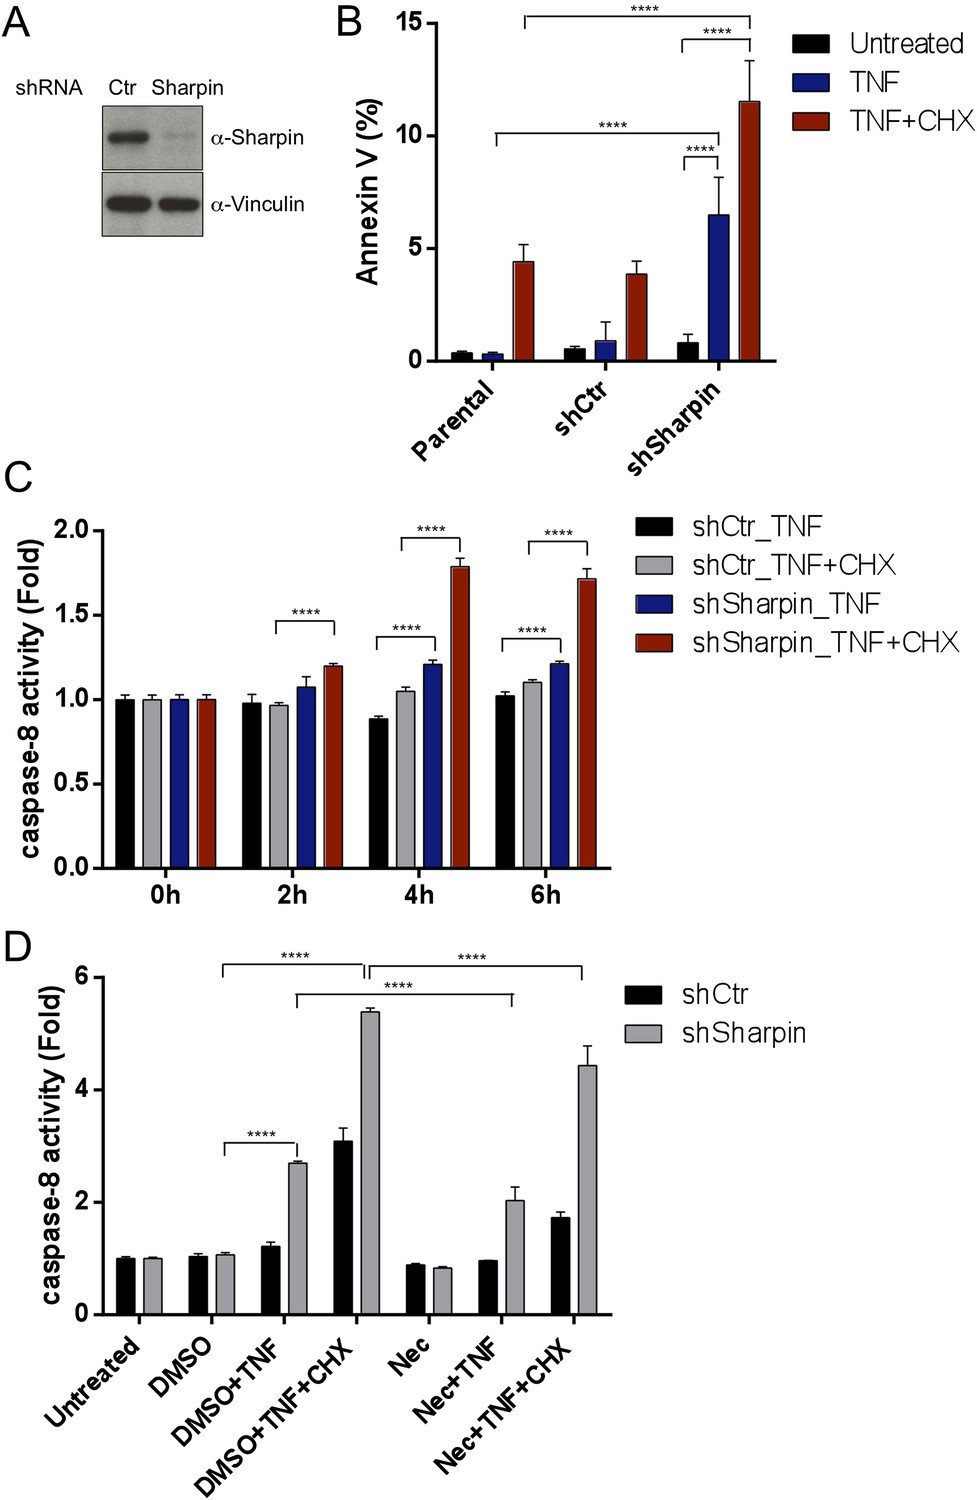
Sharpin regulates tumor necrosis factor (TNF)-induced apoptosis signaling cascade in HaCaT cells.
(A) Immunoblotting of stable knockdown Sharpin in HaCaT cells using α-Sharpin antibody. Control shRNA (Ctr) was used for the control knockdown. α-Vinculin antibody was used for the loading control. (B) Fluorescence-activated cell sorting (FACS) analysis of annexin V staining in parental, Ctr, and Sharpin knockdown HaCaT cells, stimulated with TNF (100 ng/ml) for 16 hr or TNF with cycloheximide (CHX) (1 μg/ml) for 6 hr. (C) Caspase-8 activity measurement using a luminol-based assay upon stimulation with TNF alone, or TNF and CHX for the indicated time in Ctr and Sharpin knockdown HaCaT cells. (D) Caspase-8 activity measurement upon stimulation with TNF, TNF + CHX with or without Necrostatin-1 (Nec) (30 μmol) for 6 hr in Ctr and Sharpin knockdown HaCaT cells. Results are expressed as mean values ± SD. Statistical significance was determined using ANOVA test (****p ≤ 0.0001).
Figure 8—figure supplement 1
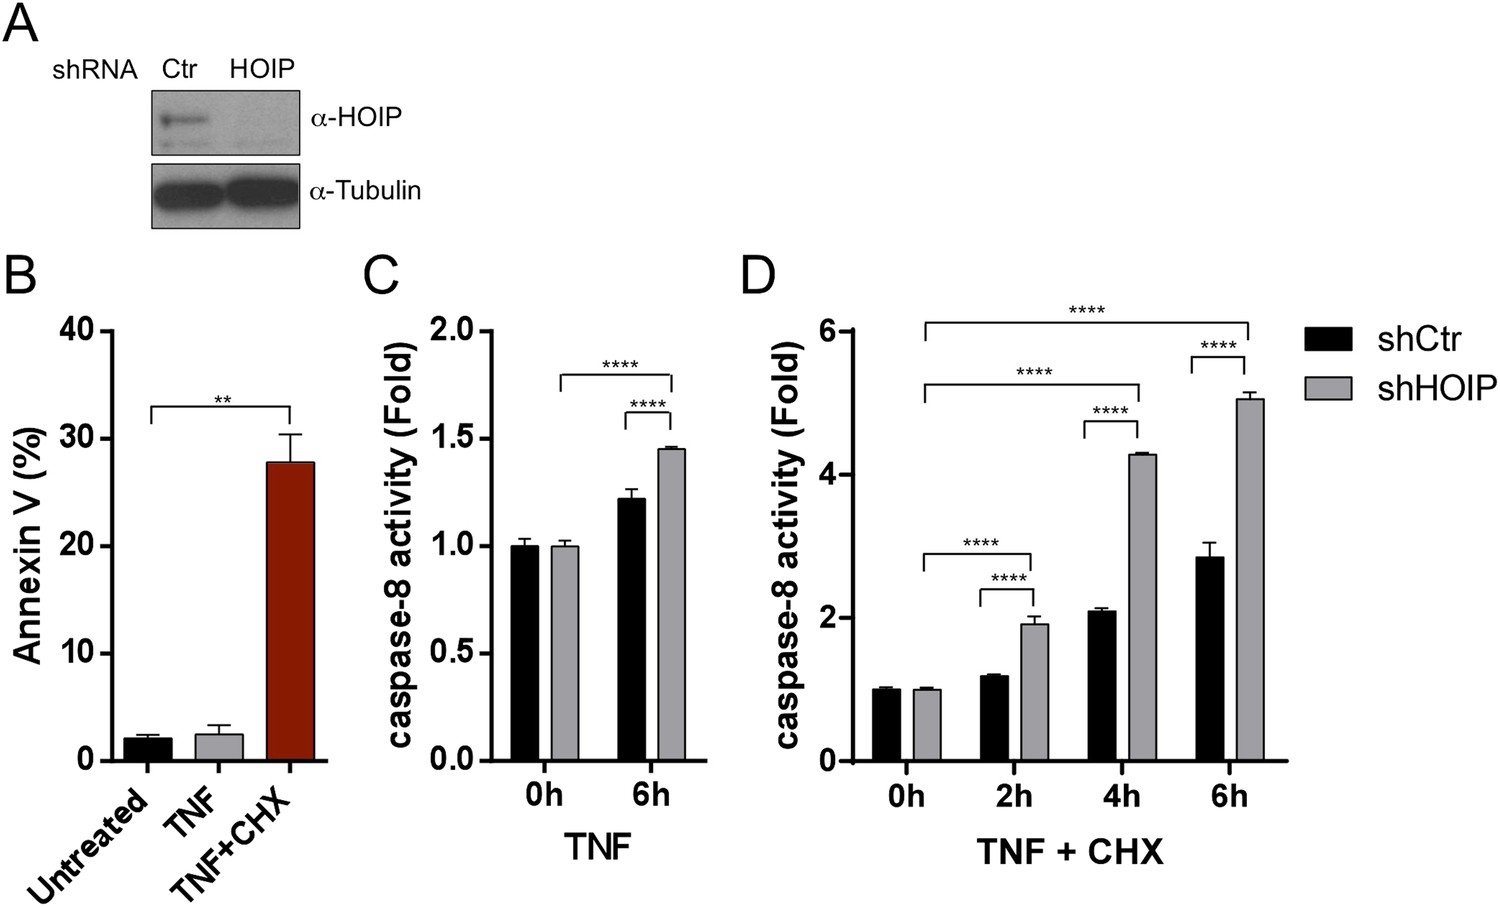
A LUBAC component, HOIL-1L interacting protein (HOIP), plays a role in tumor necrosis factor (TNF)-induced apoptosis in HaCaT cells.
(A–D) Immunoblot of HOIP (A) after stable knocked down of HOIP in HaCaT cells by shRNA. α-Tubulin antibody was used for the loading control. Fluorescence-activated cell sorting (FACS) analysis of annexin V positive cells after stimulation of control (Ctr) and HOIP knockdown HaCaT cells with TNF alone or TNF + cycloheximide (CHX) (B) and caspase-8 activity assay (B and D) after stimulation of Ctr and HOIP knockdown HaCaT cells with TNF alone (C) or TNF + CHX (D). Results are expressed as mean values ± SD. Statistical significance was determined using ANOVA test (**p ≤ 0.01, ****p ≤ 0.0001).
Figure 9 with 1 supplement
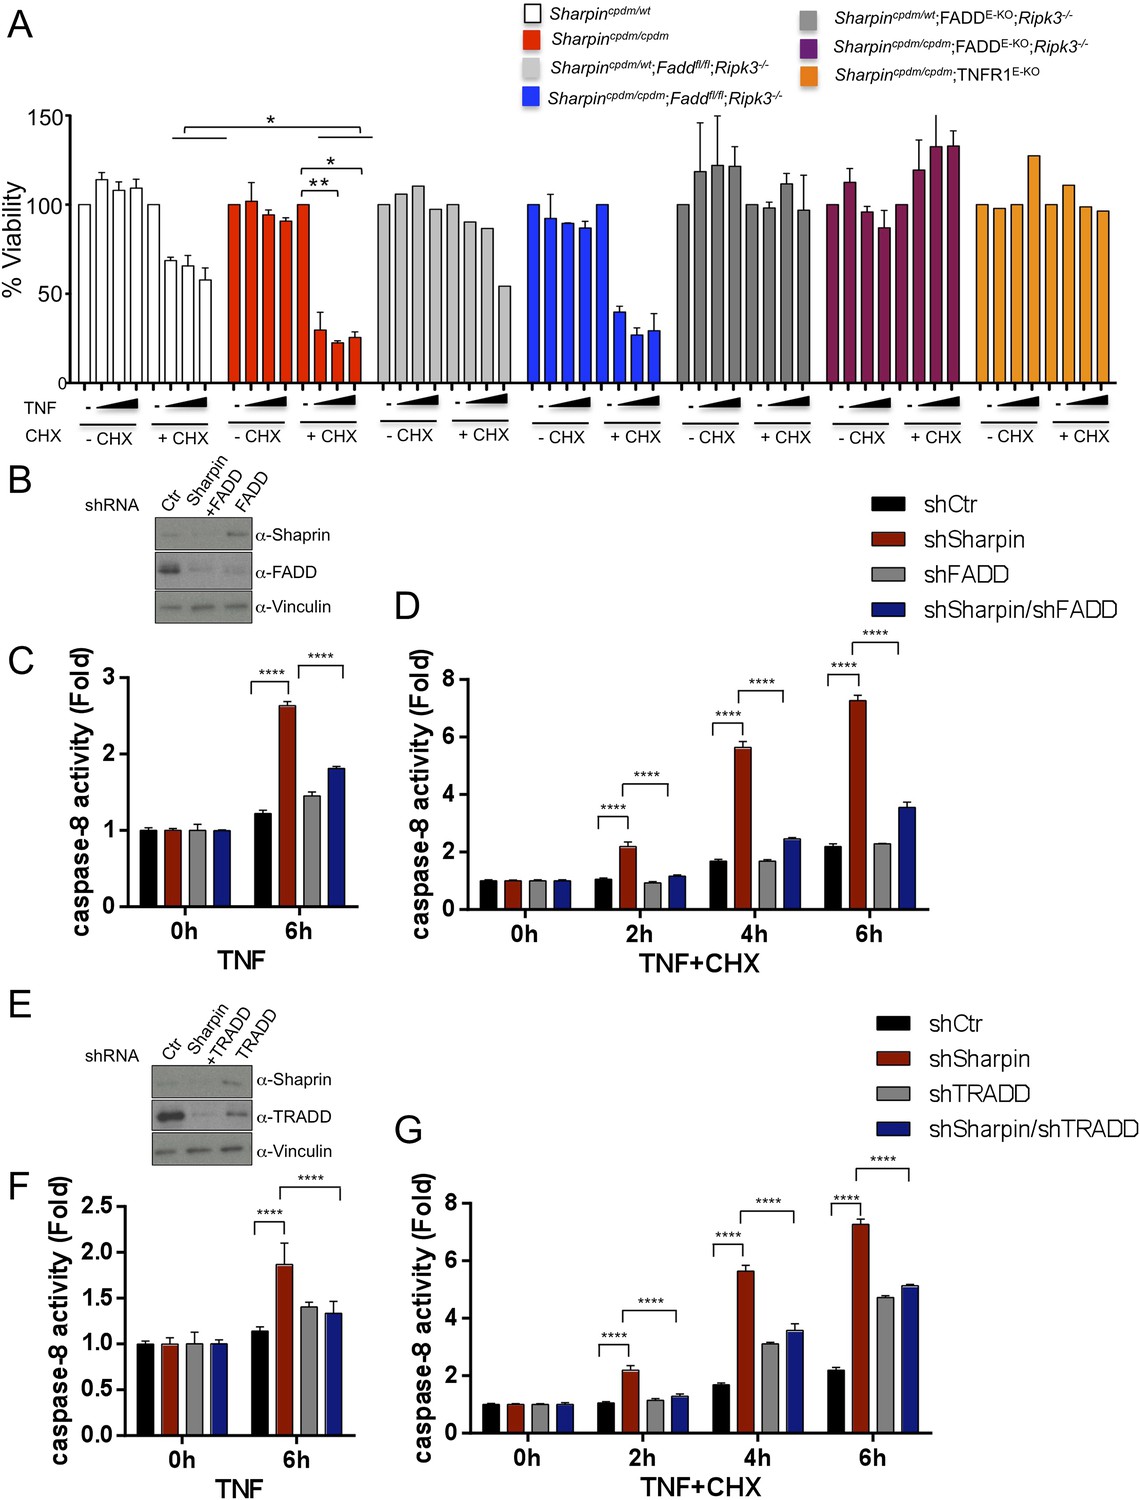
Fas-associated protein with death domain (FADD)- and tumor necrosis factor receptor 1-associated death domain (TRADD)-dependent enhanced sensitivity of Sharpin-deficient keratinocytes to tumor necrosis factor (TNF)-induced apoptosis.
(A) Percentage viability of primary keratinocytes isolated from Sharpincpdm/cpdm, Sharpincpdm/cpdm;Ripk3−/−, Sharpincpdm/cpdm;FADDE-KO;Ripk3−/− and Sharpincpdm/cpdm;TNFR1E-KO, and their respective control pups (n = 2) upon treatment with increasing TNF concentration (20, 50 and 100 ng/ml) in the presence or absence of cycloheximide (CHX) (1 μg/ml) for 24 hr. Viability of TNF-treated cells was normalized over their untreated control cells, and viability of TNF + CHX-treated cells was normalized over their CHX-treated control cells. The result shown here is representative of two independent experiments. The percentage viability was assessed using the WST-1 assay. Bars represent mean values ± SEM. Statistical significance was determined using the Student's t test (**p ≤ 0.01, *p ≤ 0.05). (B–G) Sharpin with FADD (B) or TRADD (E) was stably knocked down in HaCaT cells. Knockdown efficiency was analyzed by immunoblotting using α-Sharpin, α-FADD, and α-TRADD antibodies. Caspase-8 activity measurement in Sharpin knockdown, FADD knockdown, and double knockdown of Sharpin and FADD HaCaT cells (C and D) as well as Sharpin knockdown, TRADD knockdown, and double knockdown of Sharpin and TRADD HaCaT cells (F and G) upon treatment with TNF alone (C and F) or TNF + CHX (D and G) for the indicated time. Results are expressed as mean values ± SD. Statistical significance was determined using ANOVA test (****p ≤ 0.0001).
Figure 9—figure supplement 1

Fas-associated protein with death domain (FADD) plays an important role in the Sharpin-dependent apoptosis signaling.
(A) Immunoblot of FADD after stable knocked down of FADD in wild type (+/+) mouse embryonic fibroblasts (MEFs) and Sharpincpdm/cpdm MEFs by shRNA. α-Vinculin antibody was used for the loading control. (B) Fluorescence-activated cell sorting (FACS) analysis of annexin V positive cells after stimulation with tumor necrosis factor (TNF) + cycloheximide (CHX) for 4 hr in +/+ shCtr MEFs, +/+ shFADD MEFs, Sharpincpdm/cpdm shCtr MEFs, and Sharpincpdm/cpdm shFADD MEFs. (C) Caspase-8 activity measurement upon stimulation with TNF with or without CHX for the indicated time in +/+ shCtr MEFs, +/+ shFADD MEFs, Sharpincpdm/cpdm shCtr MEFs and Sharpincpdm/cpdm shFADD MEFs. Results are expressed as mean values ± SD. Statistical significance was determined using ANOVA test (****p ≤ 0.0001).
Download links
A two-part list of links to download the article, or parts of the article, in various formats.
Downloads (link to download the article as PDF)
Open citations (links to open the citations from this article in various online reference manager services)
Cite this article (links to download the citations from this article in formats compatible with various reference manager tools)
Sharpin prevents skin inflammation by inhibiting TNFR1-induced keratinocyte apoptosis
eLife 3:e03422.
https://doi.org/10.7554/eLife.03422


