TNFR1-dependent cell death drives inflammation in Sharpin-deficient mice
- Walter and Eliza Hall Institute of Medical Research, Australia
- University of Melbourne, Australia
- University College London, United Kingdom
- La Trobe University, Australia
- Institute of Experimental Immunology, University of Zurich, Switzerland
- Emory Vaccine Center, Emory University School of Medicine, United States
Figures
Figure 1

Cpdm dermatitis is mediated by TNFR1, IL-1R to a lesser extent, and not TNFR2.
(A) Representative photos of mice of indicated genotypes and age. (B) Histological analysis of mice of genotype and age as indicated; representative of n ≥ 3 mice for each genotype or group. Black arrows in liver images point to areas of periportal inflammation. Black arrows in small intestine image point to Peyer's patches. Shpnm/m: Sharpincpdm/cpdm. Control mice are Shpn+/+ or +/m, Tnfr1−/− control mice are Shpn+/+ or +/mTnfr1−/−. Scale bars: Skin and liver 100 µm, spleen 500 µm, small intestine 1 mm. H&E: hematoxylin and eosin. (C) Epidermal thickness of mice of indicated age and genotypes. Each point represents the average of at least 14 measurements from multiple fields of view per mouse that were taken by a researcher who was blind to the genotype. Dotted lines are drawn at 30 µm and 14 weeks. Red numbers (and black for middle graph) correspond to proportion of Shpnm/m mice with epidermal thickness >30 µm at < 14 weeks of age (upper left quadrant). Control mice are Shpn+/+ or +/m, Shpn+/+ or +/mTnfr1−/− and Shpn+/+ or +/mIl1r1−/− in upper, middle and lower graphs respectively. *** Significantly different to control group (Fisher's exact test), p ≤ 0.005. (D) Average spleen weights of mice of indicated genotypes. Spleen weights were taken from 12-week-old mice (except Tnfr1−/− mice that were 15 or 35 weeks old), or younger mice if they required euthanasia due to their dermatitis. Data are represented as mean + SEM, *p ≤ 0.05, ***p ≤ 0.005.
Figure 2

Keratinocyte cell death and dermal macrophage infiltration are early events in cpdm dermatitis.
(A) BioPlex cytokine analysis of skin lysates from mice of indicated genotypes. Data are represented as mean +S.E.M. *p ≤ 0.05. (B) F4/80 staining (brown) of skin sections counterstained with hematoxylin (blue). Control: Shpn+/+ or +/m. (C) Cleaved caspase-3 staining (brown) of skin, liver and spleen sections counterstained with hematoxylin (blue). Black arrows show examples of cleaved-caspase-3 positive cells. Control: Shpn+/+ or +/m. (A–C) Three mice were analyzed for each genotype or group. Scale bars: 50 µm.
Figure 3
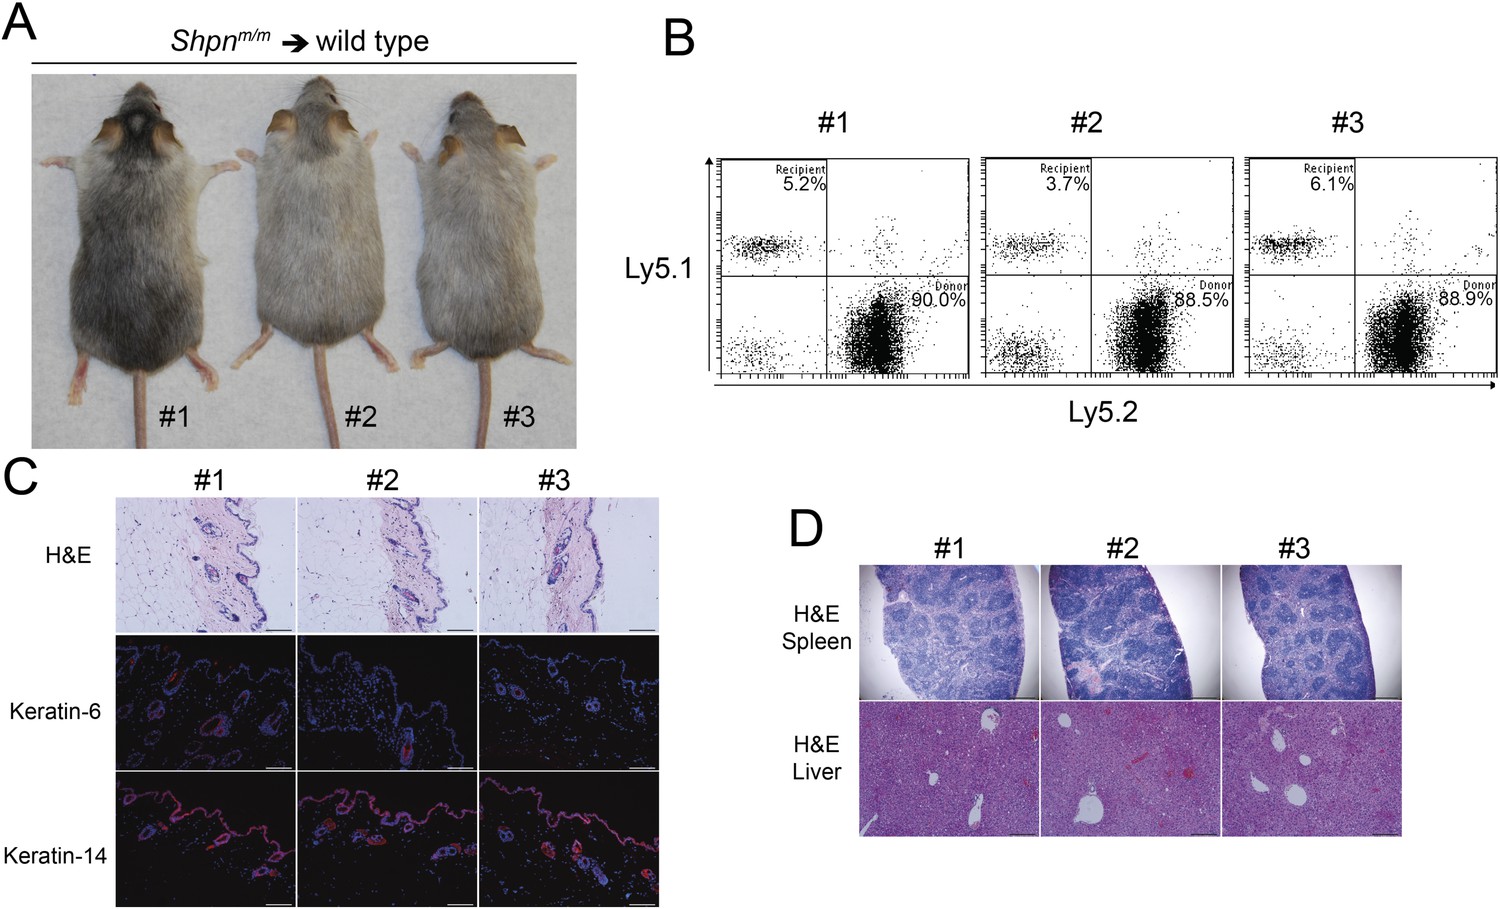
No dermatitis in wild-type mice reconstituted with Shpnm/m bone marrow after 12 months.
(A) No dermatitis was observed in wild-type mice 12 months after reconstitution with Shpnm/m bone marrow. (B) Flow cytometry analysis showing percentage contribution of Ly5.1 (recipient) vs Ly5.2 (donor) white blood cells in peripheral blood 12 months after reconstitution. (C) Histological and immunofluorescence analysis of dorsal skin from mice 12 months after reconstitution. (D) Histological analysis of the spleen and liver from mice 12 months after reconstitution. Scale bars: Skin 100 µm, liver 200 µm and spleen 500 µm. H&E: hematoxylin and eosin.
Figure 4 with 1 supplement

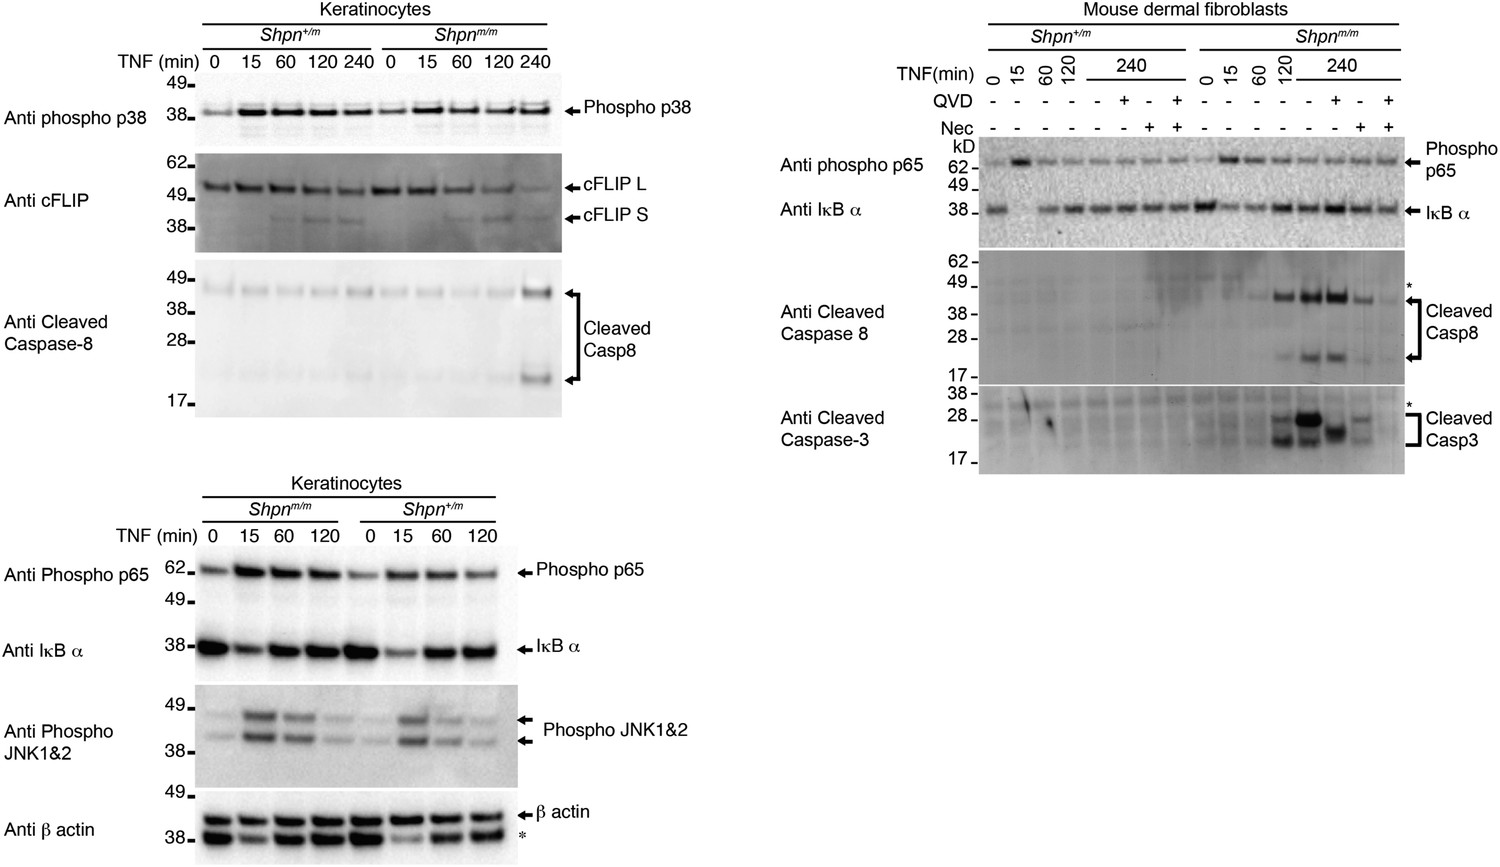
TNF induces death in multiple primary cell types, and is marked by caspase-3 and -8 cleavage in primary keratinocytes and mouse dermal fibroblasts in vitro.
(A and B) Primary keratinocytes (A) and mouse dermal fibroblasts (MDFs) (B) were treated with 100 ng/ml human Fc-TNF, 50 µM Nec-1 or 10 µM Q-VD-OPh for 24 hr as indicated, then viability was assessed by propidium iodide (PI) uptake and flow cytometry. Cells were generated from three different mice for each group. Control: Shpn+/+ or +/m. (C and D) Western blot analysis of primary keratinocytes (C) and MDFs (D) treated as indicated (concentrations as in A and B) then lysed and lysates separated on SDS/PAGE and western blotted with indicated antibodies. Shpn+/m: n = 1; Shpnm/m: n = 2 (n = 1 for MDFs) mice analyzed shown above. * Indicates non-specific band. Data from additional mice is shown in Figure 4—figure supplement 1. (E) Neutrophils, monocytes and bone-marrow-derived macrophages were treated with 100 ng/ml human Fc-TNF, 50 µM Nec-1, 20 µM Q-VD-OPh (10 µM for macrophages) or 500 nM Compound A (CpdA) for 20 hr (24 hr for macrophages) as indicated. Viability was assessed by PI uptake and flow cytometry. The Smac mimetic CpdA sensitizes cells to TNF-induced cell death and serves as a control. Cells were generated from three different mice for each group except for macrophages, where six to eight mice were analyzed. (A, B, E) Data are represented as mean + SEM, *p ≤ 0.05, **p ≤ 0.01, ***p ≤ 0.005.
Figure 4—figure supplement 1
TNF induces caspase-3 and -8 cleavage in primary keratinocytes and mouse dermal fibroblasts in vitro.
Western blot analysis of primary keratinocytes and mouse dermal fibroblasts (MDFs) treated as indicated (reagent concentrations as per Figure 4A,B) then lysed and lysates separated on SDS/PAGE and western blotted with indicated antibodies. * Indicates non-specific band. Lysates generated from different mice to those shown in Figure 4.
Figure 5
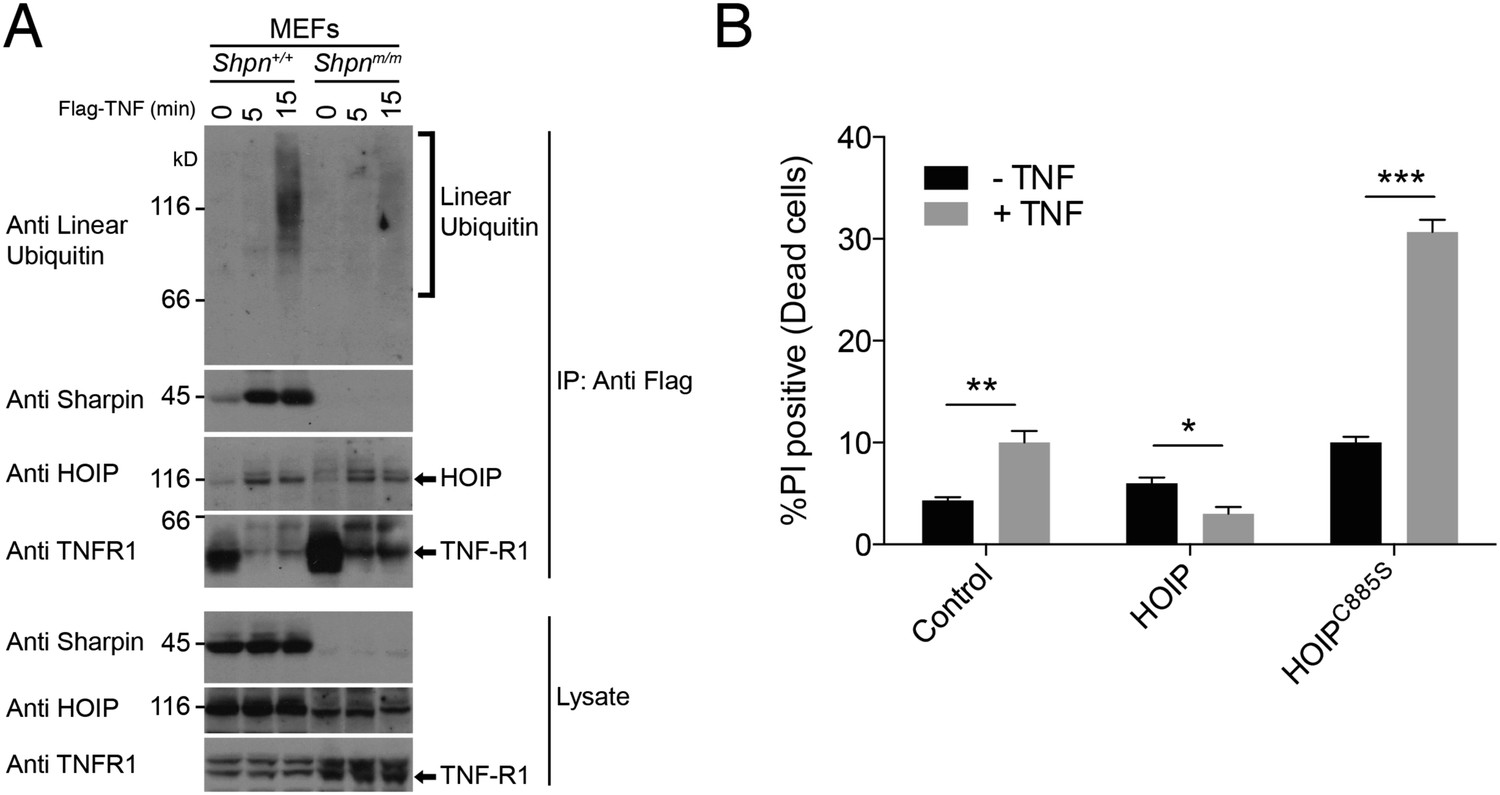
Sharpin is required for normal linear ubiquitylation of the TNF-R1 signaling complex, and HOIP protects keratinocytes from TNF-induced cell death.
(A) Anti Flag Immuno-Precipitation (IP) of the TNF receptor signaling complex in immortalised mouse embryonic fibroblasts (MEFs) treated with Flag-TNF for the times indicated. (B) HaCaT human keratinocytes stably expressing HOIP, the catalytically inactive HOIPC885S, or an empty vector (control) were treated with 100 ng/ml TNF for 24 hr. Viability was assessed by propidium iodide (PI) uptake and flow cytometry. Data are presented as mean + SEM, n = 3, *p ≤ 0.05, **p ≤ 0.01, ***p ≤ 0.005.
Figure 6

Protection from cpdm dermatitis with Casp8 heterozygosity but not Bid deletion.
(A) Histological and immunofluorescence skin analysis. (B) Epidermal thickness of mice of indicated age and genotypes determined as in Figure 1B, by an investigator blinded to genotype. Top panel is a repeat of data in 1B for reference purposes only. Dotted lines are drawn at 30 µm and 14 weeks. Red numbers correspond to proportion of Shpnm/m mice with epidermal thickness >30 µm at < 14 weeks of age (upper left quadrant). Control mice are Shpn+/+ or +/m, Shpn+/+ or +/mBid−/−, and Shpn+/+ or +/mCasp8+/− in upper, middle and lower graphs, respectively. *** Significantly different to control group (Fisher's exact test), p ≤ 0.005. (C) Histological analysis of spleen, liver, and small intestine. Black arrows in liver images point to areas of periportal inflammation. Black arrow in small intestine image points to Peyer's patch. (D) Average spleen weights of mice of indicated genotypes. Spleen weights were taken from 12–14-week-old mice, or younger mice if they required euthanasia due to their dermatitis. Data are represented as mean + SEM, ***p ≤ 0.005. (A and C) Control mice are Shpn+/+ or +/m, n ≥ 3 mice analyzed each genotype or group. Scale bars: skin and liver 100 µm, spleen 500 µm, small intestine 1 mm. H&E: hematoxylin and eosin.
Figure 7
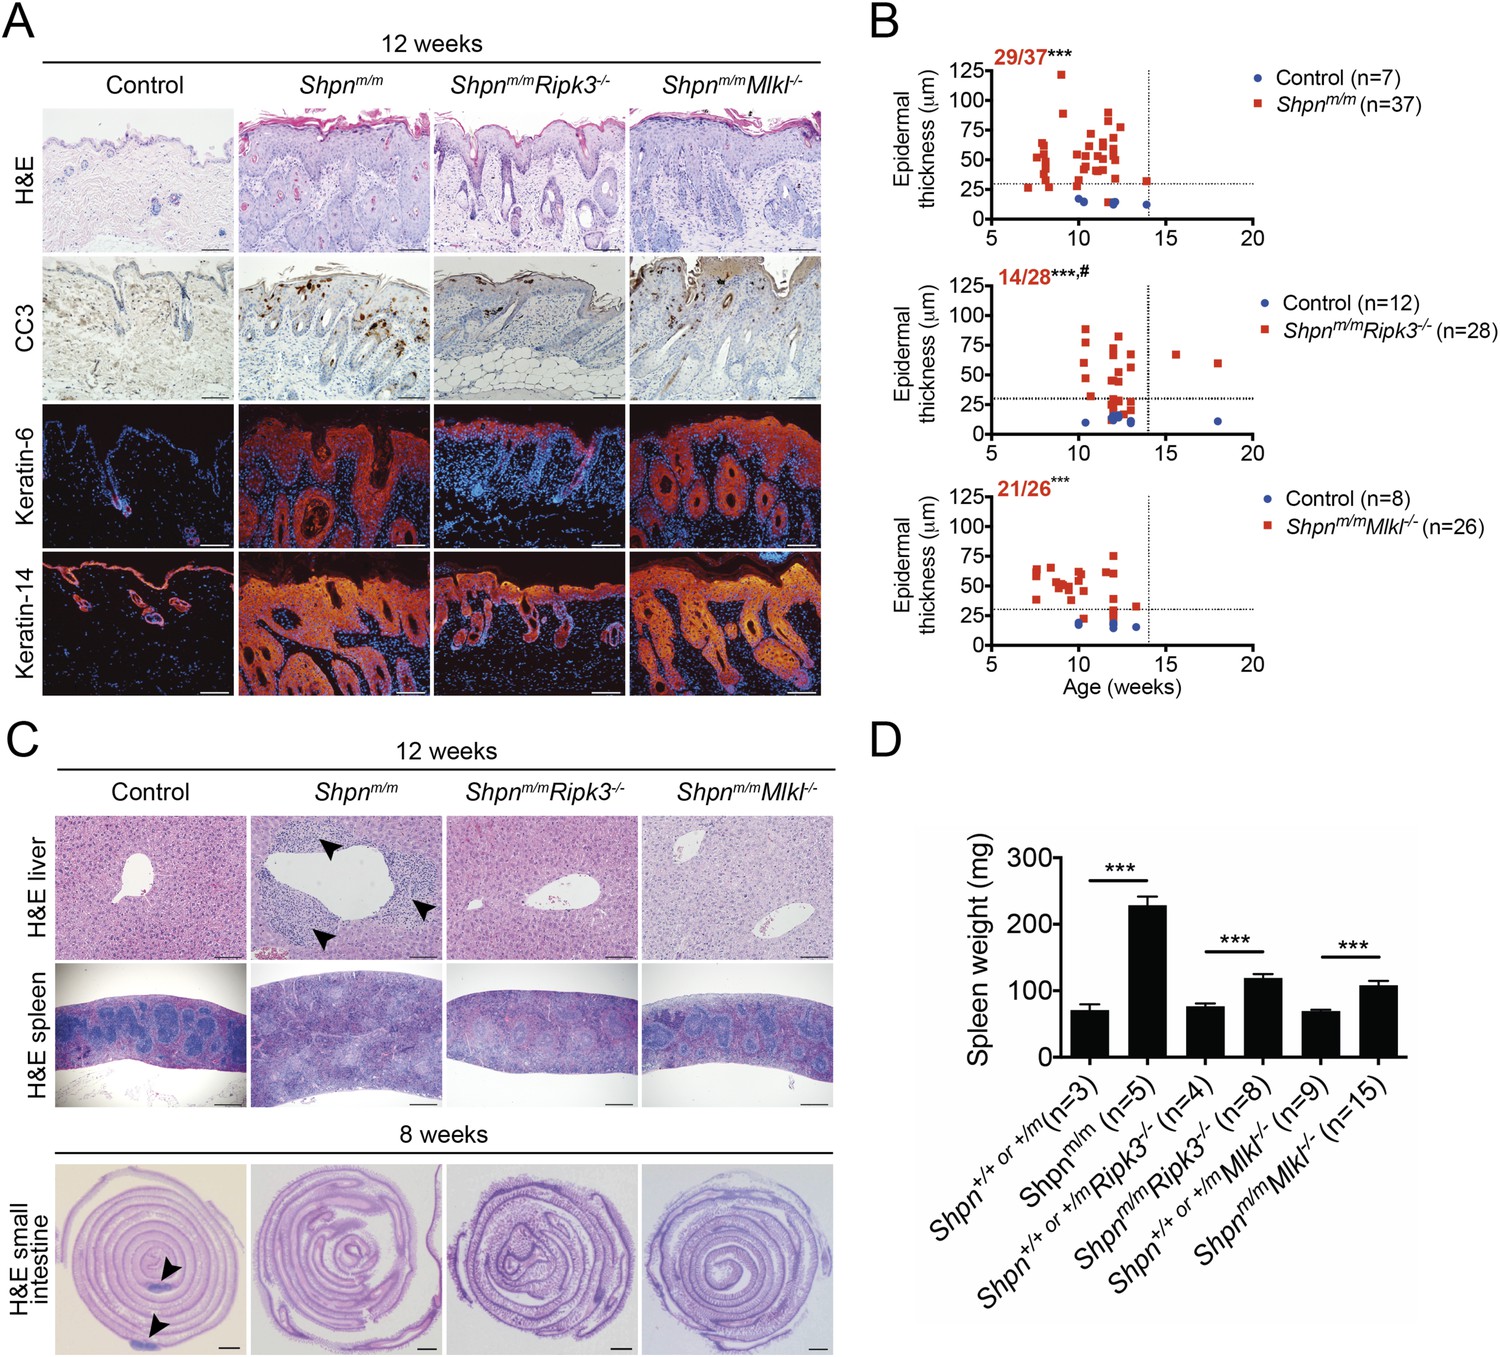
Ripk3 deficiency slightly delays cpdm dermatitis onset, and Ripk3 and Mlkl deficiency partially protects against the cpdm splenic phenotype and markedly attenuates liver inflammation.
(A) Histological and immunofluorescence skin analysis. (B) Epidermal thickness of mice of indicated age and genotypes determined as in Figure 1B, by an investigator blinded to genotype. Top panel is a repeat of data in 1B for reference purposes only. Dotted lines are drawn at 30 µm and 14 weeks. Red numbers correspond to proportion of Shpnm/m mice with epidermal thickness >30 µm at < 14 weeks of age (upper left quadrant). Control mice are Shpn+/+ or +/m, Shpn+/+ or +/mRipk3−/−, and Shpn+/+ or +/mMlkl−/− in upper, middle and lower graphs, respectively. *** Significantly different to control group (Fisher's exact test), p ≤ 0.005, # significantly different to Shpnm/m mice (Fisher's exact test), p ≤ 0.05. (C) Histological analysis of spleen, liver, and small intestine. Black arrows in liver image points to areas of periportal inflammation. Black arrows in small intestine image points to Peyer's patches. (D) Average spleen weights of mice of indicated genotypes. Spleen weights were taken from 12-week-old mice, or younger mice if they required euthanasia due to their dermatitis. Data are represented as mean + SEM, ***p ≤ 0.005. (A and C) Control mice are Shpn+/+ or +/m, n ≥ 3 mice analyzed each genotype or group. Scale bars: skin and liver 100 µm, spleen 500 µm, small intestine 1 mm. H&E: hematoxylin and eosin.
Figure 8
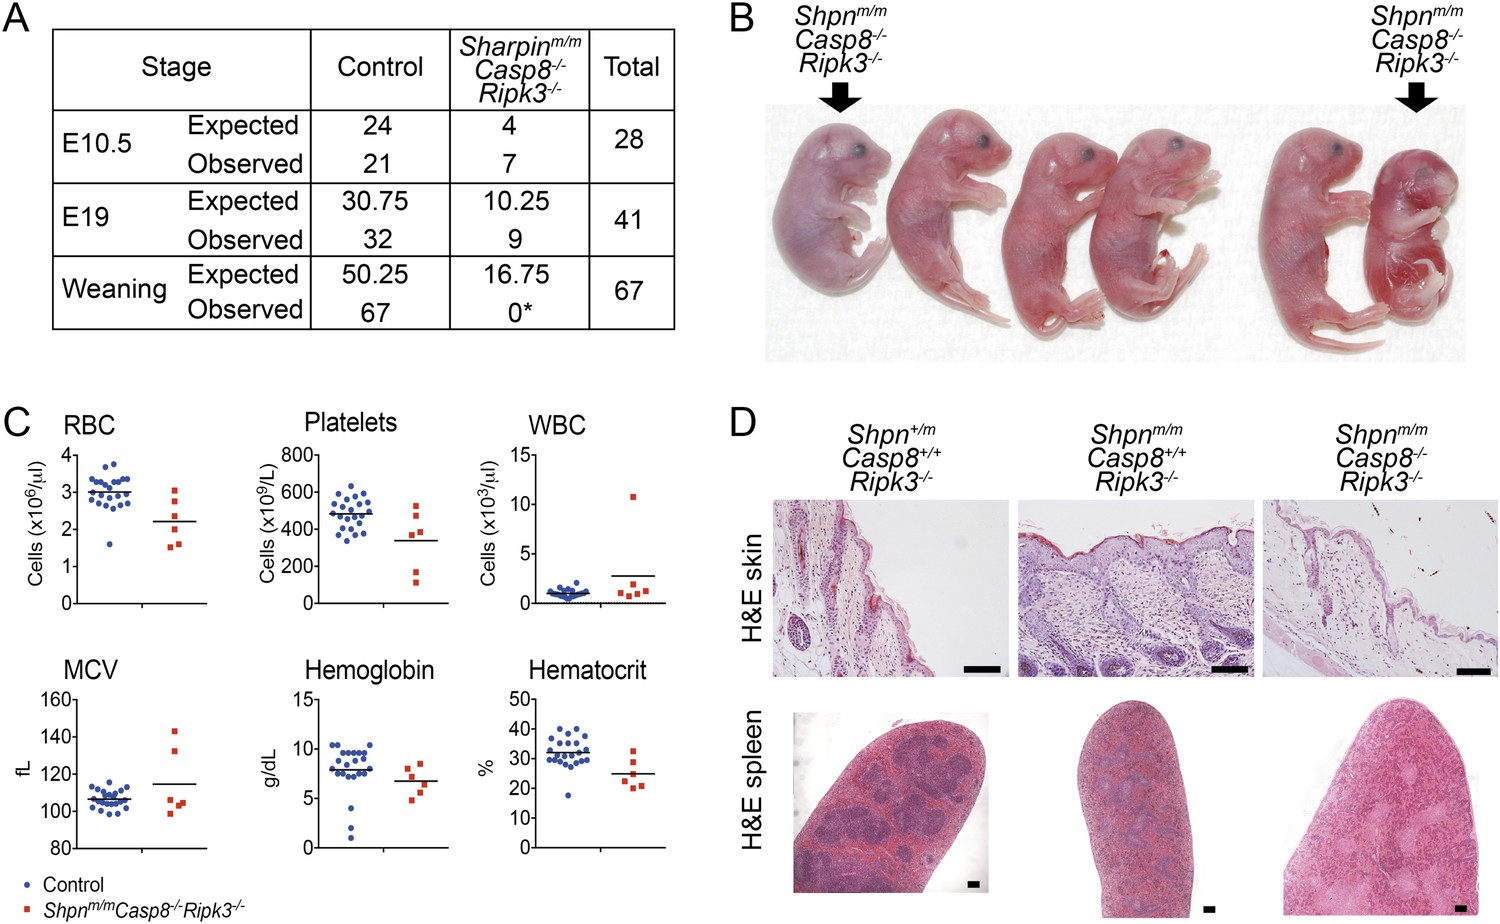
Shpnm/mCasp8−/−Ripk3−/− mice are prone to perinatal lethality.
(A) Table of segregation of expected and observed genotypes from Shpn+/mCasp8-/-Ripk3−/− or Shpnm/mCasp8+/-Ripk3−/− intercrosses at various developmental stages. E10.5 controls: Shpn+/+ or +/mCasp8-/-Ripk3−/−; E19 controls: Shpnm/mCasp8+/+ or +/−Ripk3−/−; weaning controls: Shpn+/+ or +/mCasp8−/−Ripk3−/− or Shpnm/mCasp8+/+ or +/−Ripk3−/−. *Significantly different to expected value, Fisher's exact test p < 0.0005. (B) Photos of E19 embryos obtained by Caesarian section. The Shpnm/mCasp8−/−Ripk3−/− mouse on the right was recovered dead, all others were alive. Other embryos are control mice: Shpnm/mCasp8+/+ or +/−Ripk3−/−. (C) ADVIA blood analysis from E19 embryos. RBC: red blood cells; WBC: white blood cells; MCV: mean cell volume. Horizontal lines depict data means. Control mice: Shpnm/mCasp8+/+ or +/−Ripk3−/−. (D) Histological analysis of tissue from 12-week-old mice of indicated genotypes. Mice were from a separate facility to those in A–C and are not included in the table in A. Two mice were analyzed for each genotype. Scale bars: skin 100 µm, spleen 50 µm.
Figure 9 with 1 supplement

Ripk3 deletion and Casp8 heterozygosity markedly delays emergence of cpdm dermatitis and liver inflammation and restores Peyer’s patches.
(A) Representative photos of mice of indicated genotypes and age. Three Shpnm/mCasp8+/-Ripk3−/− mice were analyzed at 45 weeks and one at 67 weeks with no detectable dermatitis, however another mouse developed dermatitis by 42 weeks of age. (B) Histological and immunofluorescence skin analysis. (C) Histological analysis of spleen, liver, and small intestine. Black arrows in liver image point to areas of periportal inflammation. Black arrows in small intestine images point to Peyer's patches. (D) Epidermal thickness of mice of indicated age and genotypes measured as described in Figure 1B. Top panel is a repeat of data in 1B for reference purposes only. Dotted lines are drawn at 30 µm and 14 weeks. Red numbers correspond to proportion of Shpnm/m mice with epidermal thickness >30 µm at < 14 weeks of age (upper left quadrant). Control mice are Shpn+/+ or +/m and Shpn+/+ or +/mCasp8+/−Ripk3−/− in upper and lower graphs, respectively. *** Significantly different to control group (Fisher's exact test), p ≤ 0.005. (E) Average spleen weights of mice of indicated genotypes. Spleen weights were taken from 12-week-old mice, or younger mice if they required euthanasia due to their dermatitis. Data are represented as mean + SEM, ***p ≤ 0.005. (B and C) Control mice are Shpn+/+ or +/m, n ≥ 3 mice analysed each genotype or group. Scale bars: skin and liver 100 µm, spleen 500 µm, small intestine 1 mm. H&E: hematoxylin and eosin.
Figure 9—figure supplement 1
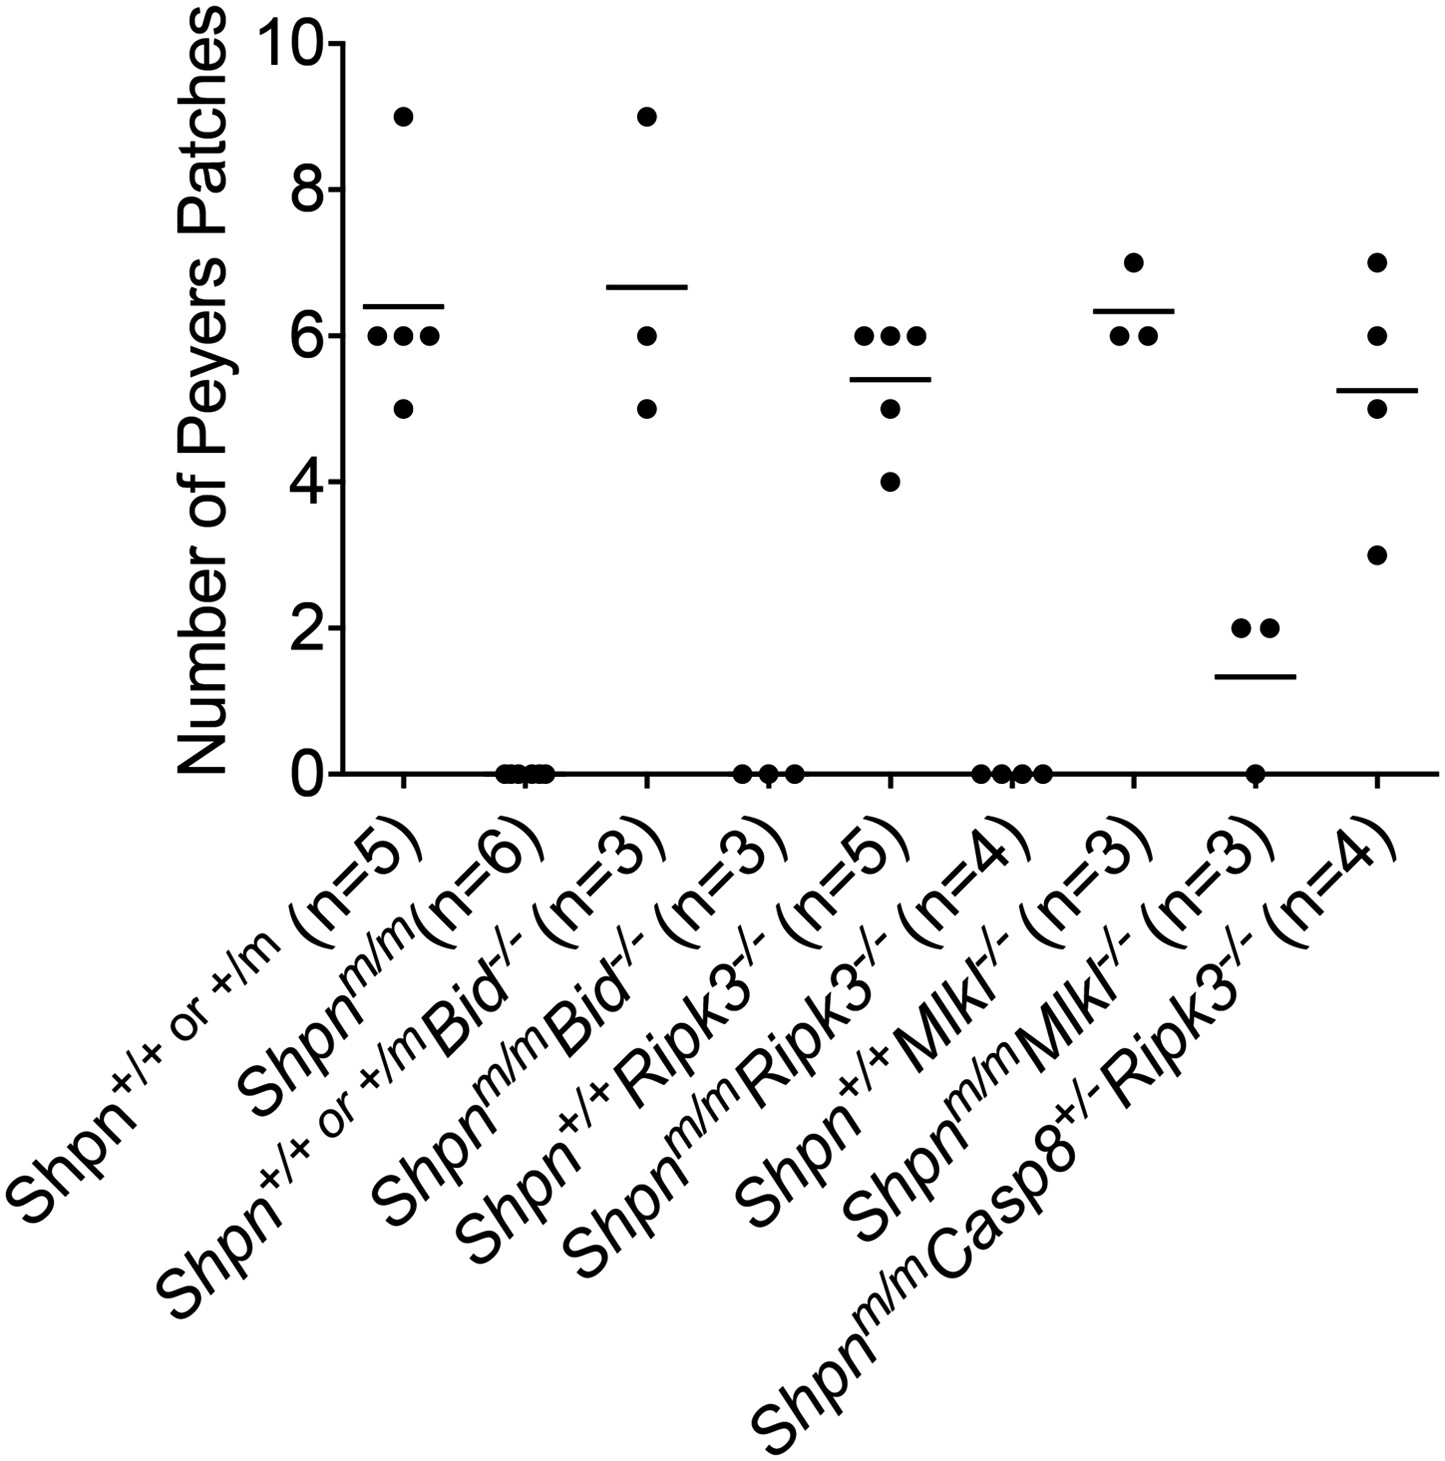
Restoration of Peyer's patches in 8-week-old Shpnm/mCasp8+/−Ripk3−/− mice.
Numbers of Peyer's patches per small intestine counted from 8-week-old mice of indicated genotypes. Horizontal lines depict data means.
Figure 10
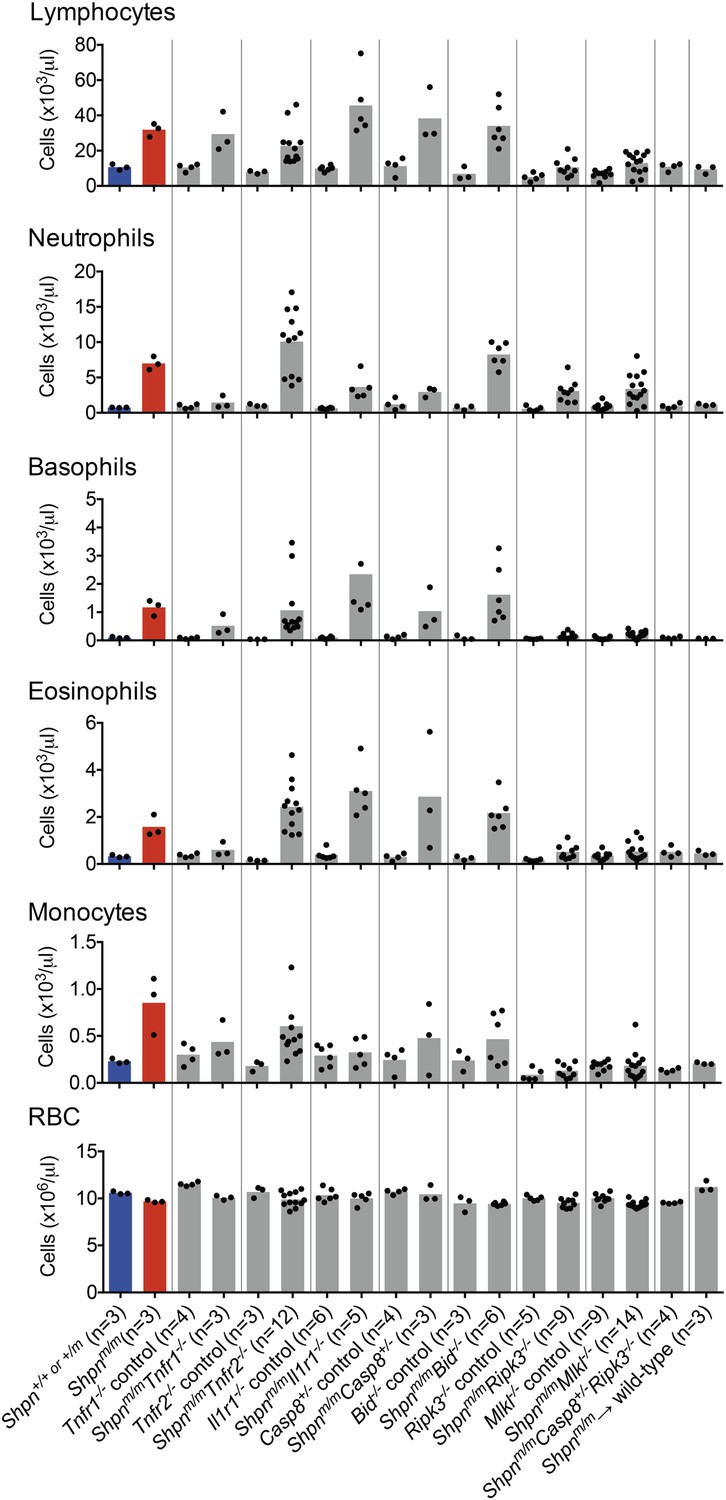
Peripheral blood counts from various crosses.
Peripheral blood was collected from 11–14-week-old mice (reconstituted mice: Shpnm/m → wild type were 12 months old and Tnfr1−/− mice were 35 weeks old), or younger if the mice were euthanized due to severe dermatitis. Shpn+/+ or +/m and Shpnm/m mice are highlighted in blue and red for reference purposes. Blood was analyzed using an ADVIA 2120 hematological analyzer. RBC: red blood cells. Horizontal lines depict data means. Control mice are Shpn+/+ or +/m, for example Tnfr1−/− control mice are Shpn+/+ or +/mTnfr1−/−.
Download links
A two-part list of links to download the article, or parts of the article, in various formats.
Downloads (link to download the article as PDF)
Open citations (links to open the citations from this article in various online reference manager services)
Cite this article (links to download the citations from this article in formats compatible with various reference manager tools)
TNFR1-dependent cell death drives inflammation in Sharpin-deficient mice
eLife 3:e03464.
https://doi.org/10.7554/eLife.03464


