Calcium specificity signaling mechanisms in abscisic acid signal transduction in Arabidopsis guard cells
- University of California, San Diego, United States
Figures
Figure 1 with 1 supplement
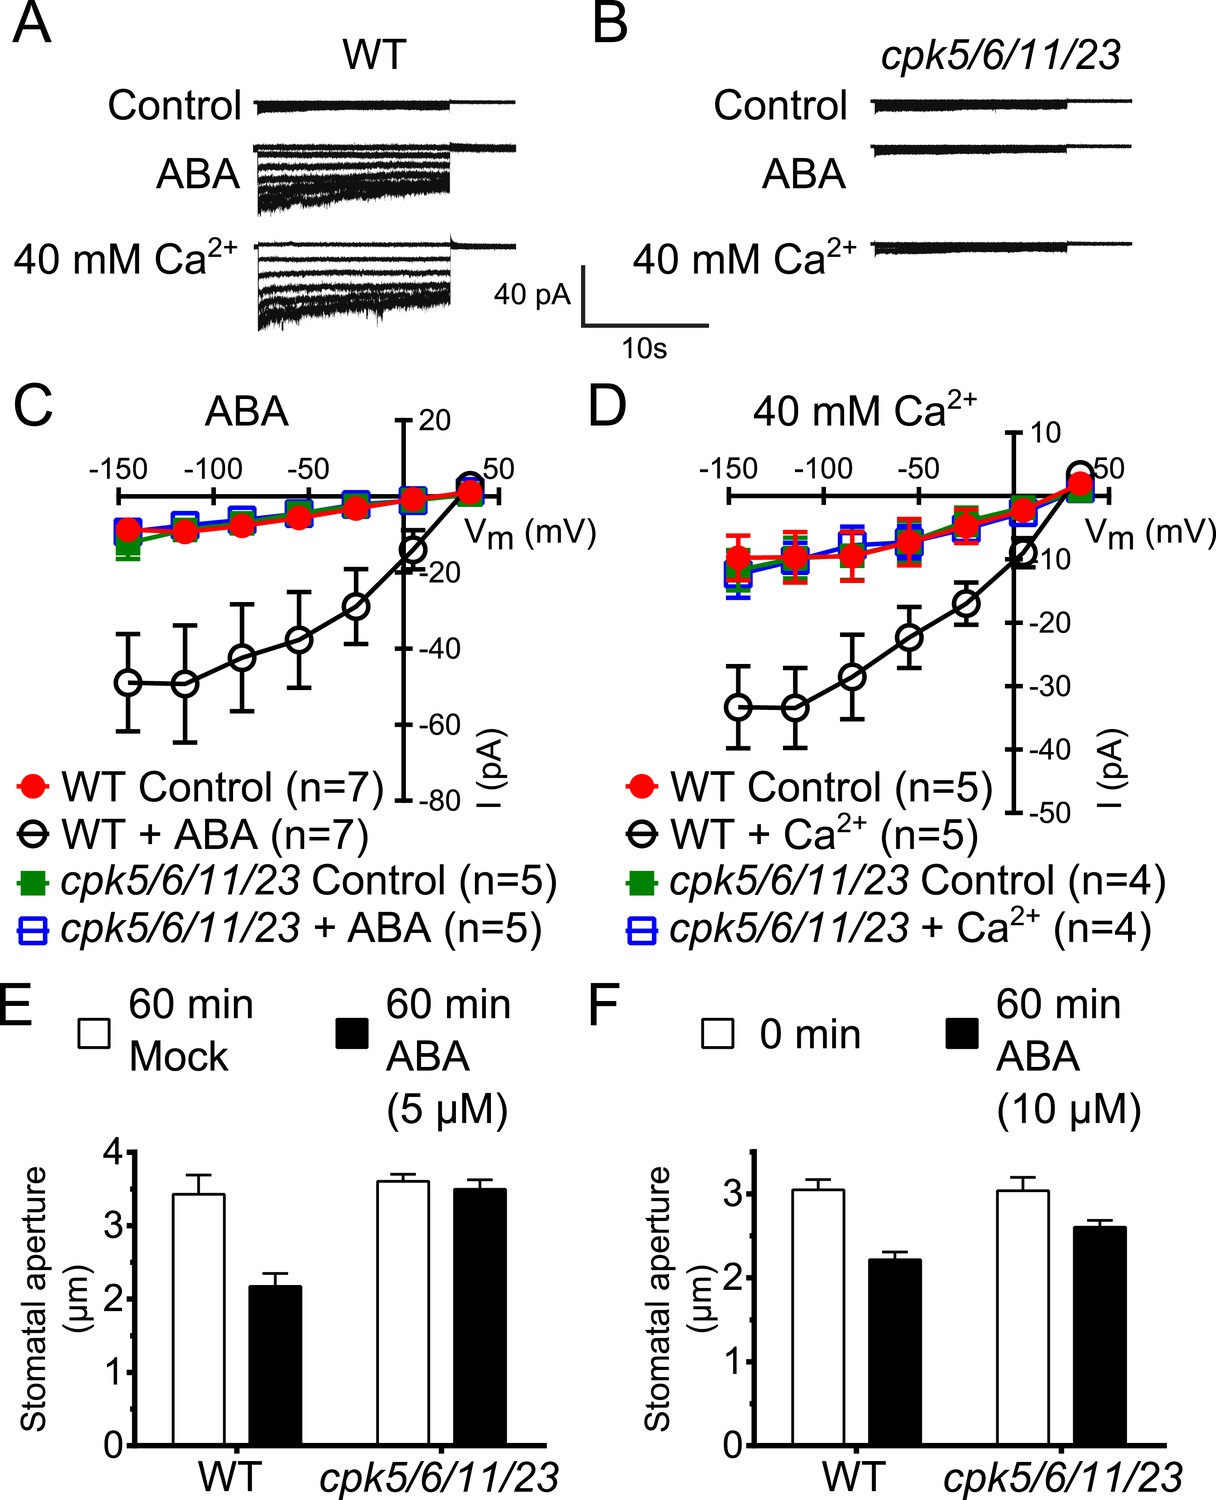
Calcium-dependent protein kinase (CPK) quadruple loss of function mutants show abscisic acid (ABA) and Ca2+ insensitive S-type anion current activation and are impaired in stomatal closing.
(A–D) Intracellular Ca2+-activation of S-type anion channels enabled by pre-exposure to ABA (A and C) or high external Ca2+ pre-shock (Allen et al., 2002) (B and D) is strongly impaired in cpk5/6/11/23 guard cells at 2 μM [Ca2+]cyt. (E and F) 5 μM ABA-application to intact leaves shows impaired ABA-induced stomatal closing in cpk5/6/11/23 mutant plants (E; p = 0.51 Mock-treated cpk quadruple mutant vs ABA-treated cpk quadruple mutant stomata; unpaired t-test; n = 6 experiments and >51 total stomata per group). Application of 10 μM ABA results in a partially reduced average stomatal response (F, p = 0.07; 0 min ABA-exposed cpk5/6/11/23 mutant leaves compared to 60 min ABA-exposed cpk5/6/11/23 mutant leaves; Student's t-test; n = 3 experiments and >59 total stomata per group). Representative whole cell currents (A and B), average steady-state current–voltage relationships ±SEM (C and D), average guard cell apertures ±SEM (E and F) are shown. Measurements shown in Figure 1C and Figure 1—figure supplement 1D were acquired under the same experimental condition. Therefore, WT Control and WT + ABA control data are the same in both figures. Several error bars are not visible, as these were smaller than the illustrated symbols.
Figure 1—figure supplement 1
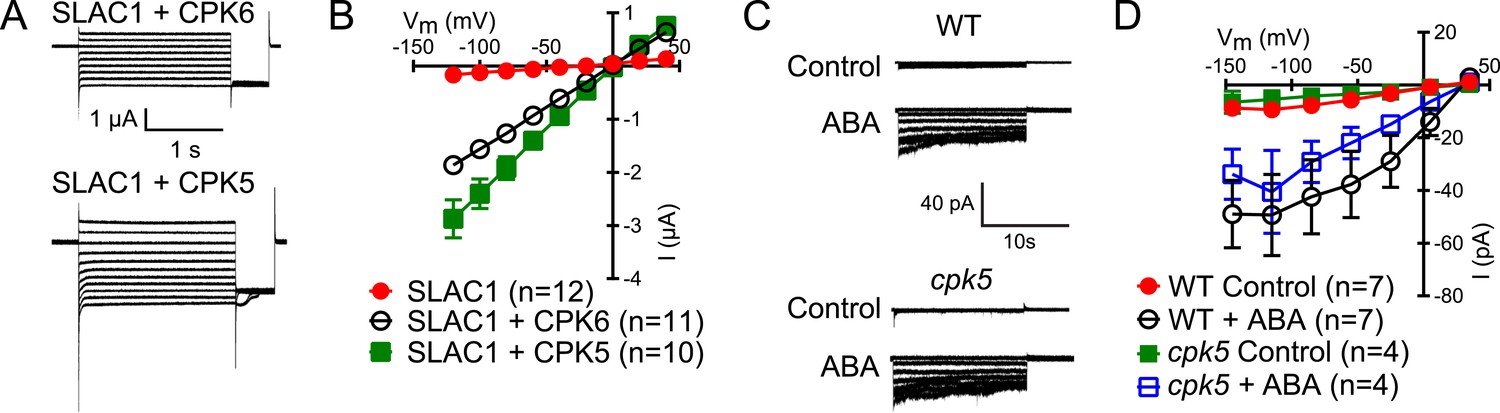
CPK5 activates SLAC1 in Xenopus oocytes and ABA-activation of S-type anion currents in cpk5 single mutant is not impaired.
(A and B) Whole cell currents were measured in Xenopus oocytes expressing SLAC1 together with CPK5 and, as a control, CPK6. Large Cl− currents show that CPK5 is capable of activating SLAC1. (C and D) ABA activates S-type anion currents in cpk5 mutant guard cells similar to ABA-activation of S-type anion currents in WT guard cells. Representative current traces (A and C), average steady-state current–voltage relationships (±SEM), and numbers of individual cells are shown (B and D). Note that experiments shown in Figure 1C and Figure 1—figure supplement 1D were acquired under the same experimental conditions. Therefore WT Control and the WT + ABA control data are the same in both figure panels. Several error bars are not visible, as these were smaller than the illustrated symbols.
Figure 2 with 1 supplement
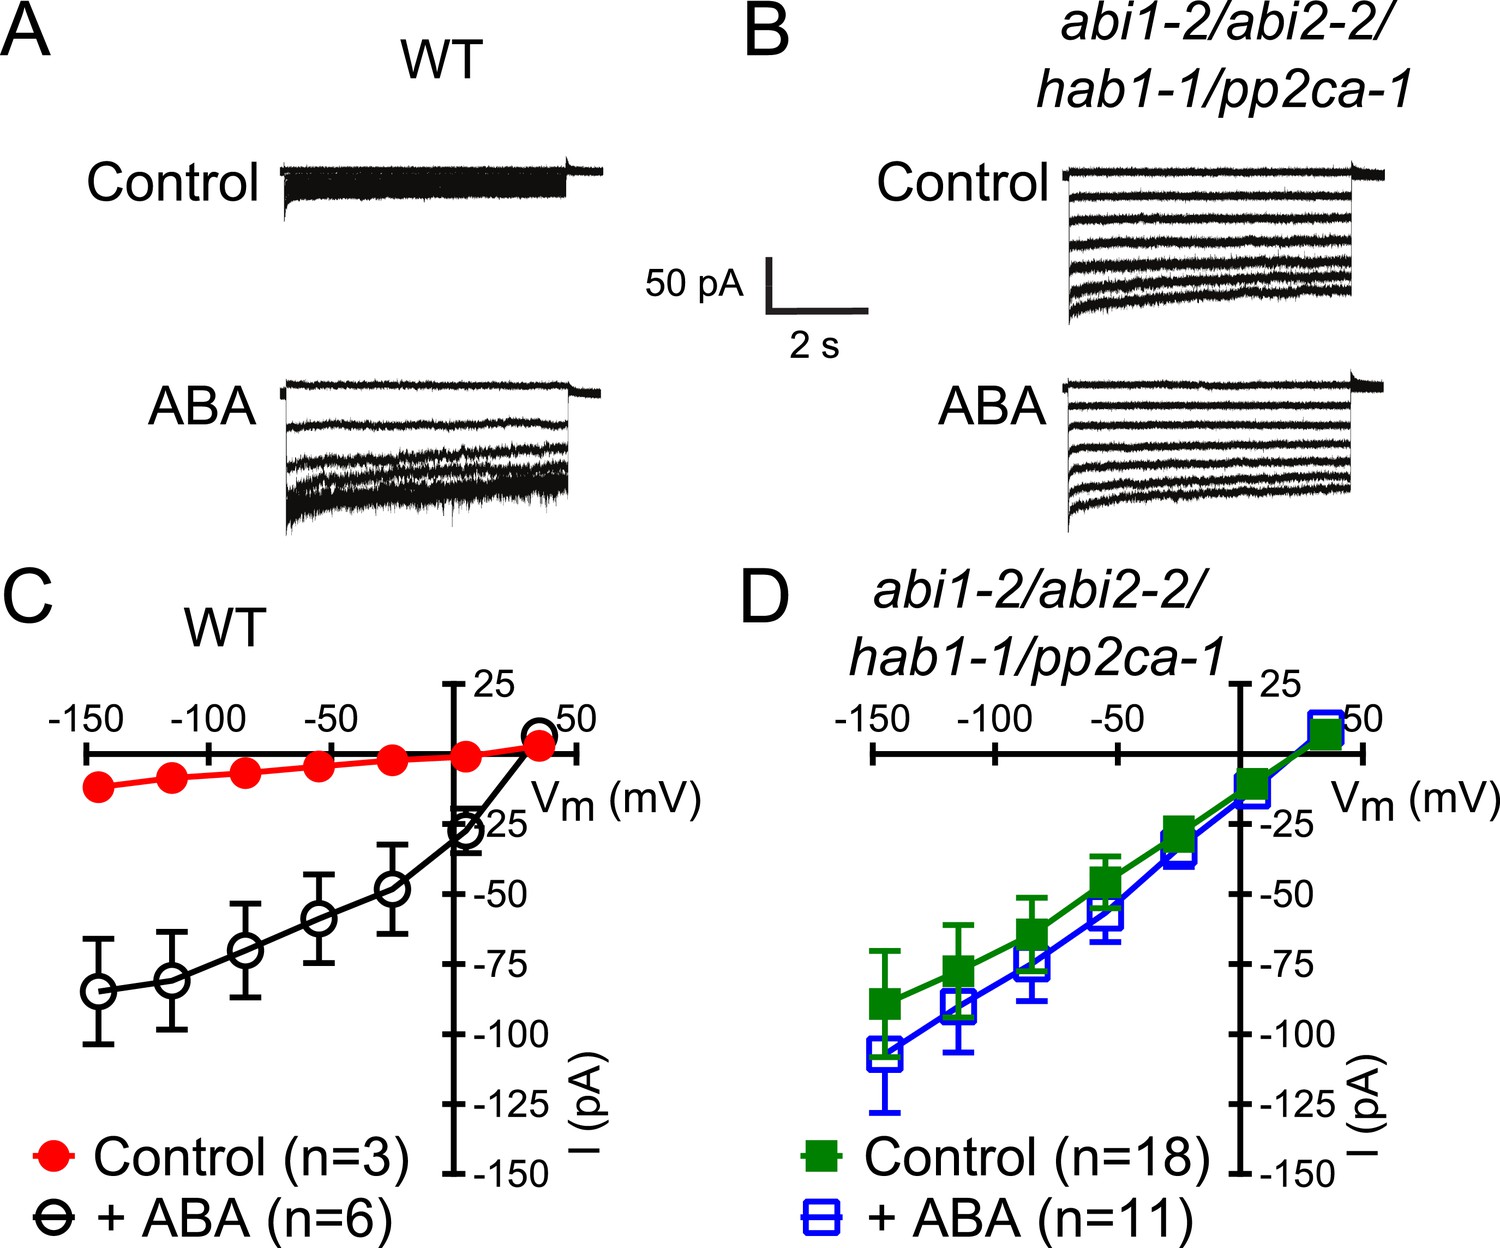
In protein phosphatase 2C (PP2C) quadruple mutant plants, Ca2+ activation of S-type anion currents is constitutively primed.
(A and C) 2 μM [Ca2+]cyt activates S-type anion currents in WT if the guard cells were pre-exposed to ABA. (B and D) In PP2C quadruple mutant guard cells ABA pre-exposure is not required for 2 μM [Ca2+]cyt-activation of S-type anion currents. Average steady-state current–voltage relationships ±SEM, guard cell numbers (C and D), and representative whole cell currents (A and B) are presented. Several error bars are not visible, as these were smaller than the illustrated symbols.
Figure 2—figure supplement 1
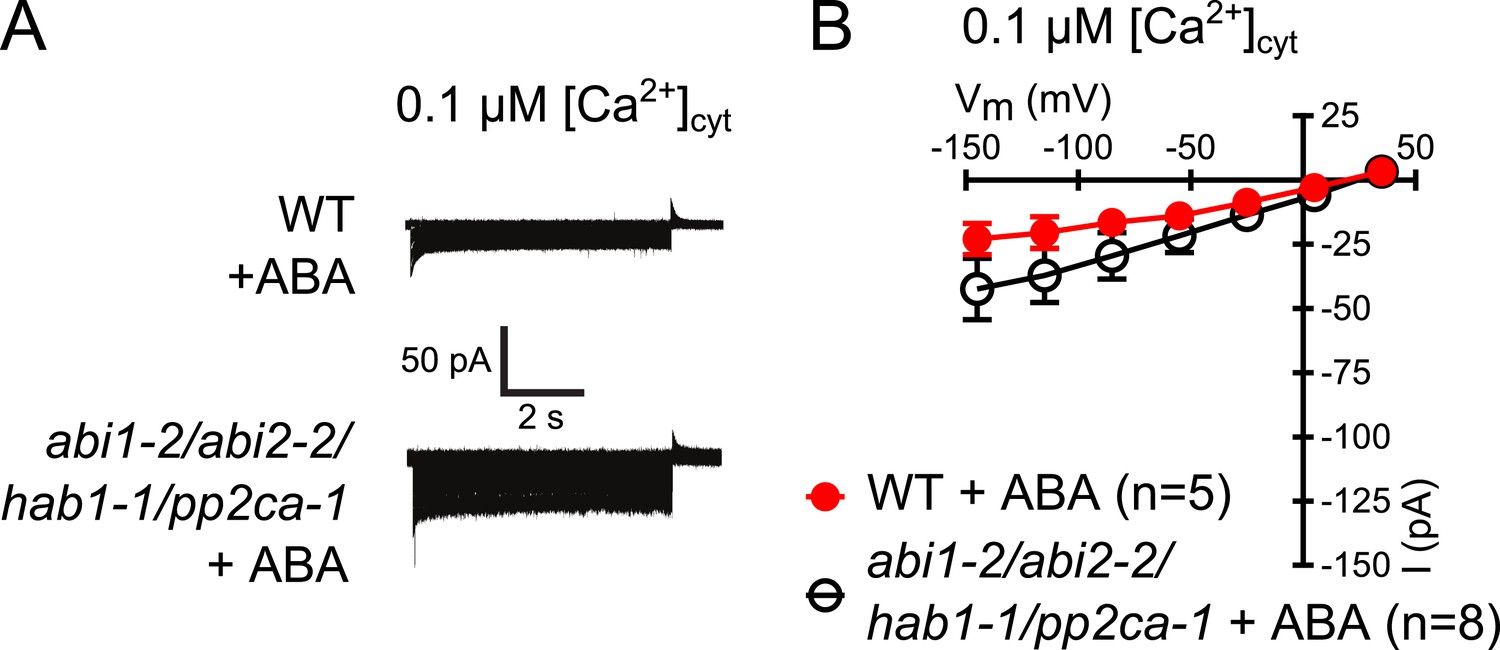
Analysis of ABA activation of S-type anion currents in PP2C quadruple mutant guard cells at low [Ca2+]cyt.
(A and B) ABA application in WT and abi1-2/abi2-2/hab1-1/pp2ca-1 guard cells with [Ca2+]cyt buffered to a resting level of 0.1 μM does not result in large S-type anion current activation. Typical current traces (A), average steady-state currents in response to applied voltages (±SEM), and numbers of individual measured guard cells are shown (B). Several error bars are not visible, as these were smaller than the illustrated symbols.
Figure 3 with 5 supplements
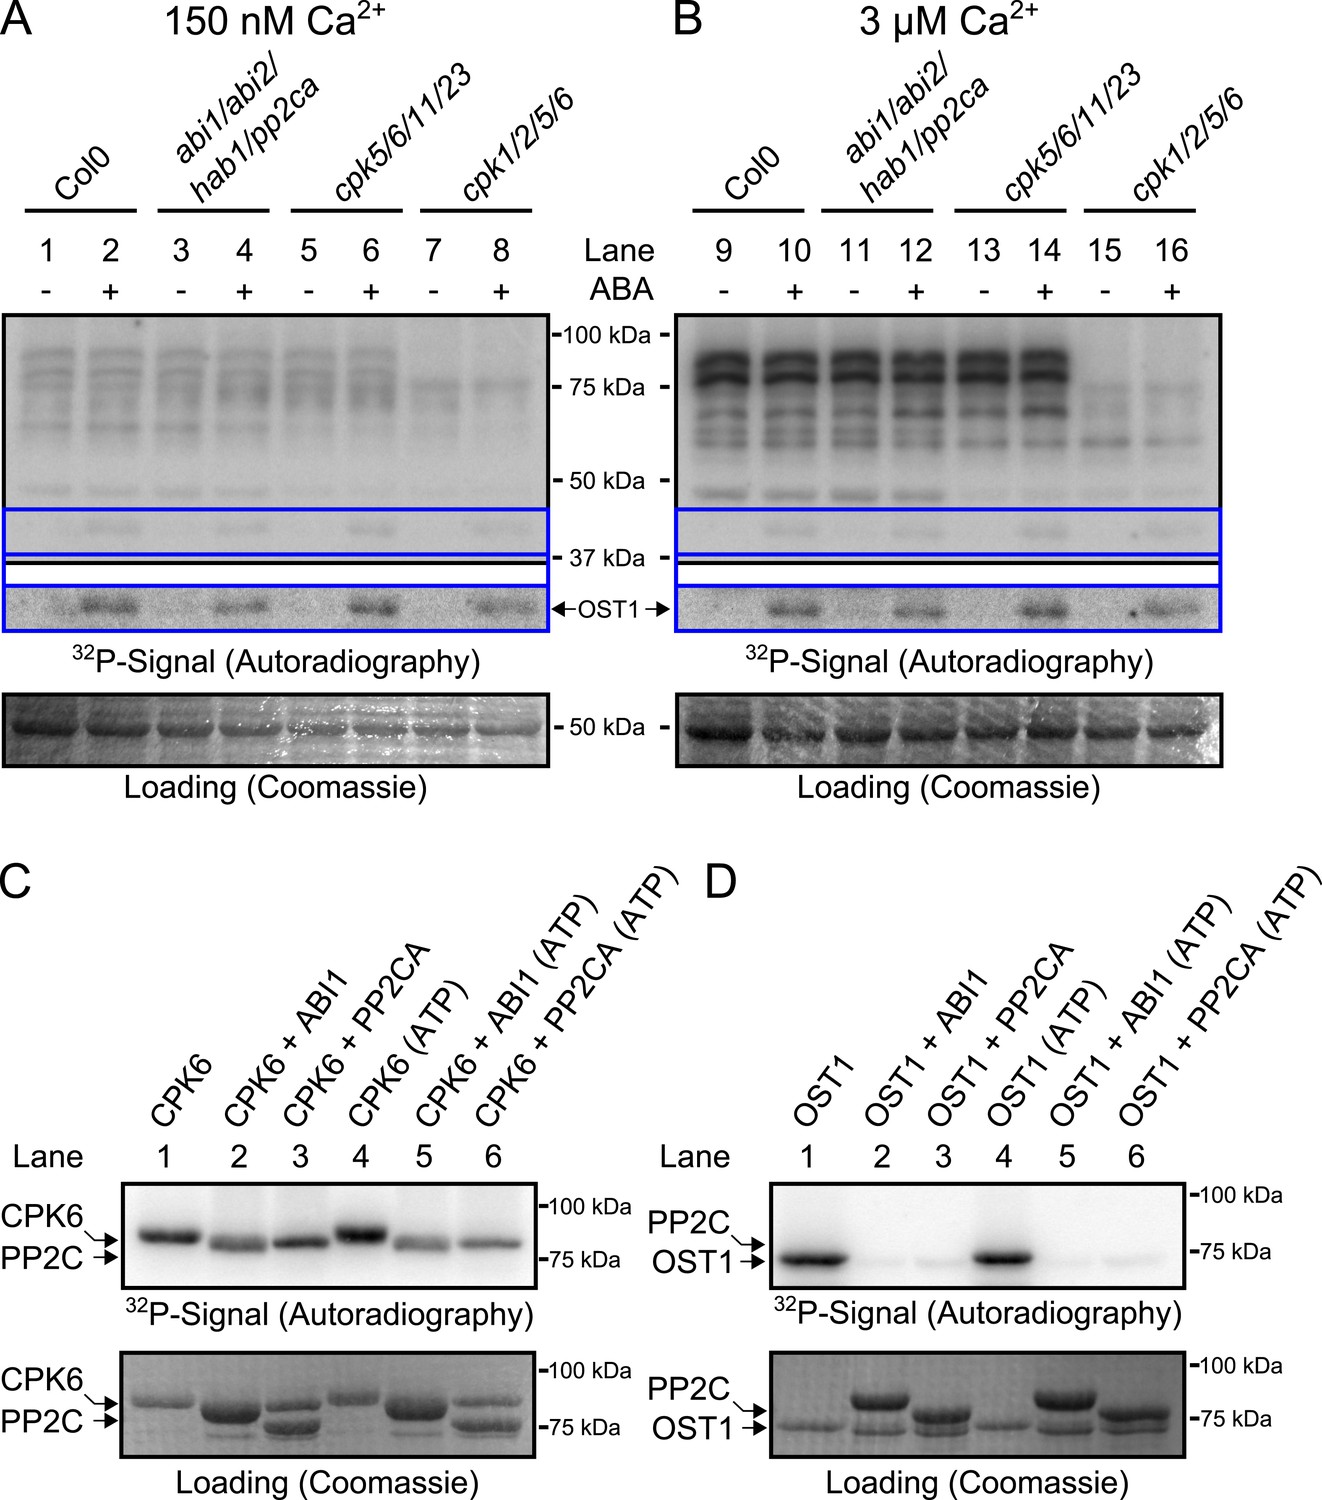
CPK activity is not changed by ABA or hyper-activated in pp2c quadruple mutants at defined Ca2+ concentrations.
(A and B) In-gel kinase assays with Histone-III as substrate for whole plant protein extracts show (B) 3 μM Ca2+-activated trans-phosphorylation kinase activities independent of application of 50 μM ABA (lanes 9 and 10). In contrast, ABA activation of OST1 is clearly visible (lanes 1–2 and 9–10 at ∼41 kDa; lower ‘OST1’ inset shows the same signal optimized autoradiography at the ∼41 kDa region and the corresponding gel regions are indicated by blue lines; see ‘Materials and methods’). Disruption of four PP2C genes (ABI1, ABI2, HAB1, and PP2CA) does not result in constitutive Ca2+-activated and OST1 kinase activities (lanes 3–4 and 11–12). In-gel kinase activities of two independent CPK quadruple mutant lines indicate that the Ca2+-activated kinase signals are CPK-derived (compare lanes 9–10 with 13–16 in B and see Figure 3—figure supplement 1); predicted MWs for CPK1, CPK2, CPK5, CPK6, CPK11, and CPK23 are 68.3 kDa, 72.3 kDa, 62.1 kDa, 61.1 kDa, 55.9 kDa, 58.7 kDa, respectively. (C and D) In-gel protein kinase assays with recombinant proteins show that incubation of the protein kinases with the PP2Cs ABI1 and PP2CA does (C) not change CPK6 activity while (D) OST1 activity is strongly down-regulated by PP2Cs. Each experiment has been repeated at least three times with similar results.
Figure 3—figure supplement 1
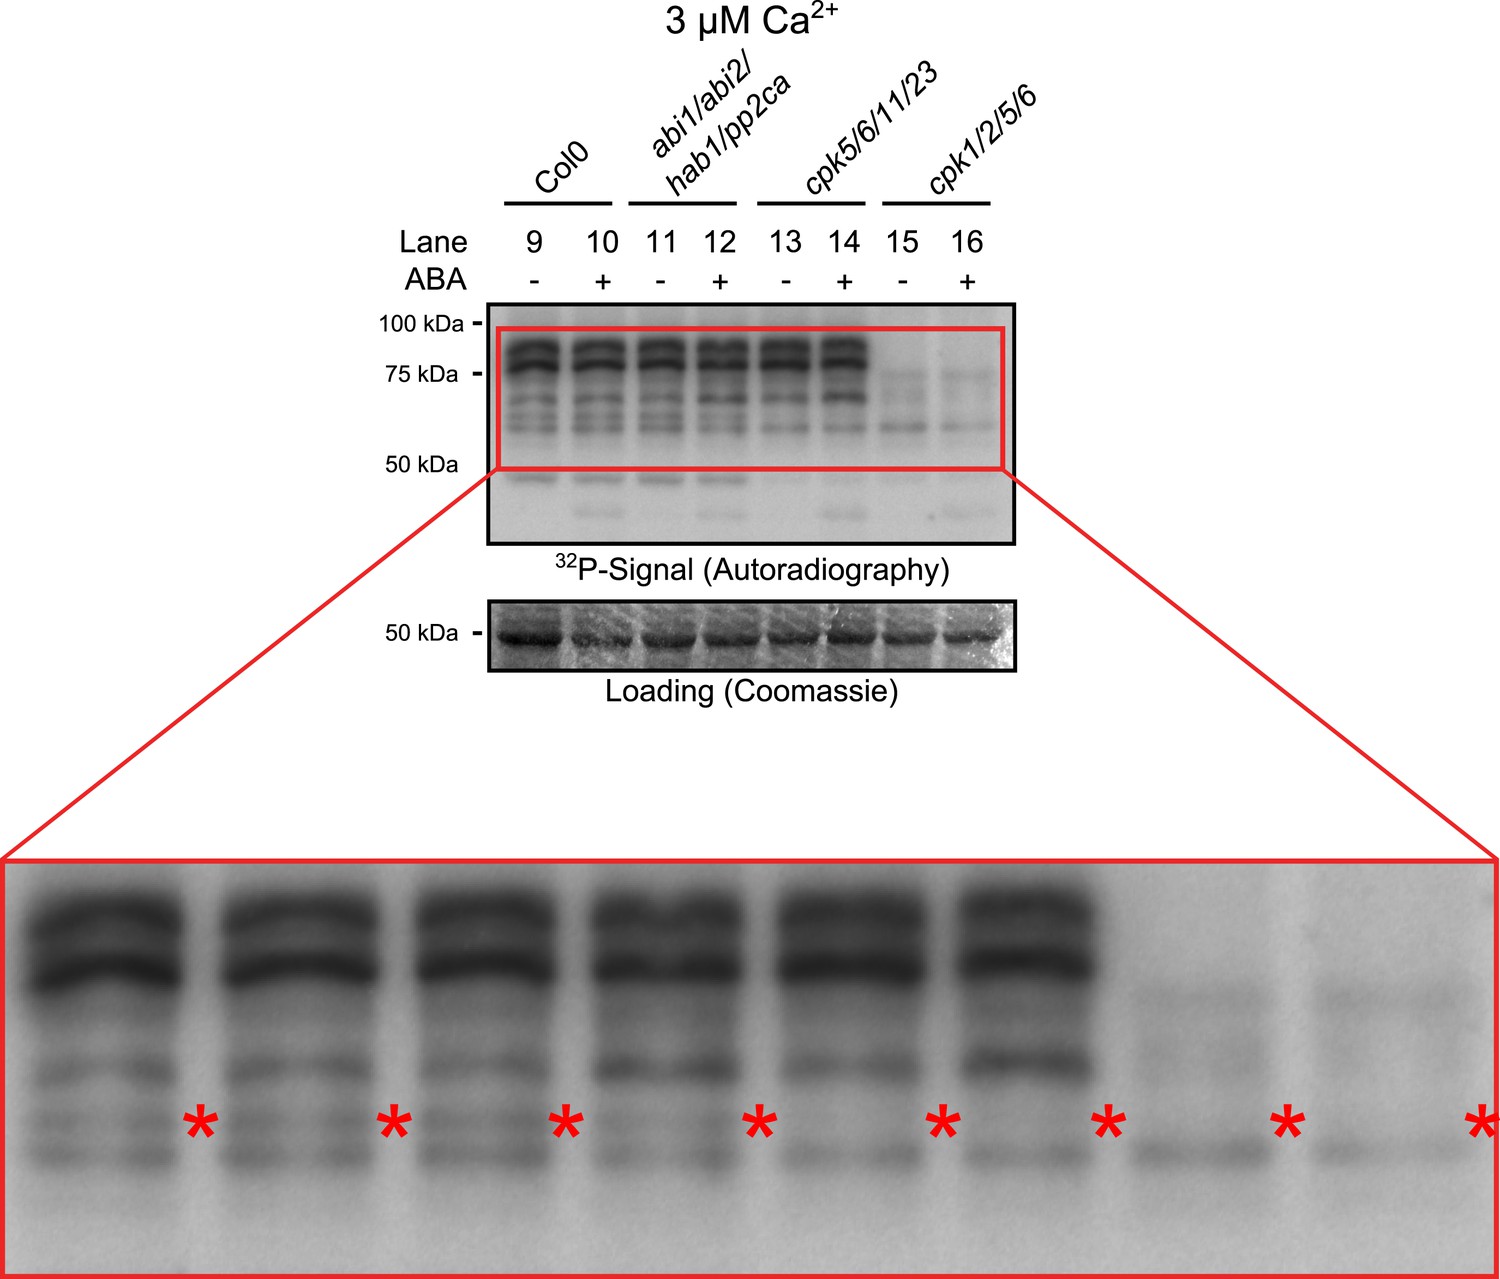
Close up view of Ca2+-activated kinase activities.
The region of predicted molecular weights of CPKs (CPK1, CPK2, CPK5, CPK6, CPK11, and CPK23 are 68.3 kDa, 72.3 kDa, 62.1 kDa, 61.1 kDa, 55.9 kDa, 58.7 kDa, respectively) of the same autoradiograph which is shown in Figure 3B is magnified to increase the visibility of the individual bands. The apparent loss of the prominent bands with high molecular weight in cpk1/2/5/6 plants could correspond to CPK1 and CPK2 protein isoforms which possess the largest predicted molecular weights of all CPKs. Note that bands that run at a higher molecular weight than the predicted mass could be due to post-translational modifications. The faint band indicated with red asterisks might correspond to the closely related CPK5 and CPK6 as it is not clearly resolved in both mutants and also runs at the expected molecular weight.
Figure 3—figure supplement 2
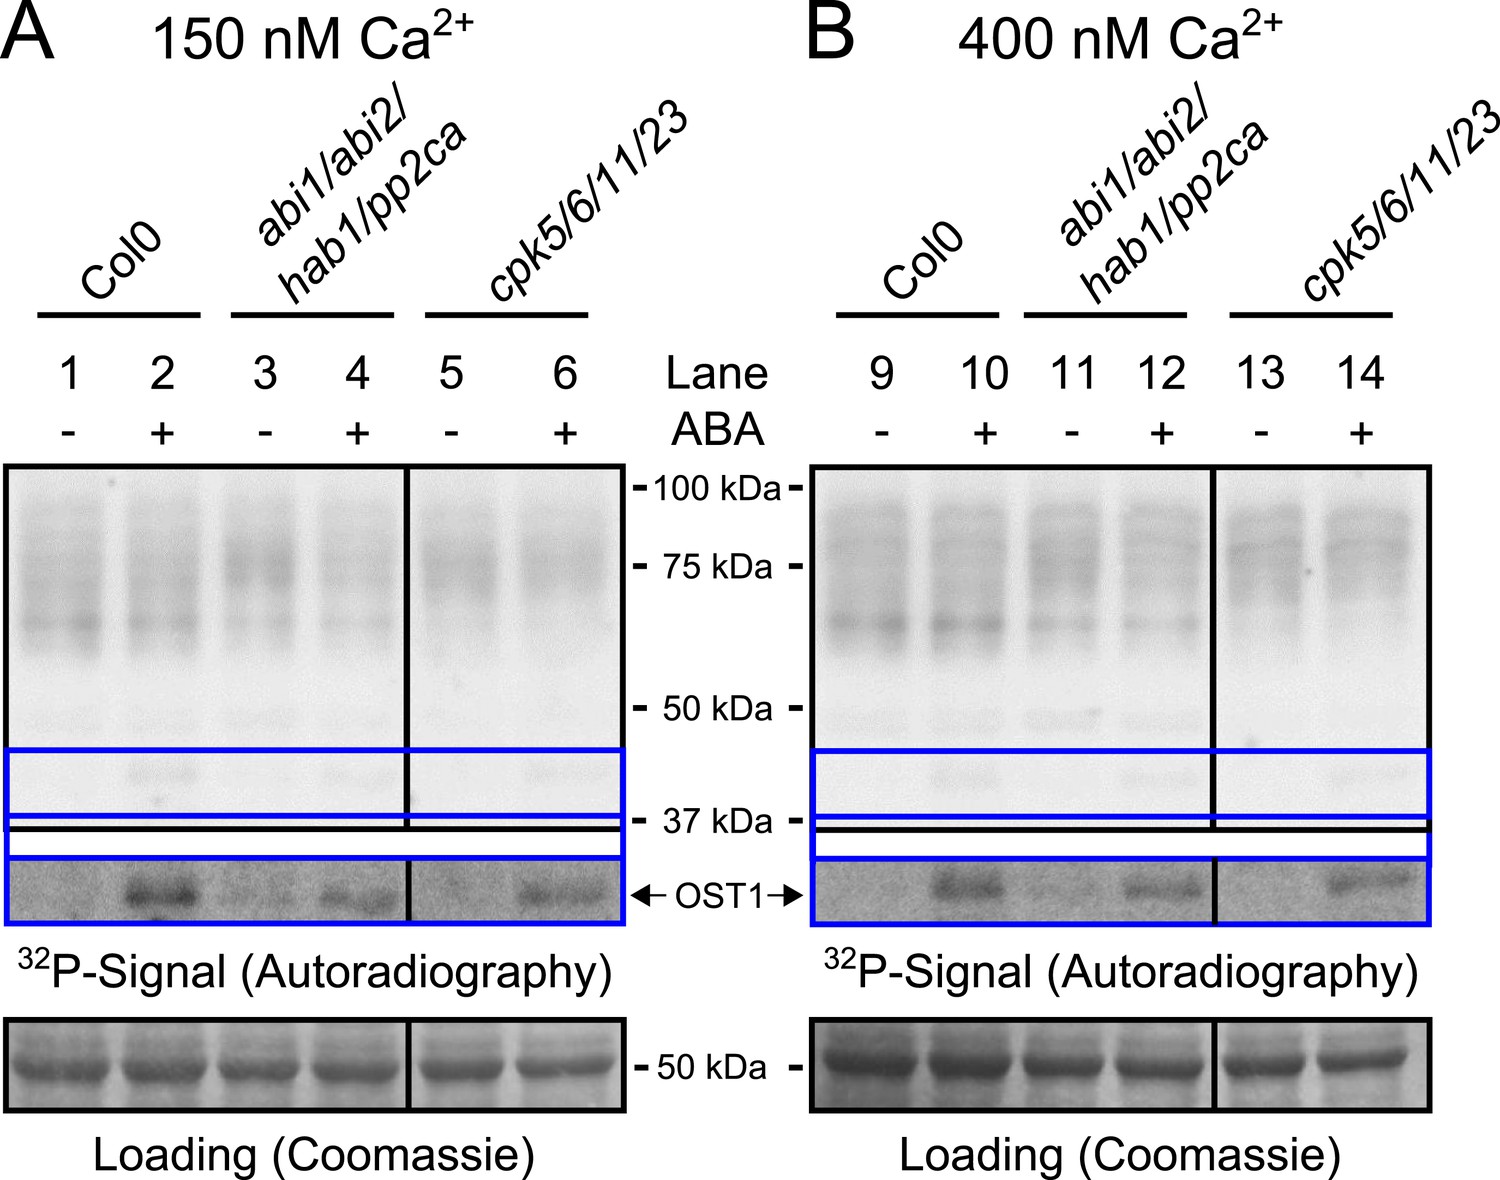
Protein kinase activities are not altered by ABA-application at 150 nM and 400 nM free Ca2+.
(A and B) Whole plant protein extracts were analyzed in in-gel protein kinase assays with the free Ca2+ concentration buffered to either 150 nM or 400 nM. No differences in the band pattern could be found in response to ABA at these buffered free Ca2+ concentrations (A and B). The presence of 400 nM free Ca2+ did not enhance ABA activation of OST1 (lower inset ‘OST1’ in A and B; lower ‘OST1’ inset shows the same signal optimized autoradiography at the ∼41 kDa region and the corresponding gel regions are indicated by blue lines; see ‘Materials and methods’) in WT, abi1-2/abi2-2/hab1-1/pp2ca-1 or cpk5/6/11/23 plants.
Figure 3—figure supplement 3
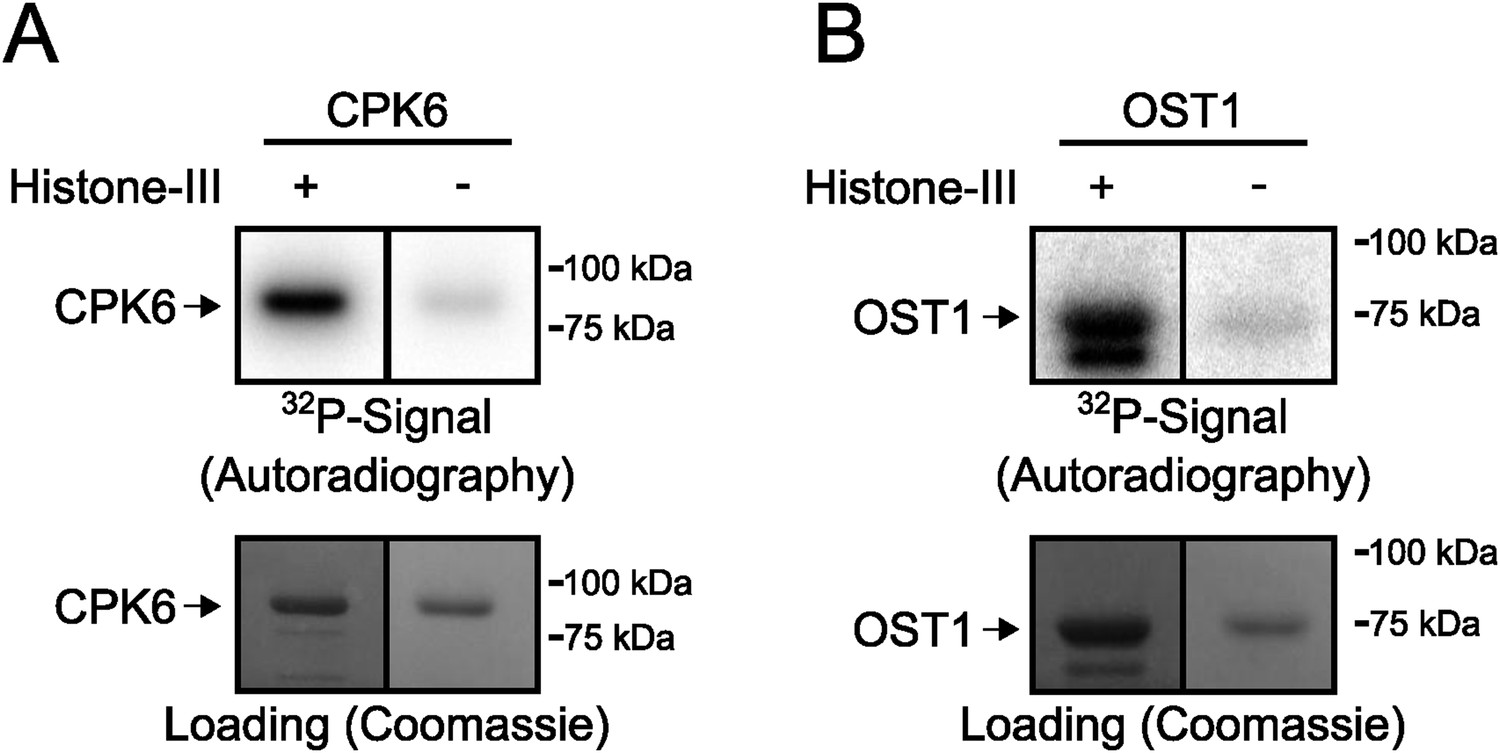
Signals in in-gel kinase assays are largely derived from kinase trans-phosphorylation activities.
(A and B) In-gel kinase assays with recombinant (A) CPK6 and (B) OST1 protein kinases in gels with (left lanes in A and B) and without (right lanes in A and B) the kinase substrate Histone-III were carried out. The signal in the gels without the substrate corresponds to auto-phosphorylation of the respective protein kinase alone and the band intensity of the gel in which Histone-III was immobilized results from auto- and trans-phosphorylation activities. Very low band intensities in the gels without Histone-III for CPK6 and OST1 (right lanes in A and B) show that signals in in-gel kinase assays using Histone-III as a substrate were mainly due to kinase trans-phosphorylation activities under the imposed conditions.
Figure 3—figure supplement 4
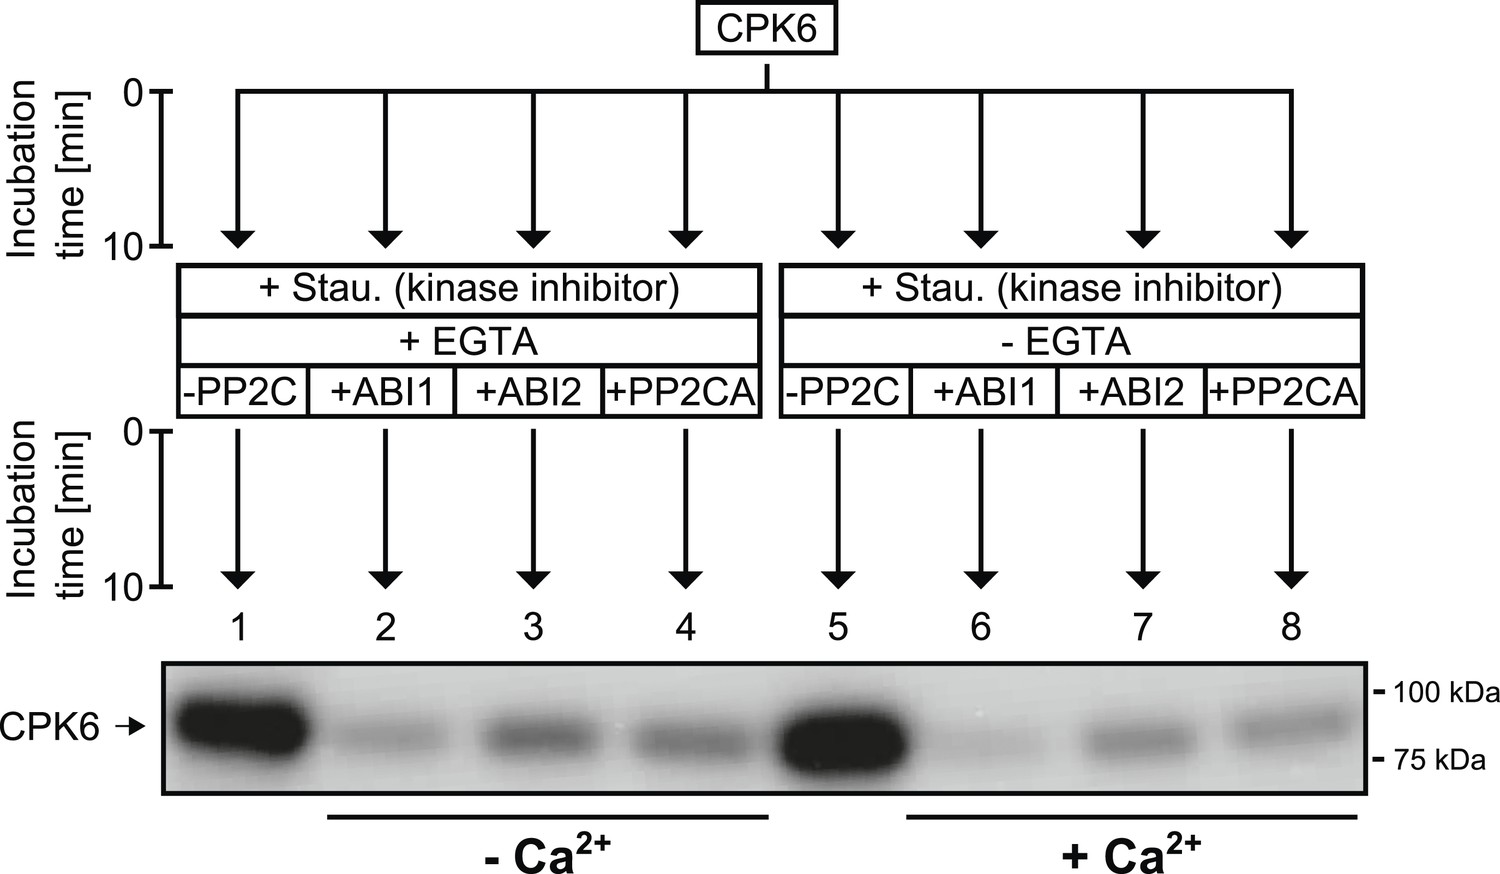
CPK6 is de-phosphorylated by the PP2Cs ABI1, ABI2, and PP2CA.
In in vitro protein kinase assays, recombinant CPK6 was incubated in the presence of 5 μM free Ca2+ which results in auto-phosphorylation signals (lanes 1 and 5). After the initial auto-phosphorylation period the kinase inhibitor staurosporine (Stau.) and the PP2Cs ABI1, ABI2, and PP2CA were added to the reactions. For the samples displayed in lanes 1–4, the Ca2+-chelator EGTA, which buffers free Ca2+ concentrations to <10 nM, was added together with staurosporine and the indicated PP2Cs. Subsequent addition of the PP2Cs ABI1, ABI2, and PP2CA resulted in decreased auto-phosphorylation signals showing that these PP2Cs de-phosphorylate CPK6 (lanes 2–4 and 6–8).
Figure 3—figure supplement 5
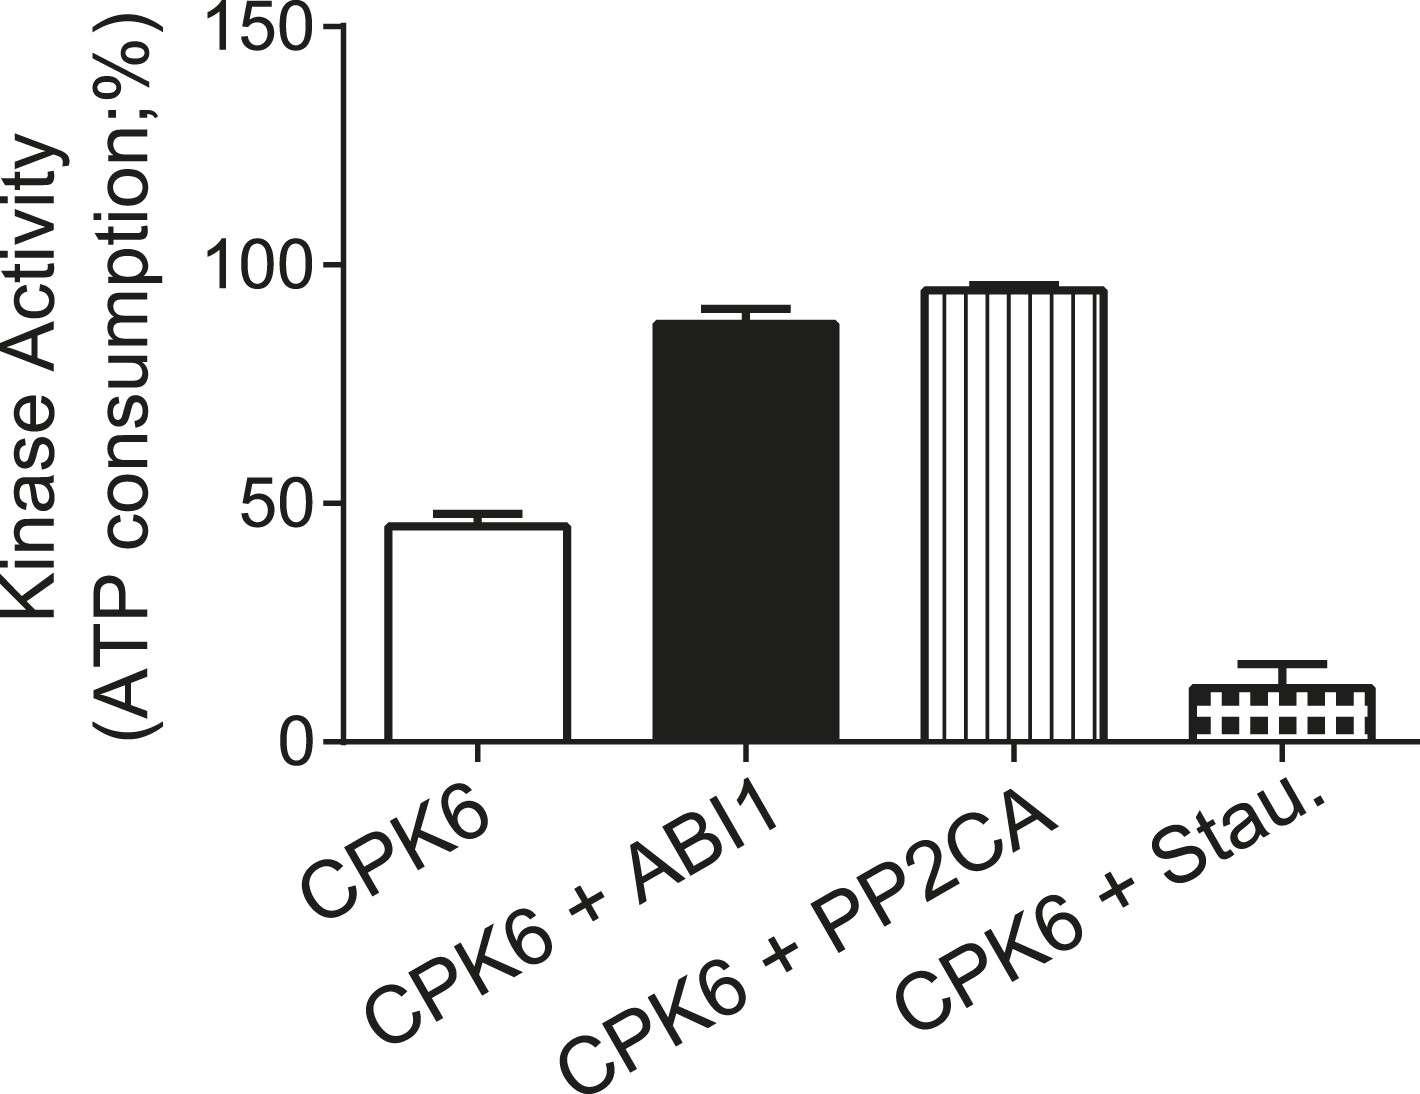
CPK6 kinase activity is not inhibited in the presence of ABI1 or PP2CA.
In vitro protein kinase assays measuring the kinase activity via ATP consumption show that staurosporine (Stau.) but not ABI1 or PP2CA inhibited CPK6 kinase activity. The increased ATP-consumption signal in the presence of ABI1 and PP2CA can be explained by higher ATP consumption triggered by kinase auto-phosphorylation of residues removed by the PP2C protein phosphatases. Data shown represent the mean of three experiments ± SD.
Figure 4 with 1 supplement

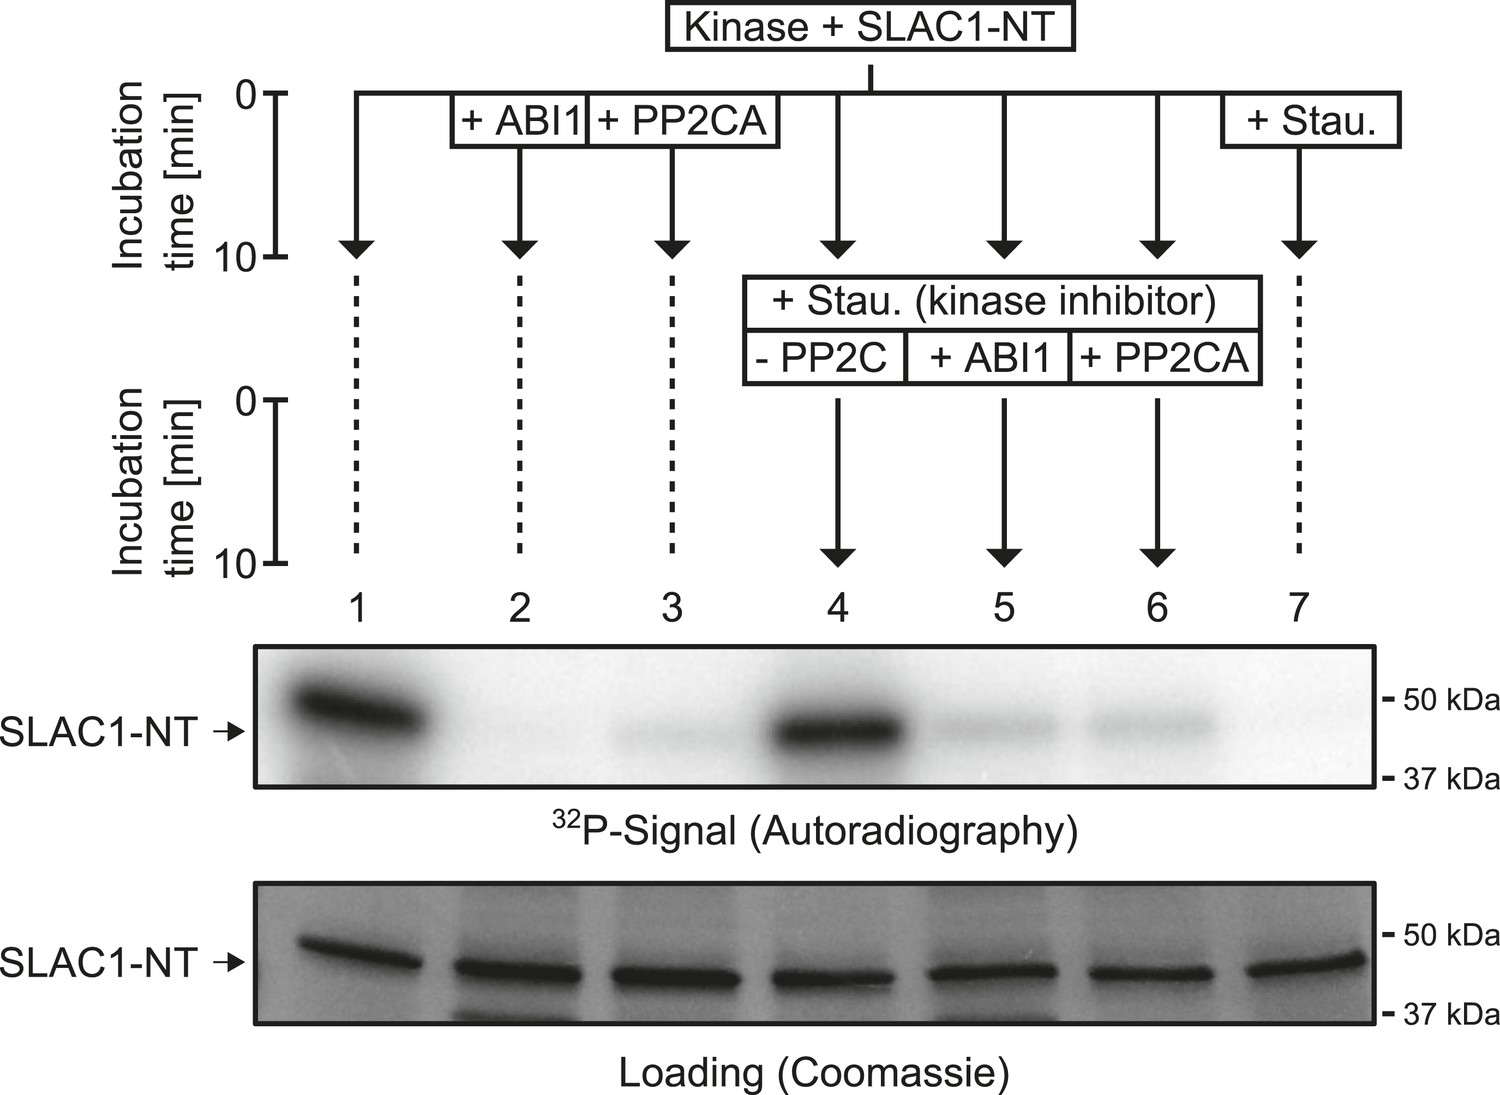
PP2Cs interact with and directly and rapidly dephosphorylate the N-terminus of SLAC1 (SLAC1-NT) when previously phosphorylated by several SLAC1-activating CPK and OST1 protein kinases.
(A) Bimolecular fluorescence complementation (BiFC) experiments in Nicotiana benthamiana leaves show YFP-derived fluorescence signals of YC-SLAC1 co-expressed with CPK6-YN and YN-ABI1. (B) Quantification of BiFC-mediated YFP-fluorescence shows that SLAC1 interacts with CPK6 and ABI1 but not with the control catalytic protein phosphatase 2A subunit C5 (PP2AC5). YFP signals of positive control YN-PP2AC5 with protein phosphatase 2A regulatory subunit A3 fused to YC (YC-PP2AA3) confirm expression of PP2AC5. Data shown in (B) represent the average fluorescence intensity of randomly picked leaf areas (n = 40; ±SEM) and these data are also included in Figure 6—figure supplement 5. (C–E) CPK6-phosphorylated SLAC1-NT is rapidly de-phosphorylated by ABI1 and PP2CA. SLAC1-NT phosphorylation by CPK6 (D and E, lane 1) is strongly inhibited if the PP2C protein phosphatase was added before starting the reaction (D and E, lane 2), but remains stable after addition of elution buffer (Elu.) and kinase inhibitor staurosporine (Stau.) with subsequent 10 min incubation (D and E, lane 3). If (D) ABI1 or (E) PP2CA together with staurosporine are added after the initial 10 min CPK6 mediated phosphorylation period, the SLAC1-NT phosphorylation signal rapidly decreases within 1 min (D and E, lanes 4–7). Staurosporine pre-exposure control inhibits SLAC1-NT phosphorylation by CPK6 (D and E, lane 8). (F–H) PP2Cs de-phosphorylate the SLAC1-NT which was phosphorylated by major SLAC1-activating kinases CPK23 and OST1. The SLAC1-NT is phosphorylated by CPK23 (G, lane 1) and OST1 (H, lane 1) which is inhibited when the PP2Cs ABI1 and PP2CA are added before starting the reactions (G and H, lanes 2–3). When adding staurosporine and elution buffer after the initial phosphorylation period and incubating for 10 min the signal does not change (G and H, lane 4). Addition of ABI1 or PP2CA after supplementing the reaction with staurosporine leads to rapid (10 min) dephosphorylation of the SLAC1-NT previously phosphorylated by the OST1 and CPK23 protein kinases (G and H, lanes 5–6).
Figure 4—figure supplement 1
When previously phosphorylated by CPK21, the SLAC1-NT is de-phosphorylated by the PP2Cs ABI1 and PP2CA.
Recombinant SLAC1-NT phosphorylation by CPK21 (lane 1) is inhibited if the protein phosphatases ABI1 and PP2CA are added before starting the reaction (lanes 2–3). The phosphorylated SLAC1-NT derived signal is rapidly and strongly decreased if the PP2Cs ABI1 and PP2CA (lanes 4–7) are added after the addition of staurosporine.
Figure 5 with 1 supplement
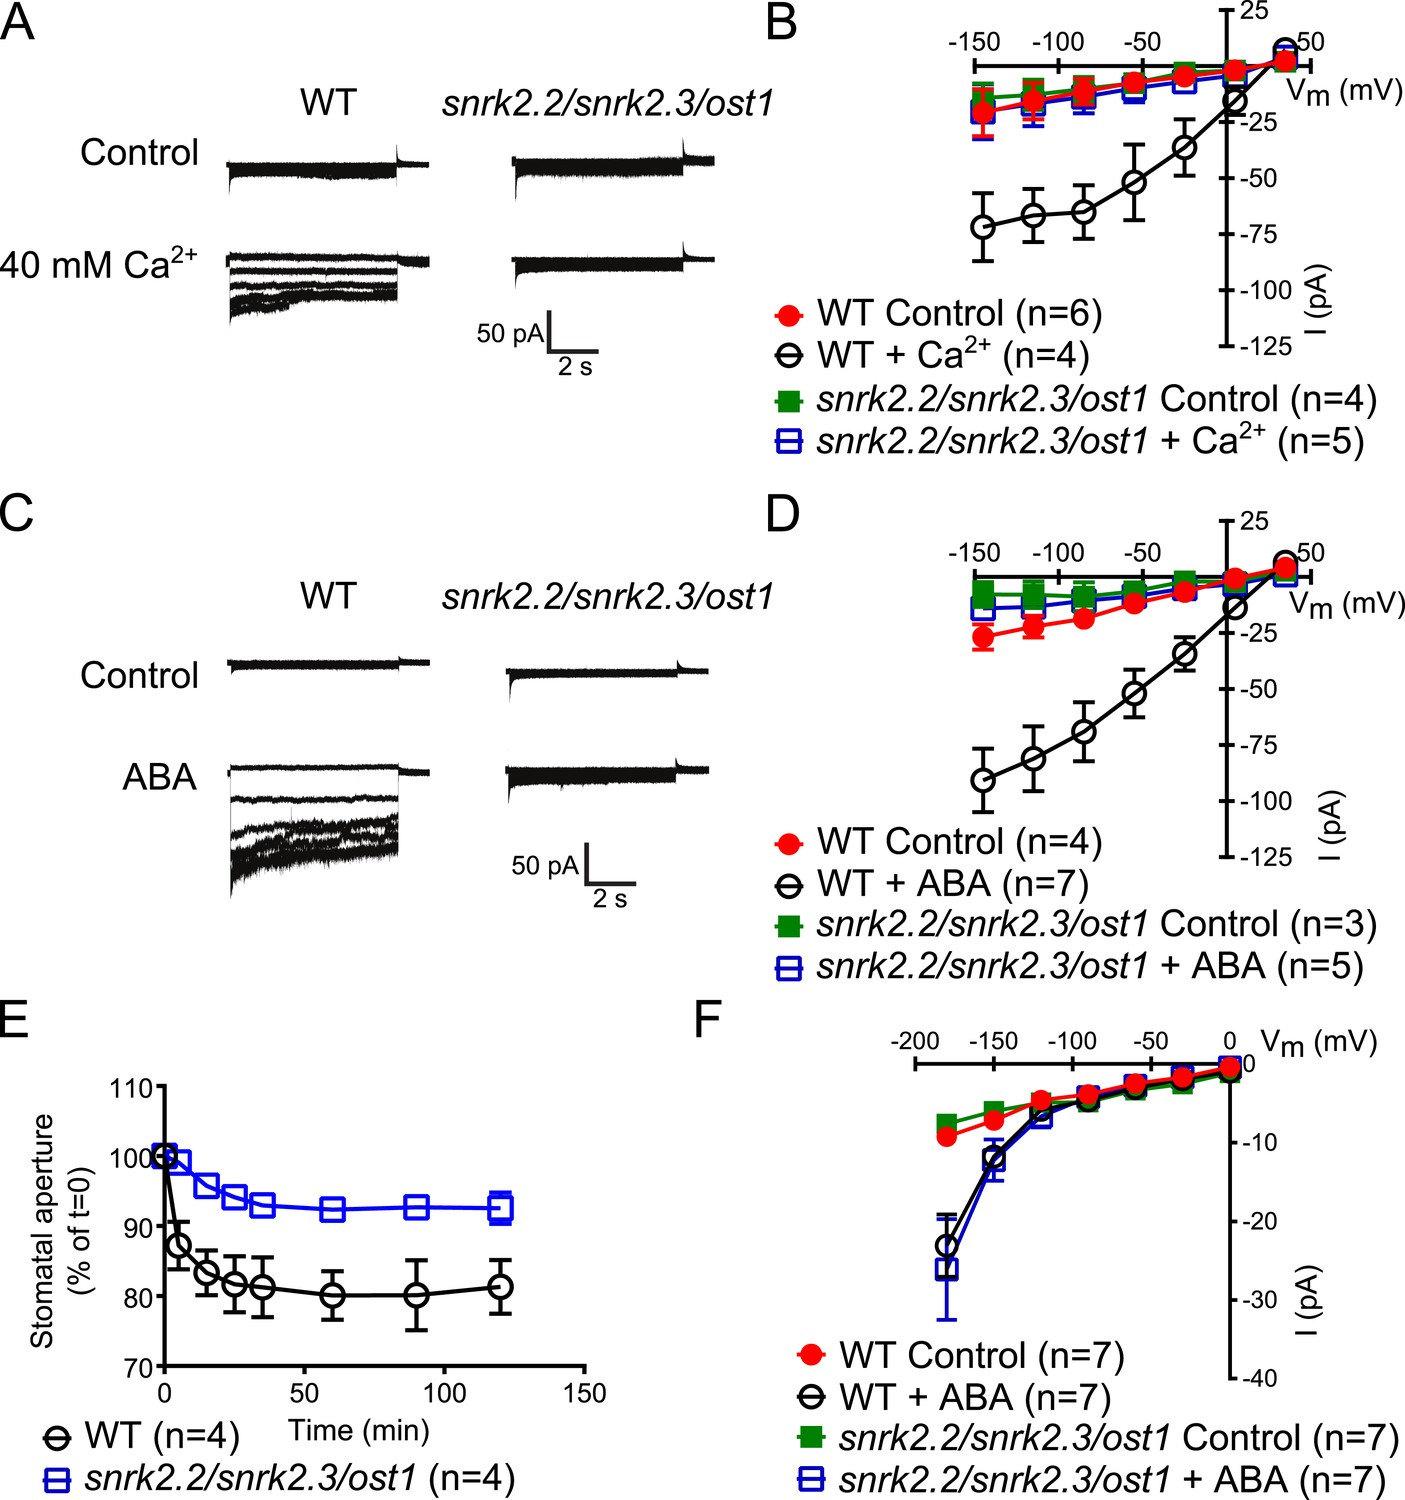
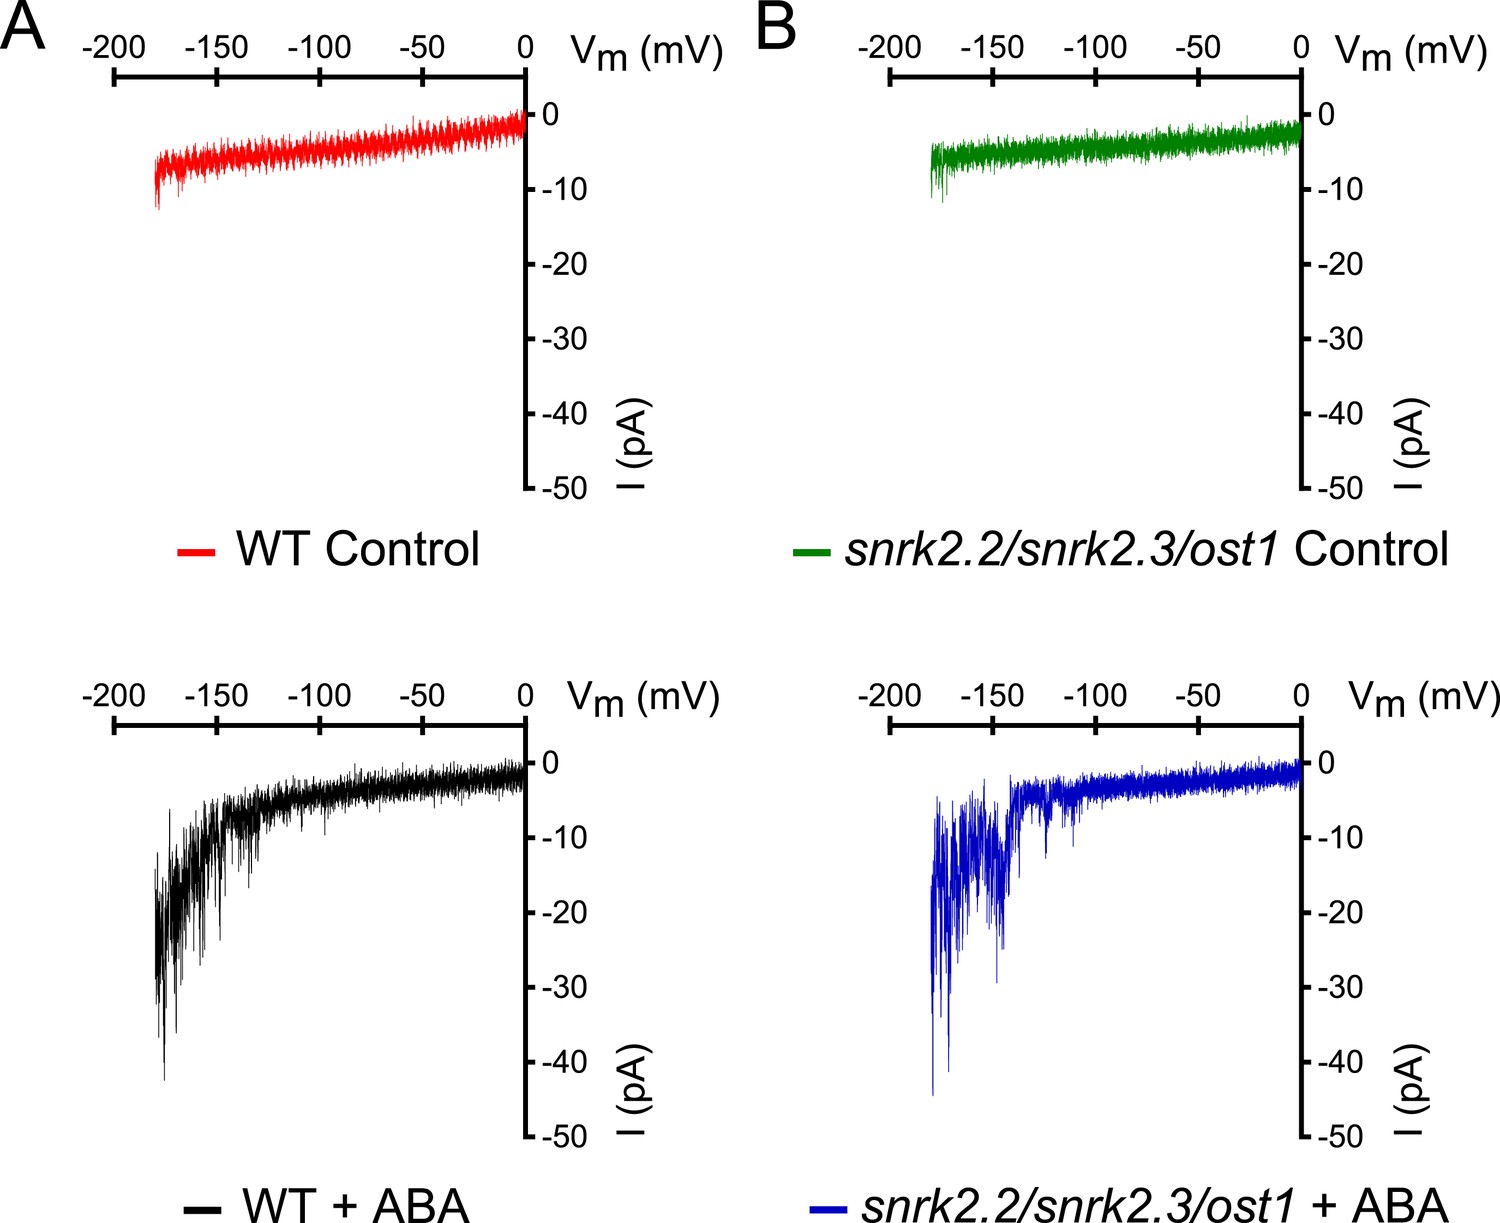
Both, ABA- and high external Ca2+-activation of S-type anion currents at elevated [Ca2+]cyt and imposed Ca2+-oscillation-triggered stomatal closure are impaired in snrk2.2/2.3/ost1 triple mutant guard cells while the ABA-activation of ICa currents is intact.
(A–D) Whole-cell patch-clamp experiments reveal that [Ca2+]cyt-activation of S-type anion currents is disrupted in snrk2.2/2.3/ost1 triple mutant guard cells even if pre-incubated with high external Ca2+ shock (A and B) or ABA (C and D). Note that pre-incubation with high external Ca2+ shock by passes early ABA signaling (Allen et al., 1999a; Allen et al., 2002). Typical current responses (A and C), average steady-state current–voltage relationships ±SEM, and the number of measured cells are presented (B and D). In (B) data for snrk2.2/2.3/ost1 triple mutants with and without ABA overlap with WT controls. (E) Imposed Ca2+ oscillation-induced stomatal closure is impaired in Ca2+-independent protein kinase snrk2.2/2.3/ost1 triple mutant leaves, providing further evidence for an interdependence of these responses. Four 5-min extracellular Ca2+-pulses were applied in 10-min intervals from time = 0 to 35 min. Average individually tracked stomatal apertures were normalized to the stomatal apertures at time zero. The averages of the normalized apertures ±SEM and the number of independent genotype-blind experiments (n = 4) are shown (>40 total stomata per group). Average stomatal apertures at time zero were 4.61 ± 0.44 μm in WT (n = 4) and 5.51 ± 0.87 μm in the snrk2.2/2.3/ost1 triple mutant (n = 4). (F) Patch clamp experiments reveal that ABA activation of ICa currents is not impaired in snrk2.2/2.3/ost1 triple mutant guard cells. Average steady-state current–voltage relationships ±SEM, and the number of measured cells are presented in (F). Representative whole cell current traces for (F) are presented in Figure 5—figure supplement 1. Several error bars are not visible, as these were smaller than the illustrated symbols.
Figure 5—figure supplement 1
snrk2.2/2.3/ost1 triple mutant guard cells show intact ABA activation of Ca2+-permeable ICa currents.
(A and B) Whole-cell patch-clamp experiments of WT (A) and snrk2.2/2.3/ost1 triple mutant (B) guard cells in the absence of ABA (top traces). ABA activation of Ca2+-permeable ICa currents was similar in wildtype guard cells (A, lower panel) and snrk2.2/2.3/ost1 triple mutant guard cells (B, lower panel). Typical current responses of WT (A) and the snrk2.2/2.3/ost1 triple mutant (B) are shown.
Figure 6 with 5 supplements
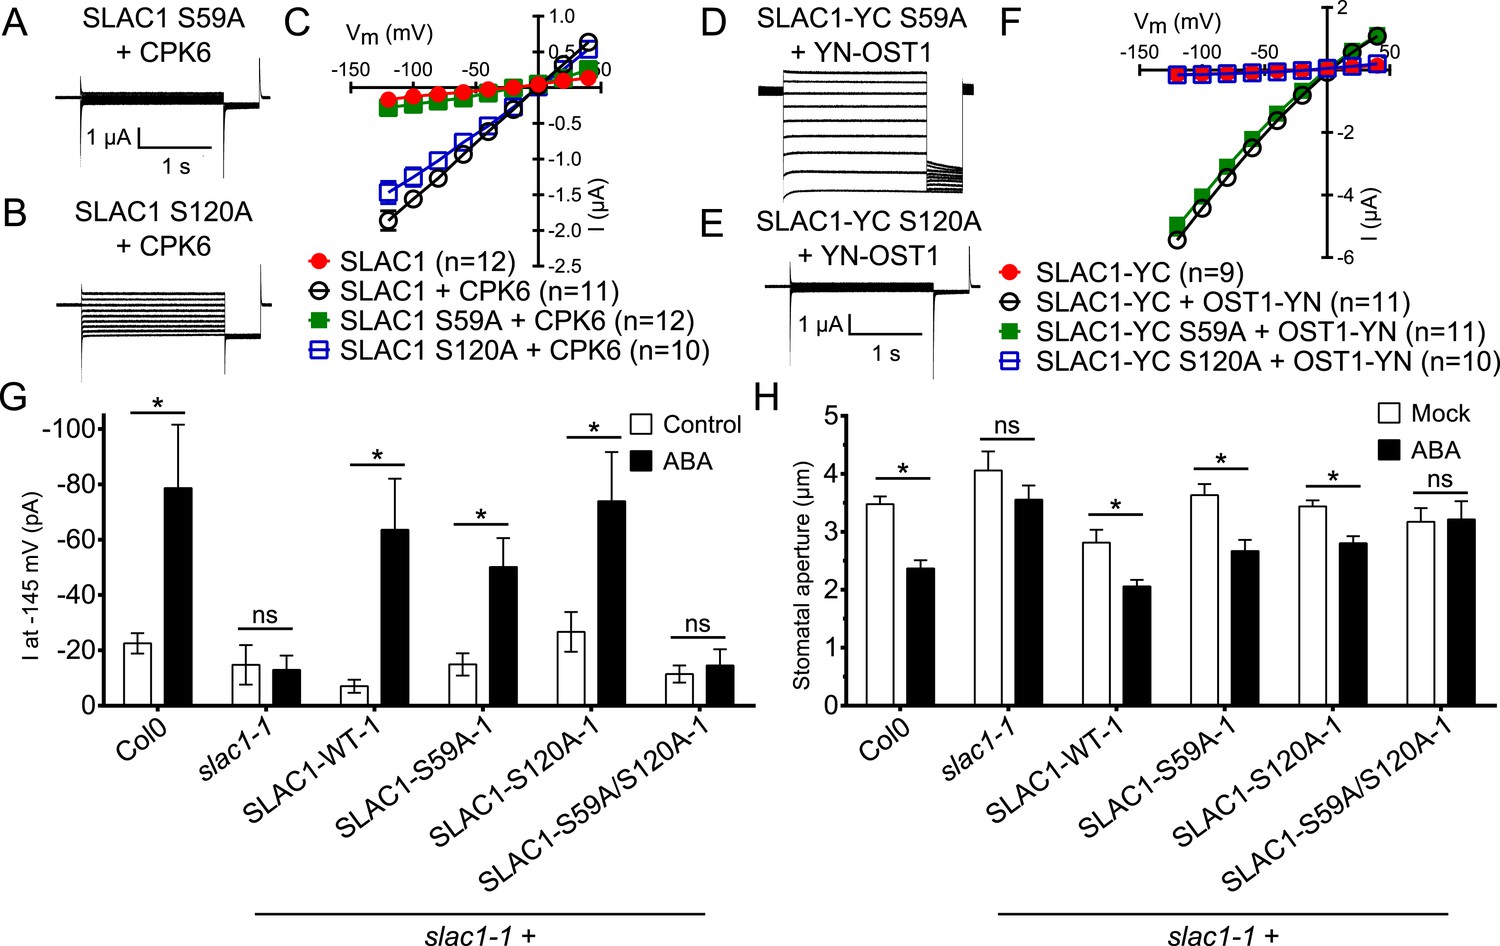
Ca2+-dependent protein kinase and OST1 protein kinase activation of SLAC1 in oocytes requires serine 59 or serine 120, respectively while in planta ABA-dependent S-type anion current activation and stomatal closing are only impaired in SLAC1 S59A/S120A double amino acid mutants.
(A–C) SLAC1 activation by CPK6 in Xenopus oocytes was abolished when serine 59 is mutated to alanine (S59A) (A and C) (Brandt et al., 2012) but was comparable to wild type SLAC1 activation for the SLAC1 S120A mutated version (B and C). (D–F) OST1 activation of SLAC1 was abolished in the SLAC1 S120A mutant (E and F) (Geiger et al., 2009), while OST1 robustly activated SLAC1 S59A (D and F). (G) In whole-cell patch-clamp experiments, slac1-1 guard cells show impaired ABA-activation of S-type anion currents. Expression of SLAC1 WT, S59A, and S120A in slac1-1 plants restores ABA activation of S-type anion currents in guard cells, but expression of SLAC1 S59A/S120A does not. (H) The ABA-insensitive phenotype of slac1-1 stomata was recovered by expression of SLAC1 WT, S59A, and S120A, but not by expression of S59A/S120A. Note that SLAC1 WT, S59A, S120A, and S59A/S120A are expressed as C-terminal mVenus fusion proteins under native SLAC1 promoter (see ‘Materials and methods’). Representative current traces are depicted in (A, B, D and E) and average current voltage relationships are shown (C and F; ±SEM). Average steady-state current responses ±SEM at −145 mV are plotted in (G) and average stomatal apertures ±SEM in (H). * indicates p < 0.05; unpaired Student's t-test. Exact p-values and number of individual experiments for (G and H) can be found in Figure 6—figure supplement 4. Note that WT (Col0) and slac1-1 control measurements shown in (G and H) are the same control data as those shown in Figure 6—figure supplement 3A,B as all lines were investigated under the same conditions. Several error bars are not visible, as these were smaller than the illustrated symbols.
-
Figure 6—source data 1
Statistical data and number of repeats (n) for the (Table 1) patch clamp measurements shown in Figure 6G and Figure 6—figure supplement 3A and (Table 2) for measurements of stomatal apertures presented in Figure 6H and Figure 6—figure supplement 3B (n = 3 experiments and >45 total stomata per group).
The Student's t-test was used to calculate all p-values.
- https://doi.org/10.7554/eLife.03599.018
Figure 6—figure supplement 1
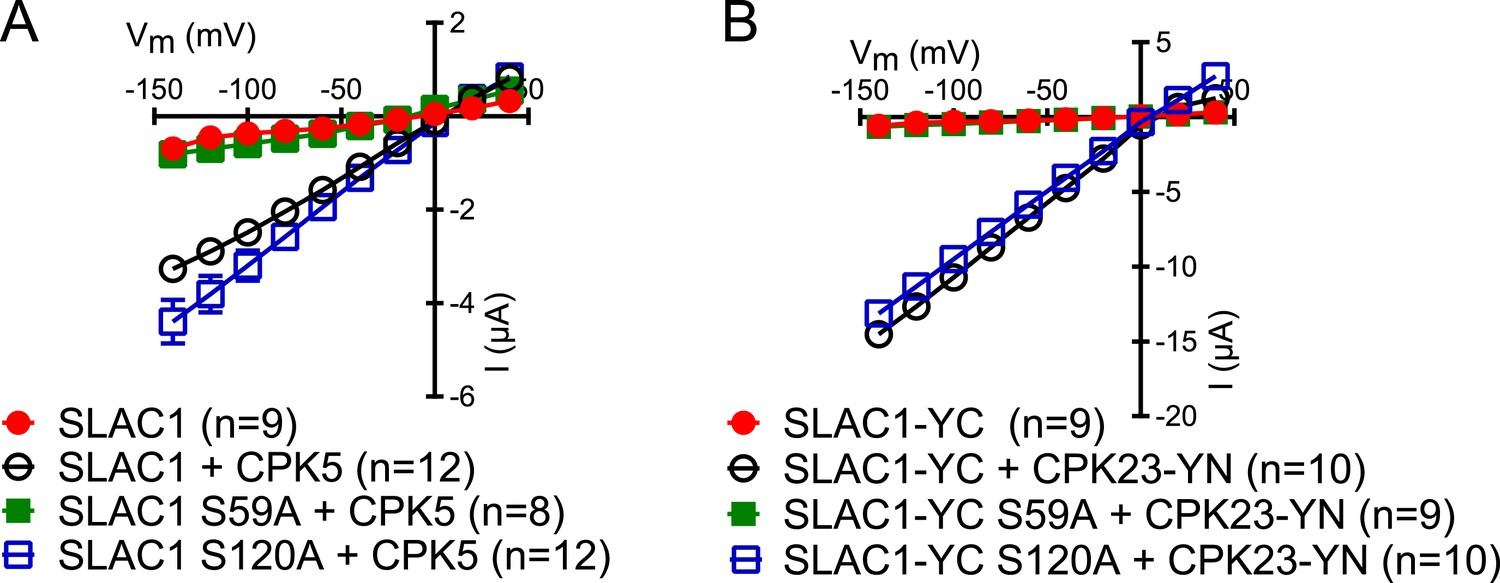
SLAC1 serine 59 but not serine 120 is required for CPK5 or CPK23 activation in Xenopus oocytes.
(A and B) SLAC1 activation by CPK5 (A) and CPK23 (B) is comparable to WT when serine 120 is substituted by alanine (S120A) while the CPK5 and CPK23 activation of SLAC1 S59A was strongly impaired. Average steady-state current–voltage relationships (±SEM), and numbers of individual measured cells are depicted (A and B). Several error bars are not visible, as these were smaller than the illustrated symbols.
Figure 6—figure supplement 2
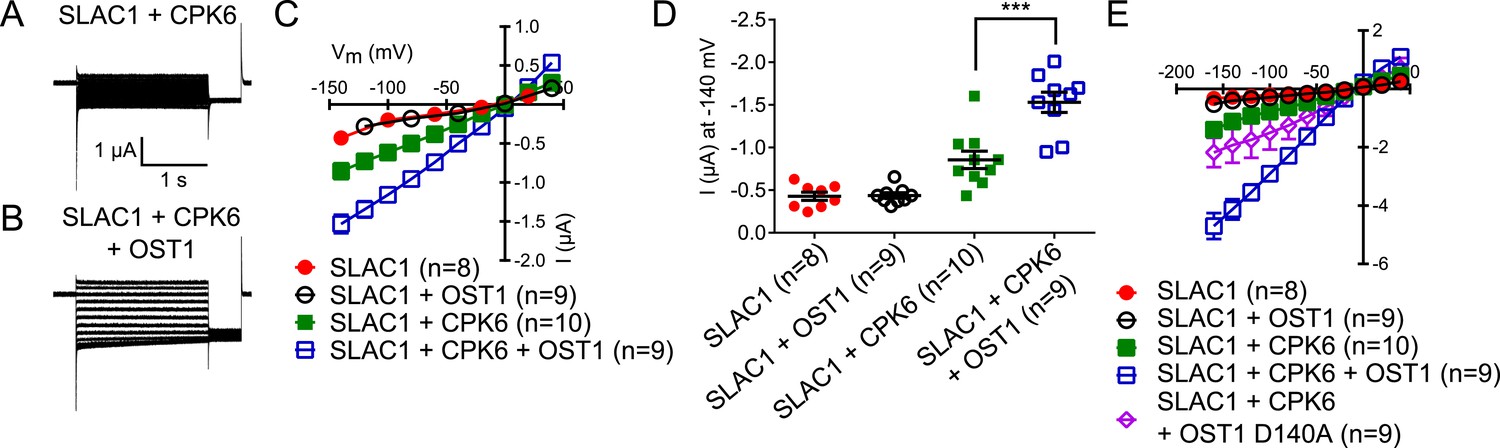
SLAC1 exhibits enhanced activity by co-expression of CPK6 and OST1 in Xenopus oocytes.
(A–D) If SLAC1 (5 ng cRNA) is expressed alone or with non-BIFC OST1 (7.5 ng), no anion currents can be detected (C and D). If CPK6 (0.5 ng) is co-expressed, SLAC1-mediated currents can be seen (A, C, and D) which are enhanced when OST1 (7.5 ng) is added (B–D). Due to overlapping data of ‘SLAC1’ and ‘SLAC1 + OST1’ alternating data points are shown in (C). (E) This enhancement is almost completely impaired when the kinase inactive mutant OST1 D140A is co-injected with SLAC1 and CPK6. In (A and B) typical current responses are shown while in (C and E) average current–voltage relationships ±SEM and the number of the measured cells are presented. (D) Shows average currents at −140 mV ±SEM (*** indicates p = 0.005). Several error bars are not visible, as these were smaller than the illustrated symbols.
Figure 6—figure supplement 3

ABA-induced S-type anion currents and stomatal closure responses are impaired when both SLAC1 S59 and S120 are substituted with alanine in independent double amino acid mutant line.
(A) In whole-cell patch-clamp experiments, slac1-1 guard cells show impaired ABA-activation of S-type anion currents. Expression of SLAC1 WT, S59A, and S120A in slac1-1 plants restores ABA activation of S-type anion currents, but expression of SLAC1 S59A/S120A does not. (B) ABA-insensitive stomatal closing phenotype of slac1-1 was recovered by expression of SLAC1 WT, S59A, and S120A, but not by expression of S59A/S120A. Note that SLAC1 WT, S59A, S120A, and S59A/S120A are expressed as C-terminal mVenus fusion proteins under the native 1.63 kbp of the SLAC1 5′ UTR promoter region (see ‘Materials and methods’). The results shown here were recorded from independent Arabidopsis slac1-1 transformation lines that differ from the transformation lines shown in Figure 6G,H. Note that Col0 and slac1-1 measurements are the same control data as those shown in Figure 6G,H as all lines were investigated under the same conditions. Average steady-state current responses ±SEM at −145 mV are plotted in (A). In (B) average stomatal apertures ±SEM. * indicates p < 0.05; t-test. Exact p-values and number of individual experiments for (A and B) can be found in Figure 6—source data 1.
Figure 6—figure supplement 4
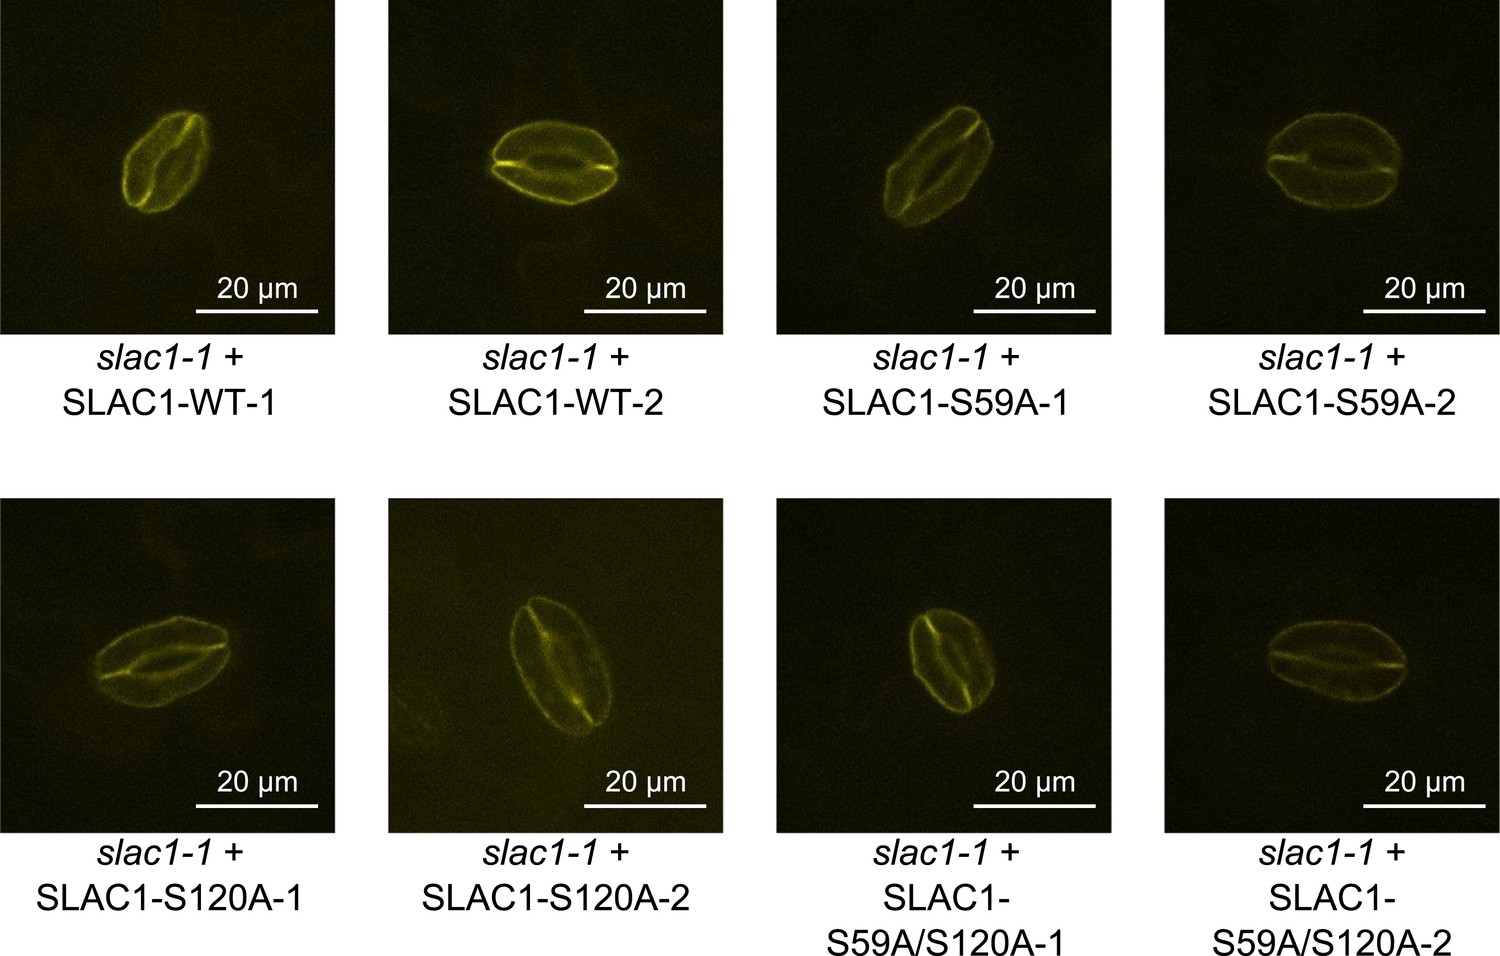
Analysis of expression and subcellular localization of SLAC1-WT, SLAC1S59A, S120A, and S59A/S120A in slac1-1 complementation lines.
Confocal laser microscopy of guard cells of slac1-1 mutant lines expressing SLAC1-WT-mVenus, SLAC1S59A-mVenus, SLAC1-S120A-mVenus or SLAC1-S59A/S120A-mVenus shows membrane-localized expression of all SLAC1 versions. In addition intracellular YFP fluorescence was also observed in some guard cells, which may be linked to trafficking of SLAC1.
Figure 6—figure supplement 5
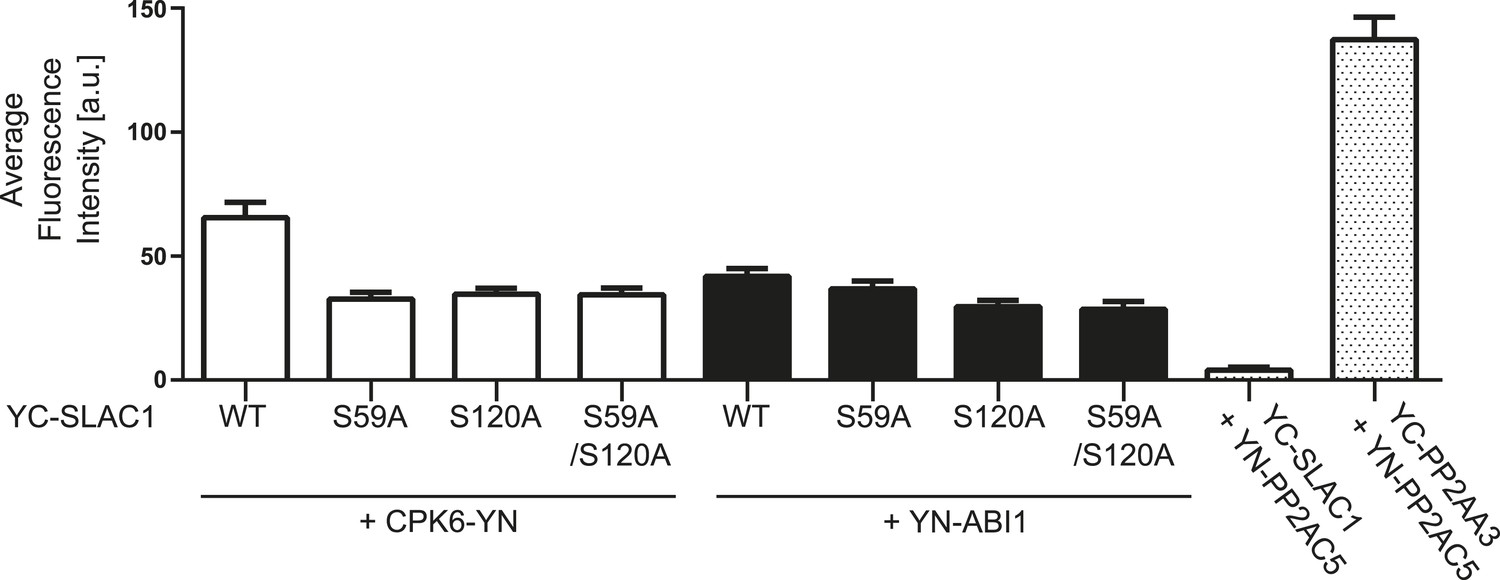
BiFC fluorescence intensities are altered for CPK6 and ABI1 co-expression with SLAC1-WT, SLAC1S59A, S120A, and S59A/S120A.
Quantitative BiFC experiments showed that CPK6-YN + YC-SLAC1-WT derived fluorescence signals are significantly decreased when CPK6-YN was expressed with YC-SLAC1-S59A, YC-SLAC1-S120A, or YC-SLAC1-S59A/S120A (p < 0.0001; unpaired t-test). YC-SLAC1-S59A expression with YN-ABI1 did not result in a significant decrease of the average fluorescence intensity in comparison with YC-SLAC1-WT and YN-ABI1 co-expression (p = 0.2647; unpaired t-test). Signal intensities significantly decreased when YN-ABI1 was co-expressed with YC-SLAC1-S120A or YC-SLAC1-S59A/S120A vs co-expression with YC-SLAC1-WT (p < 0.005; unpaired t-test). The data for CPK6-YN + YC-SLAC1-WT, YN-ABI1 + YC-SLAC1-WT, YN-PP2AC5 + YC-SLAC1-WT and YN-PP2AC5 + YC-PP2AA3 are also shown in Figure 4B. Average fluorescence intensities were determined of leaf areas which were chosen randomly in white light (±SEM; n = 40 images per condition).
Figure 7
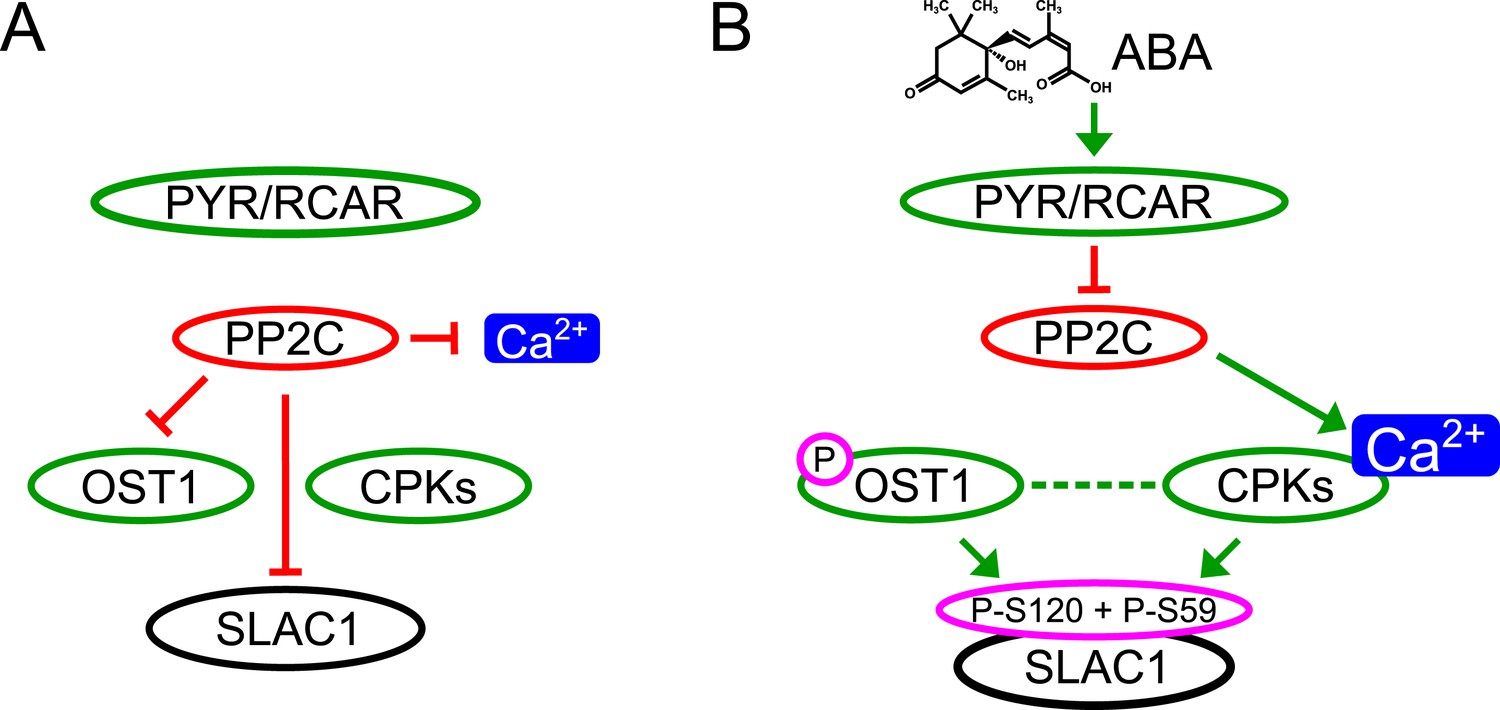
Simplified schematic model for Ca2+-specificity mechanism within ABA-dependent SLAC1 activation in guard cells.
(A) Without ABA, Ca2+ elevations that can also function in stomatal opening responses (Irving et al., 1992; Shimazaki et al., 1992; Curvetto et al., 1994; Shimazaki et al., 1997; Cousson and Vavasseur, 1998; Young et al., 2006) and spontaneous or un-specifically induced Ca2+ transients (Allen et al., 1999b; Klüsener et al., 2002; Young et al., 2006; Yang et al., 2008; Siegel et al., 2009) do not lead to S-type anion channel (SLAC1) activation as PP2C protein phosphatases directly negatively regulate SLAC1 activation. (B) In the presence of ABA this SLAC1 inhibition is released, OST1 and CPKs phosphorylate, and thereby activate the channel. ABA also causes [Ca2+]cyt elevation via PP2C inhibition (Allen et al., 1999a; Murata et al., 2001). Data indicate cross-talk between Ca2+-dependent and -independent ABA-activation of SLAC1 which may be mediated through a combination of protein kinase cross regulation and additive activation via differential affinities for SLAC1 phosphorylation sites by OST1 and CPKs.
Download links
A two-part list of links to download the article, or parts of the article, in various formats.
Downloads (link to download the article as PDF)
Open citations (links to open the citations from this article in various online reference manager services)
Cite this article (links to download the citations from this article in formats compatible with various reference manager tools)
Calcium specificity signaling mechanisms in abscisic acid signal transduction in Arabidopsis guard cells
eLife 4:e03599.
https://doi.org/10.7554/eLife.03599


