Peroxisomal lactate dehydrogenase is generated by translational readthrough in mammals
- University Medical Center, Georg-August-University Göttingen, Germany
- Institute for Microbiology and Genetics, Georg-August-University Göttingen, Germany
Figures
Figure 1 with 2 supplements
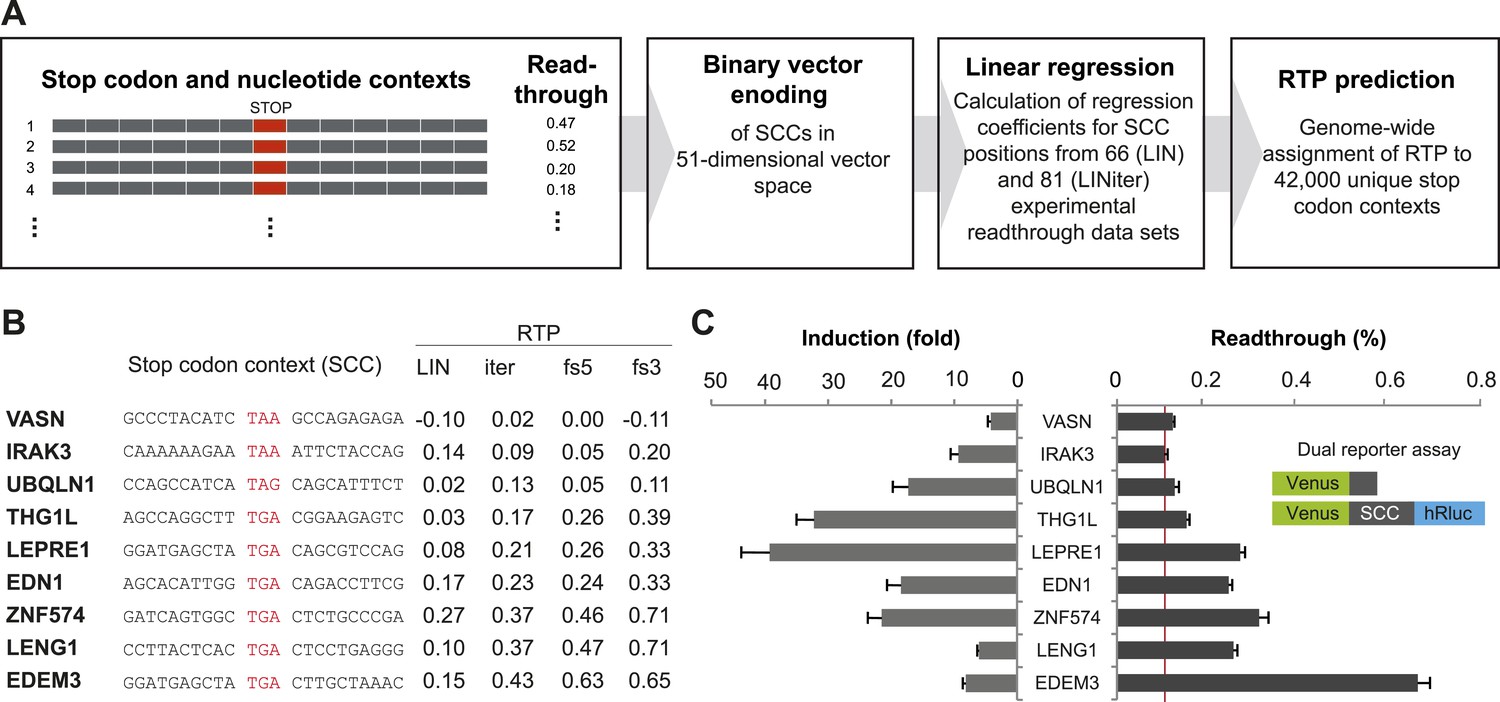
Genome-wide in silico analysis of basal translational readthrough (BTR) in humans.
(A) Schematic representation of the readthrough propensity (RTP) predictor algorithm. Binary vector representations of stop codon contexts and their experimental readthrough values are used to determine the coefficients of a linear regression model. For prediction of RTP for a given stop codon context, the position-specific regression coefficients are added up. (B) RTP for selected human transcripts. LIN denotes first-pass RTP calculations, LINiter iterative improvement of RTP scoring, and LINfs3 and LINfs5 the reduced models. The RTP of all human transcripts can be found in Dataset 1 (Schueren et al., 2014). (C) Experimental readthrough by dual reporter assay in HeLa cells. Readthrough is expressed as luciferase per Venus signal. The red line marks the background readthrough level obtained from a construct containing two contiguous UAA stop codons separating the Venus and the hRluc. The aminoglycoside geneticin (100 µg/ml) induces translational readthrough. SCC: stop codon context; hRluc: humanized Renilla luciferase. Error bars, SD.
Figure 1—figure supplement 1
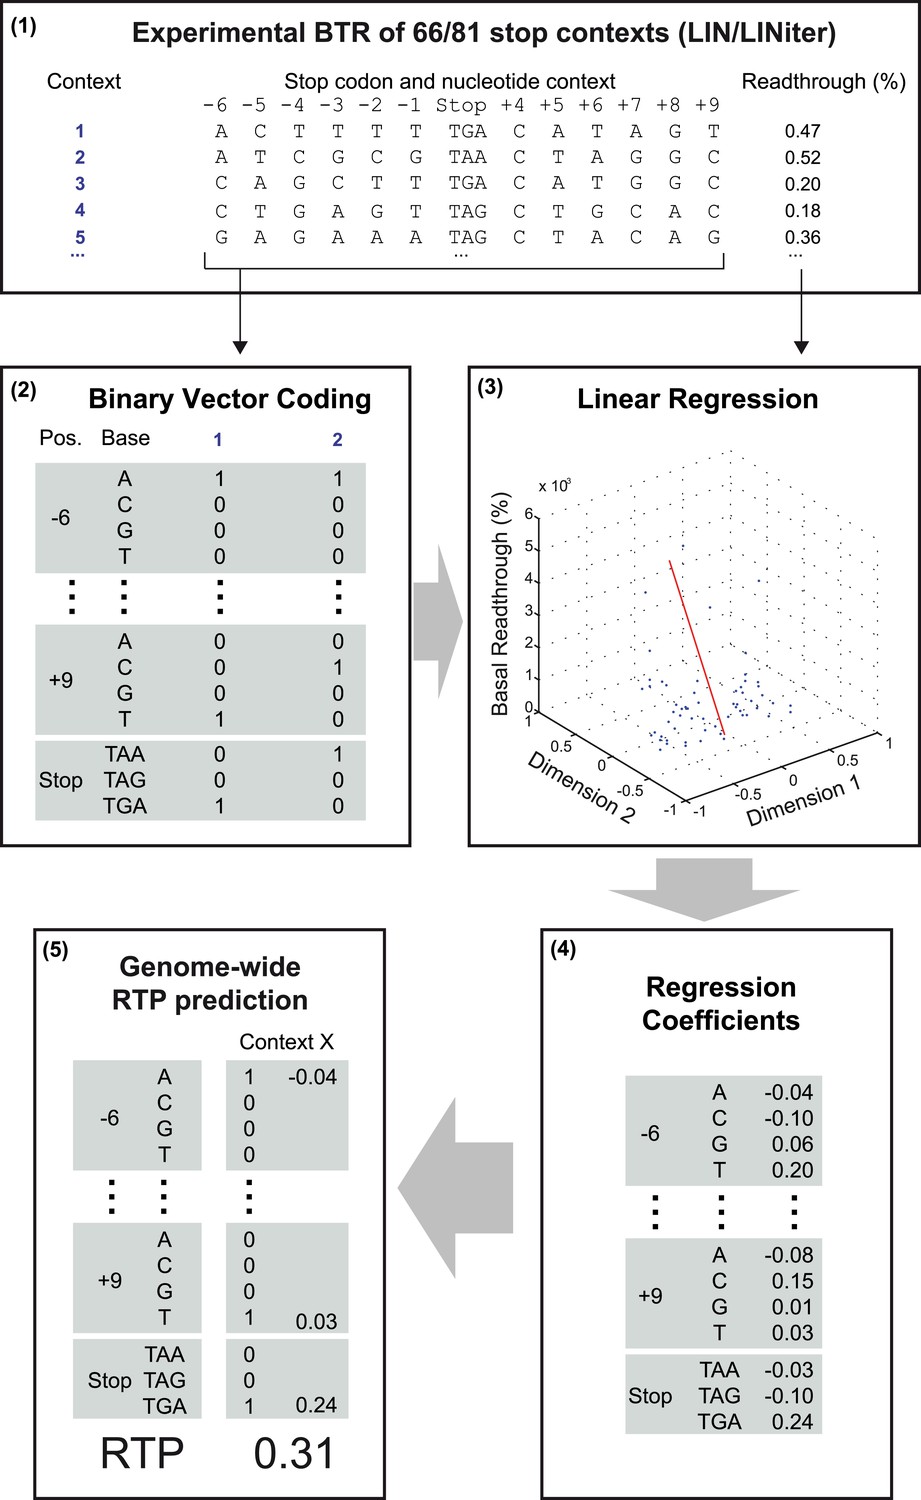
Schematic representation of the readthrough propensity (RTP) prediction procedure.
This scheme summarizes how regression coefficients were extracted from experimental basal readthrough (BTR) data. (1) Stop codon contexts (SCC) (positions −6 to +9, stop codon at position 1 to 3) with known experimental BTR values are formalized as binary vectors in 51-dimensional vector space. (2) The binary vector reserves four entries for the four possible bases in each position (4 × 12) and three for the stop codon. (3) In combination with their corresponding experimental readthrough values (in %), they are used to determine the (4) coefficients of a linear regression model. (5) For RTP calculation for a given SCC, the position-specific regression coefficients are added up. The values used in the example are from the LINiter model. The algorithm is used to calculate the RTP of SCCs of 42,000 unique 3′ transcript termini listed in Dataset 1 (Schueren et al., 2014).
Figure 1—figure supplement 2
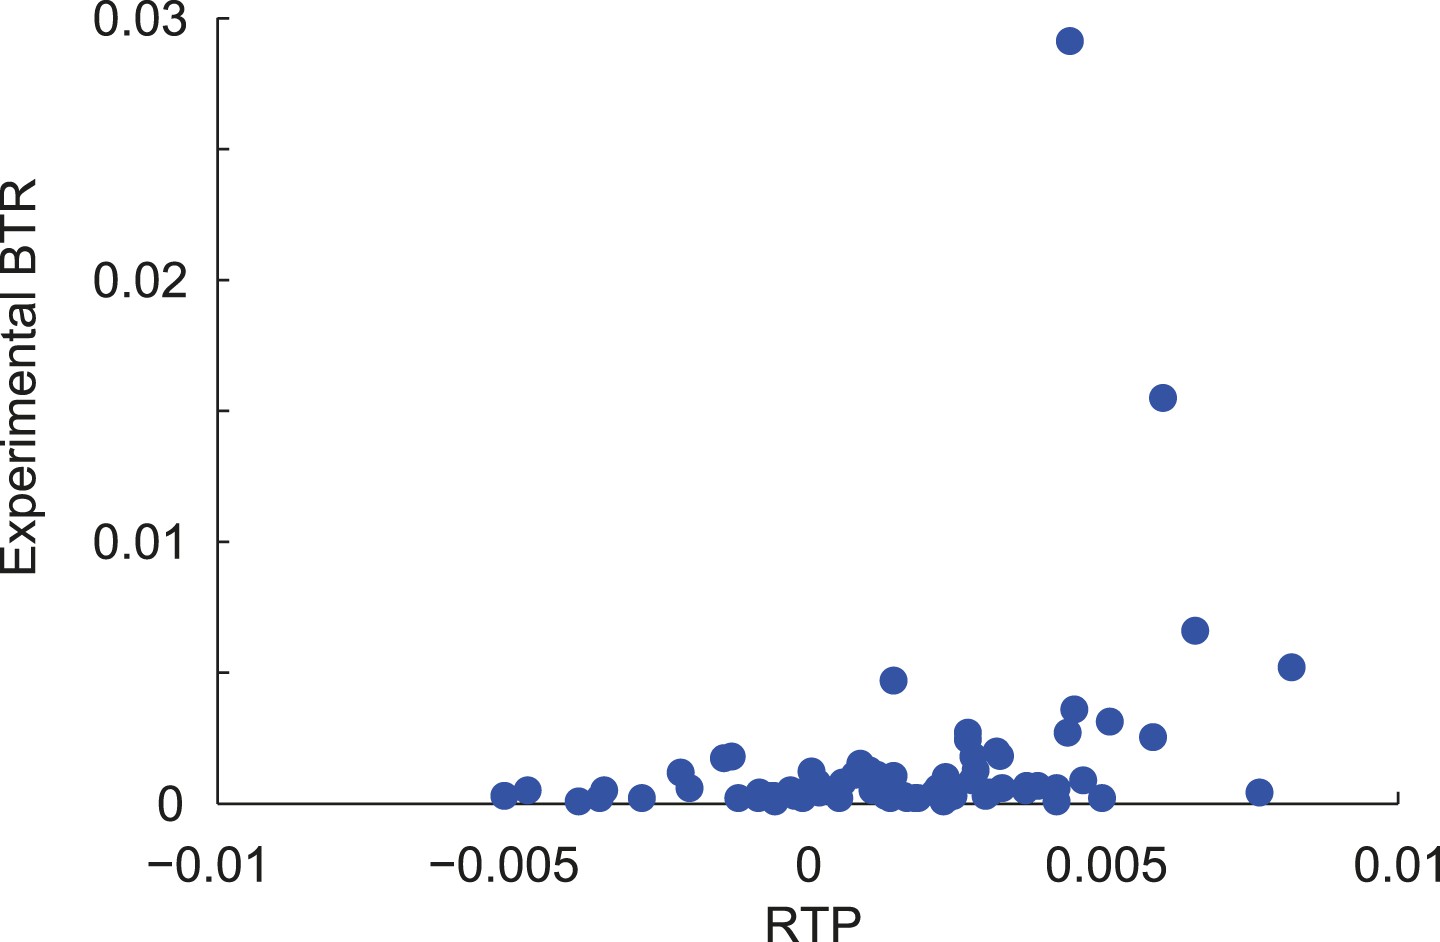
Correlation of RTP and BTR in the LINiter model.
Scatter plot indicating the correlation between readthrough propensity (RTP) and experimental basal translational readthrough (BTR). RTP was obtained by leave-one-out cross-validation. Pearson correlation coefficient 0.34 (p = 0.002).
Figure 2 with 2 supplements

Characterization of basal translational readthrough (BTR): consensus and candidates.
(A) Sequence logo plot of regression coefficients of stop codon contexts (SCCs) in the LINiter model. Character size corresponds to regression coefficients. The model treats stop codons as one nucleotide position. Filled/upside-down letters correspond to positive/negative coefficients, respectively. (B) Consensus motif for high readthrough propensity (RTP) derived from the predictive model. The stop codon together with the nucleotide triplet following the stop codon provides the best predictor for RTP. The consensus was derived by feature selection: starting from LINiter, positions with the least contribution to prediction were successively eliminated as indicated by the gray arrow. Nucleotide positions on the x-axis mark the removed positions upon transition to a reduced model. LINfs3 (UGA CUA, stop codon underlined) represents the global minimum of regression error (filled circle). The model LINfs5, corresponding to a local minimum, additionally encompasses positions +7 and −6, indicating that these positions could also contribute to high BTR. (C) BTR determination of candidates from the genome-wide in silico screen. Dual reporter assays with Venus and humanized Renilla luciferase containing SCCs from AQP4 (UGA CUA G), SYTL2 (UGA CUA G), CACNA2D4 (UGA CUA T), and DHX38 (UGA CUU G). AQP4, SYTL2, and CACNA2D4 reveal high BTR in all tissues tested. HT1080, human fibrosarcoma cell line; U373, glioblastoma cell line. HEK, human embryonic kidney cells. Error bars, SD.
Figure 2—figure supplement 1
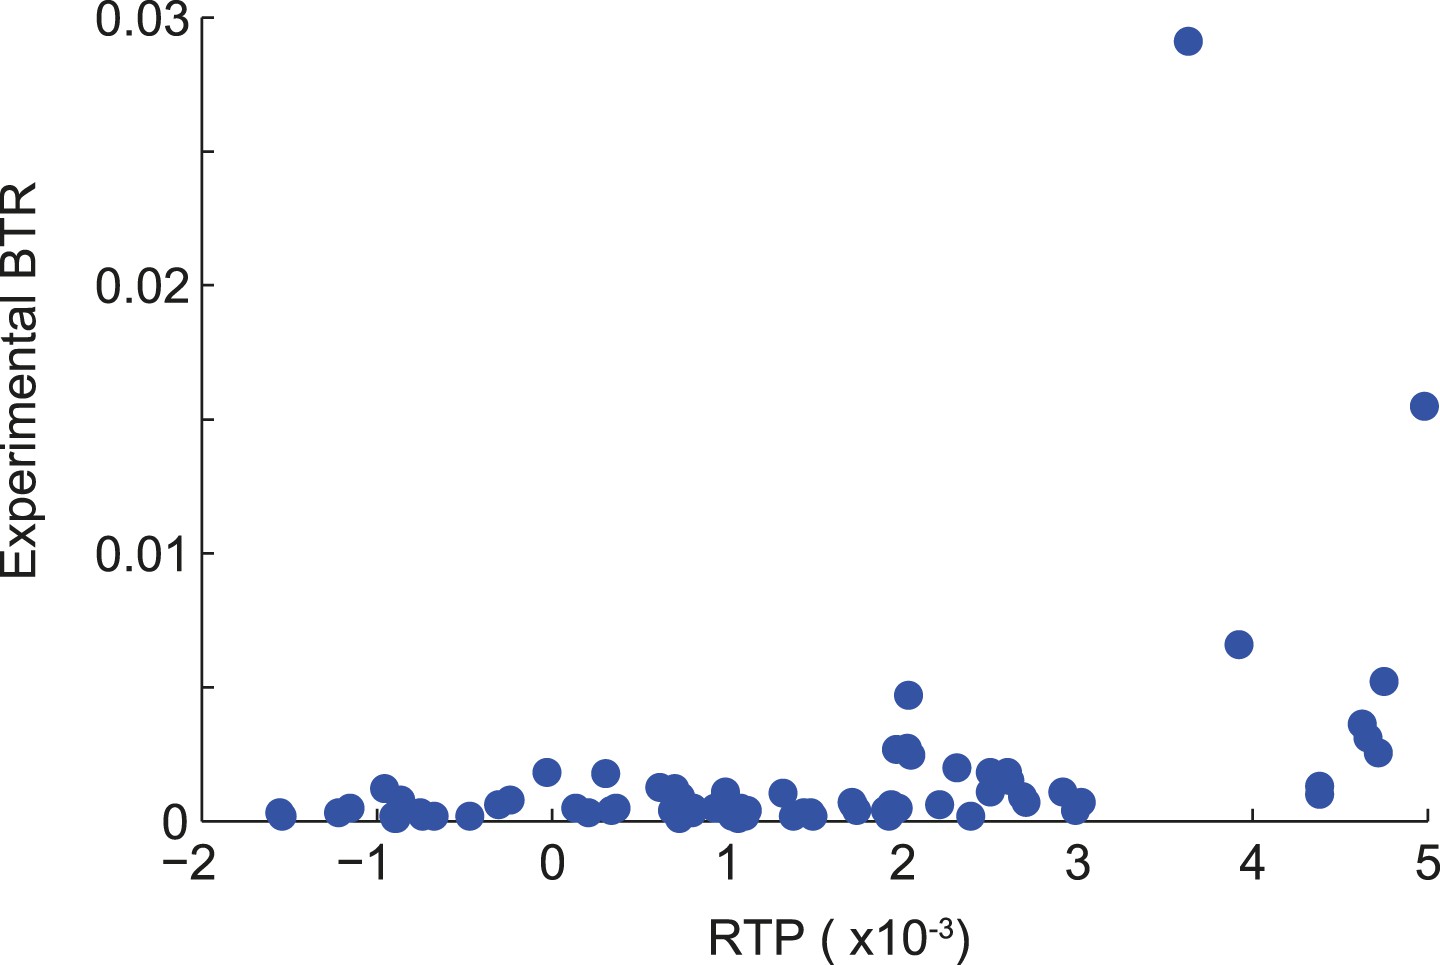
Correlation of RTP and BTR in the LINfs3 model.
Scatter plot indicating the correlation between readthrough propensity (RTP) and experimental basal translational readthrough (BTR). RTP was obtained by leave-one-out cross-validation. Pearson correlation coefficient 0.41 (p = 0.0001).
Figure 2—figure supplement 2
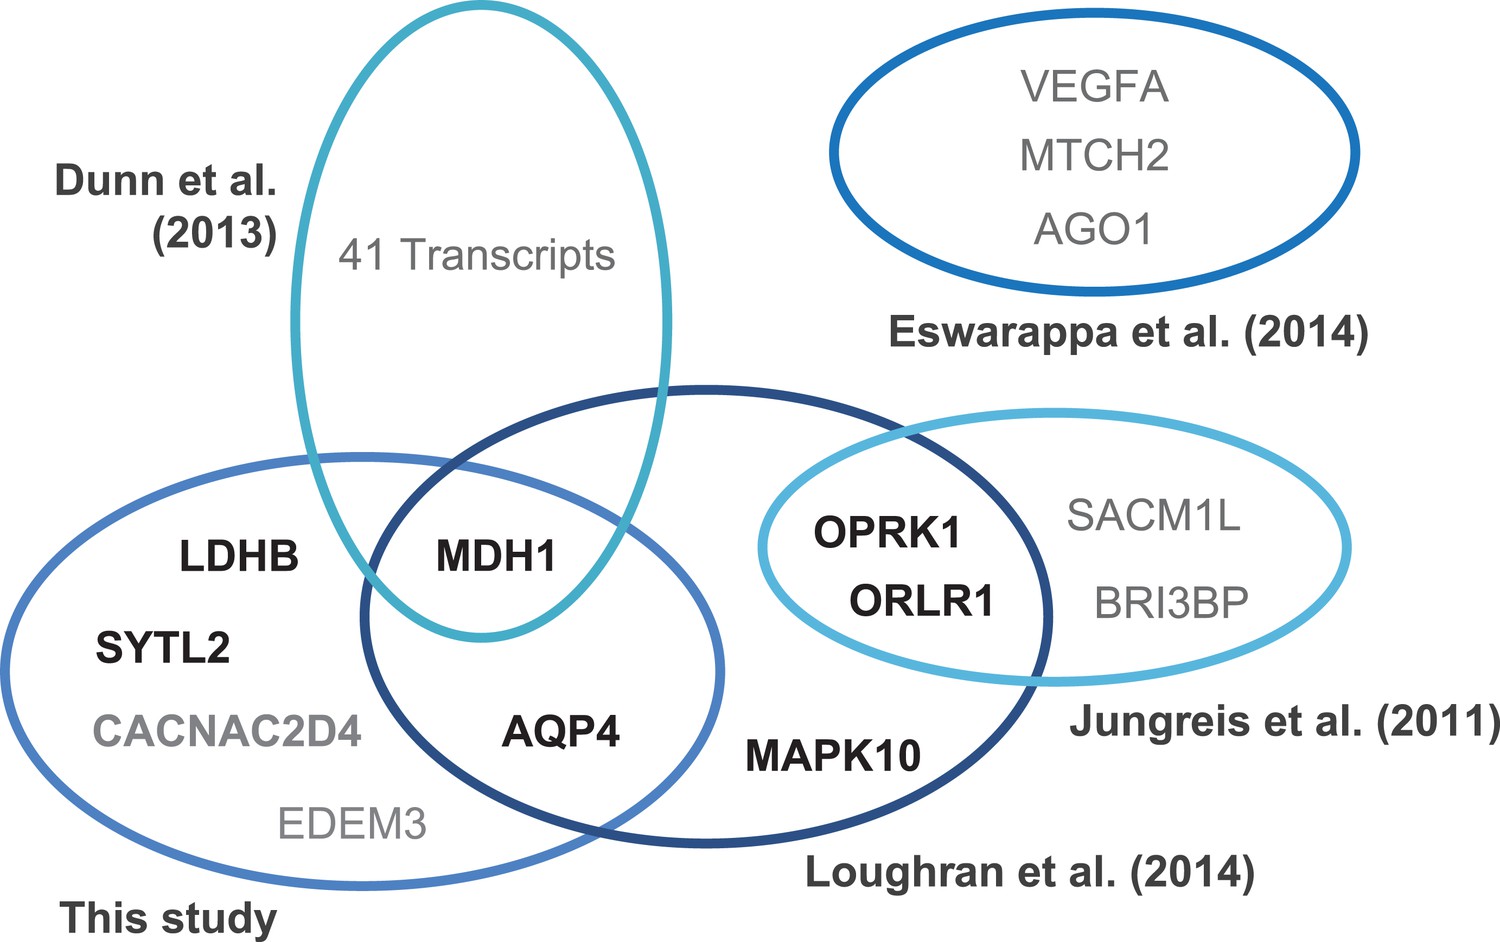
Translational readthrough in humans.
Venn diagram indicating experimentally verified human genes and stop codon contexts (SCCs) associated with above-average translational readthrough. Genes were identified by ribosome profiling (Dunn et al., 2013), by phylogenetic approaches (Jungreis et al., 2011; Loughran et al., 2014), and by in silico profiling (this study). Gene products marked in boldface (black) correspond to sequences carrying the consensus motif UGA CUA (G) identified in this study and by Loughran et al., (2014). The human genome contains 144 [30] transcripts with the high-RTP motifs UGA CUA [G]. Different experimental strategies lead to the identification of genes with high physiological readthrough rates, but the molecular mechanisms underlying readthrough are likely to vary.
Figure 3 with 1 supplement
LDHB is extended by translational readthrough.
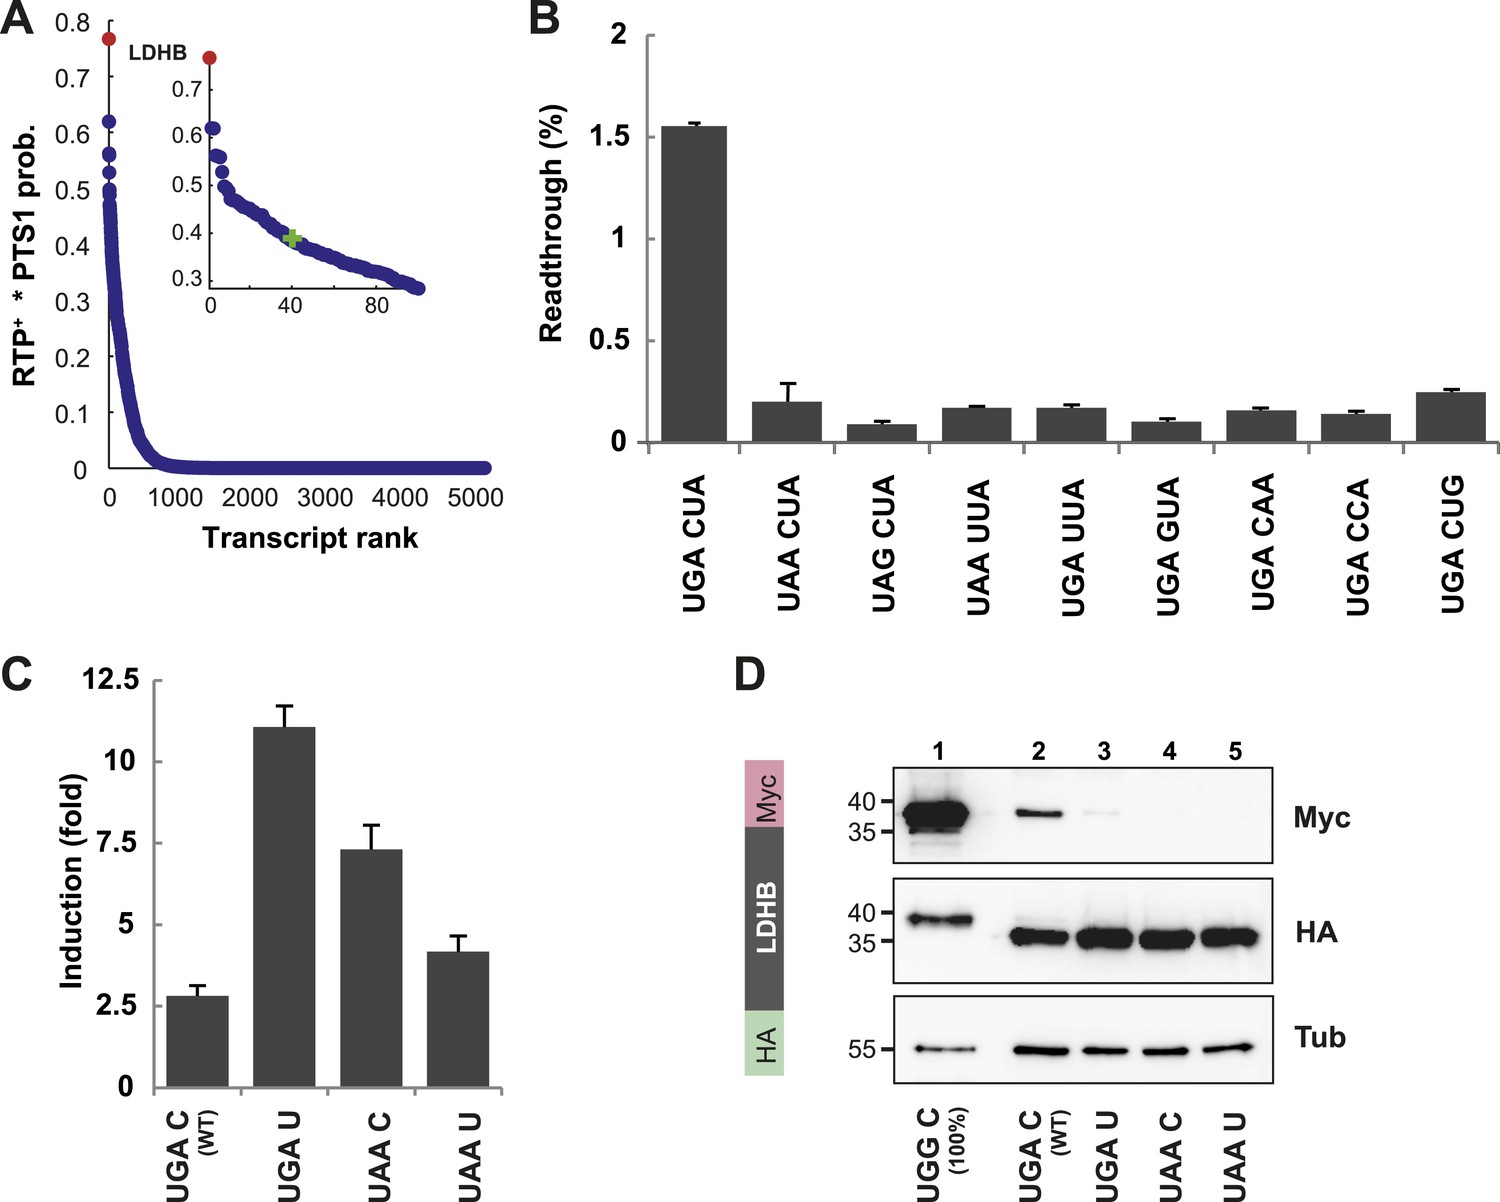
(A) Genomic distribution of RTP+ × PTS1 product scores. Product scores are 0 for rank 5015 to 42069. Green cross: 50% of maximum score. LDHB has the highest product score, exceeding rank 2 by 24%. RTP+ denotes positively scaled LINiter values. (B and C) Venus/hRluc dual reporter assay with LDHB wild-type and mutant stop codon contexts. Error bars, SD. (B) Wild-type LDHB stop context shows high basal translational readthrough (BTR). Mutational analysis of the LINfs3 consensus of LDHB. Replacement of the stop codon and mutations in positions +4 to +6 reduce readthrough. (C) LDHB readthrough induction by the aminoglycoside geneticin. (D) Full-length LDHB is extended by readthrough. Western blot of dual tag assay with LDHBx with N-terminal HA- and C-terminal Myc-tag. Molecular mass marker in kDa.
Figure 3—figure supplement 1
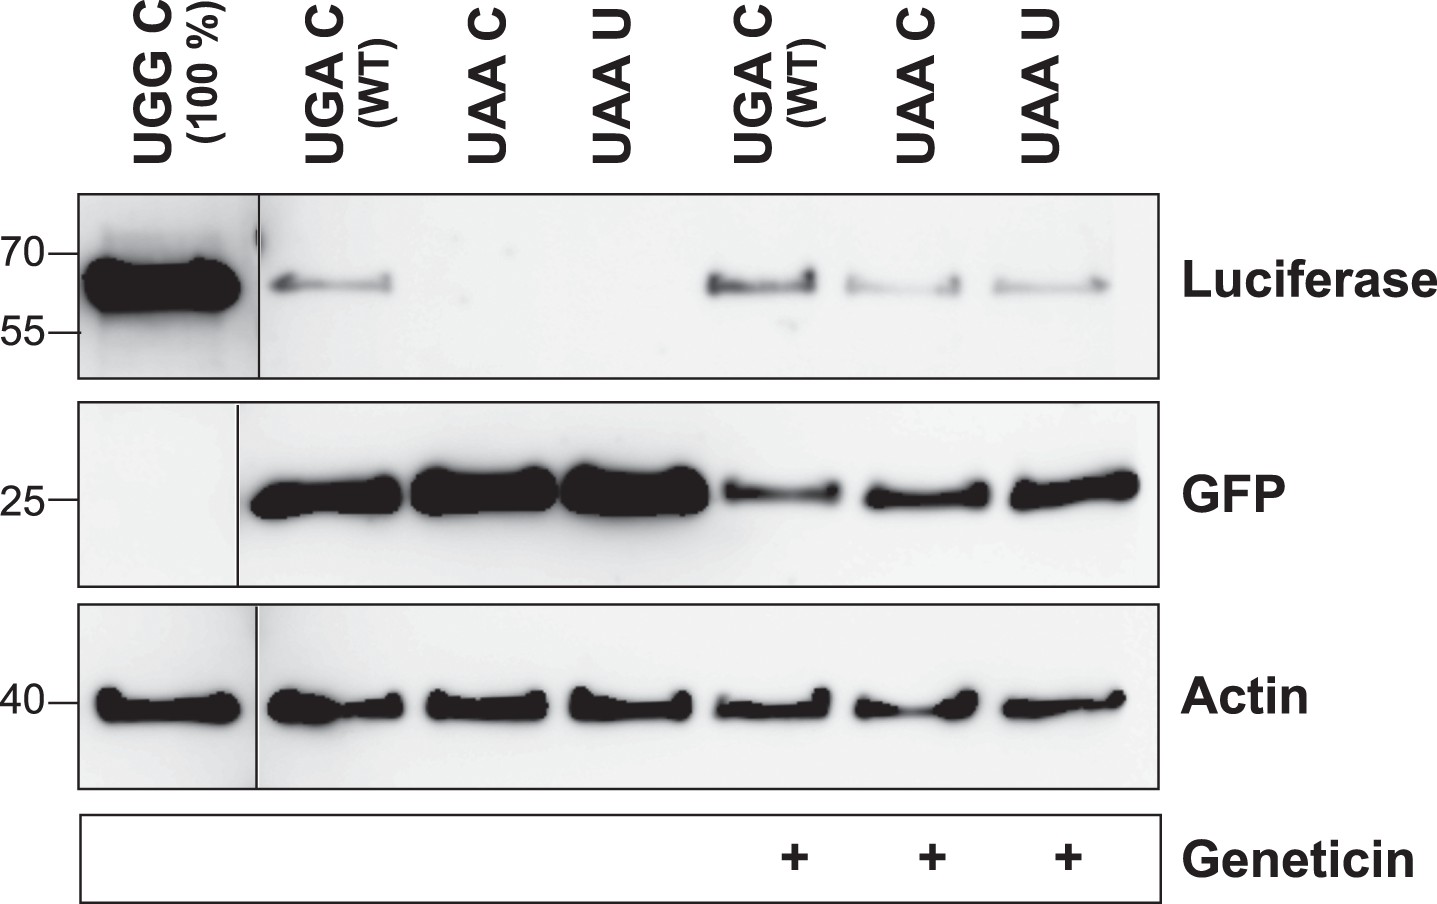
The LDHB stop context favors readthrough (Western blot).
HeLa cells transfected with Venus/hRluc dual reporter constructs were analyzed by Western blot. Wild-type LDHB stop context (UGA CUA (stop underlined)) allows stop codon readthrough. Mutation of the stop codon (UAA CUA) and the downstream bases (UAA UUA) reduces readthrough. Geneticin treatment (100 µg/ml) induces translational readthrough in all contexts. Molecular mass marker in kDa.
Figure 4
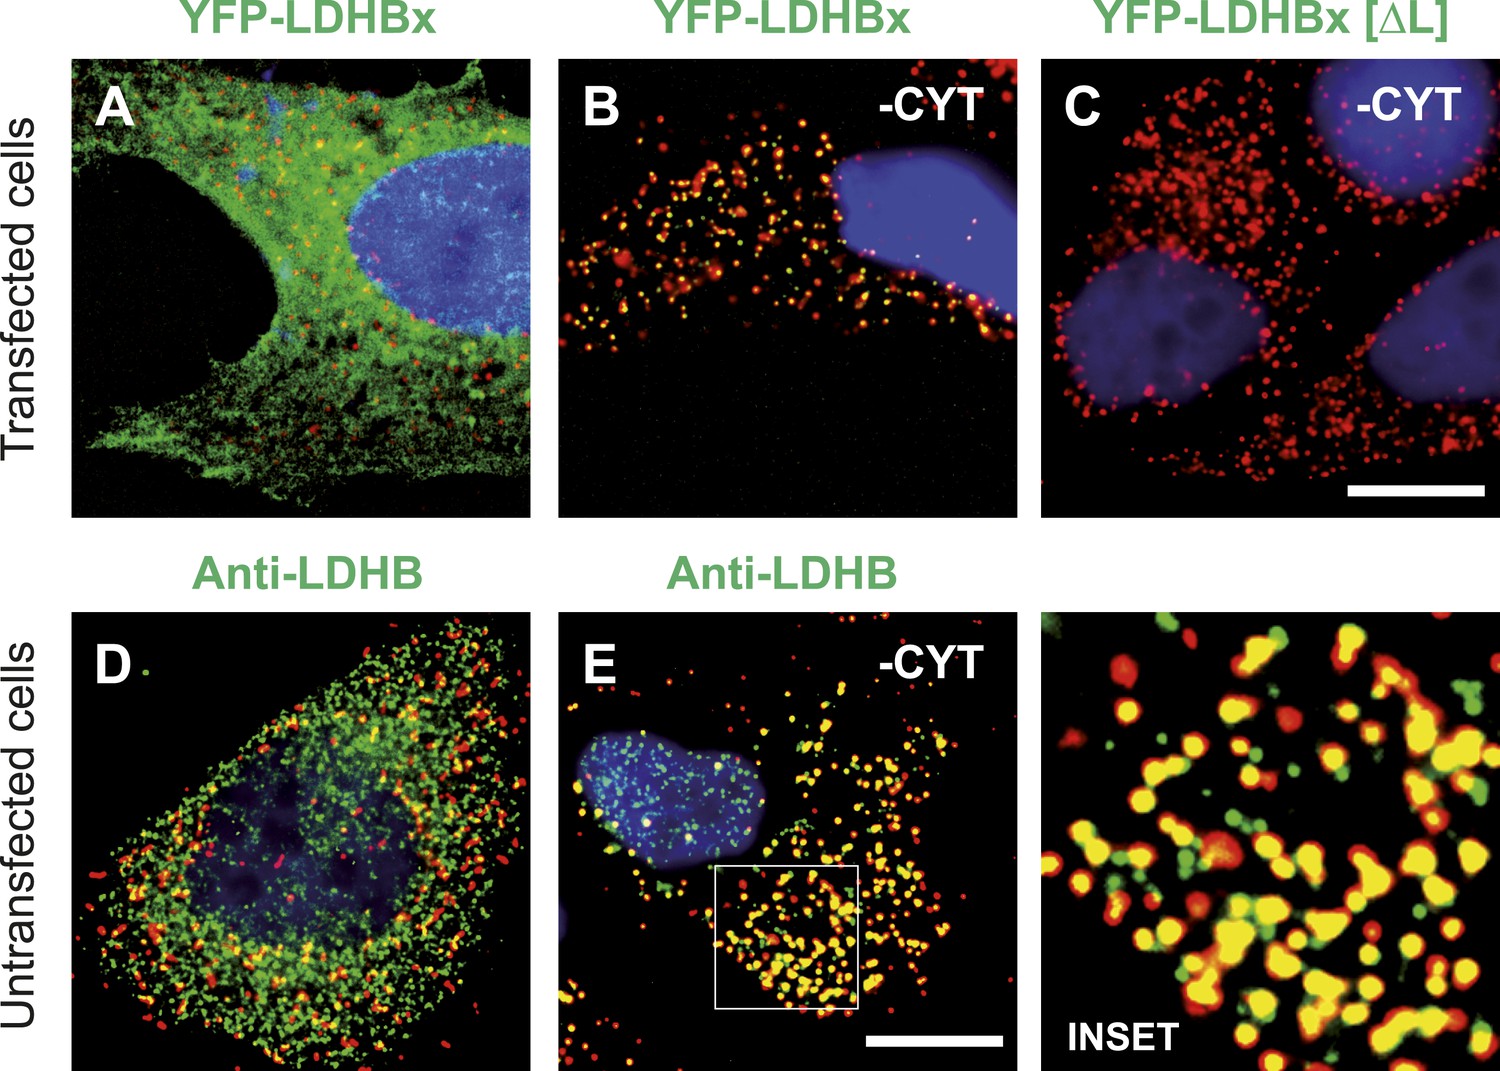
LDHBx targets to the peroxisome by translational readthrough and a hidden peroxisomal targeting signal type 1 (PTS1) in the 3′ extension.
(A–C) Direct fluorescence microscopy of transfected HeLa cells. Immunofluorescence with the peroxisome marker anti-PEX14 (red). (A) YFP-LDHB (green) mainly localizes to the cytosol. The strong fluorescence signal in the cytosol prevents detection of LDHB in other cellular compartments. (B) Upon plasma membrane permeabilization and removal of cytosol (-CYT), a small fraction of LDHB remains co-localized with the peroxisome marker. (C) Peroxisomal targeting of LDHB is dependent on the cryptic PTS1 Ser-Arg-Leu (SRL) in the extension. Deletion of the L in SRL blocks import into peroxisomes. (D and E) Endogenous LDHB is localized to peroxisomes in untransfected wild-type cells. Immunofluorescence with anti-LDHB (green) and anti-PEX14 (red) antibodies. (D) Endogenous LDHB is cytosolic. (E) Removal of cytosol (-CYT) reveals co-localization with PEX14. Bar 10 µm.
Figure 5 with 2 supplements
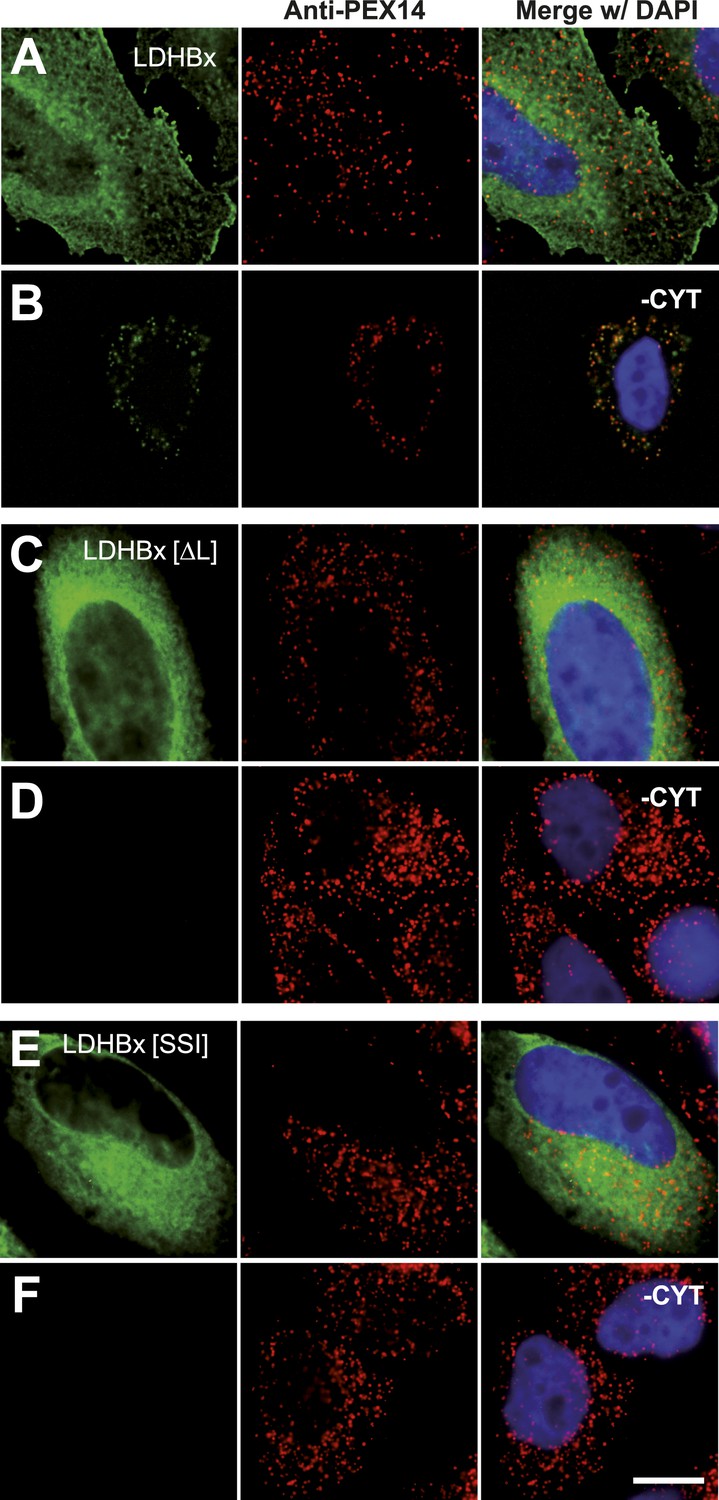
Peroxisome targeting of LDHBx is dependent on a hidden peroxisomal targeting signal in the readthrough extension.
Combined direct fluorescence and immunofluorescence in HeLa cells. (A) YFP-LDHBx expression: LDHBx is mainly cytosolic. (B) LDHBx targets to the peroxisome. Cells were permeabilized with digitonin, and cytosol was removed by washing with phosphate-buffered saline. (C–F) Mutation of the cryptic PTS1 in the extension blocks peroxisomal targeting of LDHBx. (C and D) Deletion of the amino acid L of the SRL in the PTS1 readthrough extension gives a wild-type cytosolic localization of LDHB and blocks import into the peroxisome completely. (E and F) Similarly, the SRL-to-SSI substitution does not interfere with cytosolic expression of the LDHB but completely blocks peroxisomal localization of LDHBx[SSI]. Bar 10 µm.
Figure 5—figure supplement 1
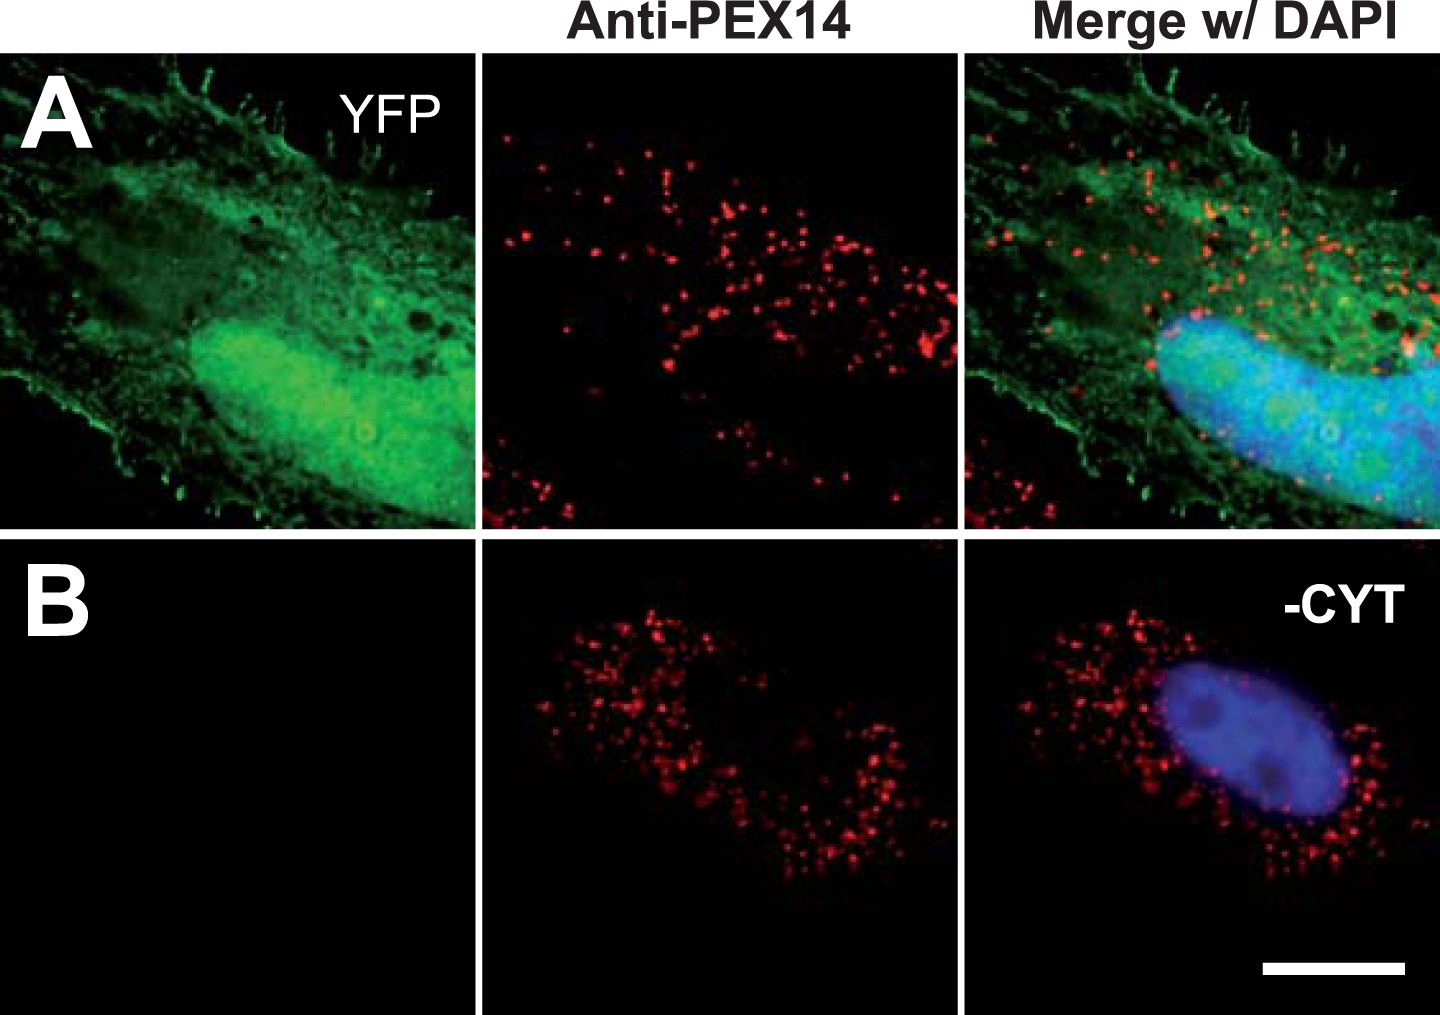
Permeabilization by digitonin allows complete removal of cytosol.
Combined direct fluorescence with anti-PEX14 immunofluorescence. HeLa cells were transfected with the empty vector expressing YFP in the cytosol. (A) Cytosolic expression of YFP. (B) Complete removal of cytosolic after cell permeabilization and washing with phosphate-buffered saline. Bar 10 µm.
Figure 5—figure supplement 2
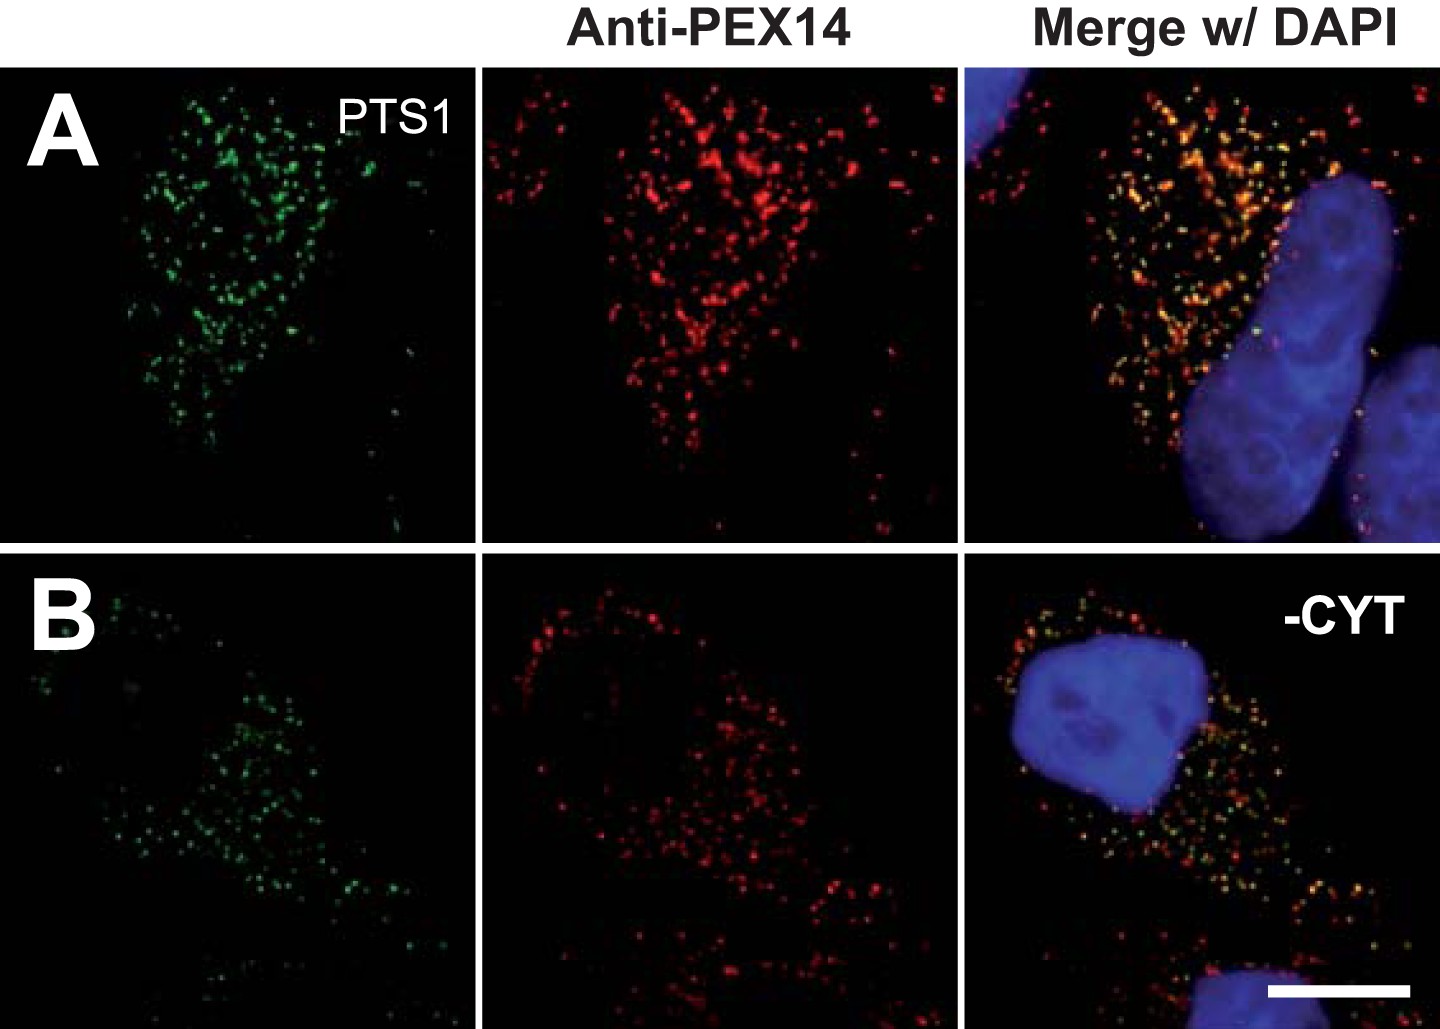
Cell permeabilization and removal of cytosol maintains peroxisomal integrity and co-localization of peroxisome marker (positive control).
Combined direct fluorescence with anti-PEX14 immunofluorescence in HeLa cells. (A and B) Cells were transfected with a construct expressing the PTS1 of ACOX3 fused to the C-terminus of the YFP variant Venus. (B) Co-localization of PTS1 and PEX14 after removal of cytosol following cell permeabilization. Bar 10 µm.
Figure 6
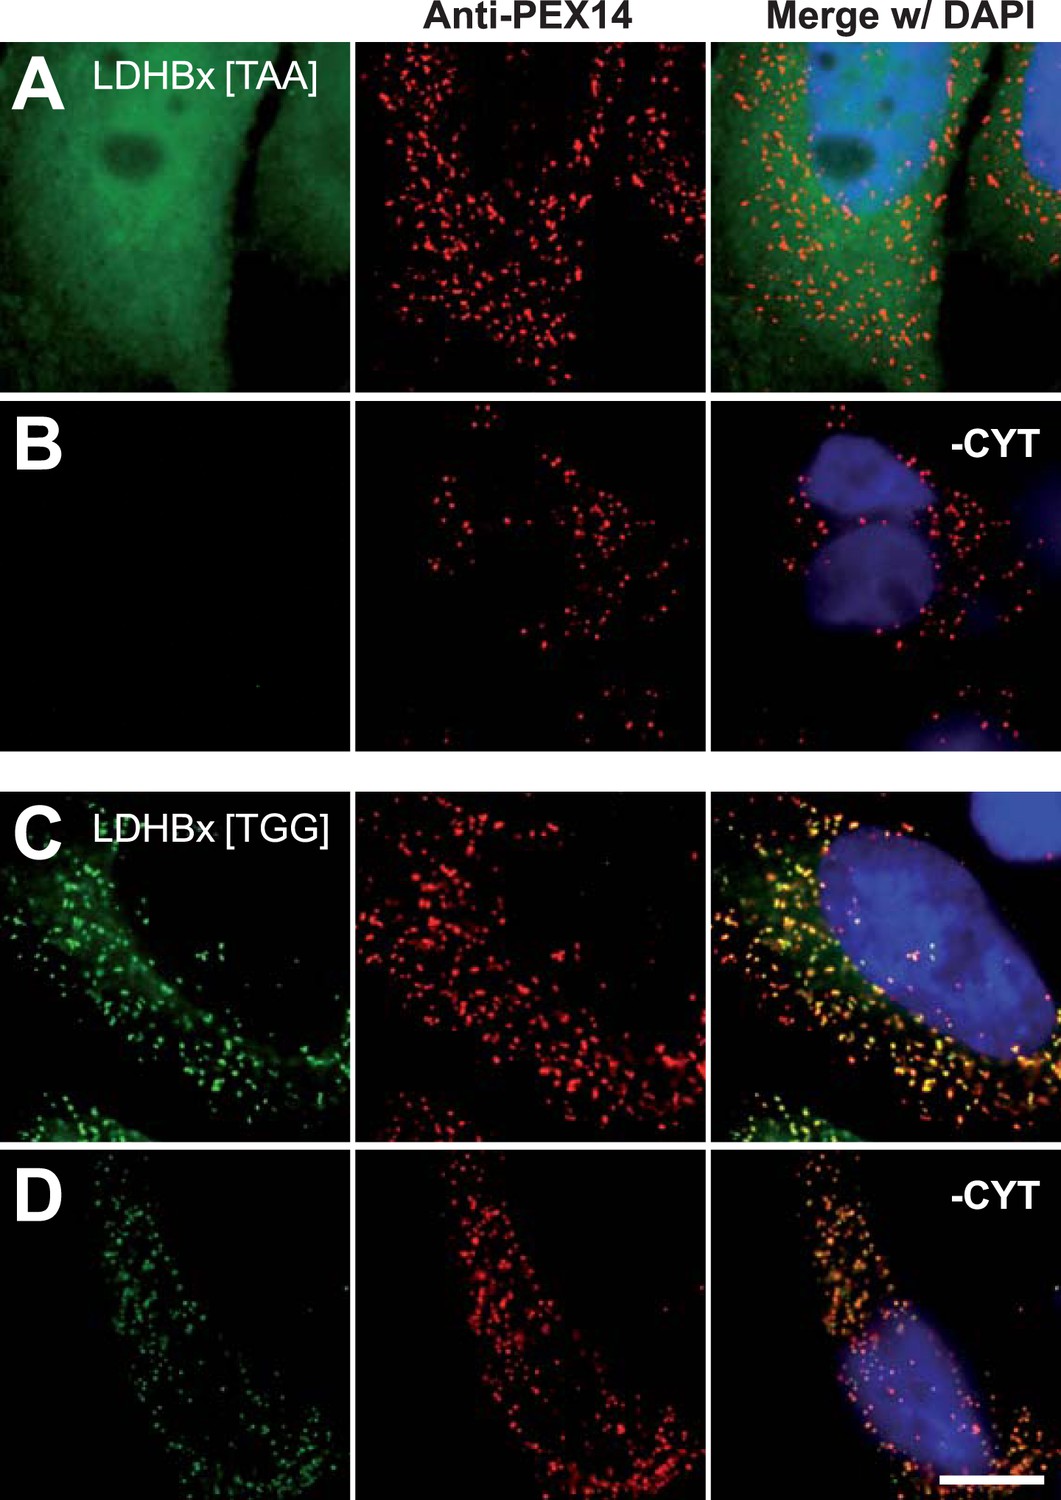
Peroxisome targeting of LDHBx is dependent on the stop codon.
Combined direct fluorescence and immunofluorescence in HeLa cells. (A and B) Exchange of UGA stop codon with the tighter stop UAA (YFP-LDHBx[TAA]) reduces peroxisomal localization of LDHB. (C and D) When UGA is replaced by tryptophan-coding UGG (LDHBx[TGG]), a larger proportion of LDHB is targeted to the peroxisome, and peroxisome localization becomes obvious without removal of the cytosol. (B, D) Cytosol was removed after cell permeabilization with digitonin. Bar 10 µm.
Figure 7
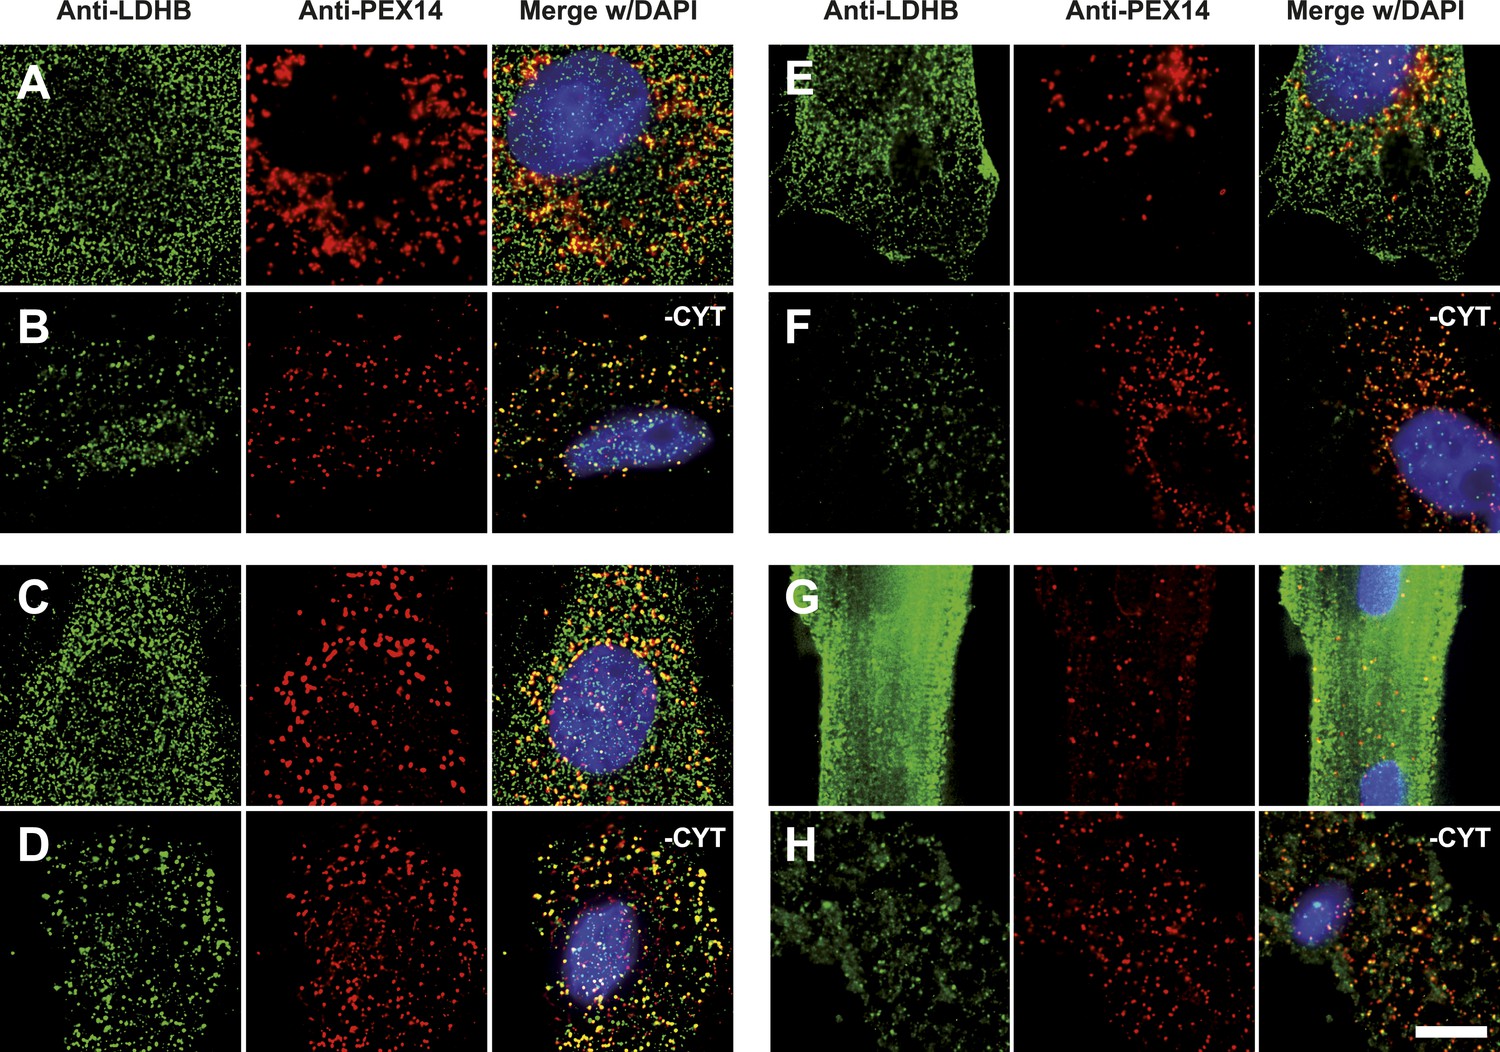
Endogenous LDHB is localized to peroxisomes in wild-type cells.
Immunofluorescence in wild-type cultured cells (A–F) or freshly prepared (G and H) cells with antibodies recognizing LDHB (secondary antibody Alexa488-coupled) and the peroxisome marker PEX14 (secondary antibody Cy3-coupled). (A and B) COS-7 cells, (C and D) human skin fibroblasts, (E and F) U118 glioblastome, and (G and H) primary rat cardiomyocytes. (B, D, F, H) Cytosol was removed after permeabilization with digitonin (-CYT). Bar 10 µm.
Figure 8
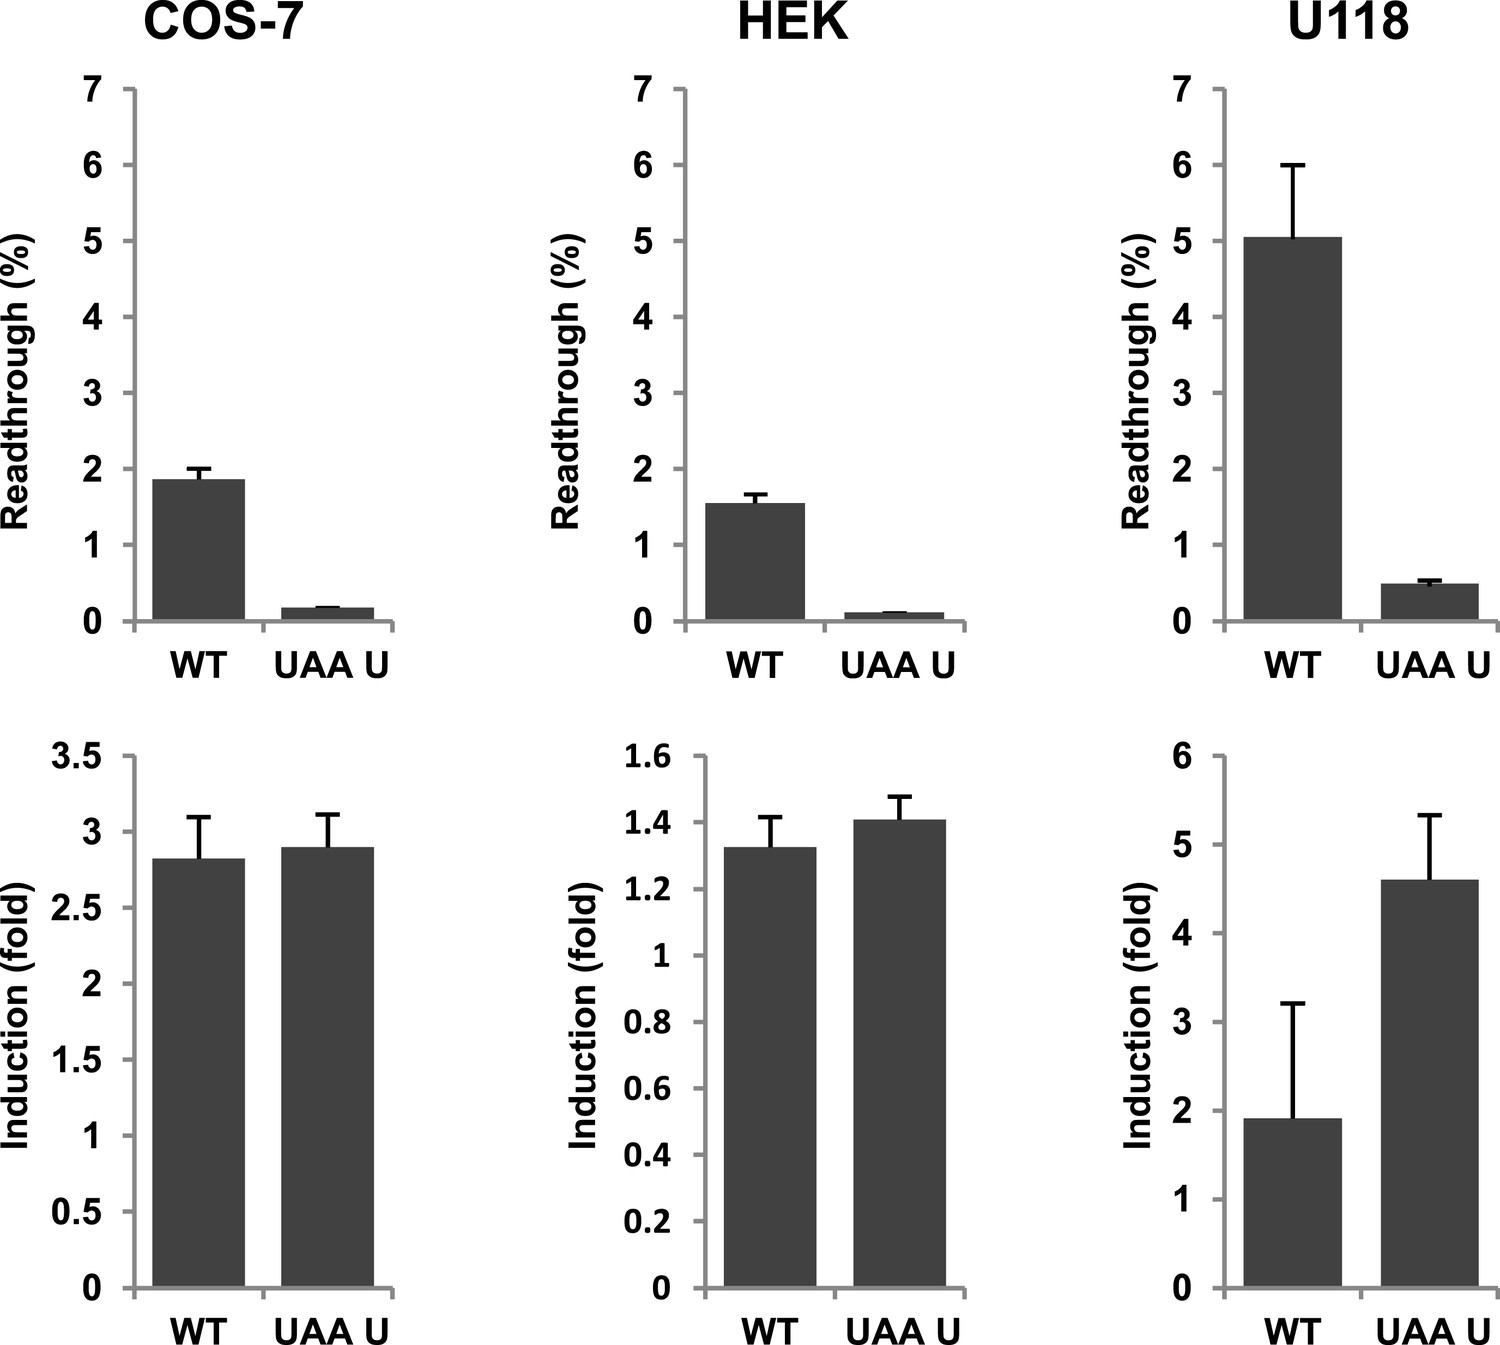
Evidence for regulation of readthrough.
LDHB stop codon readthrough in various mammalian cell types. COS-7, HEK, and U118 cells were transfected with LDHB and mutant dual reporter constructs and analyzed by Venus fluorescence and luciferase assays. Readthrough is expressed as hRLuc/Venus signal. Readthrough is induced by 100 µg/ml geneticin.
Figure 9
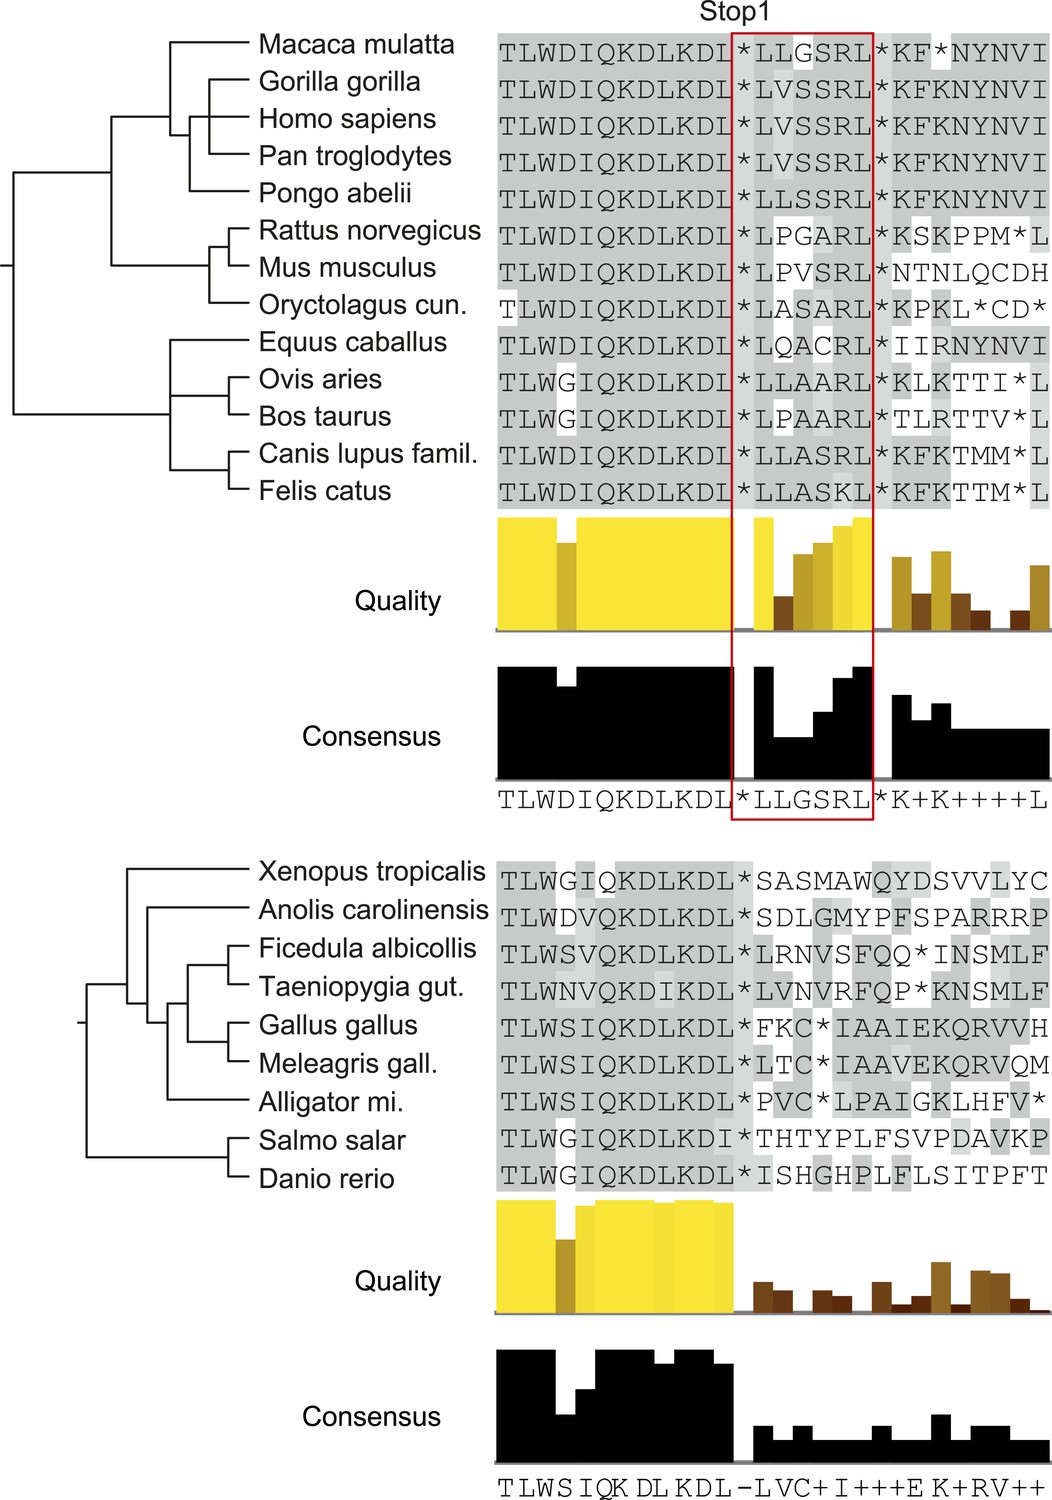
LDHBx extensions including hidden PTS1 are strictly conserved in mammals.
Alignments of LDHBx termini from mammals and non-mammalian vertebrates. PTS1 extension is boxed. The conserved readthrough PTS1 extension is found exclusively in mammals and marks the mammalian–non-mammalian border in vertebrates. Alligator mi.: Alligator mississippiensis; Canis lupus famil.: Canis lupus familiaris; Meleagris gall.: Meleagris gallopavo; Oryctolagus cun.: Oryctolagus cuniculus; Taeniopygia gut.: Taeniopygia guttata.
Figure 10 with 2 supplements

Piggy-back co-import of LDHA by LDHBx into peroxisomes.
Direct fluorescence of YFP-labeled LDHA (green) in the absence or presence of CFP-labeled LDHBx[TGG] (red) combined with immunofluorescence with a peroxisome marker (blue). (A) YFP-LDHA localization is mainly in the cytosol when expressed in the absence of LDHBx. (B) LDHA is imported into peroxisomes when co-expressed with LDHBx[TGG]. Cytosol was removed after permeabilization with digitonin. Bar 10 µm.
Figure 10—figure supplement 1
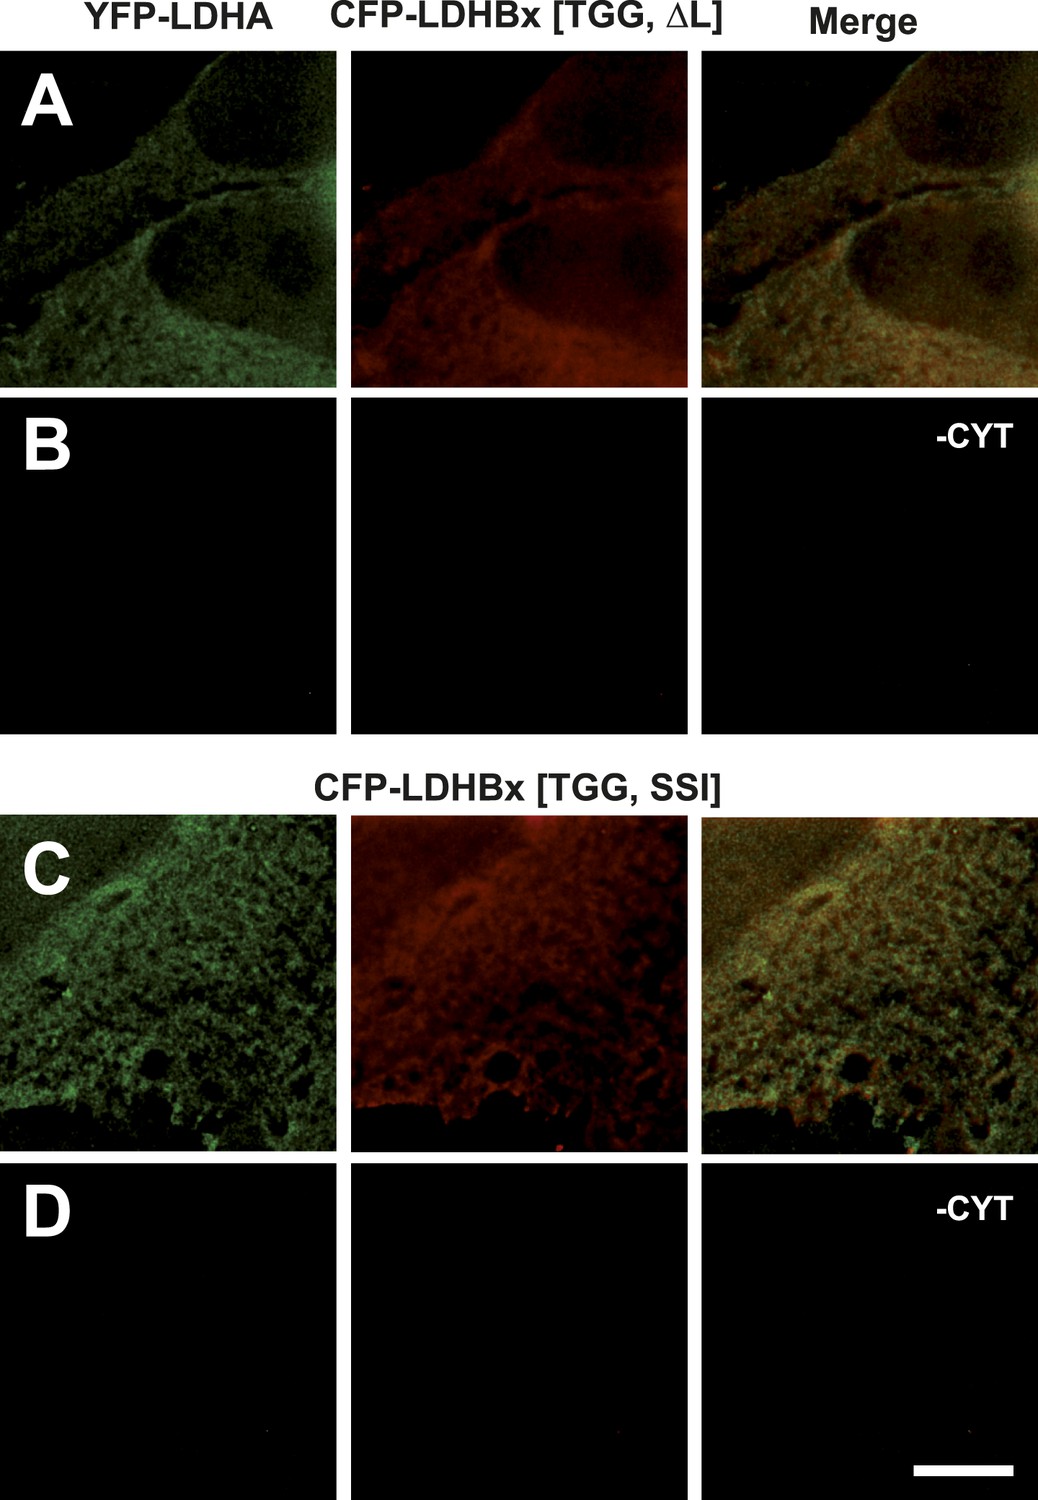
Mutation of the cryptic targeting signal SRL in LDHBx blocks co-import of LDHA into peroxisomes.
PTS1 mutated by deletion of the leucine (ΔL) or substitution of RL by SI (SSI) blocks co-import of LDHA into peroxisomes. (A and B) Co-expression of YFP-LDHA with CFP-LDHBx[TGG, ΔL]. (C and D) Co-expression of YFP-LDHA with CFP-LDHBx[TGG, SSI]. (B and D) Cytosol was removed after permeabilization with digitonin. Bar 10 µm.
Figure 10—figure supplement 2
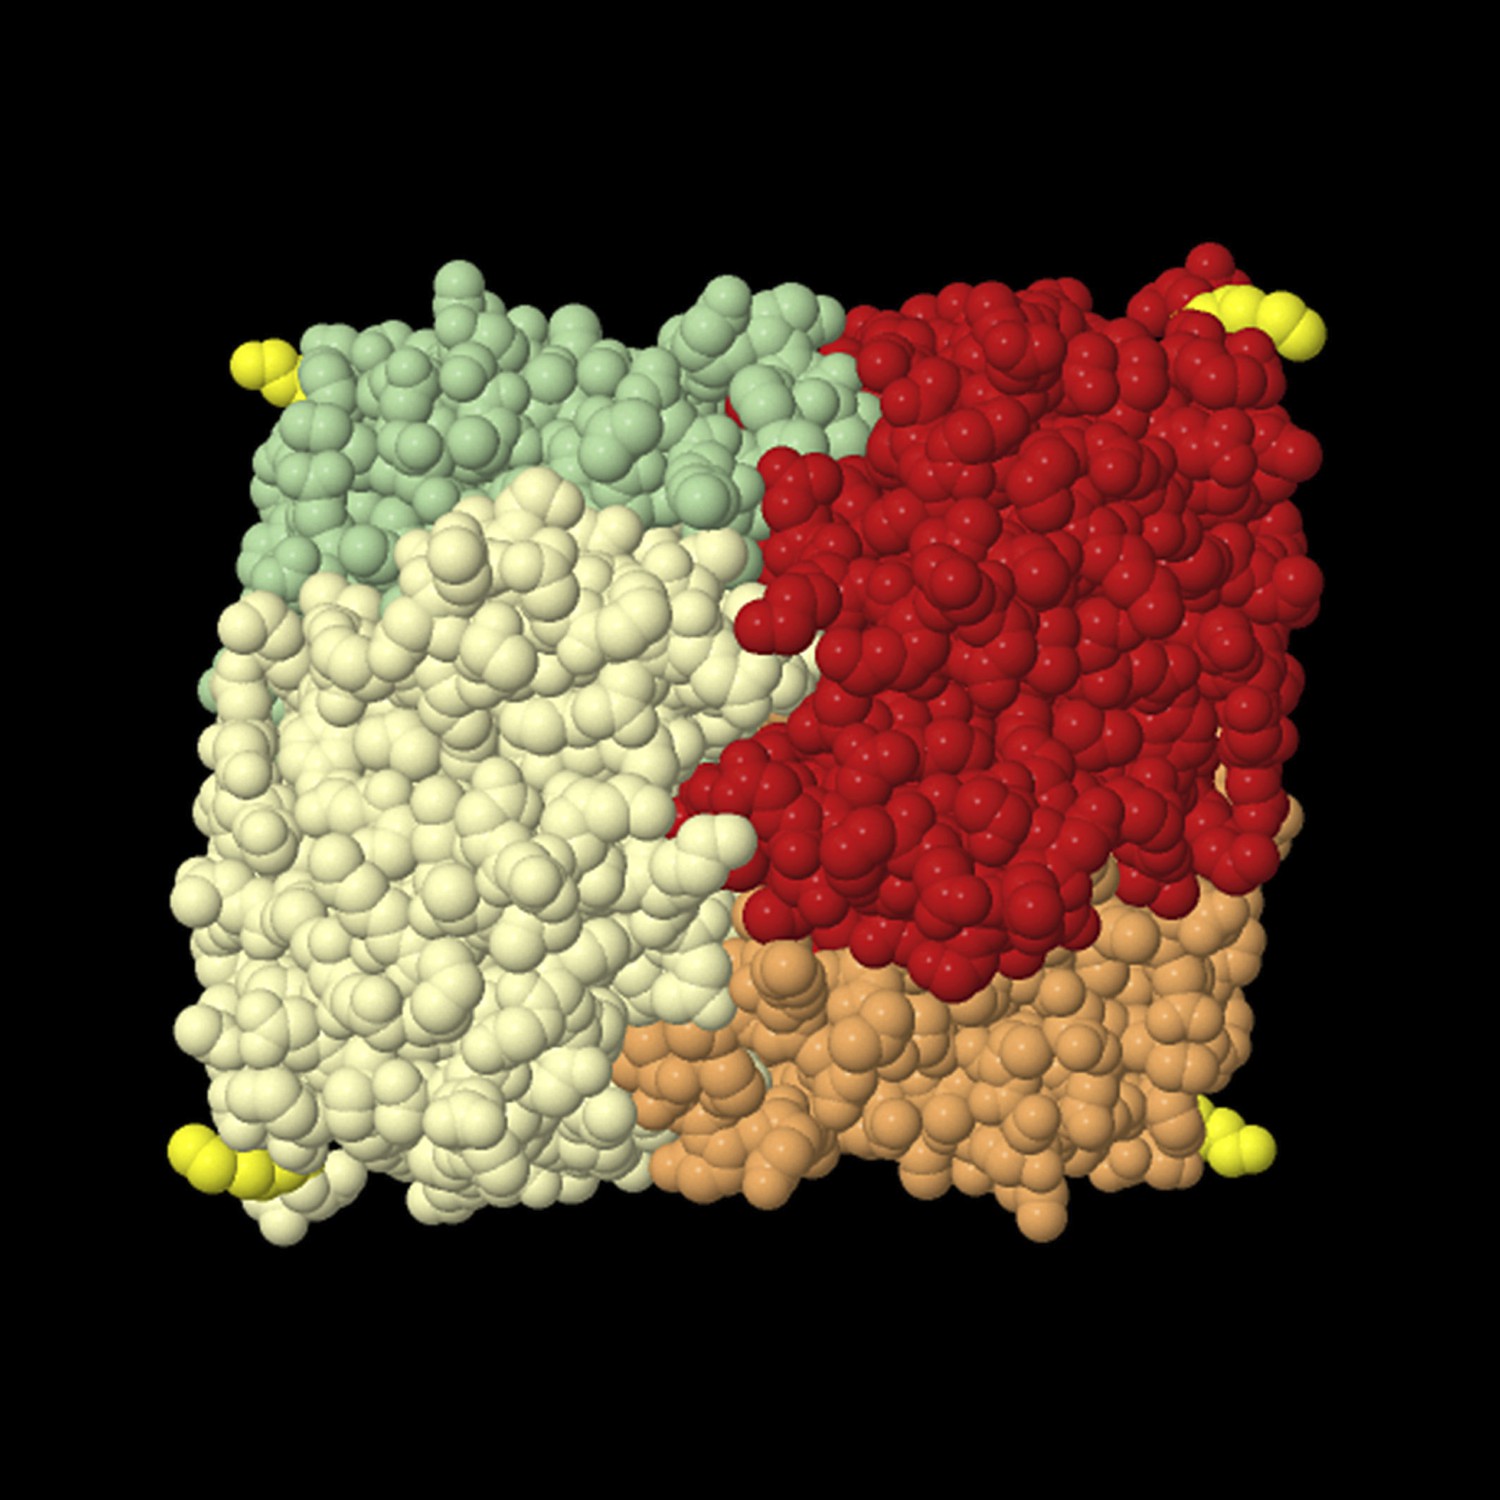
Tetrameric lactate dehydrogenase (space fill model) from human heart (LDH-1, all-B isoform).
The individual subunits are shown in different colors, and the last resolved amino acid at the C-terminus (Leu in position 331) of all subunits is shown in yellow. This structural model shows that the termini protrude from the compact tetramer. The readthrough LDH contains at least one subunit LDHBx that is extended by seven amino acids containing the PTS1. For import into the peroxisome, at least one C-terminus has to bind to the soluble PTS1 receptor PEX5. The structure also shows that the added PTS1 is unlikely to block oligomerization of the protein because the C-termini are far away from the interaction surface of the protomers. The PTS1 has to be protruding from the compact oligomer in an unstructured manner to be buried in the TPR domain pocket of PEX5. Therefore, it is also unlikely that the PTS1 extensions generated by readthrough fold back onto the protein to induce a conformational change that would interfere with the subunit interaction. The structural model is derived from structure 1IOZ (Read et al., 2001) in the International Protein Database (www.pdb.org) and was rendered using Jmol, an open-source Java viewer for chemical structures in 3D (http://www.jmol.org/).
Tables
Table 1
Additional experimental dual reporter readthrough data of stop codon context constructs used for the LINiter model
| Gene symbol | Stop codon context | Readthrough (%) (SD) |
|---|---|---|
| ZNF-574 | GATCAGTGGC TGA CTCTGCCCGA | 0.31 (0.020) |
| LDHB | AAAAGACCTG TGA CTAGTGAGCT | 1.55 (0.087) |
| PPP1R3F | ATTCTCCCAA TAA AGCTTTACAG | 0.18 (0.009) |
| LDHB [TGAT] | AAAAGACCTG TGA TTAGTGAGCT | 0.17 (0.009) |
| LDHB [TAA] | AAAAGACCTG TAA CTAGTGAGCT | 0.20 (0.009) |
| LDHB [TAAT] | AAAAGACCTG TAA TTAGTGAGCT | 0.17 (0.009) |
| LENG1 | CCTTACTCAC TGA CTCCTGAGGG | 0.26 (0.009) |
| VASN | GCCCTACATC TAA GCCAGAGAGA | 0.12 (0.004) |
| MDH1 | TTCCTCTGCC TGA CTAGACAATG | 2.91 (0.147) |
| PRDM10 | CACCAAACCA TGA CTTCCACCCT | 0.13 (0.005) |
| FBXL20 | CATCATCCTA TGA CAATGGAGGT | 0.10 (0.006) |
| THG1L | AGCCAGGCTT TGA CGGAAGAGTC | 0.15 (0.006) |
| EDEM3 | GGATGAGCTA TGA CTTGCTAAAC | 0.66 (0.027) |
| EDN1 | AGCACATTGG TGA CAGACCTTCG | 0.25 (0.008) |
| UBQLN1 | CCAGCCATCA TAG CAGCATTTCT | 0.13 (0.009) |
| IRAK3 | CAAAAAAGAA TAA ATTCTACCAG | 0.10 (0.007) |
| SLC3A1 | TACCTCGTGT TAG GCACCTTTAT | 0.18 (0.008) |
| LEPRE1 | GGATGAGCTA TGA CAGCGTCCAG | 0.27 (0.010) |
-
Stop codon constructs expressing plus/minus 10 nucleotides were analyzed in HeLa cells.
Table 2
Regression factors of the LINiter and LINfs3 models
| LINiter model (stop codon context position −6 to +9) | |||||||
|---|---|---|---|---|---|---|---|
| Base/position | −6 | −5 | −4 | −3 | −2 | −1 | 4 |
| A | −0.00041 | 0.00130 | −0.00028 | −0.00073 | −0.00071 | 0.00016 | −0.00037 |
| C | −0.00105 | 0.00164 | 0.00075 | −0.00004 | 0.00133 | 0.00109 | 0.00375 |
| G | 0.00060 | −0.00077 | −0.00041 | 0.00193 | −0.00048 | 0.00043 | −0.00156 |
| U/T | 0.00200 | −0.00103 | 0.00108 | −0.00002 | 0.00100 | −0.00054 | −0.00067 |
| Base/position | 5 | 6 | 7 | 8 | 9 | Stop | |
|---|---|---|---|---|---|---|---|
| A | −0.00068 | 0.00276 | −0.00020 | 0.00105 | −0.00081 | −0.00026 | TAA |
| C | −0.00097 | −0.00026 | −0.00062 | −0.00017 | 0.00148 | −0.00103 | TAG |
| G | −0.00008 | −0.00059 | 0.00245 | −0.00058 | 0.00014 | 0.00243 | TGA |
| U/T | 0.00287 | −0.00076 | −0.00049 | 0.00084 | 0.00032 |
| LINfs3 model (Stop and position +4 to +6) | |||||
|---|---|---|---|---|---|
| Base/position | 4 | 5 | 6 | Stop | |
| A | 0.00006 | −0.00071 | 0.00306 | 0.00005 | TAA |
| C | 0.00351 | −0.00056 | 0.00021 | −0.00052 | TAG |
| G | −0.00111 | 0.00010 | −0.00093 | 0.00229 | TGA |
| U/T | −0.00064 | 0.00299 | −0.00053 | ||
-
These model weights are ‘raw’, that is as obtained from the ridge regression procedure. For prediction of RTP, the weights associated with nucleotides within the stop codon context and the corresponding stop codon have to be added up. For calculation of our RTP score, we normalized the model weight vectors (i.e., the complete stack of weights) to Euclidean unit sum which corresponds to a division of weights by 0.0088 (LINiter) and 0.0063 (LINfs3), respectively. Furthermore, the sequence feature vectors were normalized to Euclidean unit sum which corresponds to a division by the square root of the length (3.6 and 2, respectively). As a shortcut to this, the sum of raw scores can be divided by 0.0317 and 0.0126, respectively.
Table 3
Nucleotide frequencies in each position of the stop codon context
| Nucleotide | A | C | G | U |
|---|---|---|---|---|
| Position | ||||
| −6 | 0.2892 | 0.2530 | 0.2651 | 0.1928 |
| −5 | 0.3253 | 0.2651 | 0.1446 | 0.2651 |
| −4 | 0.1566 | 0.2289 | 0.3494 | 0.2651 |
| −3 | 0.2410 | 0.3373 | 0.2410 | 0.1807 |
| −2 | 0.2651 | 0.1807 | 0.2048 | 0.3494 |
| −1 | 0.2410 | 0.2530 | 0.2651 | 0.2410 |
| 4 | 0.2289 | 0.3133 | 0.3373 | 0.1205 |
| 5 | 0.2651 | 0.2530 | 0.1446 | 0.3373 |
| 6 | 0.2771 | 0.2169 | 0.2530 | 0.2530 |
| 7 | 0.2530 | 0.3133 | 0.2892 | 0.1446 |
| 8 | 0.3253 | 0.1687 | 0.2410 | 0.2651 |
| 9 | 0.1807 | 0.2771 | 0.2771 | 0.2651 |
| Stop codons | UAA | UAG | UGA | |
| 1 to 3 | 0.1928 | 0.3373 | 0.4699 |
-
The nucleotide and stop codon frequencies for positions −6 to −1 and 4 to 9 were calculated for the 81 sequences used in the RTP predictor (LINiter model).
Additional files
-
Supplementary file 1
Plasmids used in this study.
- https://doi.org/10.7554/eLife.03640.025
-
Supplementary file 2
Oligonucleotides used in this study.
- https://doi.org/10.7554/eLife.03640.026
Download links
A two-part list of links to download the article, or parts of the article, in various formats.
Downloads (link to download the article as PDF)
Open citations (links to open the citations from this article in various online reference manager services)
Cite this article (links to download the citations from this article in formats compatible with various reference manager tools)
Peroxisomal lactate dehydrogenase is generated by translational readthrough in mammals
eLife 3:e03640.
https://doi.org/10.7554/eLife.03640


