Phenotype-based cell-specific metabolic modeling reveals metabolic liabilities of cancer
- Tel-Aviv University, Israel
- University of Cambridge, United Kingdom
- Leiden University, Netherlands
- Beilinson Hospital, Rabin Medical Center, Israel
- Tel Aviv University, Israel
Figures
Figure 1 with 1 supplement
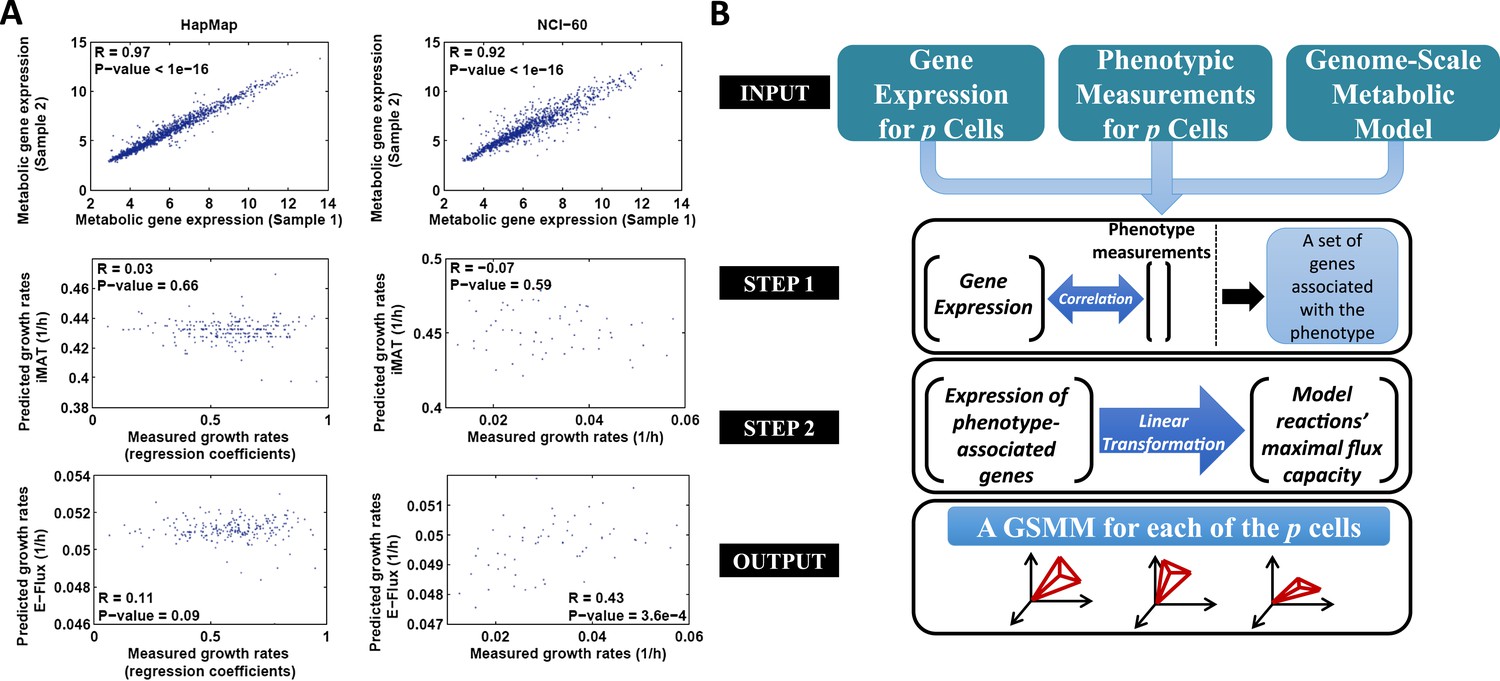
The PRIME pipeline and growth rate predictions obtained by different methods.
(A) Upper panel: Spearman rank correlation between the metabolic gene expression of two representative cell lines in the HapMap (left) and NCI-60 (right) datatset (the two cell lines represent the average correlation across the entire datasets); Middle panel: Spearman rank correlation between predicted and measured growth rates in the HapMap (left) and NCI-60 (right) datatset as predicted by iMAT, a method that utilizes discrete gene expression signature as input; Lower Panel: Spearman rank correlation between predicted and measured growth rates in the HapMap (left) and NCI-60 (right) datatset as predicted by E-Flux, a method that utilizes absolute gene expression levels as input. (B) A schematic overview of PRIME. As input, PRIME gets a GSMM and gene expression measurements for p cells together with their associated phenotypic measurement (e.g., proliferation rate). (Step 1): A set of genes whose expression is significantly associated with the phenotype is identified. (Step 2): A linear transformation from the expression of the phenotype-associated genes, to reactions' upper bound (maximal flux capacity) is applied (‘Materials and methods’). PRIME outputs a GSMM for each of the p input cells, such that each cell model generates a different feasible flux solution space. See also Figure 1—figure supplement 1.
Figure 1—figure supplement 1
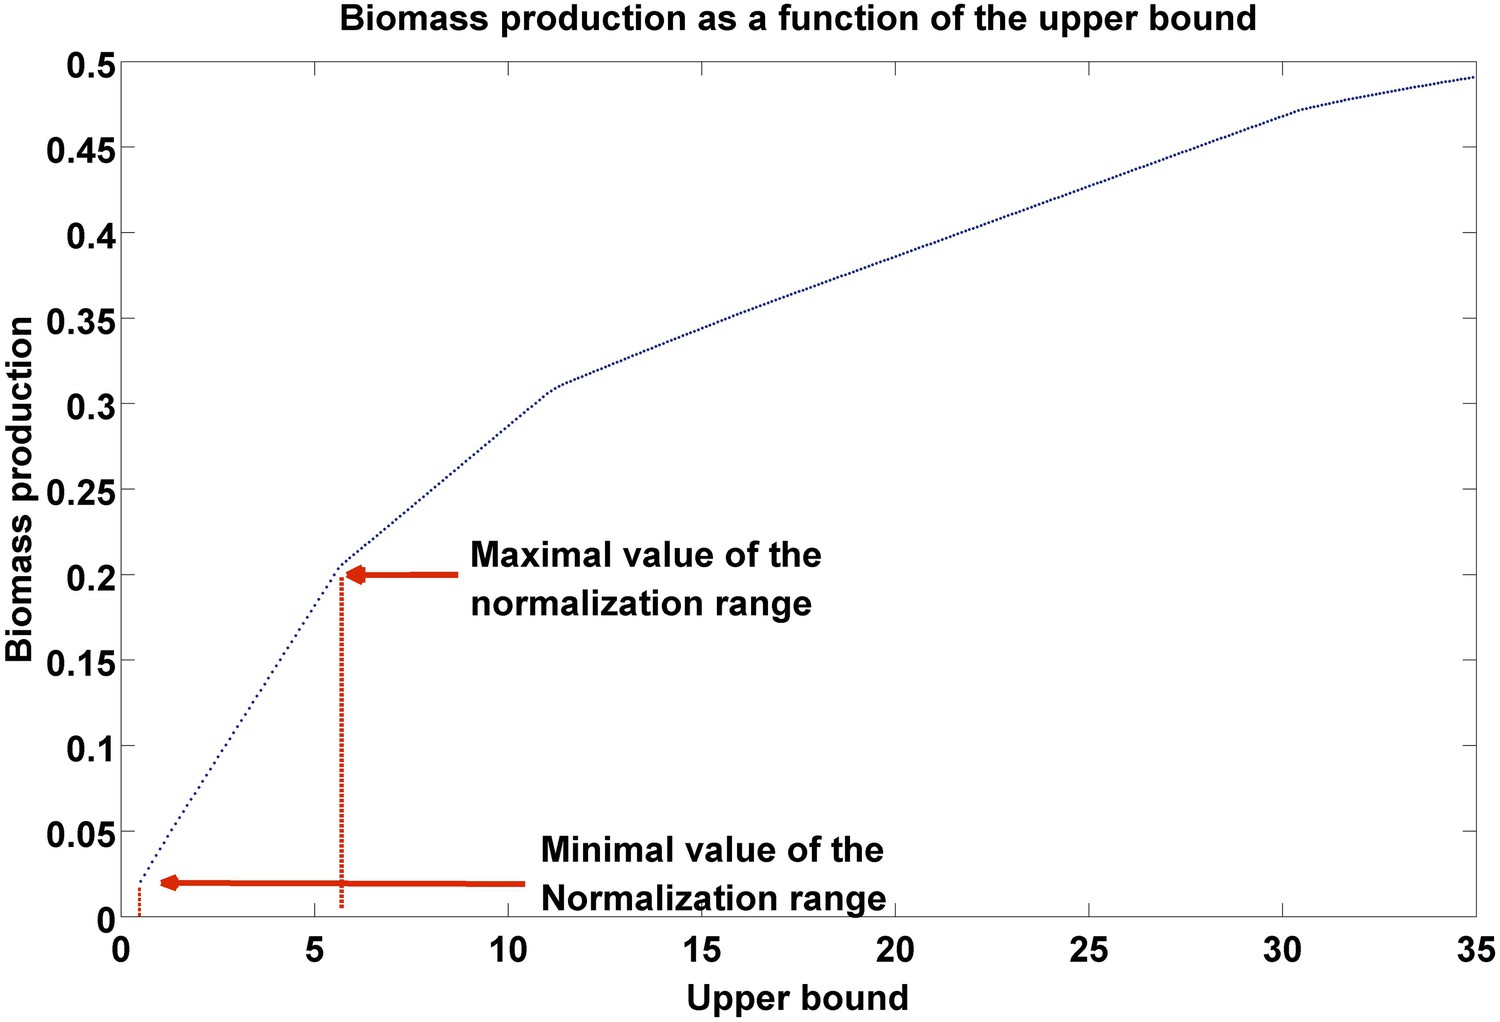
Biomass production as a function of flux upper bound.
A piecewise linear curve representing the change in biomass production as a function of the upper bound. The latter are modified gradually over the subset of growth-associated reactions, starting from the minimal flux necessary for growth (as estimated over the subset of essential reactions, ‘Materials and methods’), to the maximal bound in the model. The normalization range is set to the first segment of the piecewise linear curve.
Figure 2
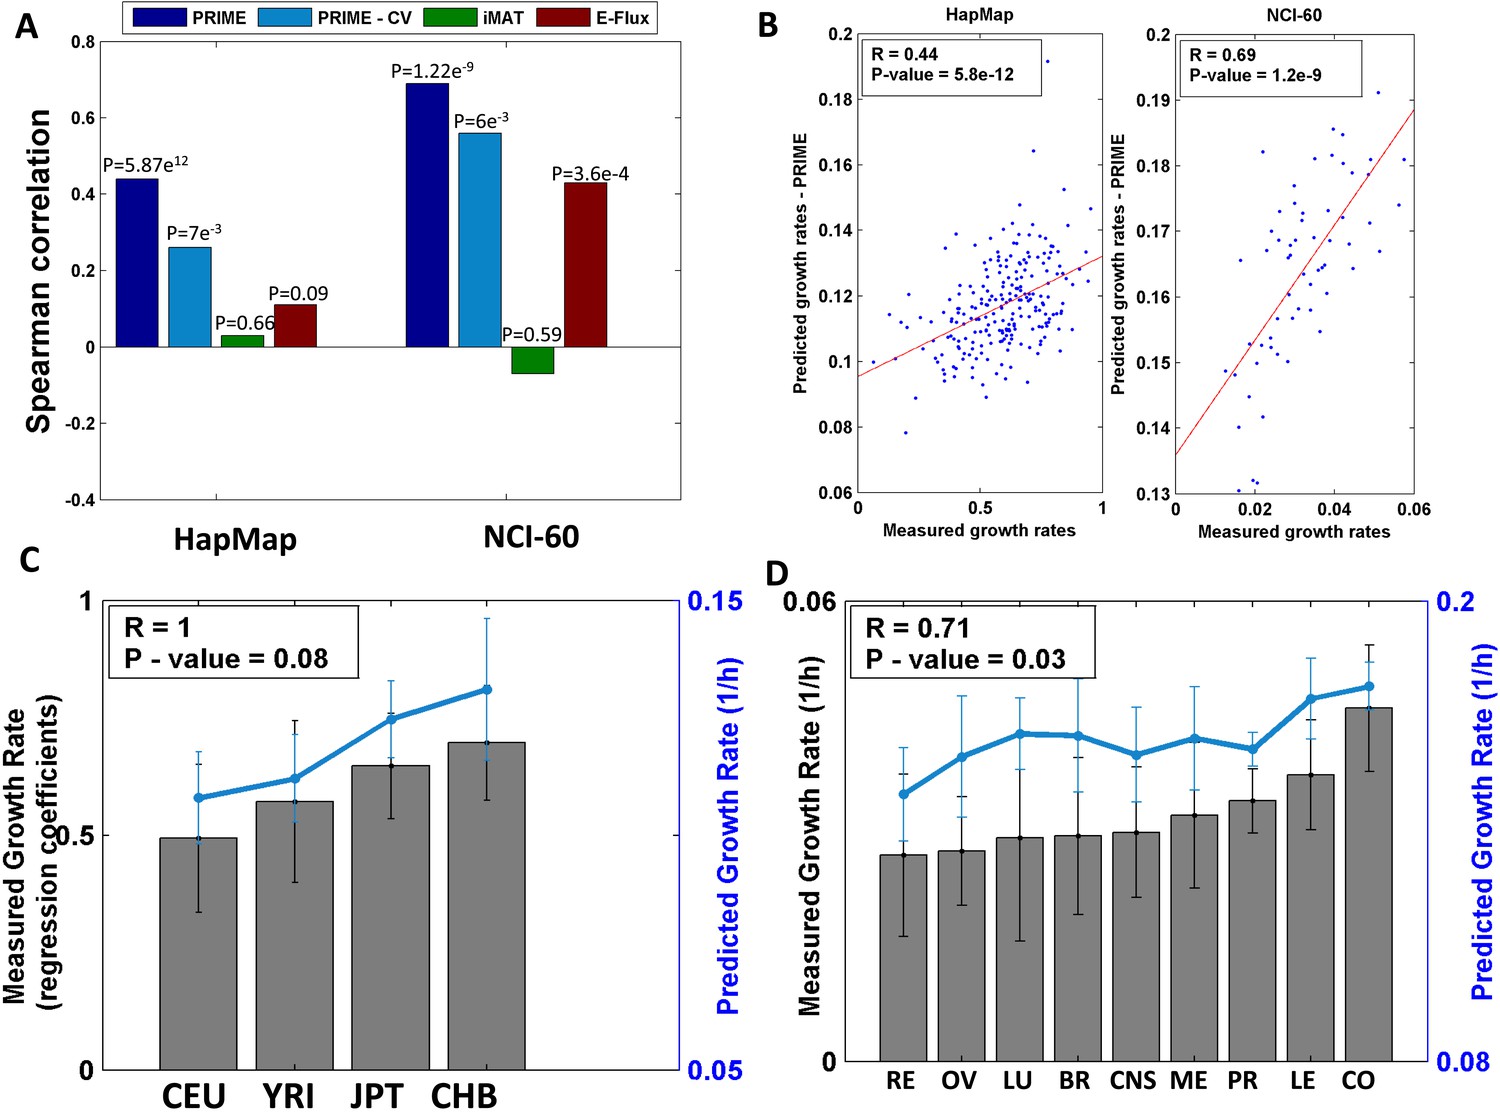
Growth rate predictions obtained by PRIME.
(A) The Spearman correlation achieved by the different methods in predicting the individualized growth rates measurements across the HapMap and NCI-60 cell lines. (CV; Cross-Validation). (B) Individual predicted vs measured growth rates in the HapMap (left) and NCI-60 (right) datasets. (C) A comparison between mean predicted and measured growth rates across the four HapMap populations. Measured growth rates are represented as bars and the predicted growth rate is represented as a line. PRIME correctly predicts the population-based order of proliferation rates: CEU < YRI < JPT < CHB. (D) A comparison between mean predicted and measured growth rates across the nine tumor types composing the NCI-60 collection. Measured growth rates are represented as bars and the predicted growth rate is represented as a line (Spearman R = 0.71, p-value = 0.03); Leukemia (LE); Breast (BR); Central Nervous System (CNS); Colon (CO); Renal (RE); Lung (LU); Ovarian (OV); Prostate (PR); Melanoma (ME).
Figure 3 with 1 supplement

Drug response, biomarkers and selectivity analysis.
(A) A comparison between measured and predicted drug response for the HapMap, CEU (Western European ancestry) and NCI-60 datasets. Overall, significant correlations (Spearman p-value < 0.05) were obtained for 12 out of the 16 drugs examined (those marked with an asterisk). The HapMap drugs are 5-fluorouracil (5FU) and 6-mercaptopurin (6MP); the CEU drugs are Ethacrynic acid, Hexachlorophene, Digoxin, Azathioprine, Reserpine and Pyrimethamine; The NCI-60 drugs for dataset 1 include Gemcitabine, Methotrexate and Pyrimethamine; For dataset 2, Trimetrexate and Gemcitabine; For dataset 3, Methotrexate, Quinacrine HCl and Allopurinol. (B) 14 metabolites for which a significant correlation between measured and predicted uptake and secretion rates is achieved. Both the Spearman correlation coefficient (gray) and the–log(p-value) (blue) are shown. The dashed line represents the FDR corrected significance level for α = 0.05. (C) Metabolic reaction targets that are predicted to be non-selective (green) or selective (blue). The x-axis represents the selectivity score (‘Materials and methods’) and the y-axis represents the growth inhibition predicted for the normal cell lines. Non-selective targets are predicted to reduce both normal and cancer cell growth by more than 50%. The selective targets are predicted to reduce normal cell growth by less than 20% and cancer cell growth by more than 30%. MLYCD is the third ranked target with a predicted reduction of >90% in cancer cell growth and <10% in normal cell growth. See also Figure 3—figure supplement 1. (D) Growth survival (in %) for the HapMap (normal) and NCI-60 (cancer) cell lines upon MLYCD knock down, as predicted by E-Flux and PRIME. While E-Flux predicts less than 10% reduction in cellular growth for both normal and cancer cell lines in a largely indiscriminate manner, PRIME predicts a cancer selective effect.
Figure 3—figure supplement 1
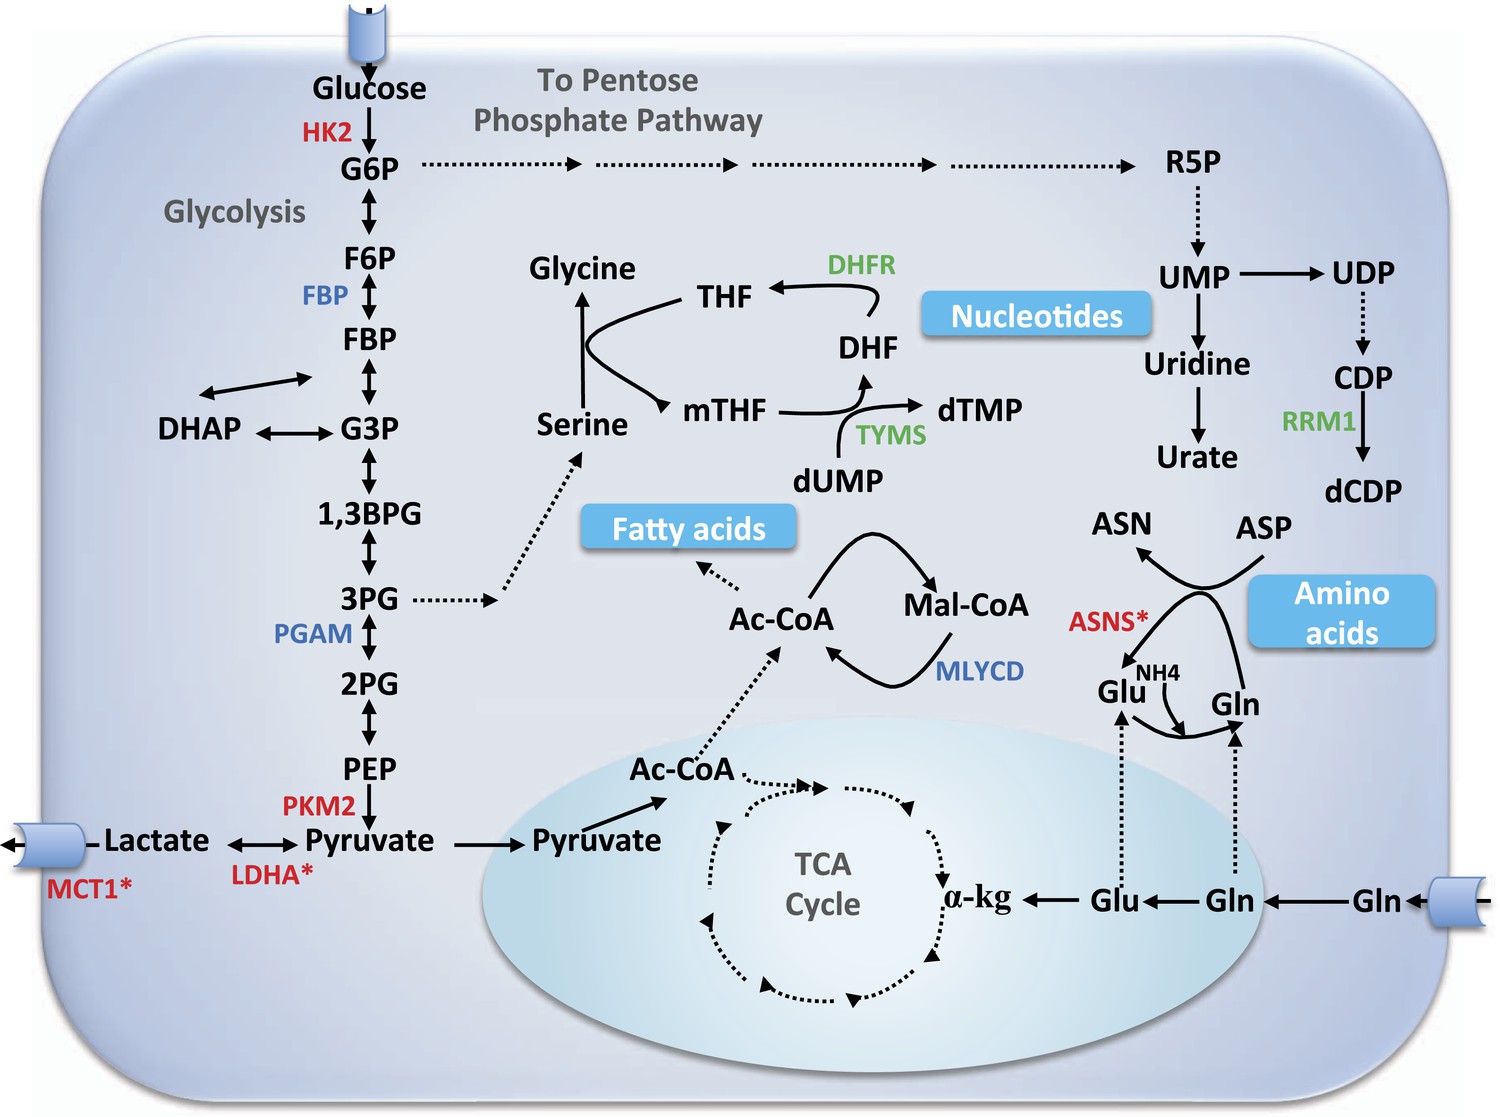
Core metabolic pathways and their association with selective and non-selective predicted targets.
Metabolic enzymes colored green are a subset of known cytostatic drug targets. Metabolic enzymes colored red are those found in current clinical trials (and thus likely to be more selective than traditional cytotoxic drugs), out of which those marked by an asterisk were identified as selective targets in our simulations as well. Metabolic enzymes colored blue denote novel selective predictions according to our simulations. αKG, α-ketoglutarate; Ac-CoA, acetyl CoA; ASN, aspargine; ASNS, asparagine synthetase; ASP, aspartate; 1,3BPG, 1,3 biphosphoglyxerate; DHF, dehydrofolate; DHFR, dehydrofolate reductase; CDP, cytosine diphosphate; dCDP, deoxycytosine diphosphate; DHAP, dehydroxyacetone phosphate; dTMP, deoxythymidine monophosphate; dUMP, deoxyuridine monophosphate; F6P, fructose-6-phosphate; FBP, fructose-1,6-bisphosphate; G3P, glyceraldehydes 3-phospate; G6P, glucose-6-phosphate; Gln, glutamine; Glu, glutamate; HK2, hexokinase 2; LDHA, lactate dehydrogenase A; Mal-CoA, malonyl coa; MCT1, monocarboxylate transporter 1,4; mTHF, 5,10-Methylenetetrahydrofolate; MYLCD, malonyl-CoA decarboxylase; 2PG, glycerate 2-phosphate; 3PG, glycerate 3-phosphate; PEP, phosphoenolpyruvate; PGAM, phosphoglycerate mutase; PKM2, pyruvate kinase M2 isoform; R5P, ribose-5-phosphate; RRM1, ribonucleotide reductase M1; SHMT1, serine hydroxymethyltransferase 1; TCA, tricarboxylic acid; THF, tetrahydrofolate; TYMS, thymidylate synthase; UDP, uridine diphophate; UMP, uridine monophosphate; UPP1, uridine phosphorylase.
Figure 4 with 1 supplement
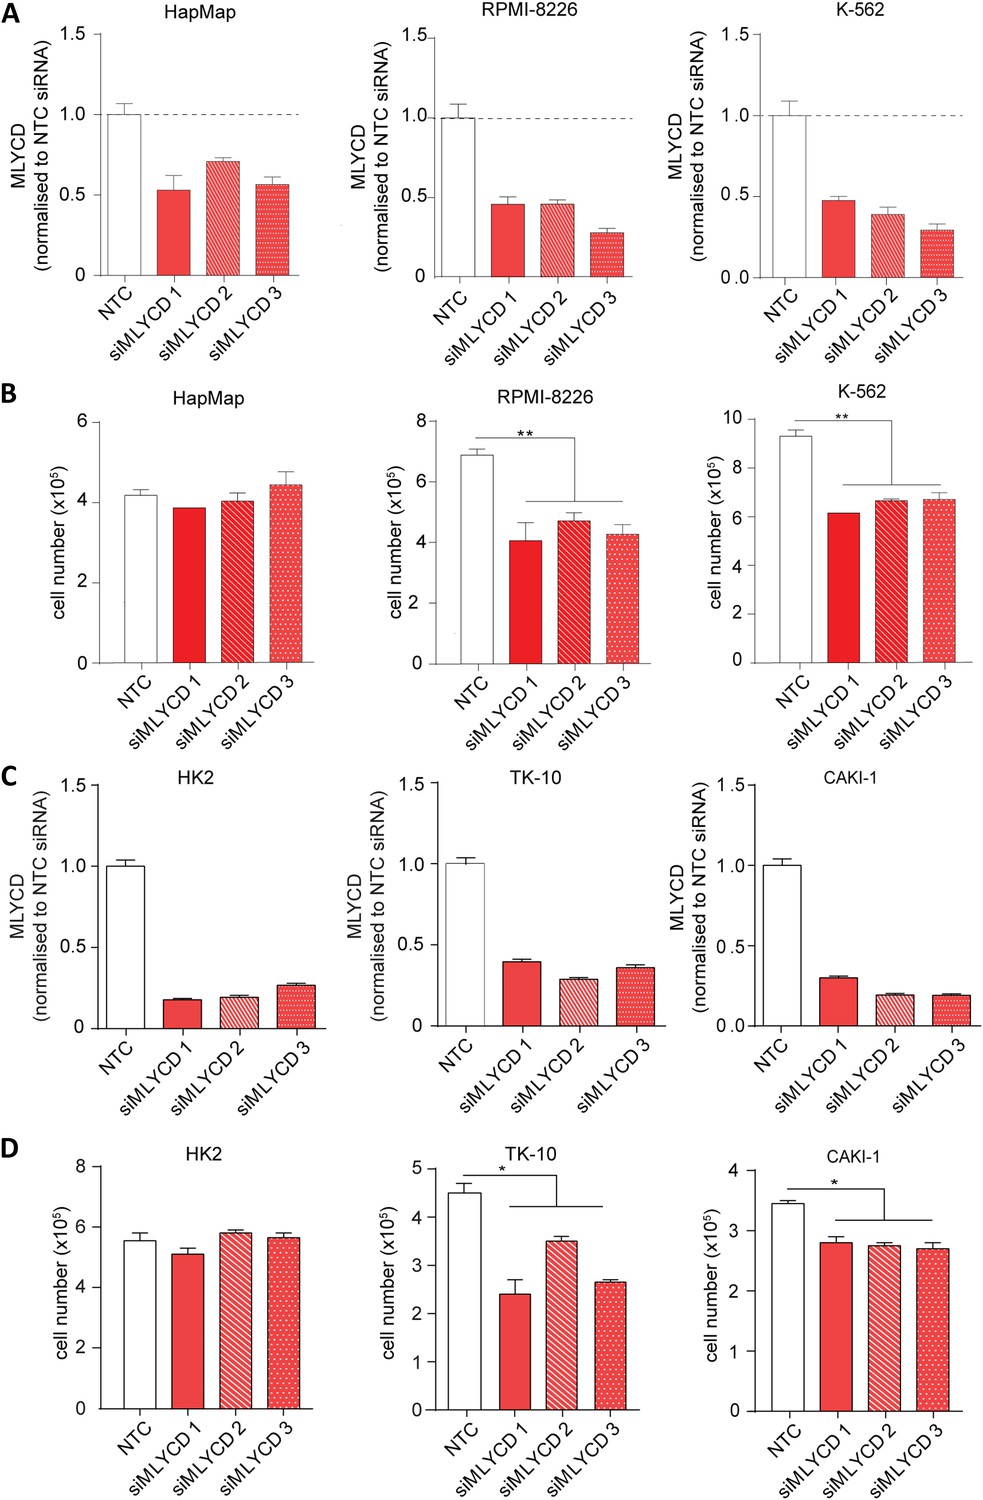
MLYCD depletion on normal and cancer cell lines.
(A) MLYCD mRNA expression upon nucleofection with Non Targeting Control (NTC) and three independent siRNA constructs in HapMap, RPMI-8226 and K562 cells. (B) Cell counts after 72 hr of culture of the indicated cell lines. (C) MLYCD mRNA expression upon nucleofection with Non Targeting Control (NTC) and three independent siRNA constructs in HK2, TK10 and CAKI1 cells. (D) Cell counts after 72 hr of culture of the indicated cell lines. Data are shown as mean ± s.e.m of three independent cultures. *p-value<0.05. **p-value<0.01. ***p-value < 0.001.
Figure 4—figure supplement 1
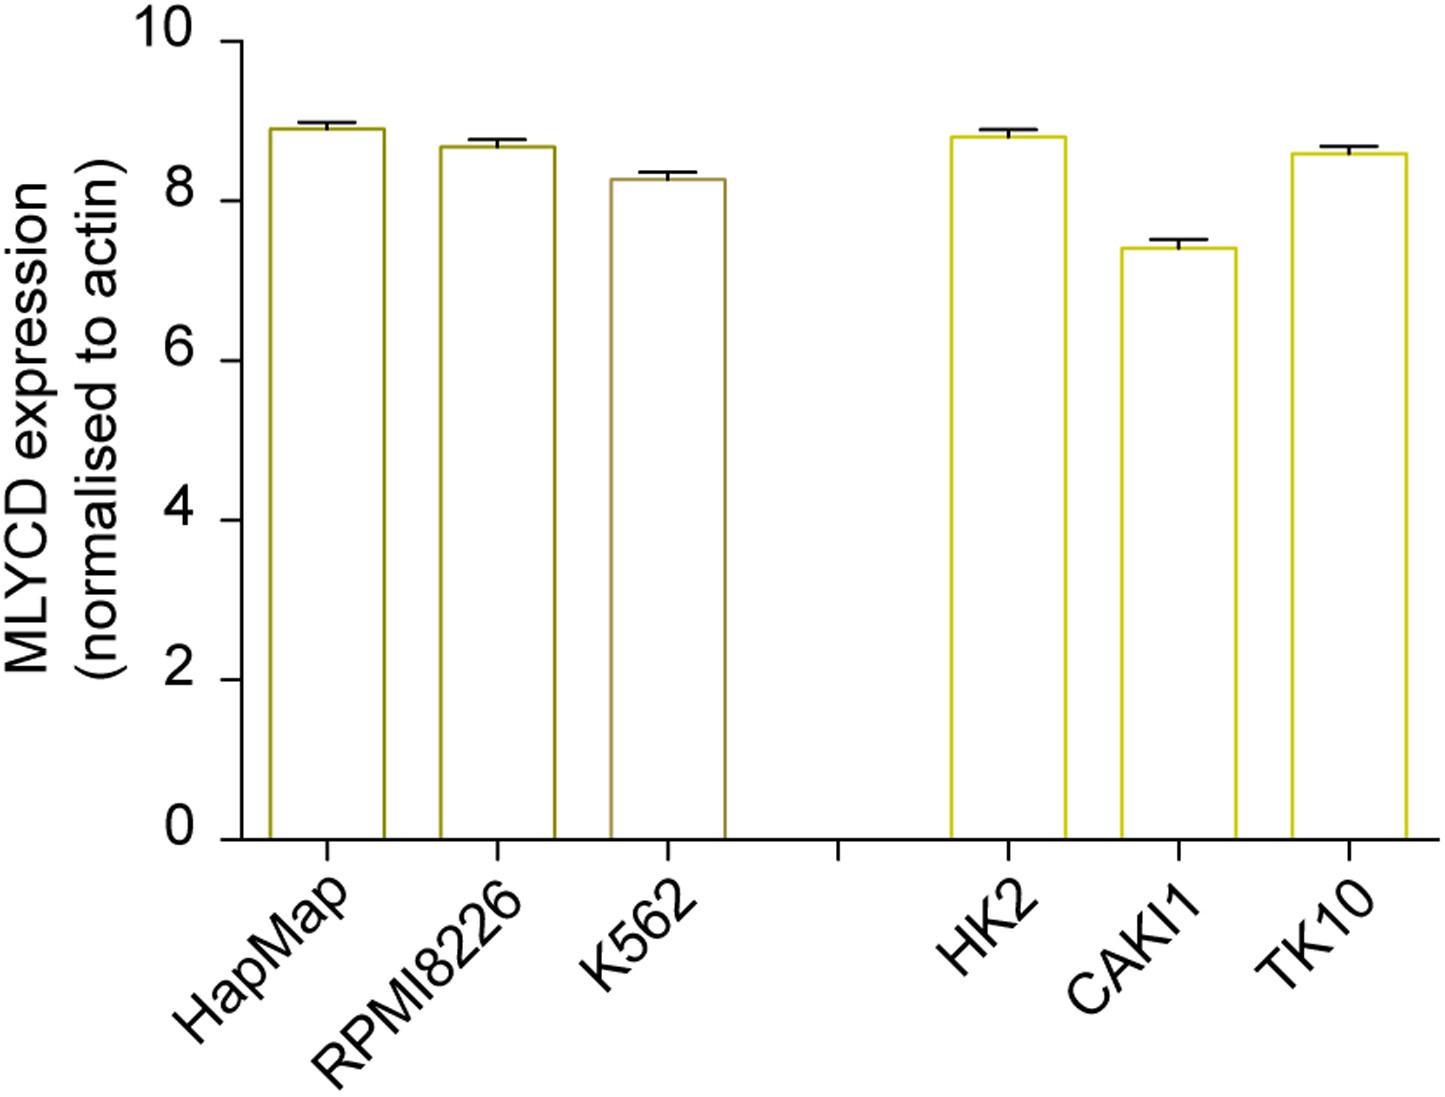
Expression levels of MLYCD across multiple cancer and normal cell lines.
mRNA levels of MLYCD in the indicated cell lines was measured by qPCR. Data are indicated as ΔCT of MLYCD vs Actin in the indicated cell lines.
Figure 5 with 6 supplements
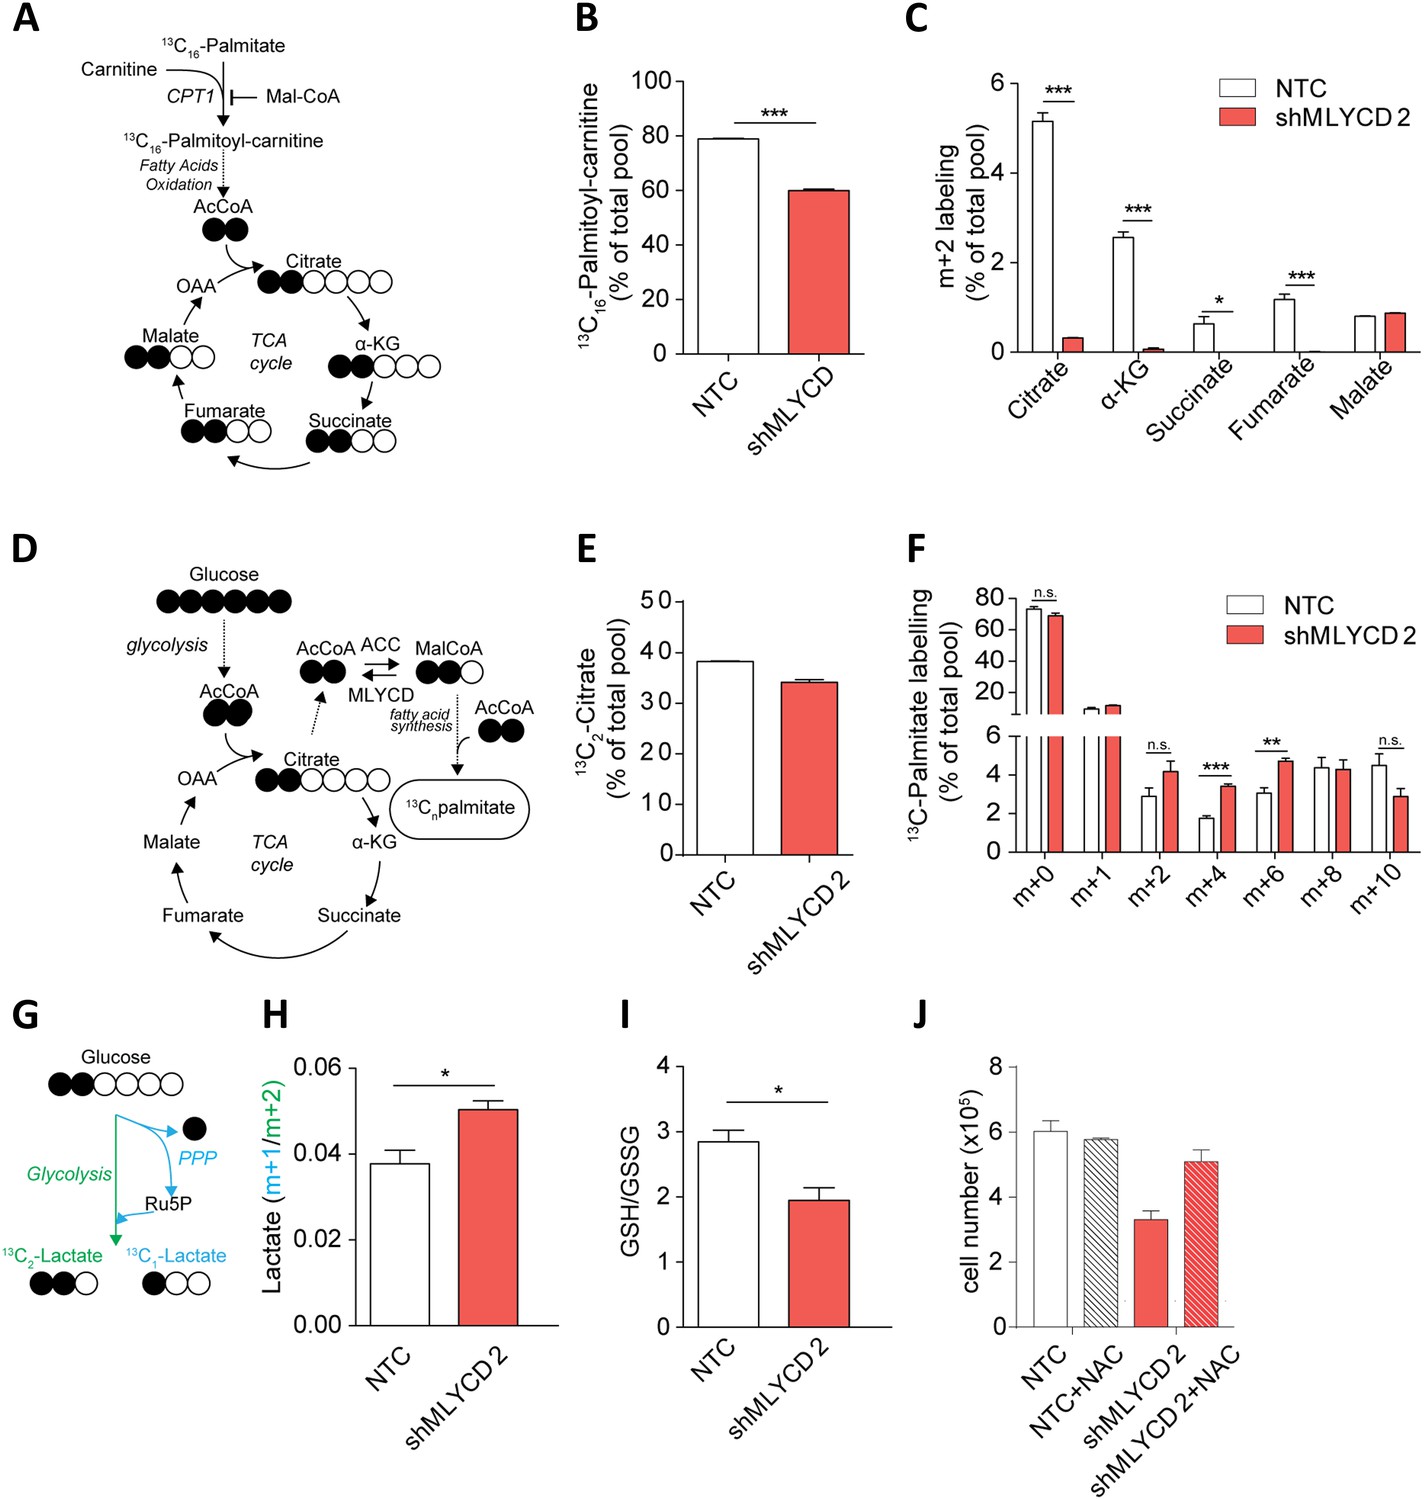
Metabolic characterization of MLYCD depletion.
(A) Schematic representation of isotope tracing experiment with 13C16-Palmitate. Black-filled circles indicate 13C-carbon, whereas the white filled circles represent the unlabeled carbon. The schematic shows the expected composition of labeled carbons of the indicated metabolites. (B) Labeling incorporation from 13C-Palmitate into Palmitoyl-carnitine in non-targeting control (NTC) and MLYCD-depleted (shMLYCD) cells. Data are shown as percentage of 13C16-palmitoylcarnitine to the total pool of Palmitoyl-carnitine. (C) Labeling incorporation from 13C16-palmitate into TCA cycle intermediates of the indicated cell lines. Data are shown as percentage of the m+2 isotopologue to the total pool size of each metabolite. (D) Schematic representation of isotope tracing experiment with 13C6-Glucose. The distribution of light and heavy carbons is depicted as in A. (E) Labeling of Citrate and of (F) Palmitate after incubation with 13C6-glucose. Data are shown as percentage of the indicated isotopologue to the total pool size of each metabolite. Isotopologue distribution of citrate is indicated in Figure 5—figure supplement 6. Palmitate isotopologues above m+10 were not detected (G) Schematic representation of isotope tracing experiment with 1,2-13C2-Glucose. Ru5p: ribulose-5-phosphate. The distribution of light and heavy carbons is depicted as in A. (H) Ratio between m+1 and m+2 isotopologues of Lactate in the indicated cell lines. (I) Ratio between reduced (GSH) and oxidized (GSSG) glutathione in RPMI-8226 cells infected with the indicated constructs. (J) Cell counts after 72 hr of culture of the indicated cell lines in the presence or absence of 2 mM N-Acetyl Cysteine. Data are shown as mean ± s.e.m of three independent cultures. *p-value<0.05. **p-value<0.01. ***p-value < 0.001.
Figure 5—figure supplement 1
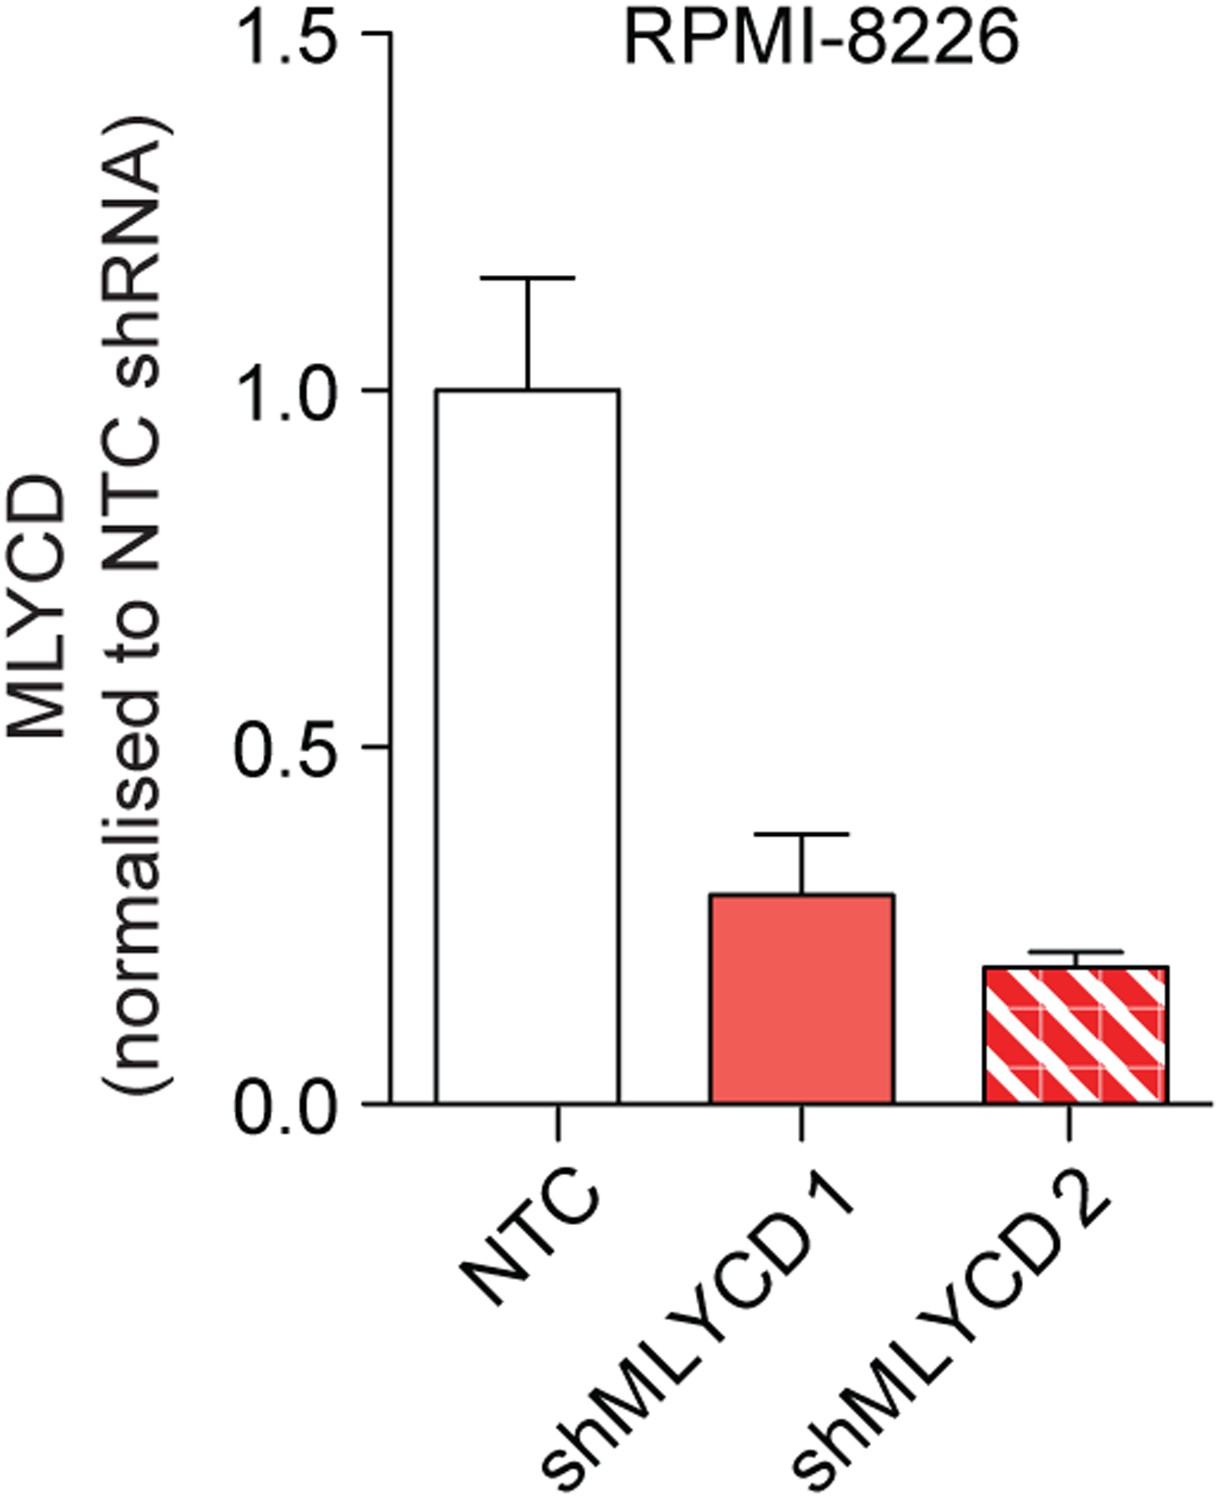
Silencing of MLYCD in RPMI-8226 cells using shRNA.
MLYCD mRNA expression upon infection with Non Targeting Control (NTC) and two independent shRNA constructs targeting MLYCD (shMLYCD1 and 2) in RPMI-8226 cells.
Figure 5—figure supplement 2
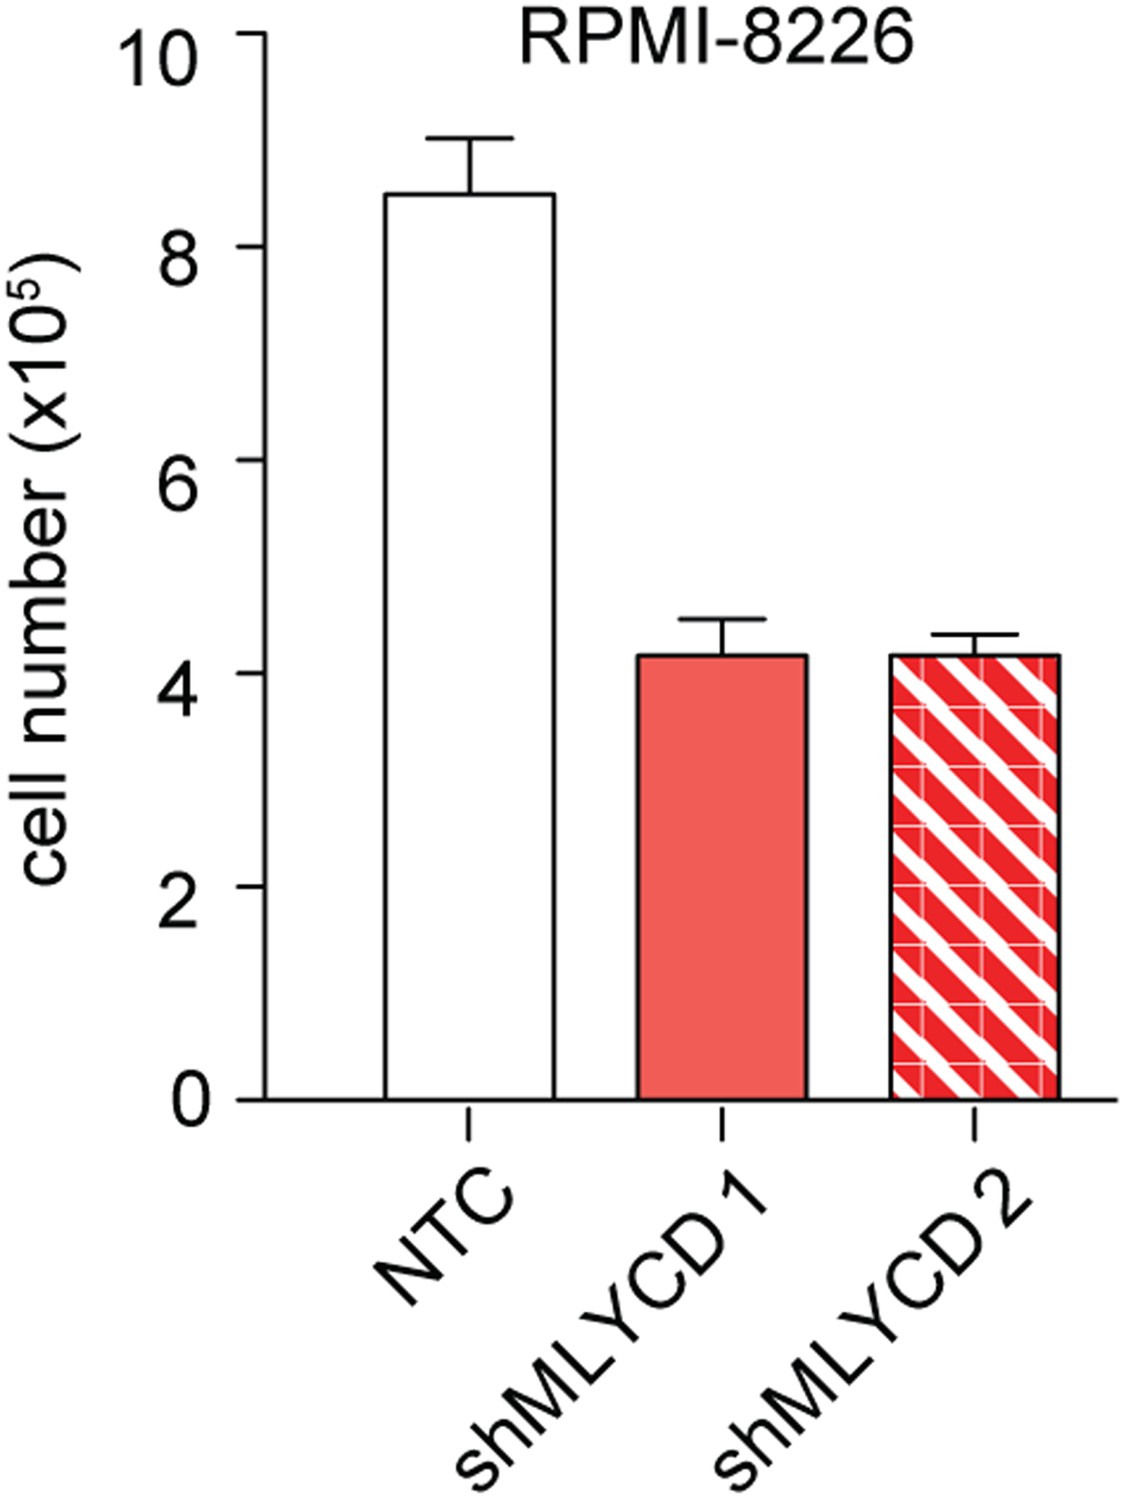
Effects of Silencing of MLYCD in RPMI-8226 cells.
Cells were treated as indicated in Figure 5—figure supplement 1 and counted after 72 hr of culture were.
Figure 5—figure supplement 3
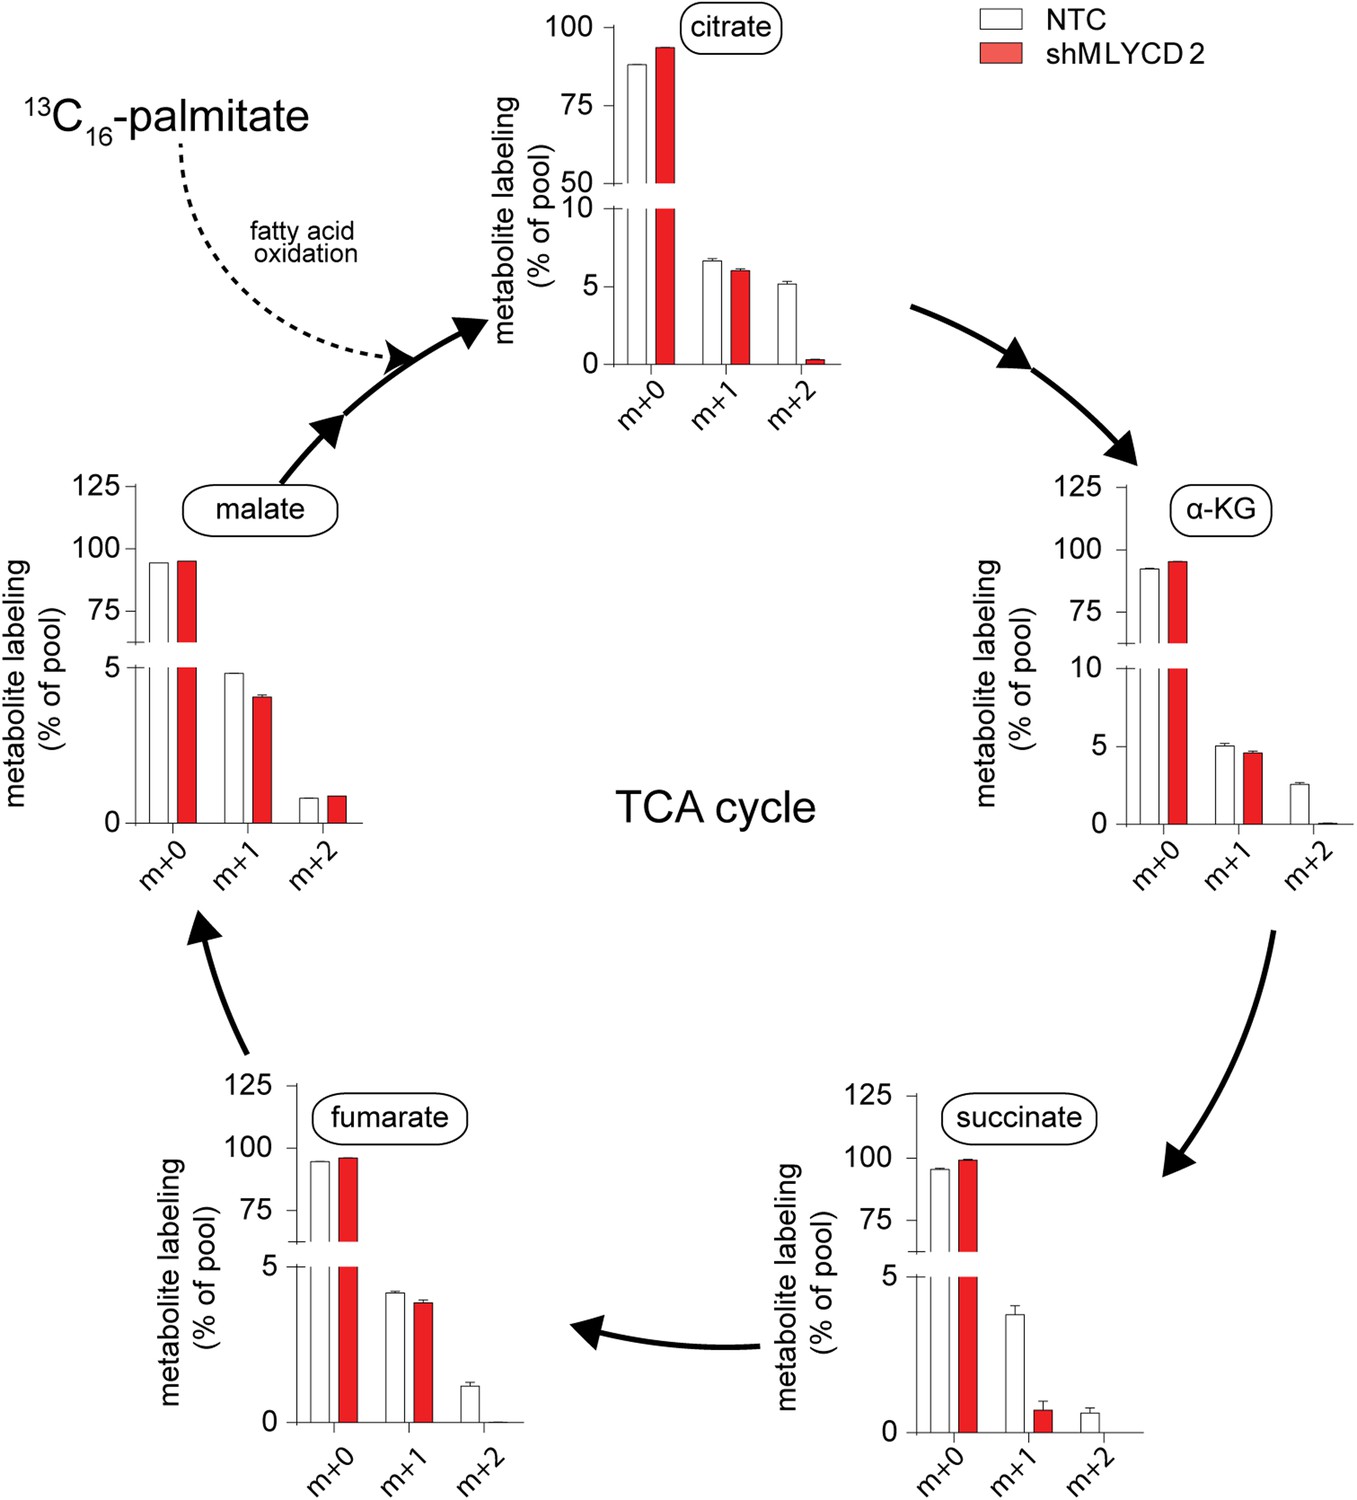
Isotopologue distribution of TCA cycle intermediates after incubation with 13C16-palmitate.
Labeling incorporation from 13C16-palmitate in NTC and shMLYCD2 cells. Isotopologues above m+2 were not detected. Data are presented as percentage of the indicated isotopologue to the total pool of each metabolite. Data are presented as mean ± s.e.m.
Figure 5—figure supplement 4
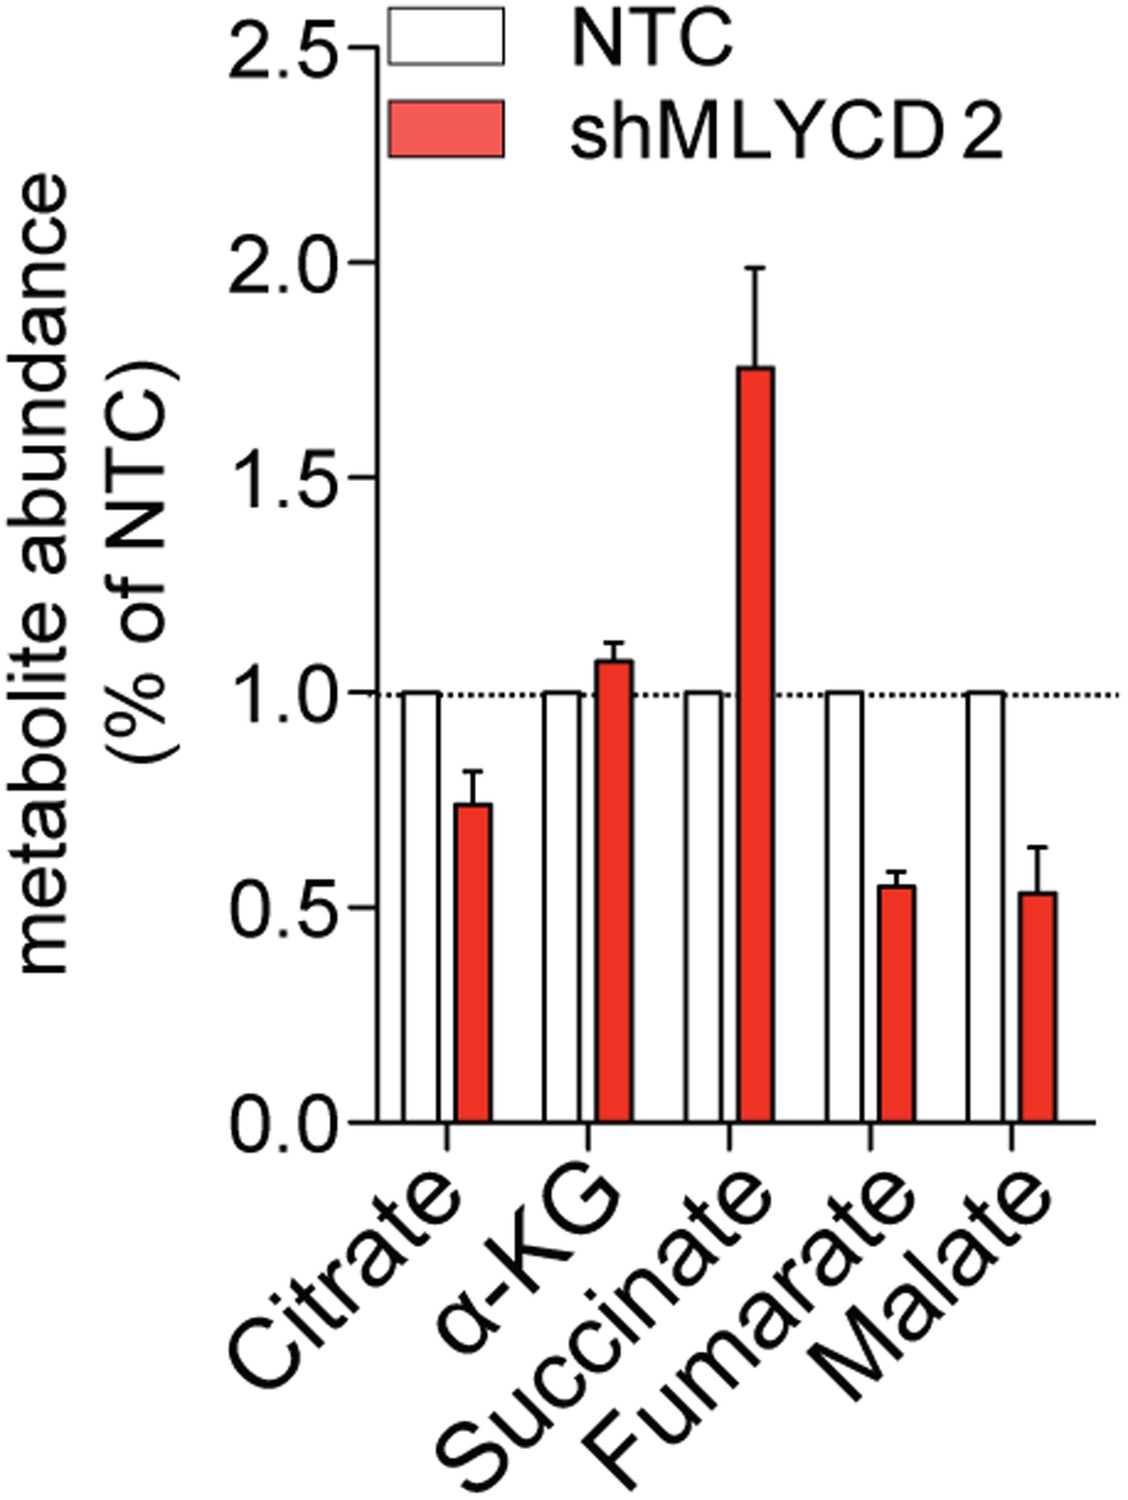
LCMS analyses of TCA cycle intermediates in MLYCD-depleted cells.
Total levels of TCA cycle intermediates in RPMI-8226 cells infected with NTC or shMLYCD2. Data are presented as relative abundance of total metabolites in shMLYCD2 compared to NTC.
Figure 5—figure supplement 5
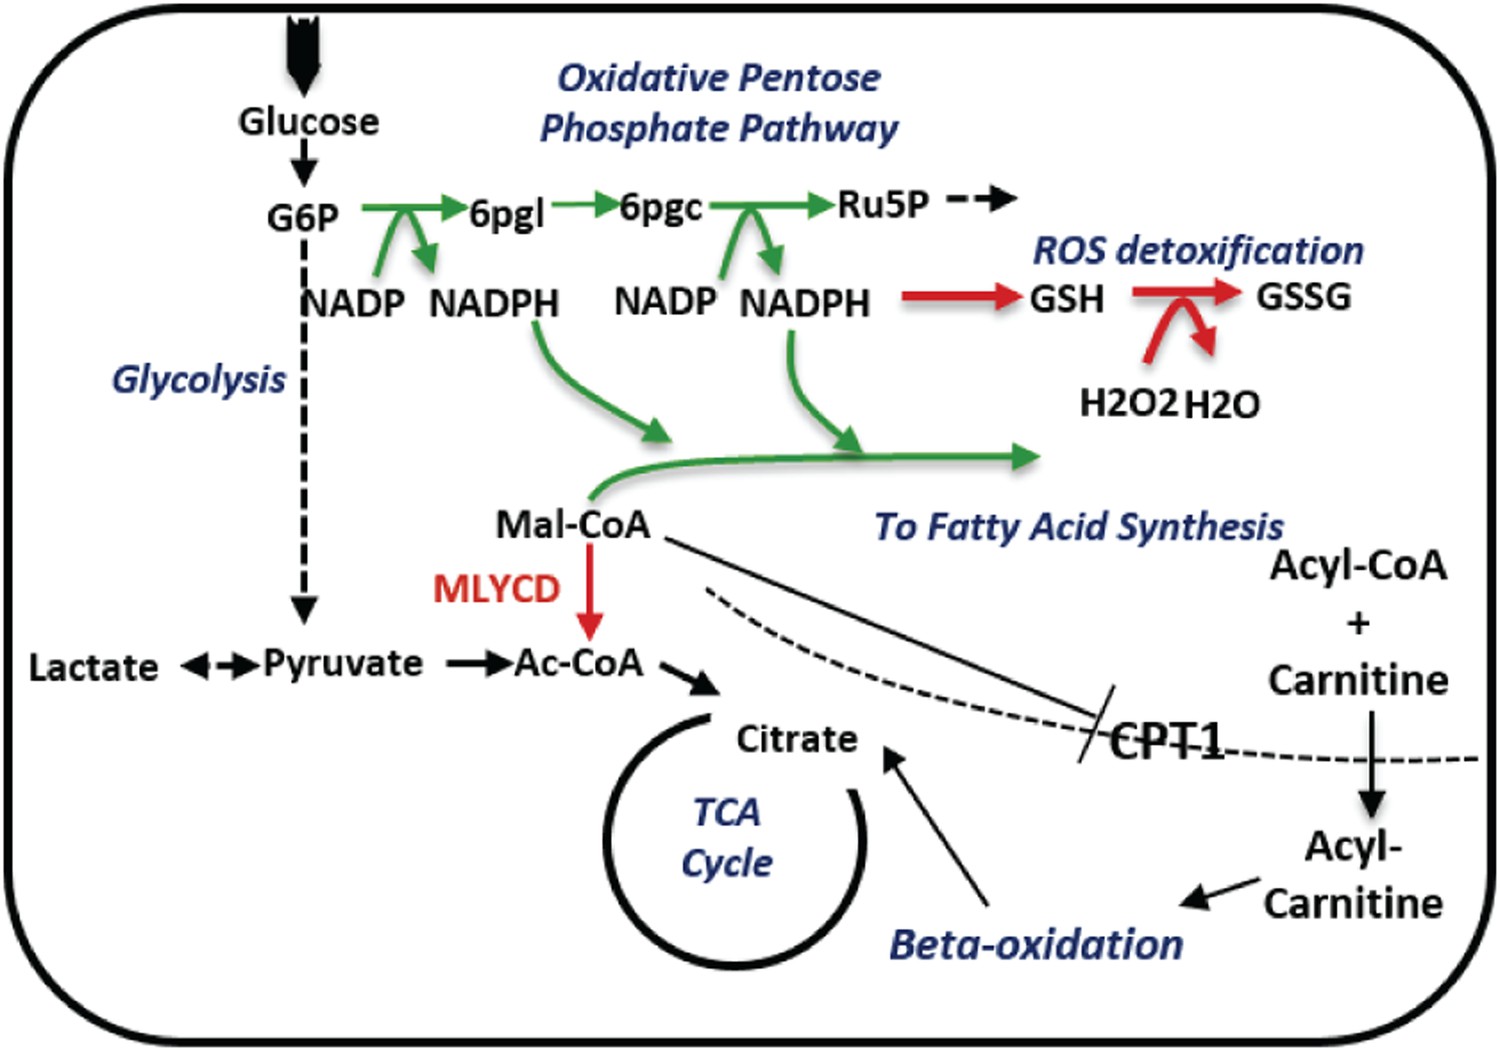
A schematic description of the metabolic changes following MLYCD knock down.
MLYCD suppression is predicted to divert the accumulated malonyl-CoA to fatty acid biosynthesis, increasing the demand of cells for reducing power. The latter is generated by the oxidative branch of the pentose phosphate pathway, overall leading to increased oxidative stress. Green/red arrows represent increased/decreased flux, respectively.
Figure 5—figure supplement 6
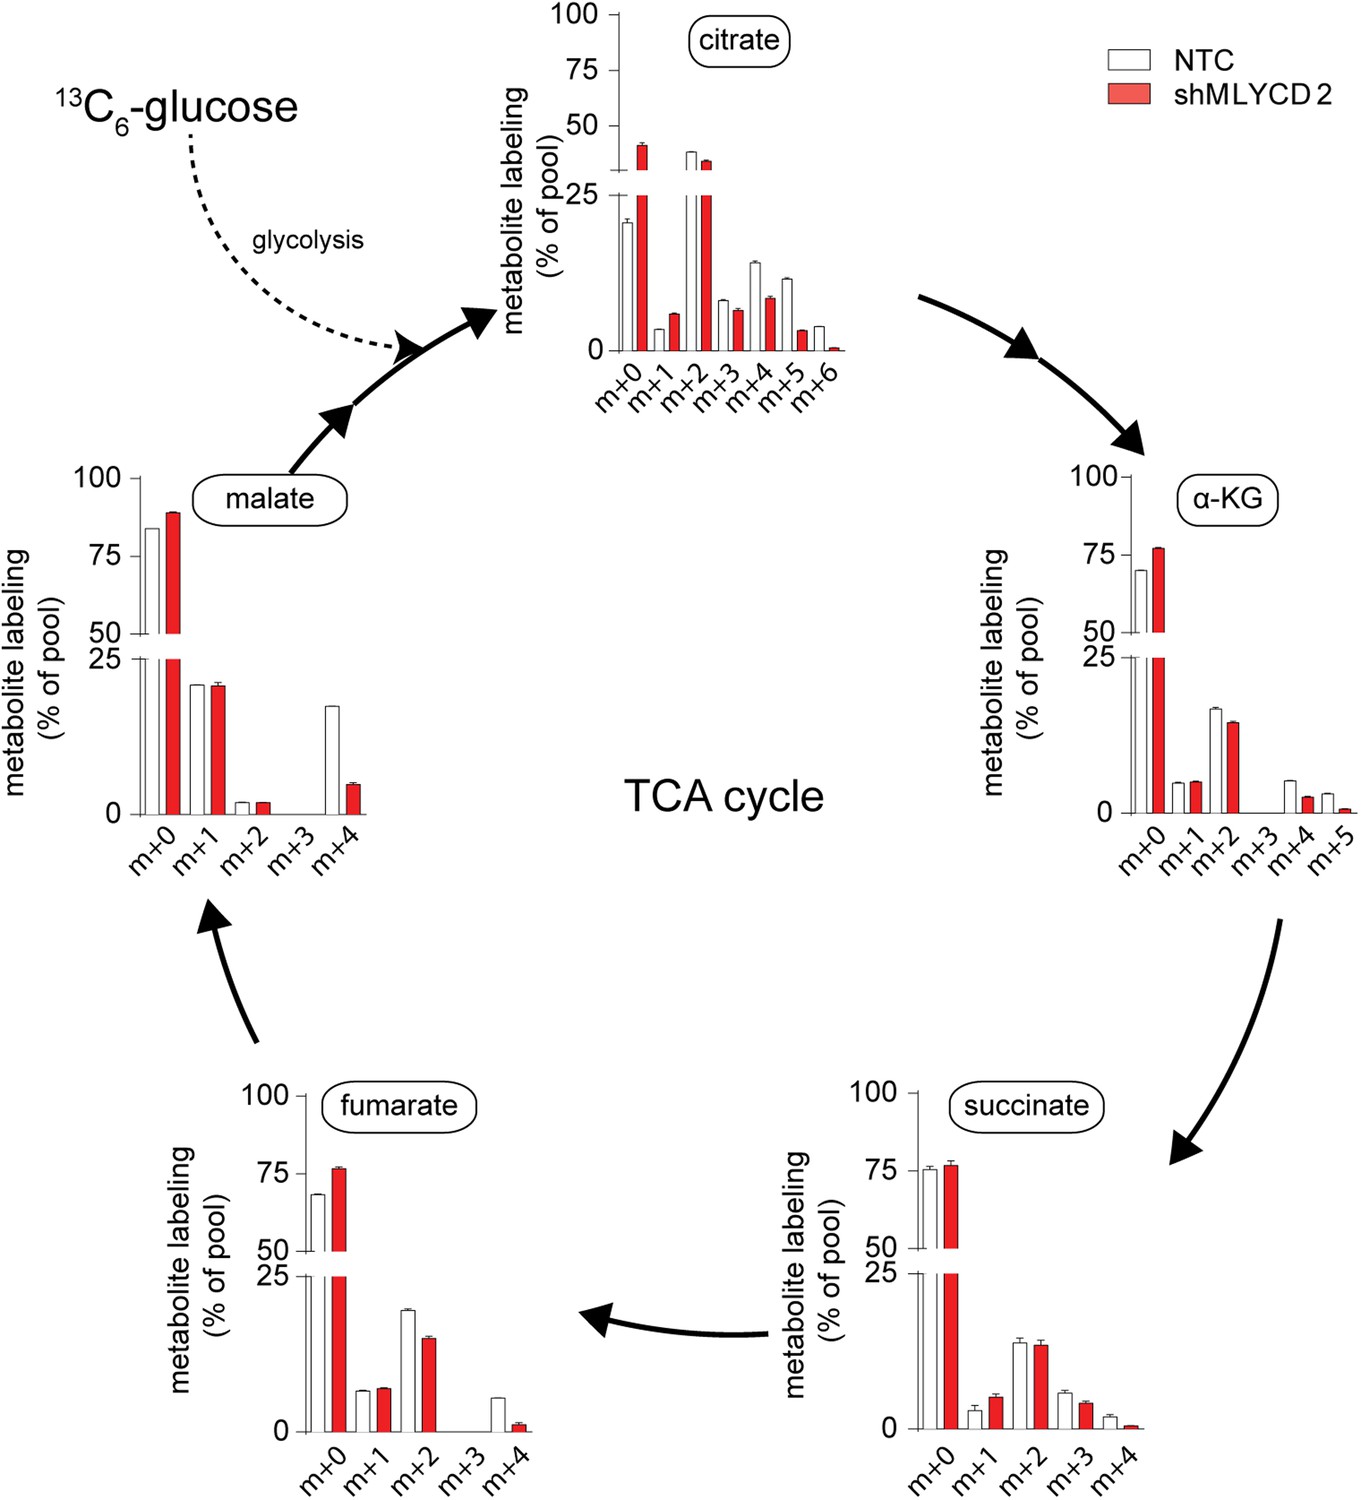
TCA cycle activity in MLYCD-depleted cells.
Labeling incorporation from 13C6-Glucose in NTC and shMLYCD2 cells. Data are presented as percentage of the indicated isotopologue to the total pool of each metabolite. Data are presented as mean ± s.e.m.
Figure 6
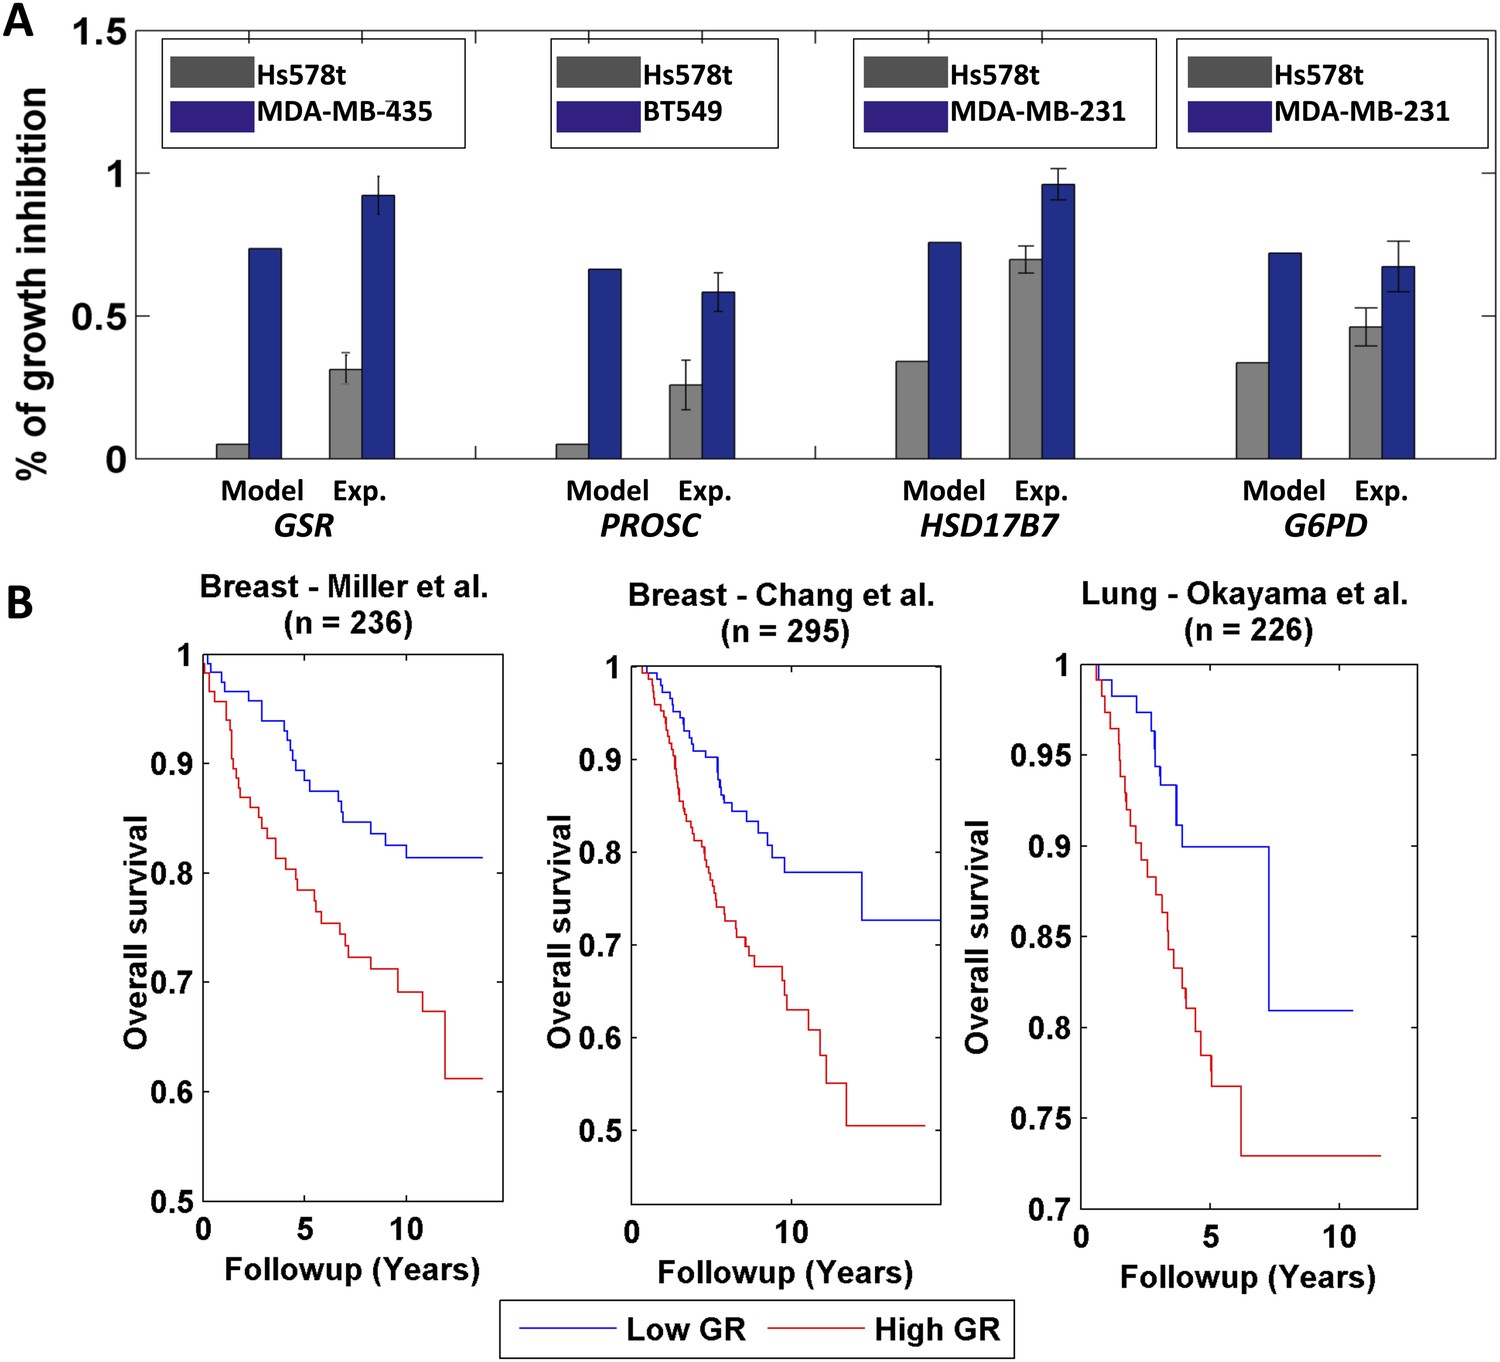
Differential growth affects in breast cancer cell-lines and clinical data analysis.
(A) Four gene/reaction targets showing a differential effect on cancer cell growth (represented as % of growth inhibition) according to both PRIME's predictions and experimental validations via siRNA knock downs (when compared to a negative control, a siRNA that targets luciferase). Each gene was tested experimentally in two cell lines in triplicate, where the gene knock down is predicted to have the lowest and highest effect on cell growth. 11 out of the 13 top predictions tested were confirmed experimentally. Data are shown as mean ± s.e.m. For the full list see Supplementary file 2D. The genes GSR and PROSC are predicted to completely suppress the Hs578 t cell line growth (Supplementary file 2) but for presentation appear with a 0.05% height bar; (B) Kaplan-Meier plots for the two breast cancer datasets and for a lung cancer dataset. In all cases low growth rate (GR) is associated with improved survival.
Additional files
-
Supplementary file 1
Supplementary files 1A–K.
- https://doi.org/10.7554/eLife.03641.018
-
Supplementary file 2
Supplementary files 2A–D.
- https://doi.org/10.7554/eLife.03641.019
-
Supplementary file 3
The PRIME code.
- https://doi.org/10.7554/eLife.03641.020
-
Supplementary file 4
The HapMap and NCI-60 models as SBML.
- https://doi.org/10.7554/eLife.03641.021
Download links
A two-part list of links to download the article, or parts of the article, in various formats.
Downloads (link to download the article as PDF)
Open citations (links to open the citations from this article in various online reference manager services)
Cite this article (links to download the citations from this article in formats compatible with various reference manager tools)
Phenotype-based cell-specific metabolic modeling reveals metabolic liabilities of cancer
eLife 3:e03641.
https://doi.org/10.7554/eLife.03641


