The membrane-associated proteins FCHo and SGIP are allosteric activators of the AP2 clathrin adaptor complex
- Stowers Institute for Medical Research, United States
- Howard Hughes Medical Institute, University of Utah, United States
- Ludwig-Maximilians-University, Germany
Figures
Figure 1 with 2 supplements
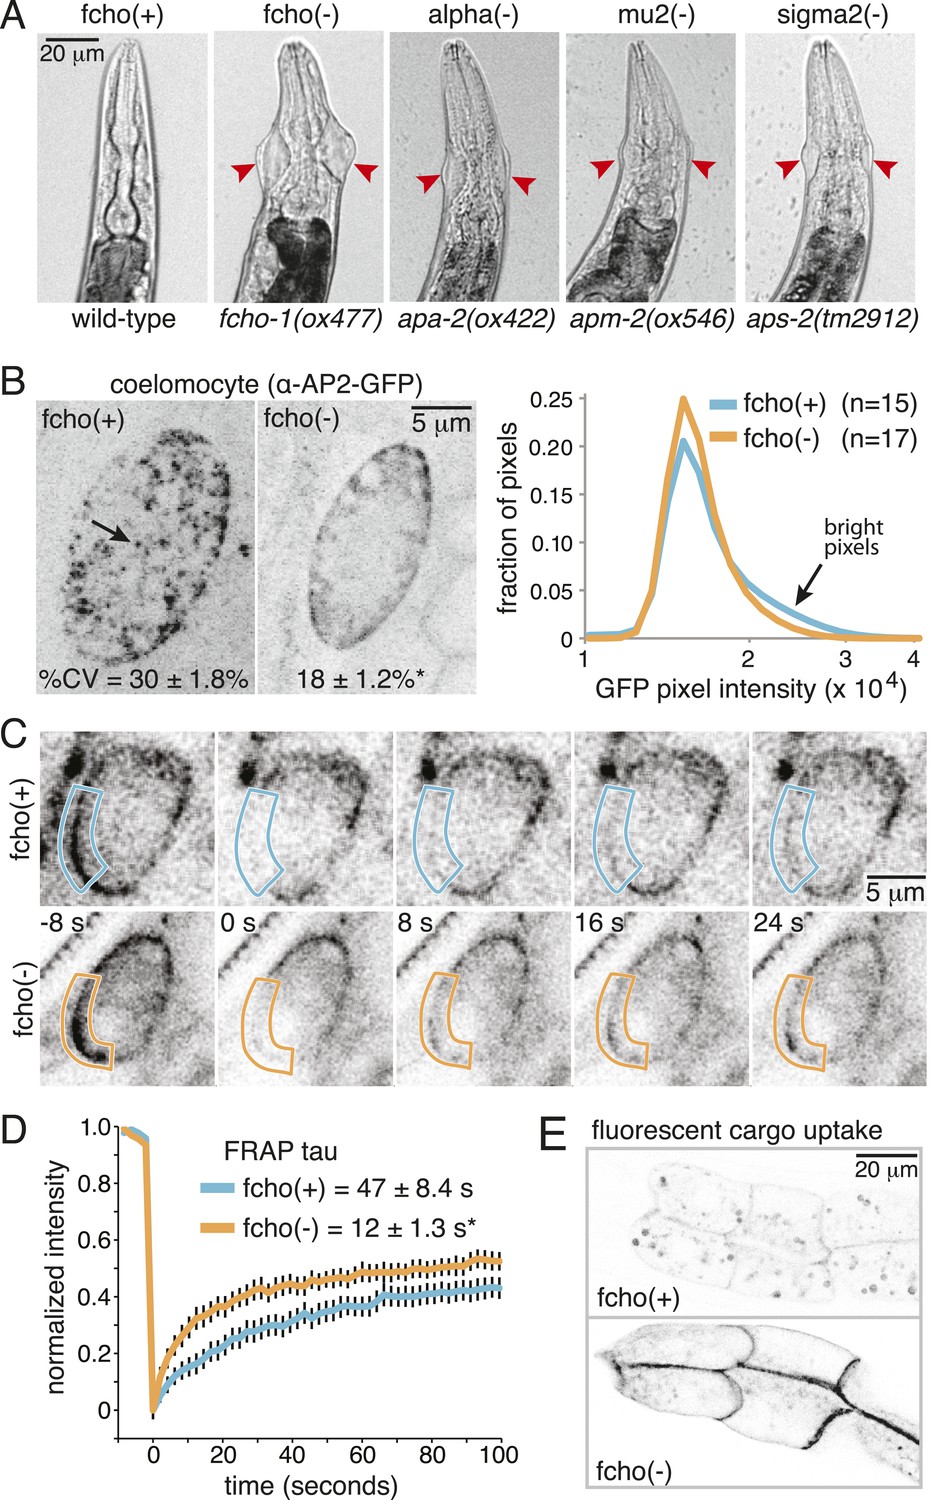
Loss of FCHo compromises AP2 activity.
(A) Animals cropped to highlight jowls (red arrrowheads, anterior up) shared by fcho-1 and AP2 subunit mutants (apa-2, apm-2, aps-2). (B) Left, representative confocal micrographs of coelomocytes in worms expressing GFP-tagged alpha subunit. Images represent maximum projections of Z-slices through ∼1/2 of a coelomocyte. Numbers indicate the coefficient of variance of pixel intensities across coelomocytes (excluding the cell periphery). *p < 0.01 unpaired, two-tailed t-test. Right, normalized histograms of pixel intensities (logarithmic scale). Arrow indicates higher intensity pixels that are missing in fcho-1 mutants. (C) Time-lapse montages of FRAP experiments on coelomocytes expressing alpha:GFP in adult hermaphrodites. The outlined membrane region was photobleached at time = 0. (D) FRAP assay. Average recovery curves and time constants of fluorescence after photobleaching. *p < 0.01 unpaired, two-tailed t-test on data from 12 fcho(+) coelomocytes and 14 fcho(−) coelomocytes. (E) Cargo assay. Micrographs of intestinal cells (anterior left) expressing a GFP-tagged transmembrane cargo internalized by AP2. The cargo is a truncated CD4 transmembrane construct with a YxxΦ cargo recognition motif (Figure 1—figure supplement 1C). The average pixel intensity along an intestinal basal-lateral membrane in fcho(+) animals (n = 11) is 972 ± 85 arbitrary units (au) and 5610 ± 416 au in fcho(−) mutants (n = 12). p < 0.01 unpaired, two-tailed t-test. Data in (B), (D) and (E) represent the mean ± SEM.
Figure 1—figure supplement 1
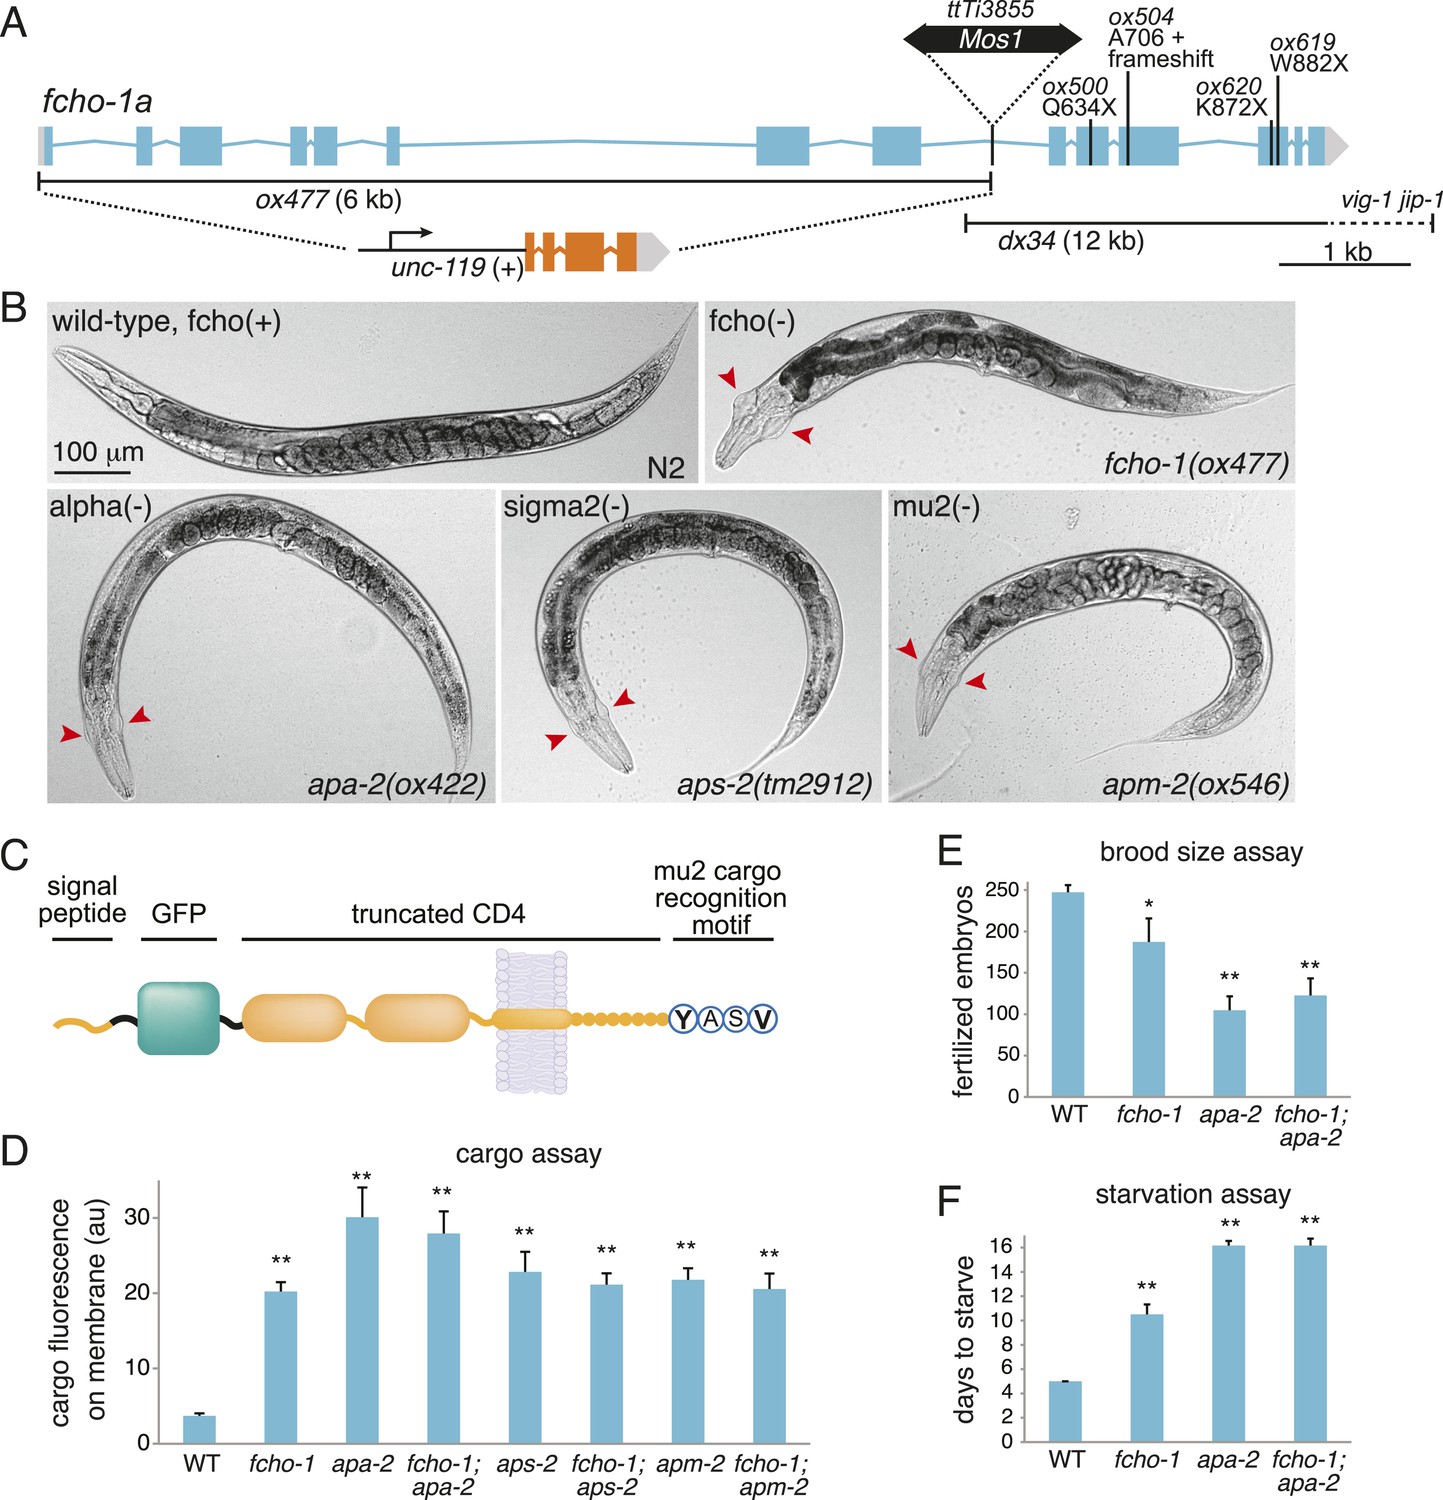
FCHO-1 and AP2 regulate the same pathways.
(A) Diagram of the fcho-1 locus in C. elegans indicating four point mutations and two deletions associated with a loss-of-function phenotype. The targeted deletion (ox477) was generated by mobilizing the Mos1 transposon and repairing the broken chromosome with a recombinant template that replaces the first eight exons with a positive selection (unc-119 rescue). ox477 was used exclusively throughout this study as fcho(−). (B) Images of animals cropped in Figure 1A. fcho(−) and AP2 subunit(−) animals are dumpy and egg-laying defective. Red arrowheads point to jowls. (C) Diagram of artificial GFP-CD4 AP2 cargo. GFP was flanked by two 12 amino acid flexible linkers and inserted between a secretion signal peptide from C. elegans PAT-3 and a modified human CD4 truncated to include two immunoglobulin domains, the transmembrane domain, and eight amino acids from the cytoplasmic domain (Feinberg et al., 2008). The four amino acid YxxΦ motif from the C-terminus of the C. elegans lysosome-associated membrane glycoprotein, LMP-1, was appended. (D) Cargo assay (amount of GFP-tagged cargo on intestinal cell membrane). **p < 0.01, unpaired, two-tailed t-test compared to WT, n ≥ 9. (E) Brood size assay. Number of fertilized embryos produced by individual hermaphrodites of the indicated genotype. *p < 0.05, **p < 0.01, unpaired, two-tailed t-test compared to WT, n ≥ 8. Values for WT and apa-2 samples were previously published (Gu et al., 2013). (F) Starvation assay. Days required for a worm population to expand and consume the bacterial food. **p < 0.01, unpaired, two-tailed t-test compared to WT, n = 12. Data in (D), (E) and (F) represent the mean ± SEM.
Figure 1—figure supplement 2
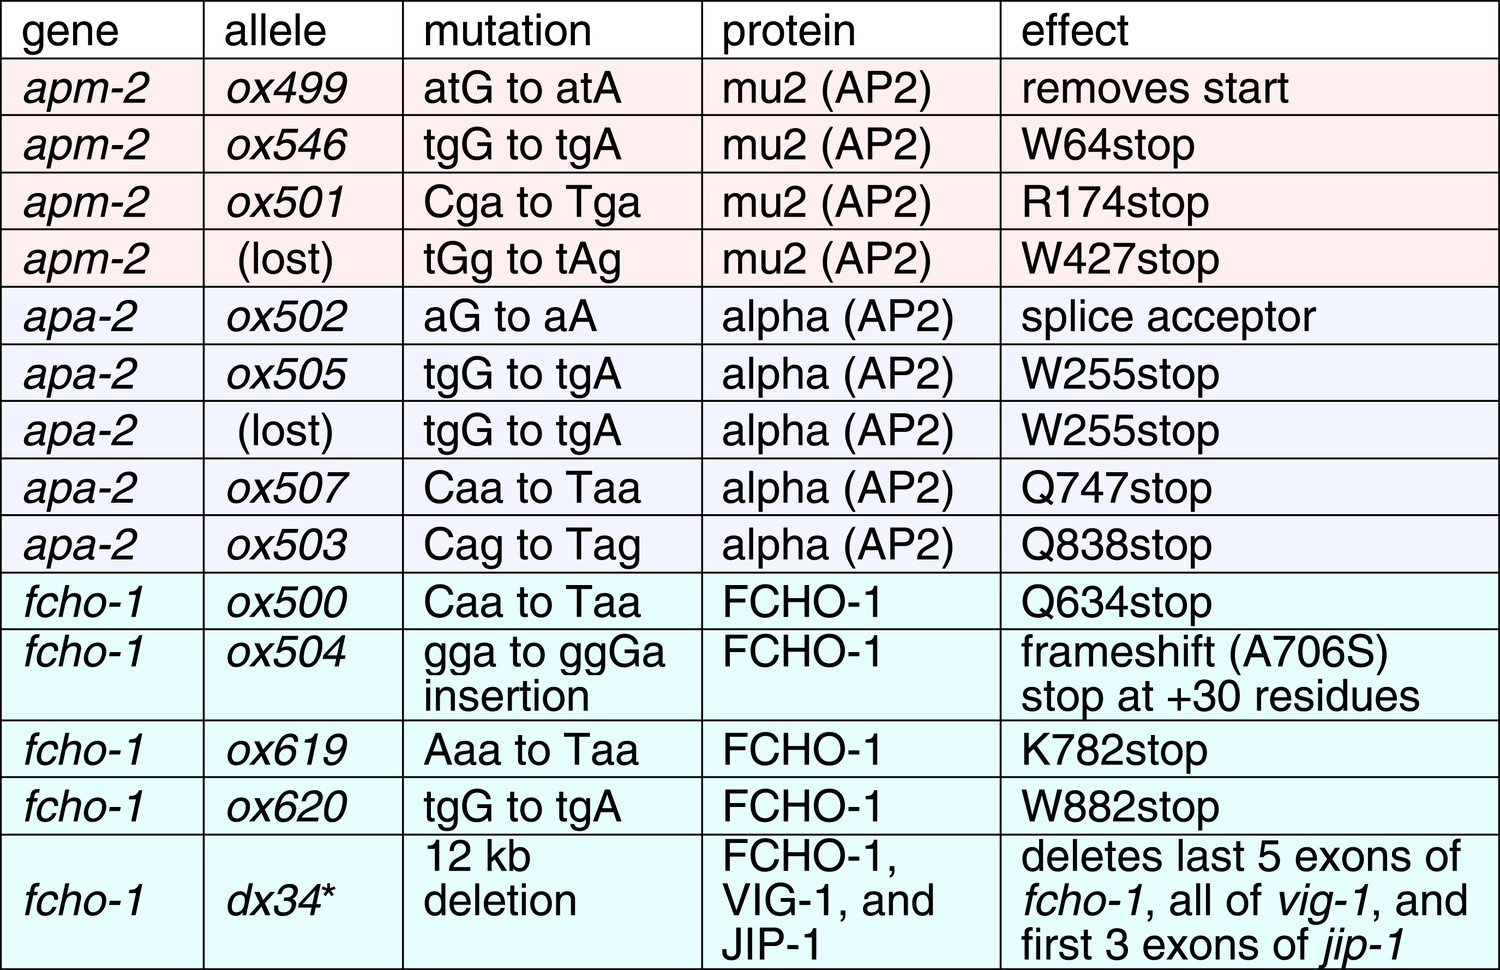
Recessive alleles isolated from genetic screen for ‘jowls’ phenotype * independently identified ‘jowls’ mutant.
https://doi.org/10.7554/eLife.03648.005
Figure 2 with 2 supplements

Mutations in AP2 closed conformation interfaces suppress fcho(−).
Predicted location of the mutated worm residues within the inactive (PBD ID: 2VGL) and active (PBD ID: 2XA7) crystal structures of the vertebrate AP2 core complex. Alpha is blue, beta is green, mu2 is pink, and sigma2 is cyan. The residue numbers are from the worm subunits and parentheses indicate the corresponding vertebrate residue. * designates mutations isolated twice, and † designates mutations isolated thrice. ‡ designates mutations that were combined to re-establish a salt bridge between beta and mu (See Figure 5). (A) Mutations at the contact interface between the mu domain and the other three subunits. These contacts are disrupted upon opening. To visualize the contact surface in the closed conformation, the mu domain has been flipped to the right. Small renderings (left) show the closed (Collins et al., 2002) and open conformations (Jackson et al., 2010); the plasma membrane would be below the complex in this view. The K411E mutation on the mu domain (white residue) was not isolated from the fcho-1 suppressor screen, but was engineered (See Figure 5). (B) Mutations in the latching mechanism formed by the N-terminus of beta and the di-leucine motif binding-pocket of sigma2. (C) Mutations in alpha cluster along the hinge region that flexes during opening.
Figure 2—figure supplement 1
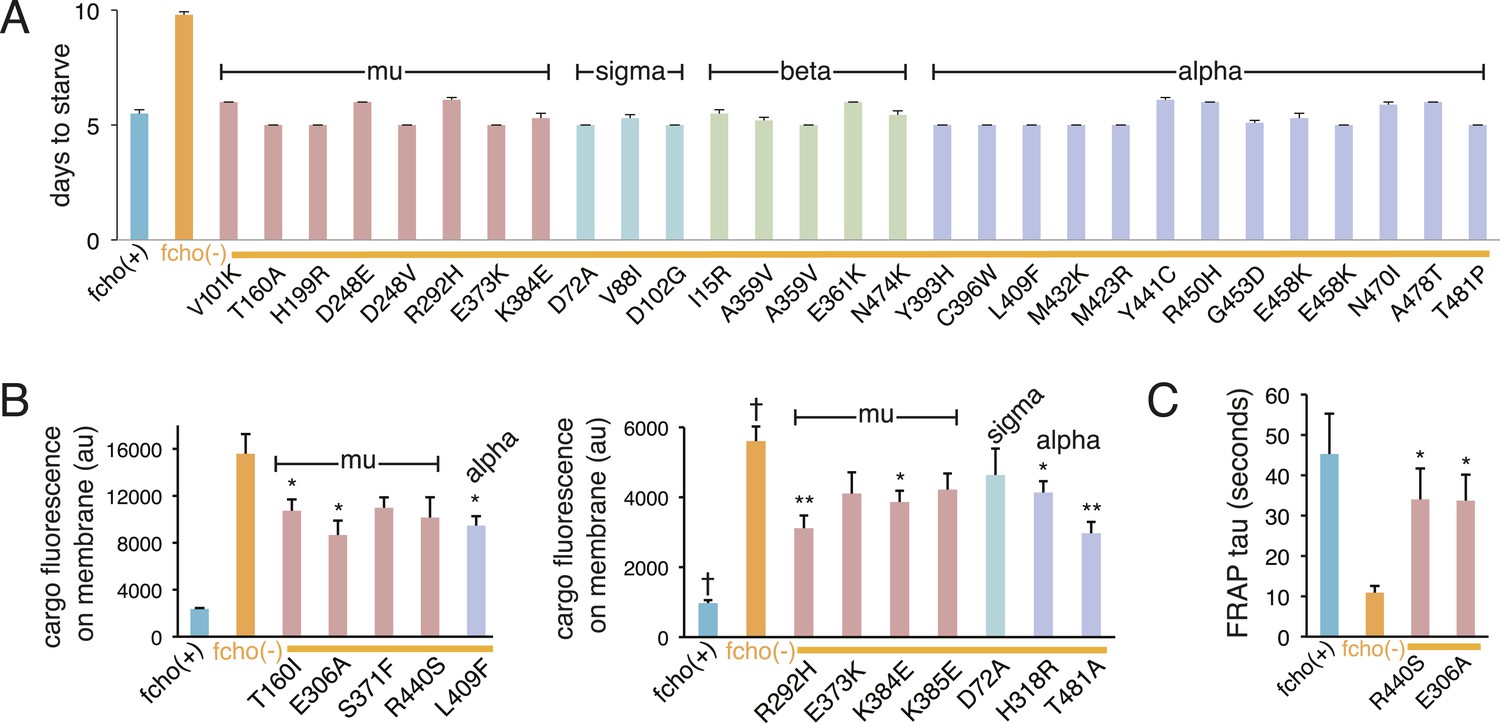
Suppression of fcho-1 by missense mutations in individual AP2 subunits.
For (A–C), the AP2 mutation identified in each suppressed fcho-1 mutant strain is indicated. Only a subset of the mutations were assayed. See Figure 2—figure supplement 2 for complete list of suppressor mutations. All data represent the mean ± SEM. (A) Starvation assay (days required for a worm population to expand and consume the bacterial food). The AP2; fcho-1 double mutants all exhibit faster starvation rates compared to fcho-1 mutants alone (p < 0.01, unpaired, two-tailed t-test n ≥ 9). (B) Cargo assay. Fluorescence from GFP-tagged cargo on plasma membrane of intestinal cells. Left and right panels indicate experiments conducted on different days. n ≥ 5; *p < 0.05 and **p < 0.01, unpaired, two-tailed t-test compared to fcho(−) alone; † data reported in Figure 1E caption. (C) FRAP assay. Average time constants for fluorescence recovery after photobleaching of GFP-tagged AP2. n ≥ 3; *p < 0.05, unpaired, two-tailed t-test compared to fcho(−) alone.
Figure 2—figure supplement 2

Dominant mutations in AP2 subunits identified in fcho-1 suppressor screen.
(A) mu-‘cup’ contact mutations. * spontaneous fcho-1 suppressor. (B) sigma-beta contact mutations. (C) alpha backbone mutations. (D) phosphorylation site mutations. (E) other mutations near inter-subunit contacts.
Figure 3 with 1 supplement

FCHo promotes the protease-sensitive open conformation of AP2 in vivo.
(A) A TEV protease site was inserted into a surface loop of the mu domain. The dashed line connects the boundaries of the unstructured region within two conformations of the AP2 complex. (B) Western blot of whole animal lysates expressing the HA-tagged mu2 subunit depicted in Figure 3—figure supplement 1A. The amount of full-length subunit (top) decreases following heatshock. Anti-histone blot is below. Each sample is comprised of 100 larval 4 stage animals. (C) Quantification of mu2 proteolysis. Intensity of anti-HA signal relative to histone, normalized to time 0. *p < 0.05, unpaired, two-tailed t-test compared to fcho(+) values at same time point, n = 4. Data represent the mean ± SEM. See Figure 3—figure supplement 1 for results using FLAG-tagged version of mu2.
Figure 3—figure supplement 1
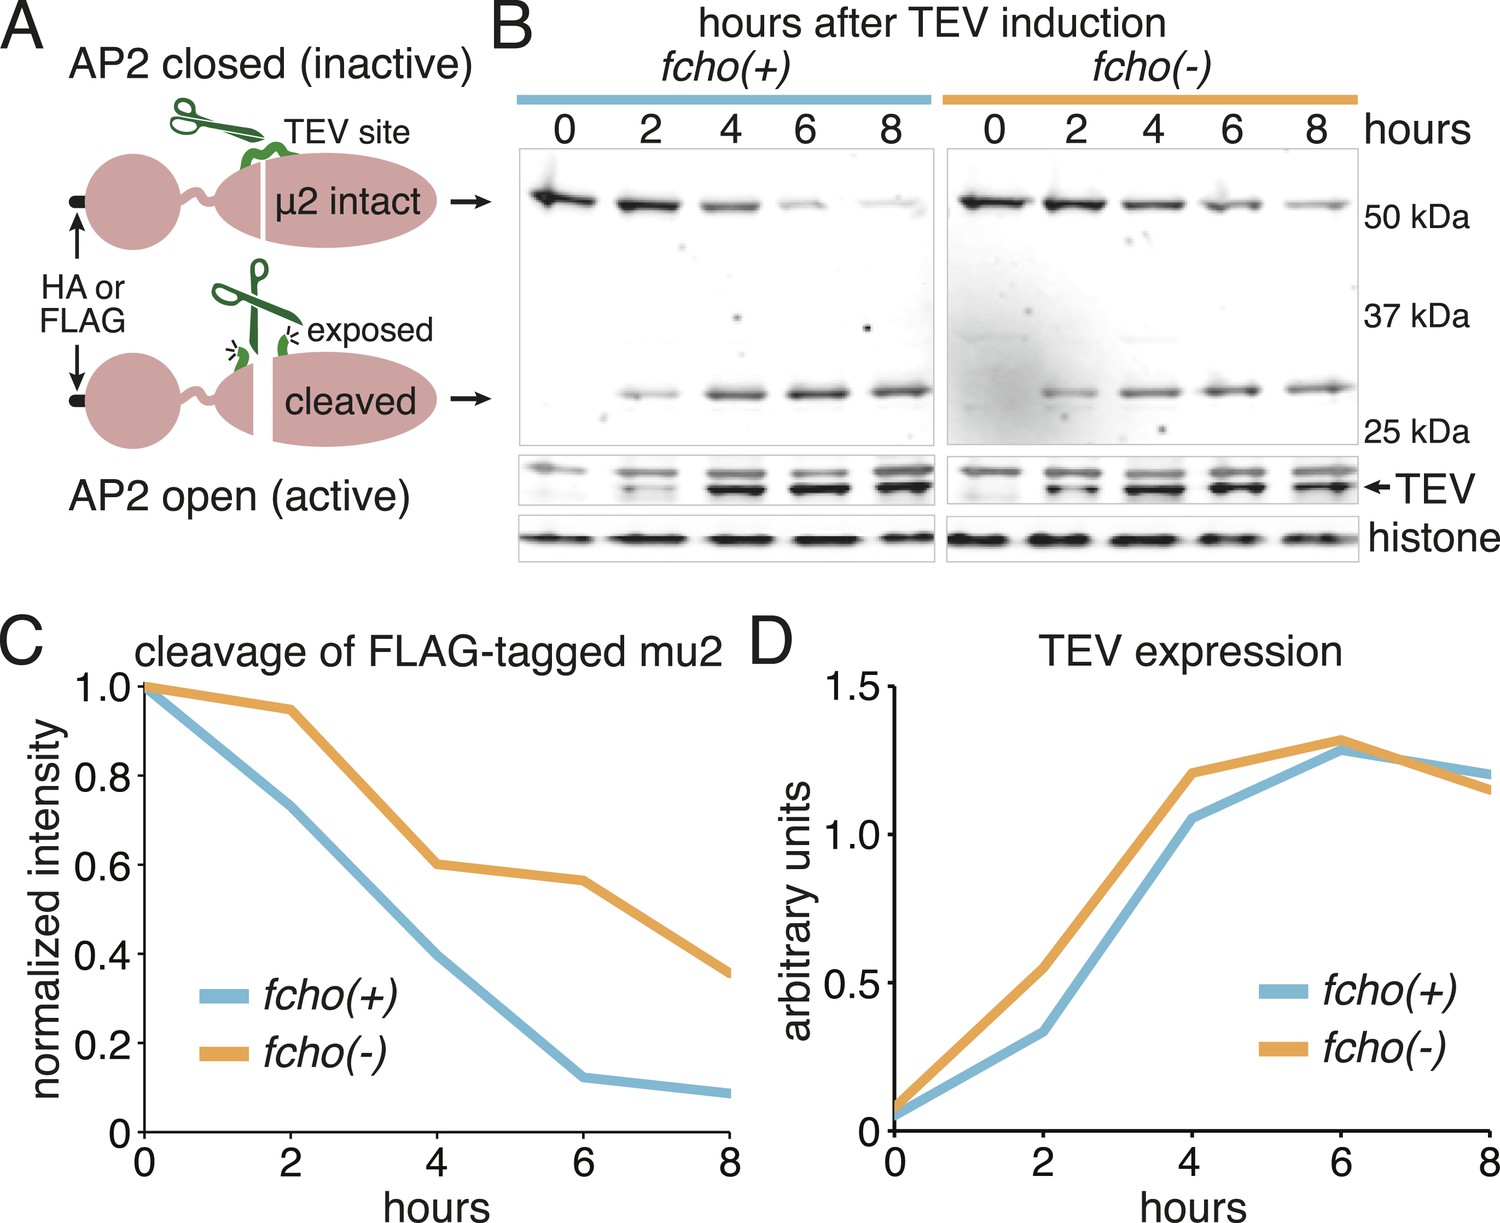
Schematic of TEV Protease assay and results from FLAG-tagged version of mu2.
(A) Cartoon of modified mu2 including epitope tag, sigma-homology domain, mu domain and TEV protease site insertion. The protease site is predicted to become more accessible upon AP2 activation. (B) Western blots of whole worm lysates. Animals were heat-shocked for one hour to induce TEV protease expression. Full-length (intact) and proteolyzed (cleaved) mu2 subunits were detected using anti-FLAG (top) while protease expression was monitored with anti-TEV (middle). Anti-histone blot (bottom) used for normalization. Each sample is comprised of 100 larval 4 stage animals. (C) Quantification of the proteolysis. Intensity of intact mu2 relative to histone, normalized to time 0. Similar results were obtained using an HA-tagged mu2 subunit (Figure 3B,C). (D) Protease levels over time. Intensity of TEV band relative to histone.
Figure 4 with 1 supplement
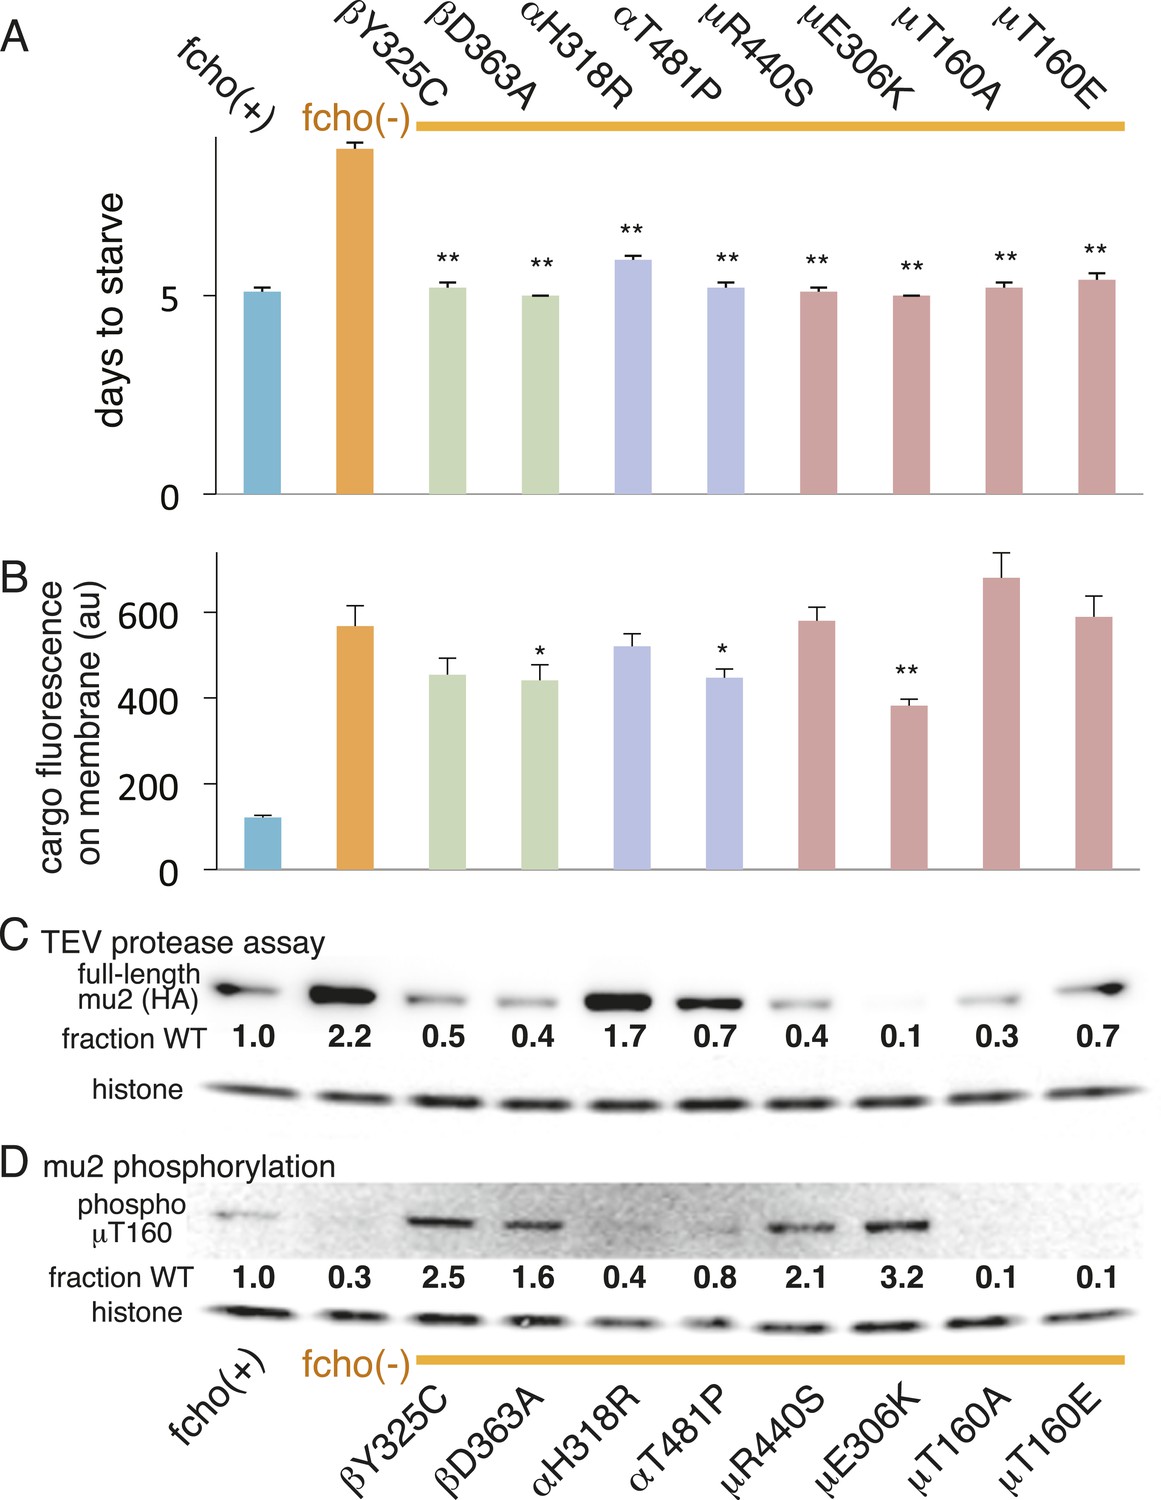
AP2 mutations restore the active conformation in fcho-1 mutants.
Listed mutations correspond to the worm residues. (A) Starvation assay (days required for a worm population to expand and consume the bacterial food). (B) Cargo assay (amount of GFP-tagged cargo on intestinal cell membrane). For (A) and (B), data represent the mean ± SEM for n ≥ 10. Significance determined by unpaired, two-tailed t-test compared to fcho(−), *p < 0.05 and **p < 0.01. (C) in vivo TEV protease assay. Samples collected for Western blot analysis 8 hr after heatshock (as in Figure 3B). Numbers indicate band intensity of full-length mu2 (anti-HA, top) relative to histone (bottom), normalized to the fcho(+) sample. (D) Blot for phosphorylated threonine-160 (T156 in vertebrates) in the linker region of the mu2 subunit. Samples collected before heatshock. Numbers indicate band intensity of phosphorylated T160 (top) relative to histone (bottom), normalized to fcho(+) sample. For (C) and (D), each sample is comprised of 100 larval 4 stage animals.
Figure 4—figure supplement 1
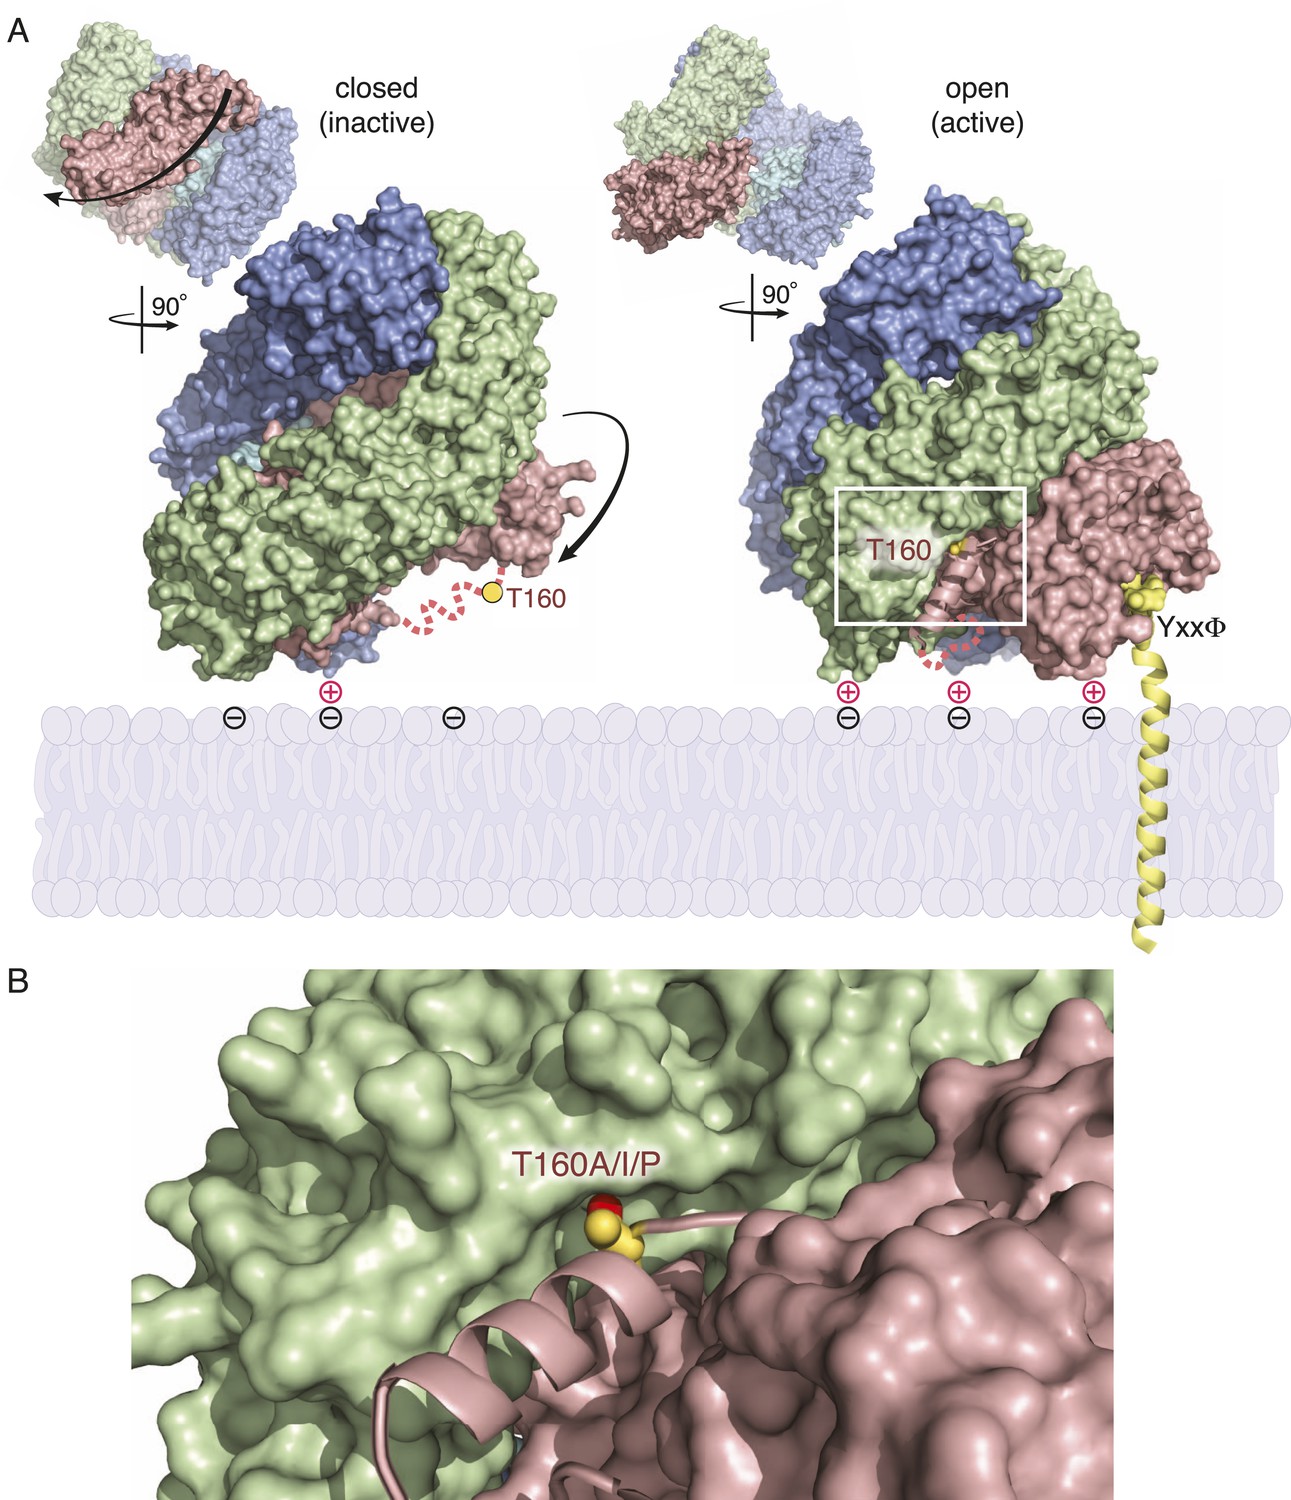
Activation of AP2 strengthens membrane association, enables cargo binding, and stabilizes the location of mu2 phosphorylation.
(A) and (B) are adapted from (Jackson et al., 2010). (A) Side views of the AP2 complex showing that the mu2 linker (pink dashed line) containing the phosphorylation site (T160) transitions from a disordered state (closed, left) to ordered helix (open, right) upon activation. The conformational rearrangement is associated with enhanced membrane binding and exposure of a binding pocket for transmembrane cargo (YxxΦ). (B) Location of threonine-160 (156 in vertebrates) of mu2 linker in open conformation of AP2. The residue is at the end of a helix (pink) that nestles into a groove in the beta subunit (green). Mutations isolated as fcho-1 suppressors are indicated, as is the hydroxyl group (red) predicted to be phosphorylated.
Figure 5 with 1 supplement

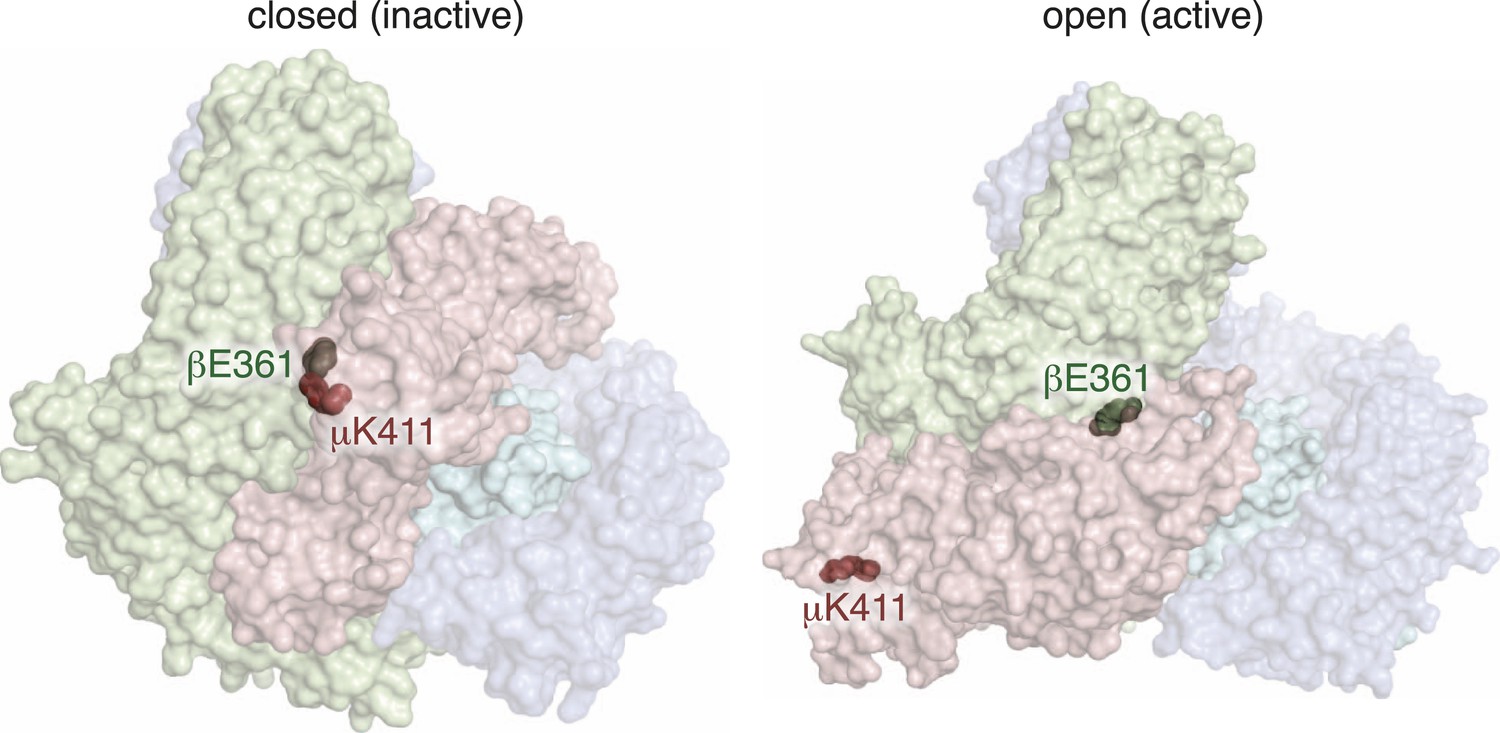
Charge swaps activate and inactivate AP2 in vivo.
(A) Predicted location of residues stabilizing an important inter-subunit salt bridge within the inactive (PBD ID: 2VGL) crystal structure of the vertebrate AP2 core complex. Alpha is blue, beta is green, and mu2 is pink. The residue numbers are from the worm subunits. See Figure 2A and Figure 5—figure supplement 1 for localization on interfaces. (B) Starvation assay (days required for a worm population to expand and consume the bacterial food). AP2 mutations indicated above. (C) Cargo assay (amount of GFP-tagged cargo on intestinal cell membrane). For (B) and (C), data represent the mean ± SEM for n ≥ 10. Significance determined by unpaired, two-tailed t-test, **p < 0.01. (D) in vivo TEV protease assay. Samples collected for western blot analysis (anti-HA) 8 hr after heatshock (As in Figure 3B). Numbers indicate band intensity normalized to the fcho(+) sample. (E) Blot for phosphorylated threonine 160. Samples collected before heatshock. Numbers indicate band intensity normalized to fcho(+) sample.
Figure 5—figure supplement 1
An Inter-subunit salt bridge is broken in the active conformation of AP2.
Predicted location of the modified worm residues within the inactive (PBD ID: 2VGL) and active (PBD ID: 2XA7) crystal structures of the vertebrate AP2 core complex. Alpha is blue, beta is green, mu2 is pink, and sigma is cyan. The residue numbers are from the worm subunits. The residues are hidden in both of these views.
Figure 6 with 1 supplement
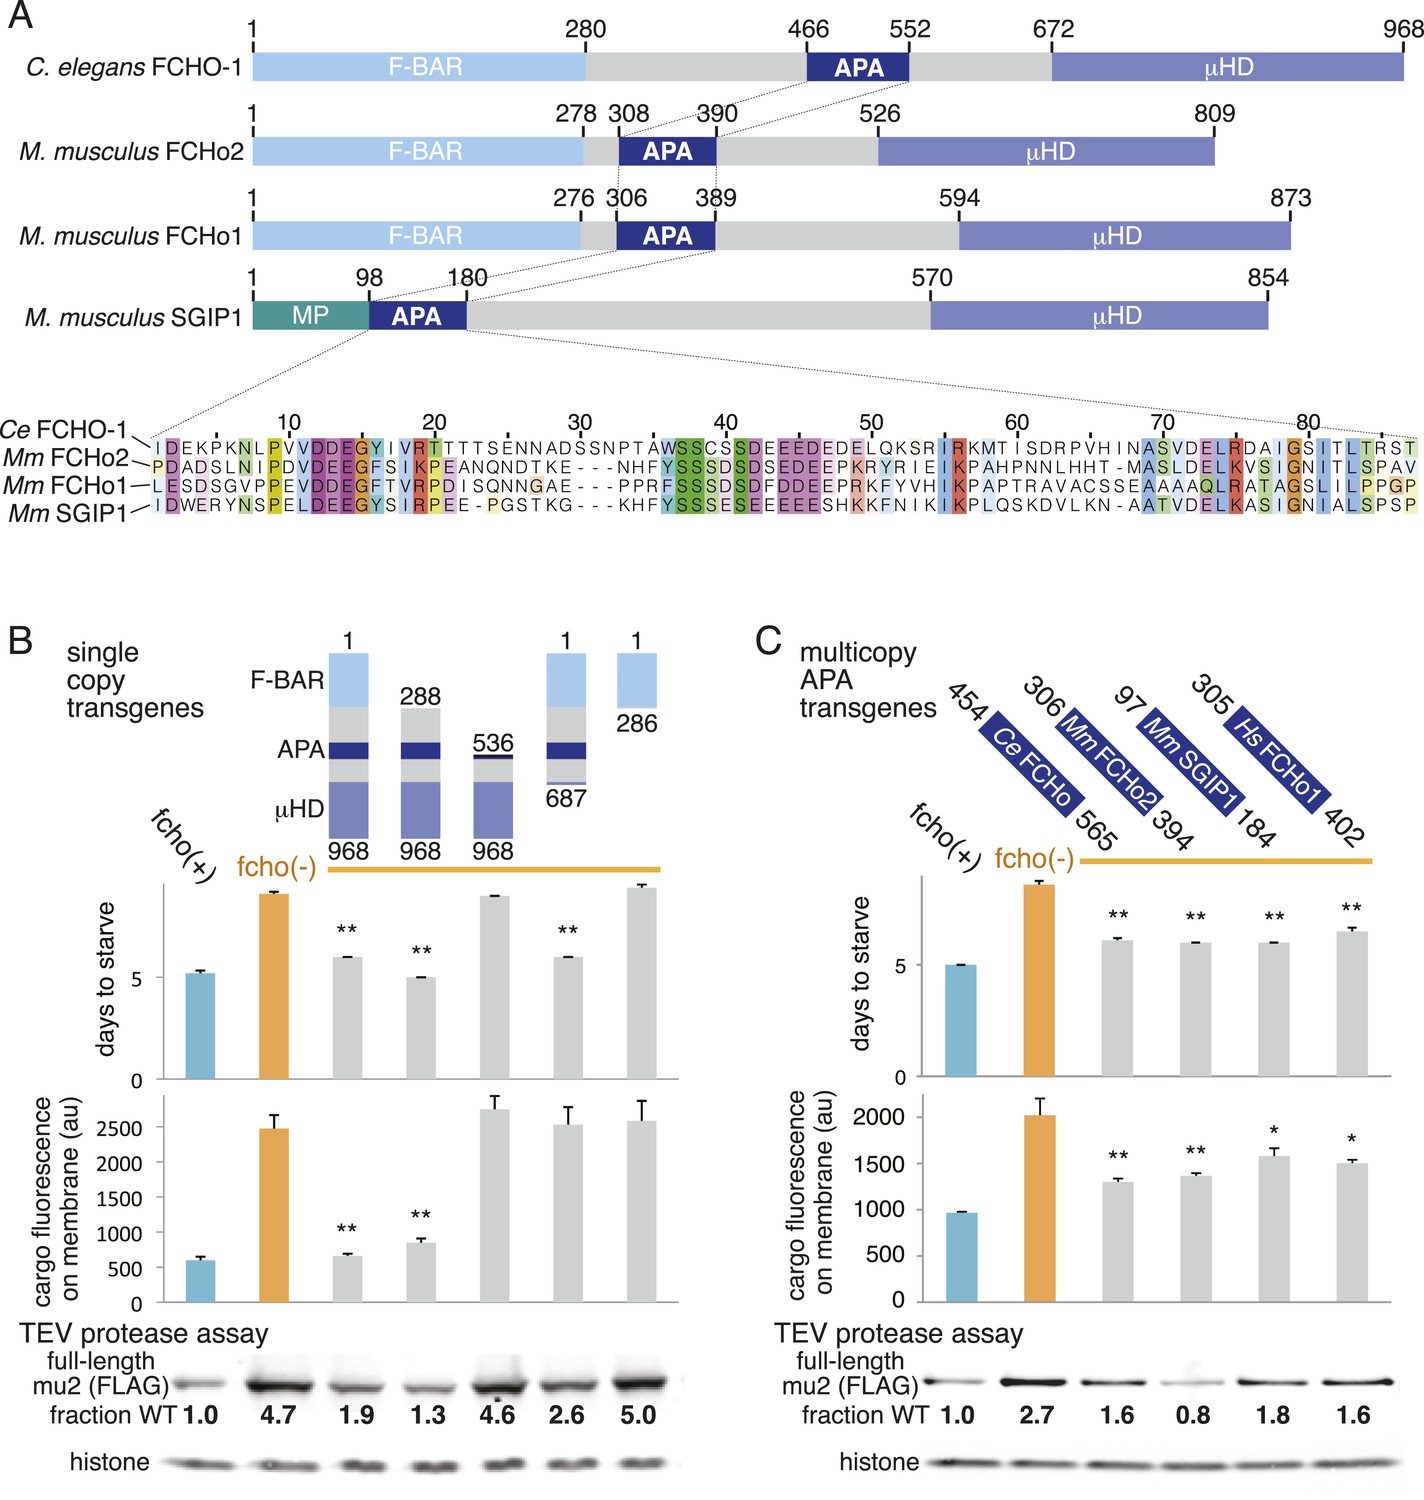
A Conserved region of FCHo proteins is necessary and sufficient to rescue fcho-1 mutants.
(A) FCHo homologs showing conserved domains. Amino acid numbers indicated above. The AP2 Activator (APA) domain is aligned below. Amino acids colored by Clustal X scheme and shaded by conservation. Membrane Phospholipid-binding domain (MP), μ-Homology Domain (μHD). (B) Structure/function analysis of worm FCHO-1. (C) Quantification of fcho-1 mutant rescue with APA domains from worm (Ce), mouse (Mm), and human (Hs) orthologs expressed as extrachromosomal arrays. See Figure 7—figure supplement 1A for results of the starvation assay when the APA domains are expressed from single-copy transgenes. For (B) and (C), protease assay performed with FLAG-tagged mu2 subunit as in Figure 3—figure supplement 1B. Numbers indicate band intensity of full-length mu2 (top) relative to the histone control (bottom) and normalized to the fcho(+) sample.
Figure 6—figure supplement 1
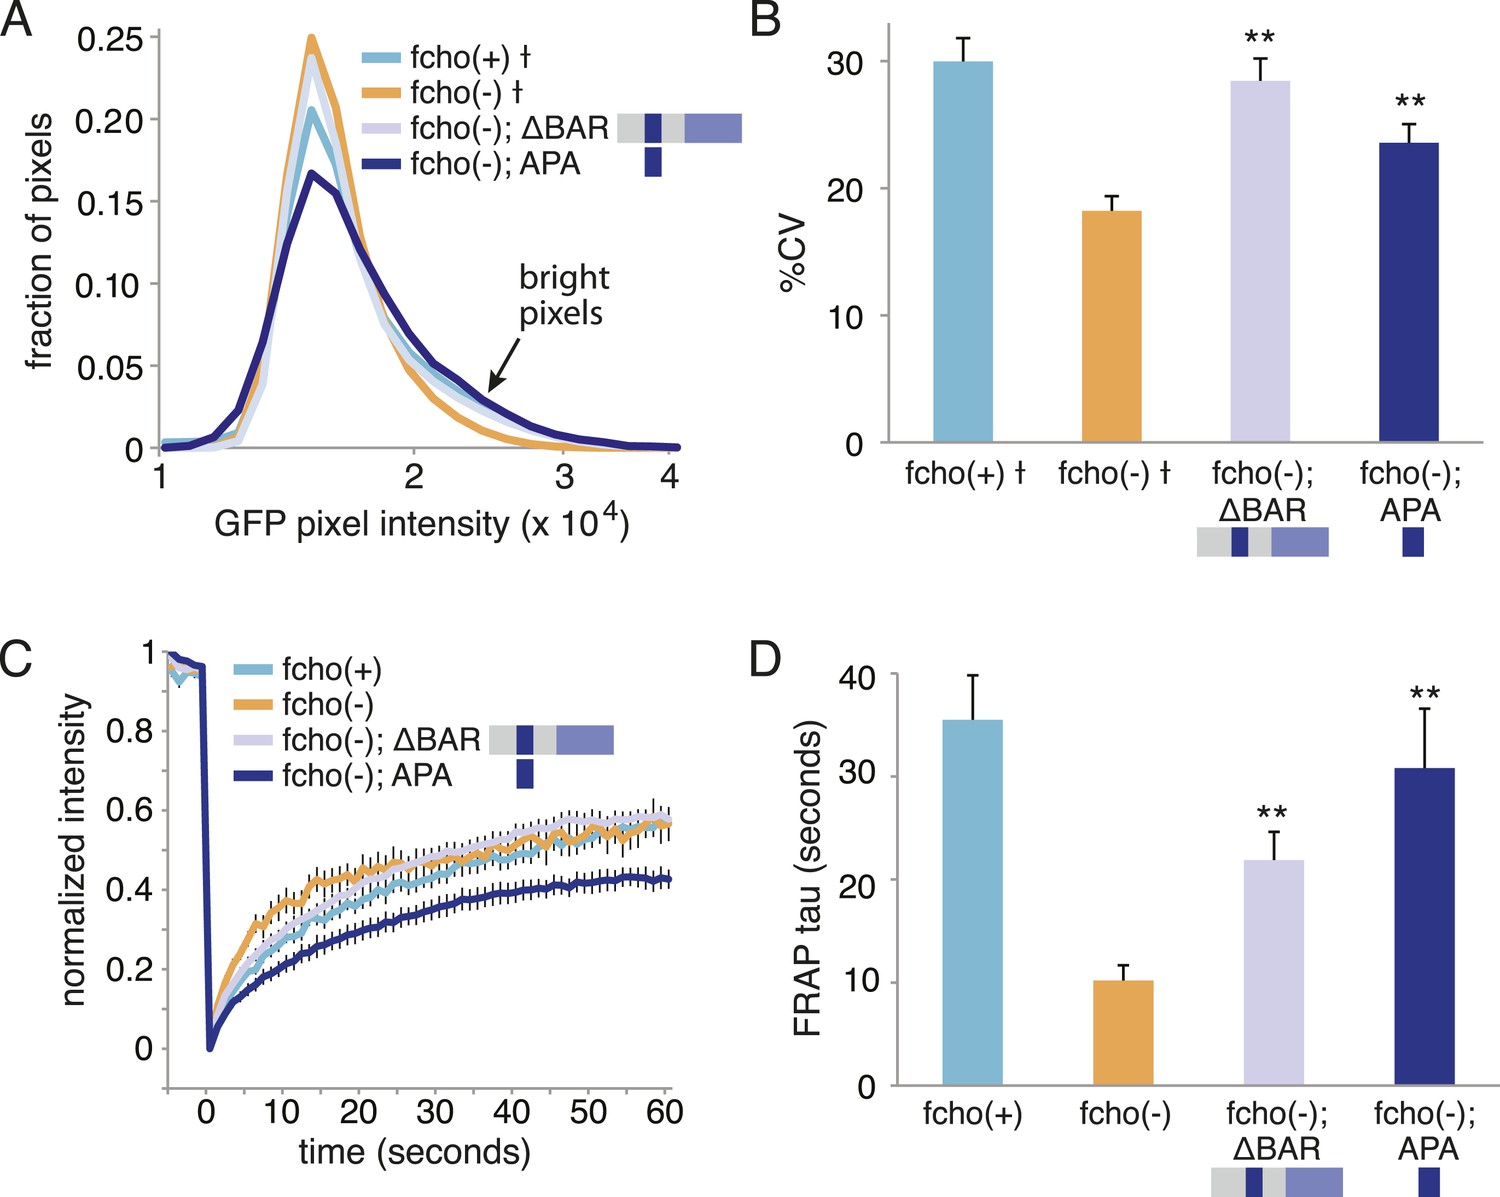
The APA domain of FCHO-1 Is sufficient to organize AP2 on the membrane.
ΔBAR represents worm FCHO-1 (amino acids 288–968) lacking the F-BAR domain expressed from a single-copy transgene while APA represents amino acids 454–565 overexpressed by an extrachromosomal (See Figure 6). (A) Distribution of the alpha-GFP pixel intensities in maximum Z-projections of coelomocyte halves as in Figure 1B († data reproduced from Figure 1B). Arrow indicates higher intensity pixels that are missing in fcho-1 mutants. (B) The percent coefficient of variance of the alpha-GFP pixel intensities in coelomocytes († data reproduced from Figure 1B). (C) FRAP assay. Fluorescence of membrane regions of coelomocytes expressing alpha-GFP photobleached at time = 0. (D) Time constants for recovery of fluorescence after photobleaching. Data represent mean ± SEM of n = 9–15 coelomocytes for (A) and (B), and n = 8–20 coelomocytes for (C) and (D); **p < 0.01 unpaired, two-tailed t-test compared to fcho(−).
Figure 7 with 2 supplements
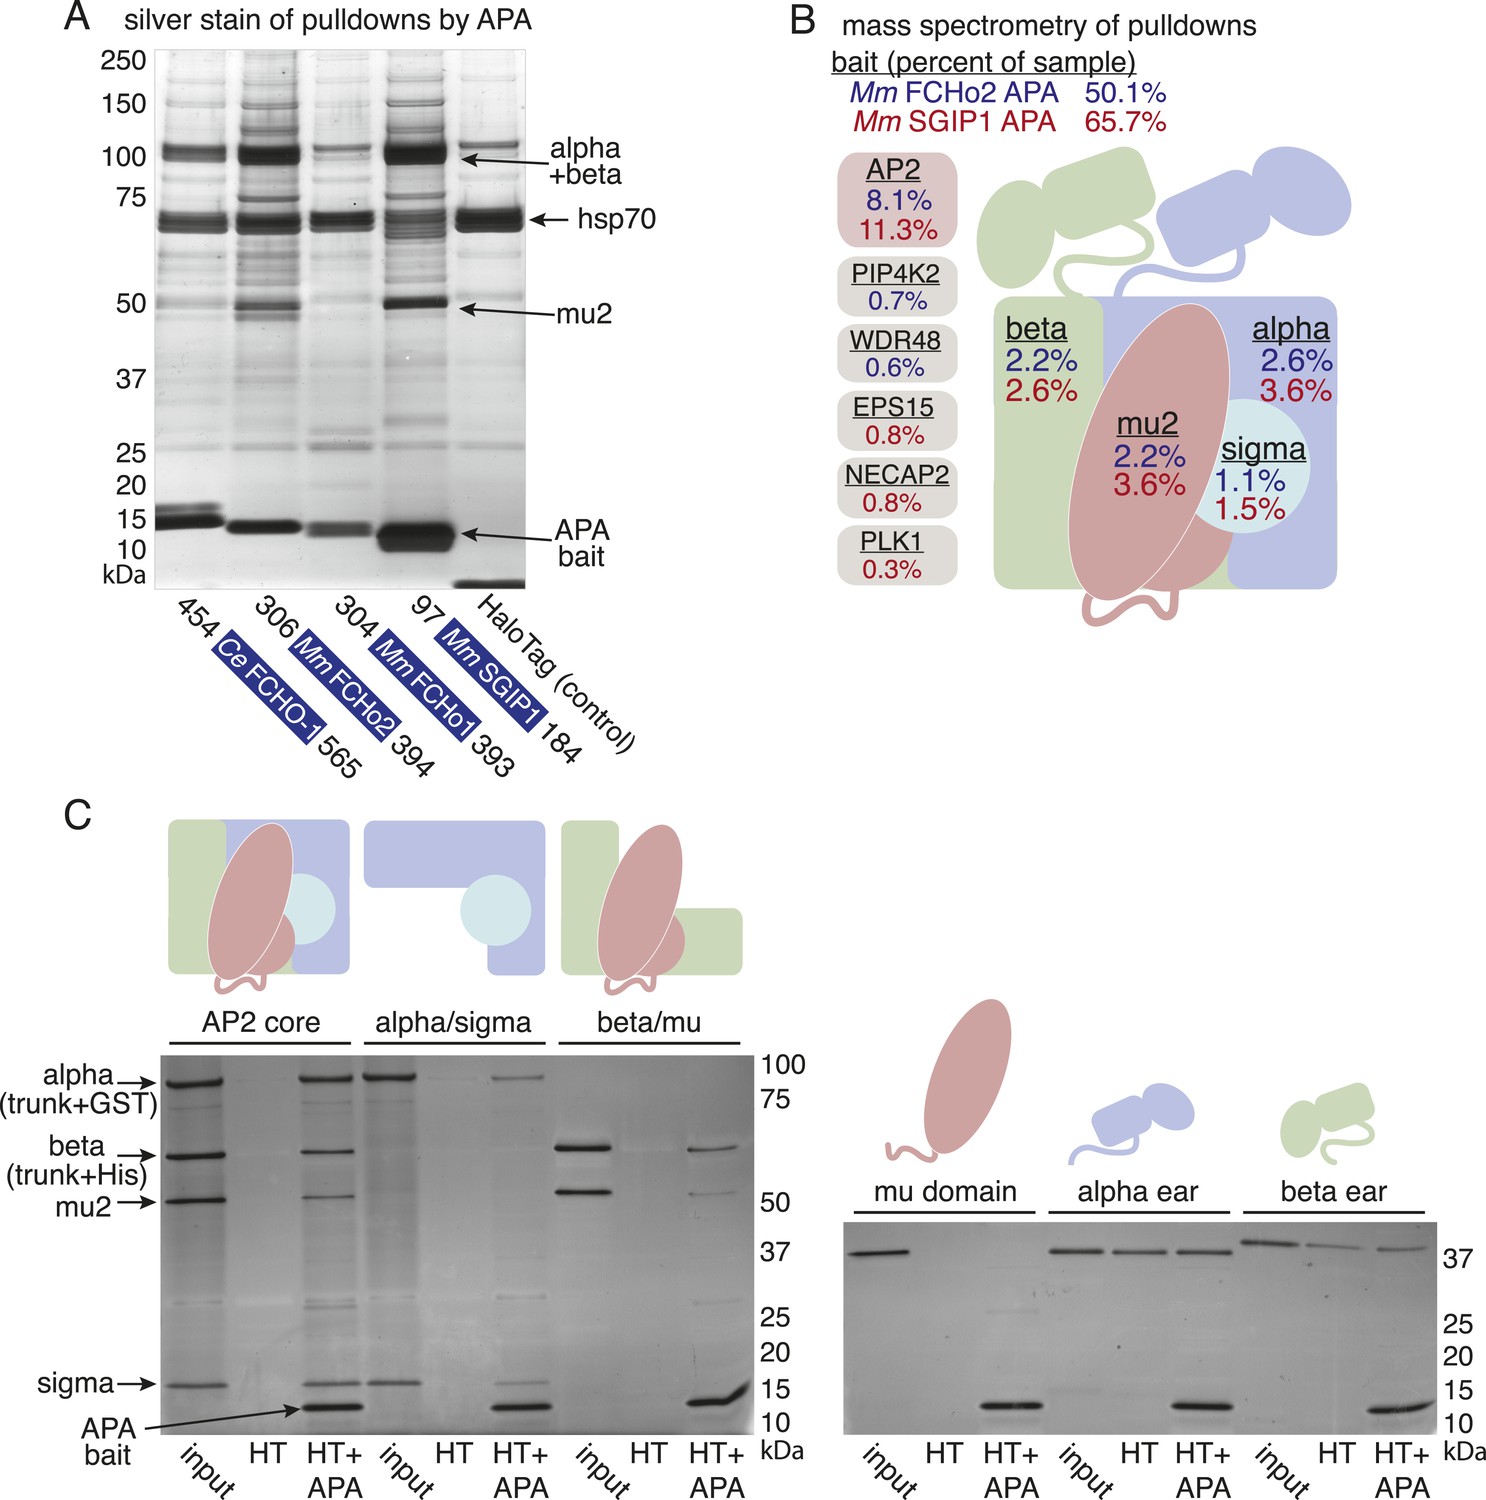
The APA domain binds AP2.
In (A) and (B) APA domains from FCHo homologs were expressed as HaloTag fusions in HEK293T cells (Ce, C. elegans; Mm, M. musculus). (A) Silver-stained gel of affinity-purified proteins following proteolytic cleavage from the HaloTag. Arrows indicate bands of presumed identity. (B) The top ten human proteins purified using two different APA baits, as detected by MudPIT mass spectrometry. Nonspecific proteins also found in the control were removed. Values represent the mean % distributed Normalized Spectral Abundance Factor (dNSAF × 100) from three independent experiments. The values of all four AP2 subunits were totaled to determine the amount of complex in each sample. Multiple isoforms of alpha, beta, and phosphatidylinositol 5-phosphate 4-kinase type-2 (PIP4K2) were summed. WD repeat-containing protein 48 (WDR48), epidermal growth factor receptor substrate 15 (EPS15), adaptin ear-binding coat-associated protein 2 (NECAP2), and serine/threonine-protein kinase PLK1 (PLK1). See Figure 7—figure supplement 2 for complete results. (C) APA pulldowns using bacterially expressed proteins. Purified HaloTag with (HT + APA) and without (HT) the APA domain from mouse SGIP1 were incubated with purified AP2 fragments followed by TEV protease cleavage to release the APA bait. Silver-stained gel of the eluted proteins. Note that the alpha/sigma and beta/mu hemicomplexes are soluble in our hands and that the AP2 appendage (ear) domains exhibit non-specific binding in this assay.
Figure 7—figure supplement 1
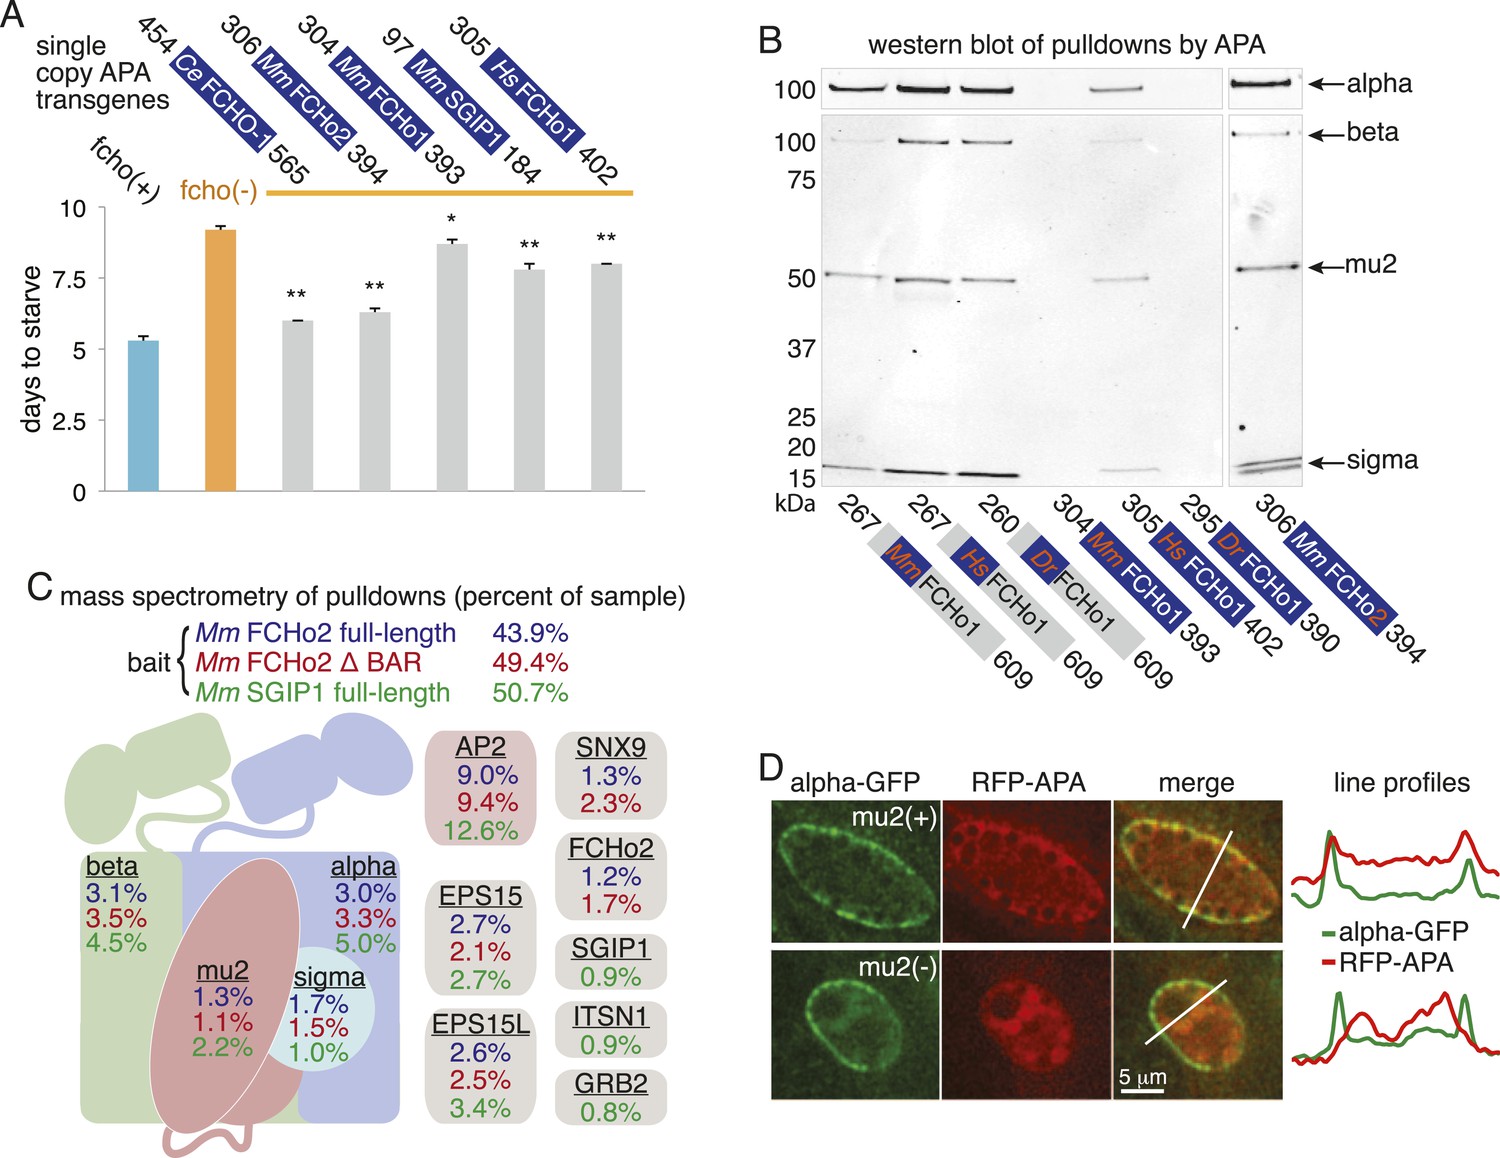
The APA domain links FCHo proteins to the AP2 complex.
(A) Starvation assay of fcho-1 mutant worms expressing APA domains as single-copy transgenes. Data represent mean ± SEM of n = 10 plates. *p < 0.05 and **p < 0.01 compared to fcho(−) worms, determined by unpaired, two-tailed t-test. (B) Western blot for AP2 subunits purified from HEK293T cells using FCHo1 linker regions and APA domains as bait. APA domain from FCHo2 included for comparison (far right). Blots were incubated with antibodies for all four subunits and detected using secondary antibodies for mouse (top) and rabbit (bottom). Weak binding of the mouse FCHo1 APA fragment to AP2 (See also Figure 7—figure supplement 2) was associated with weak rescue of fcho-1 mutants in (A). This result was not consistent with conservation of the APA domain (Figure 6A) and a previous report that the linker region of human FCHo1 binds AP2 (Umasankar et al., 2012). Indeed, the linker regions from mouse, human and zebrafish FCHo1 homologs affinity-purified AP2 (left), and the APA domain from human FCHo1 bound AP2 (middle) and rescued fcho-1 mutants better than the mouse fragment in (A). Note the cloned human fragment of APA is slightly larger than the mouse FCHo1 fragment, and this may account for differences in binding and rescue. For (A) and (B), C. elegans (Ce), M. musculus (Mm), H. sapiens (Hs), and Danio rerio (Dr). The APA domains are dark blue and the poorly conserved linker regions are gray. (C) Top ten human proteins purified using regions of FCHo proteins in addition to the APA domain as bait. ΔBAR lacks the N-terminal 278 amino acid F-BAR domain. Results from a single experiment reported as in Figure 7B. Epidermal growth factor receptor substrate 15 (EPS15), epidermal growth factor receptor substrate 15-like (EPS15L), sorting nexin-9 (SNX9), intersectin-1 (ITSN1), and growth factor receptor-bound protein 2 (GRB2). See Figure 7—figure supplement 2 for complete results. (D) Localization of APA in coelomocytes. Flourescently-tagged alpha subunit and APA domain from mouse SGIP1 were imaged in animals with and without the mu2 subunit. Intensity of each signal along the indicated line is plotted.
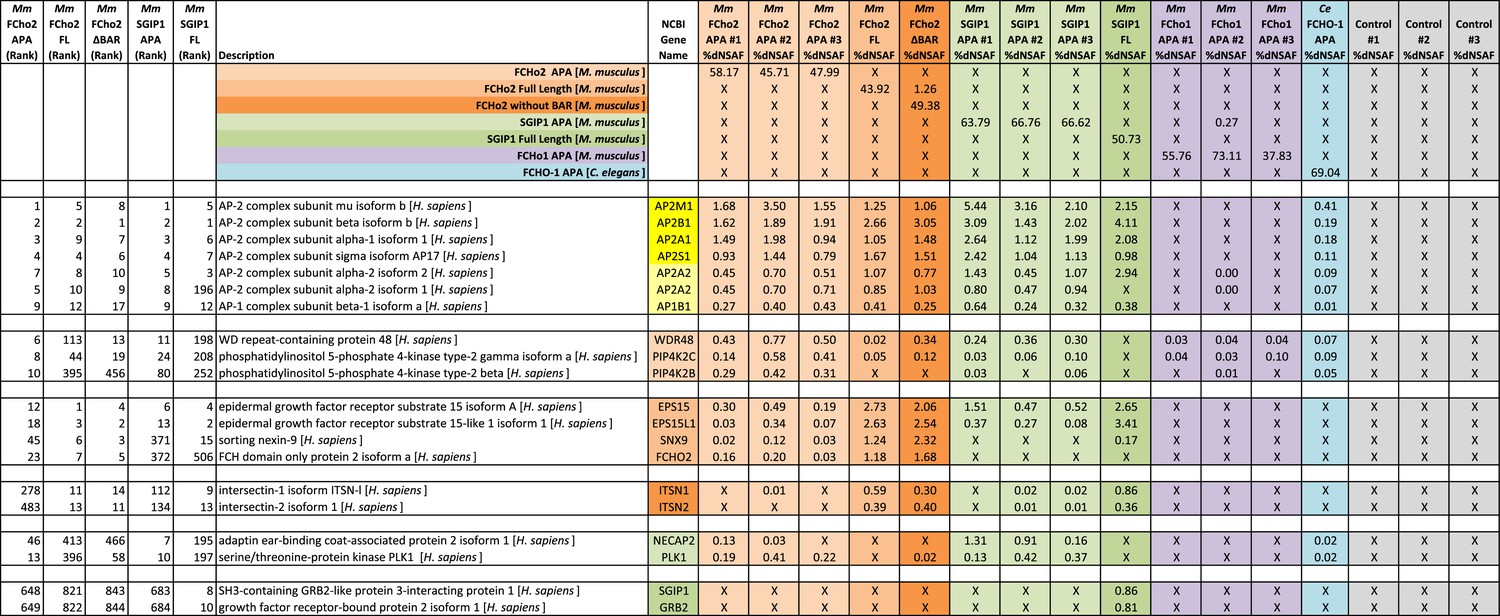
Figure 7—figure supplement 2
Top proteins detected by MudPIT analysis.
The top 10 proteins (in addition to bait) detected by MudPIT in samples purified from HEK293 cells using mouse FCHo2 and SGIP1 proteins (full-length and fragments) as bait. The ranked frequency of detection for each non-bait (H. sapiens) protein is indicated (Five leftmost columns). The amount of each protein present in the sample is reported as the percent distributed Normalized Spectral Abundance Factor (%dNSAF) along with the corresponding values from C. elegans FCHO-1 APA and control (HaloTag alone) samples (16 rightmost columns). Note that results from three separate experiments using the mouse APAs and negative control are reported. The wide middle column describes the Halo-tagged baits and associated human proteins. The subunits of the AP-2 complex (yellow) are detected in the top 10 proteins of most purifications. The AP2A2 and AP1B1 isoforms (light yellow) are less abundant (detected with one peptide unique to these isoforms). M. musculus (Mm), C. elegans (Ce), AP2 activator domain (APA), full-length (FL), lacking the F-BAR domain (ΔBAR), not-detected (X). See ‘Materials and methods’ for more information.
Figure 8
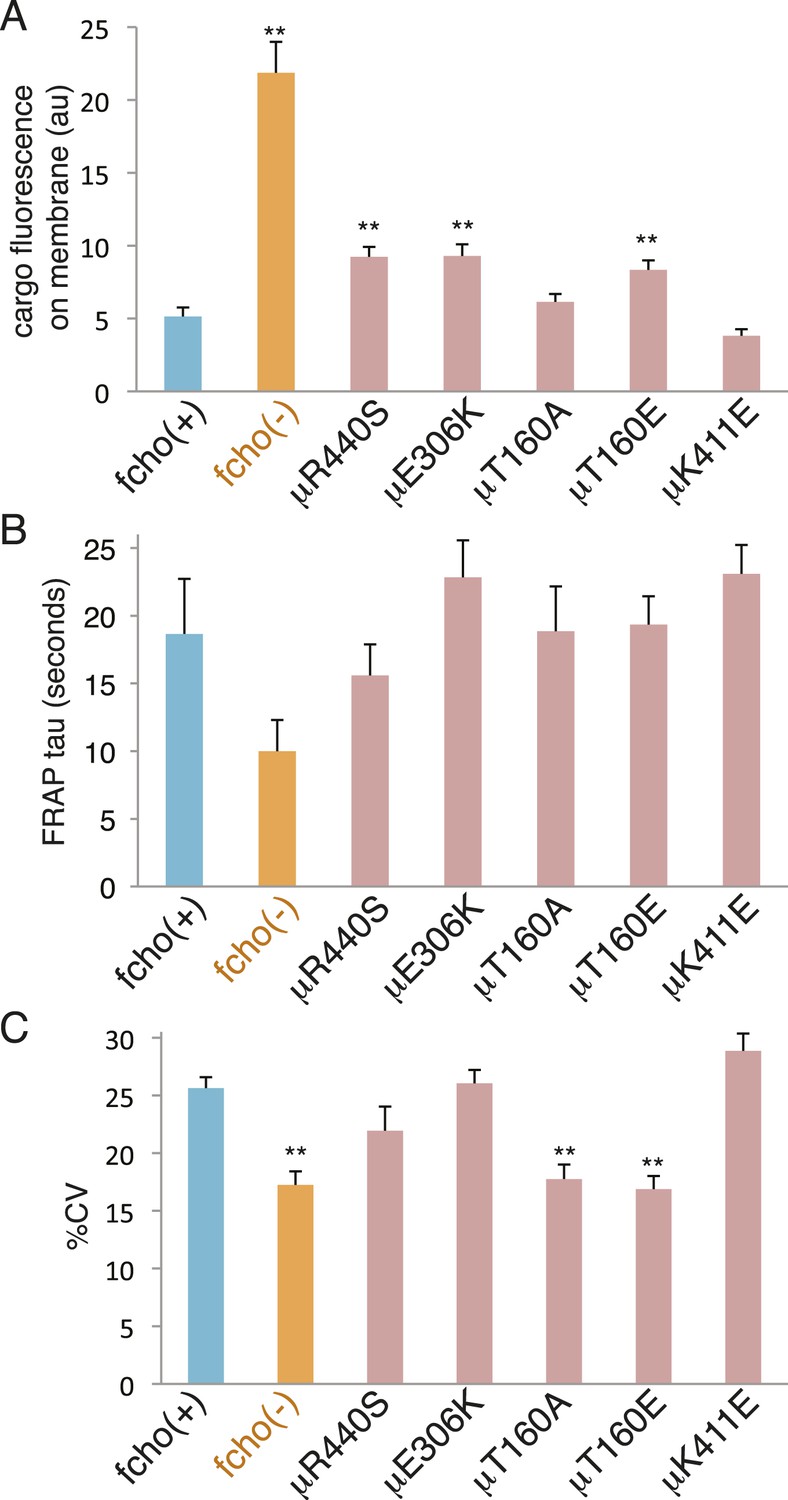
fcho-1 bypass mutants do not exhibit hyperactive AP2.
Mutations were examined in an fcho(+) background. (A) Cargo assay. Amount of GFP-tagged cargo on intestinal cell membrane. (B) FRAP assay. Time constants for recovery of alpha-GFP fluorescence after photobleaching. (C) The percent coefficient of variance of alpha-GFP pixel intensities in coelomocytes. Data represent mean ± SEM of n = 9–13 intestinal cells for (A) and n = 9–14 coelomocytes for (B) and (C); **p < 0.01 unpaired, two-tailed t-test compared to fcho(+).
Additional files
-
Supplementary file 1
Worm strains, plasmids, and oligonucleotide sequences. (A) Extended Strains List (B) Plasmids (C) Oligonucleotides.
- https://doi.org/10.7554/eLife.03648.021
Download links
A two-part list of links to download the article, or parts of the article, in various formats.
Downloads (link to download the article as PDF)
Open citations (links to open the citations from this article in various online reference manager services)
Cite this article (links to download the citations from this article in formats compatible with various reference manager tools)
The membrane-associated proteins FCHo and SGIP are allosteric activators of the AP2 clathrin adaptor complex
eLife 3:e03648.
https://doi.org/10.7554/eLife.03648


