RNA-guided assembly of Rev-RRE nuclear export complexes
- University of California, Berkeley, United States
- Howard Hughes Medical Institute, University of California, Berkeley, United States
- Lawrence Berkeley National Laboratory, United States
Figures
Figure 1 with 2 supplements
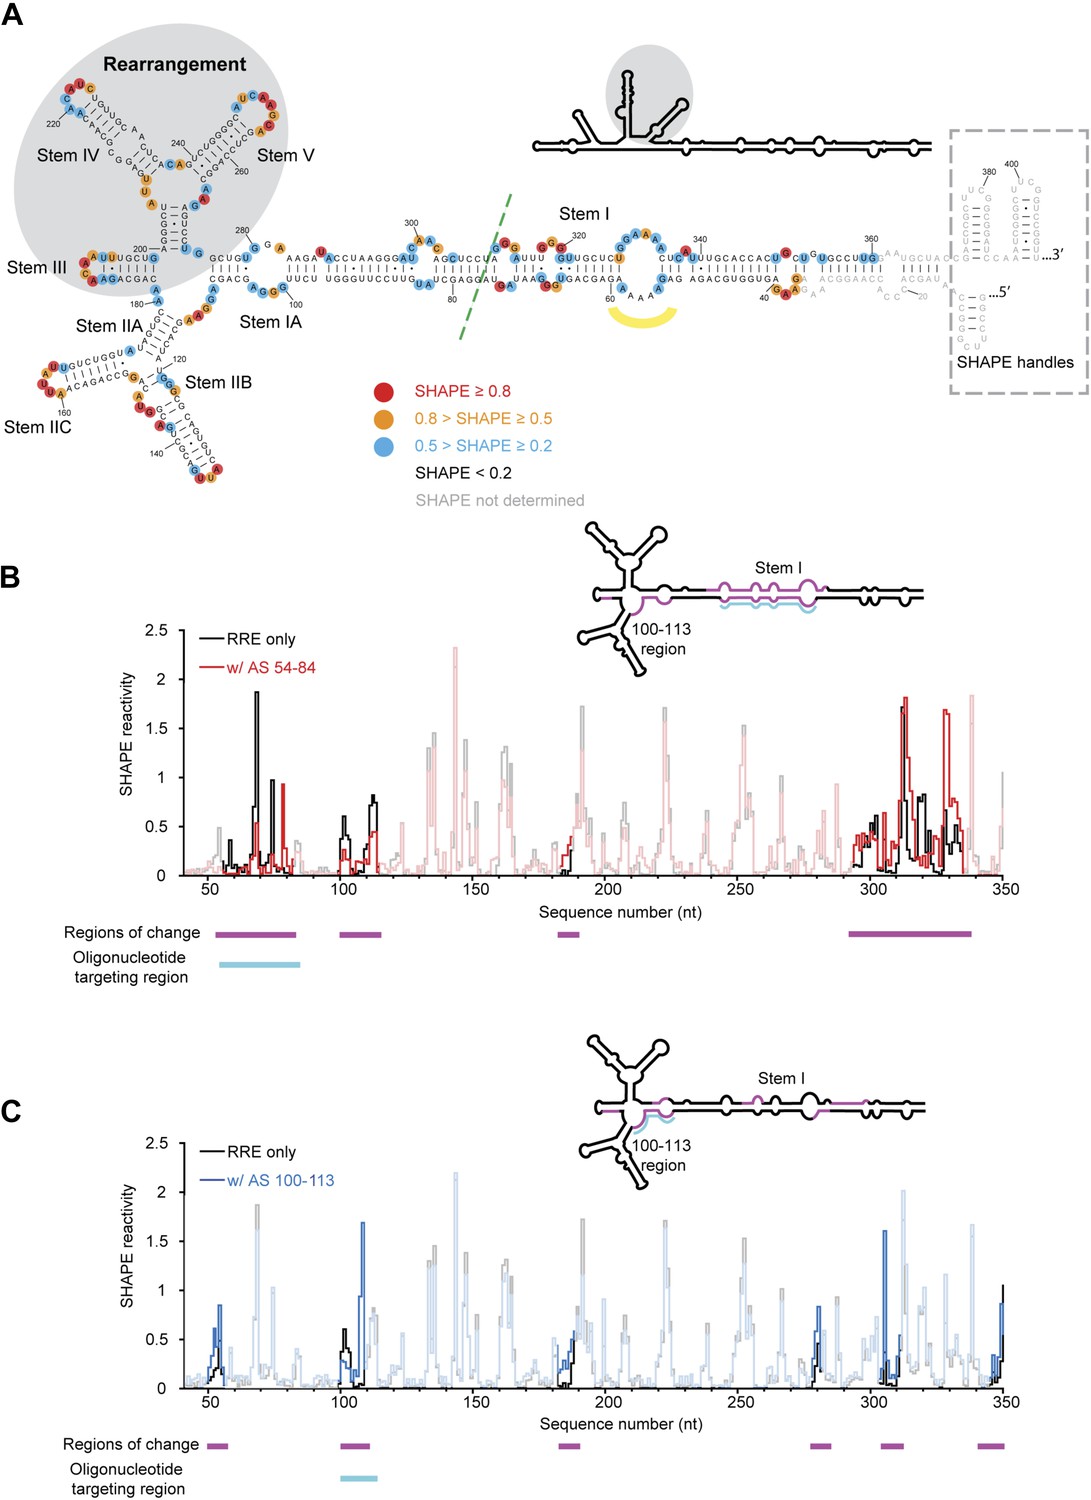
HIV RRE RNA adopts a pre-organized compact fold.
(A) SHAPE-based secondary structure of the RRE RNA. Red, orange, and blue dots highlight nucleotides with high, medium, and low SHAPE reactivity, respectively. Nucleotides with no SHAPE reactivity are in black. Nucleotides with SHAPE reactivity unidentified are in gray. The box shows the SHAPE handles in the RNA construct. The region of secondary structure rearrangement in our prediction is highlighted by gray shadow. The commonly used secondary structure is shown in the upper left with the rearranged region shadowed. The green line shows the ends of the 233-nt RRE construct (Fang et al., 2013). The yellow curve indicates the position of nucleotides 54-58. (B) SHAPE profiles of the RRE RNA alone (black) and the RNA-oligo complex (red) with AS 54-84. The anti-sense oligo region is shown in cyan, and the regions of SHAPE reactivity change are shown in magenta. Those regions are labeled both under the data chart and on the secondary structure model. (C) SHAPE profiles of the RRE RNA alone (black) and the RNA-oligo complex (blue) with AS 100-113. The anti-sense oligo region is shown in cyan, and the regions of SHAPE reactivity change are shown in magenta. Those regions are labeled both under the data chart and on the secondary structure model.
Figure 1—figure supplement 1
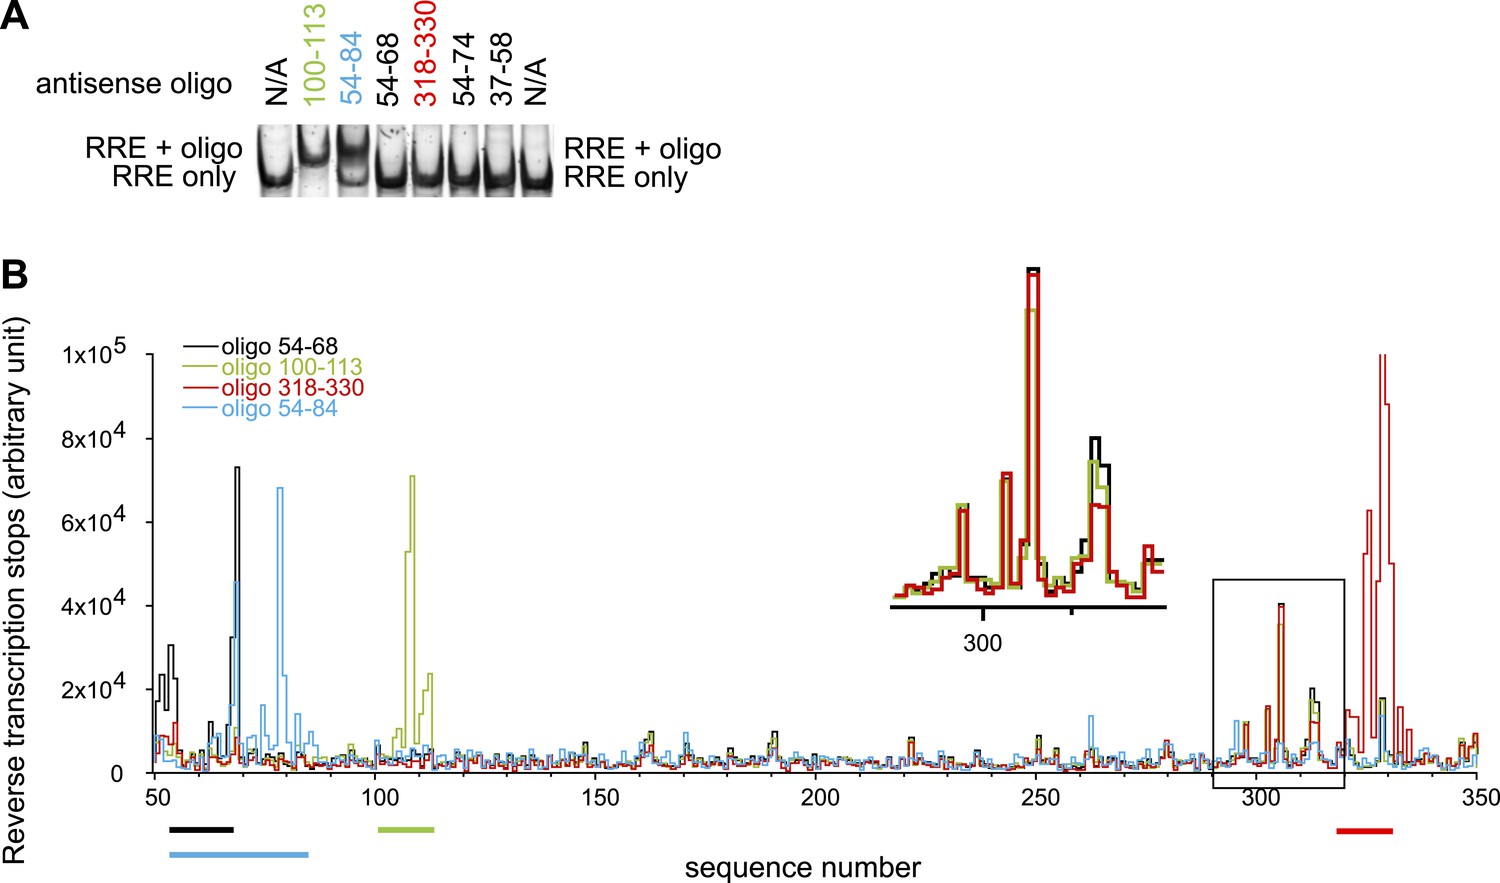
Designed oligonucleotides can invade and hybridize to the RRE RNA at specific sites.
(A) EMSAs showing AS 100-113 and AS 54-84 can form complexes with the RRE RNA, while shorter oligonucleotides targeting the Stem I region cannot bind to the RRE. (B) Toe-printing assays indicate that oligonucleotides only bind at designed locations. Peaks here indicate positions of reverse transcription dropoff. Oligonucleotides are color coded and the regions they are complementary to are indicated by lines of the same colors under the graph. Experiments with oligo 54-68, 100-113, and 318-330 are done using the same batch of RNA. The peak region in the black box at ∼300-nt (Insert shows the expanded region within the box) reflects a small amount of RNA degradation product. This is not a result of oligonucleotide binding at a secondary site as the same signals are observed regardless of input oligonucleotides and this pattern disappeared when a different batch of RNA is used as shown in blue. While by EMSAs complex between antisense oligo 54-68/318-330 and RRE were not detectable, small fractions of complex can be detected from toe-printing assays, indicating that the toe-printing experiments are highly sensitive for small fraction of oligonucleotide binding.
Figure 1—figure supplement 2
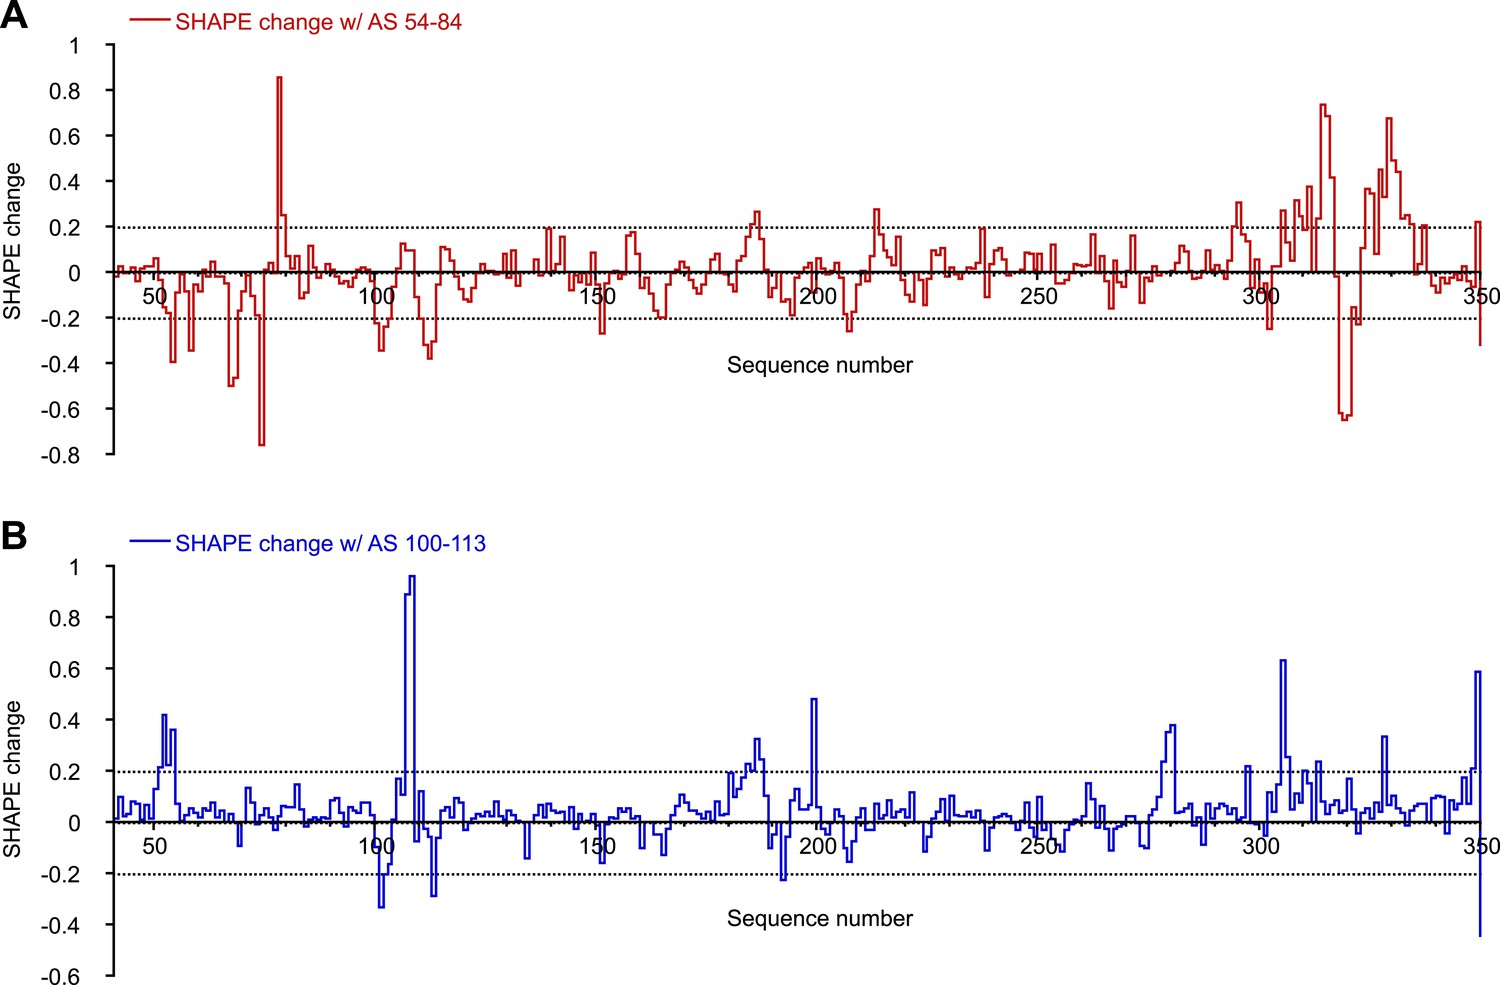
SHAPE changes induced by oligonucleotides interactions.
To make this plot, any SHAPE value >1.0 was set to 1.0. This is because changes for any SHAPE reactivities beyond that is not relevant as those positions will be considered highly reactive in both cases. Change in a local area is considered relevant only if two or more consecutive nucleotides show significant SHAPE changes. (A) SHAPE changes induced by binding of AS 54-84. (B) SHAPE changes induced by binding of AS 100-113.
Figure 2 with 1 supplement
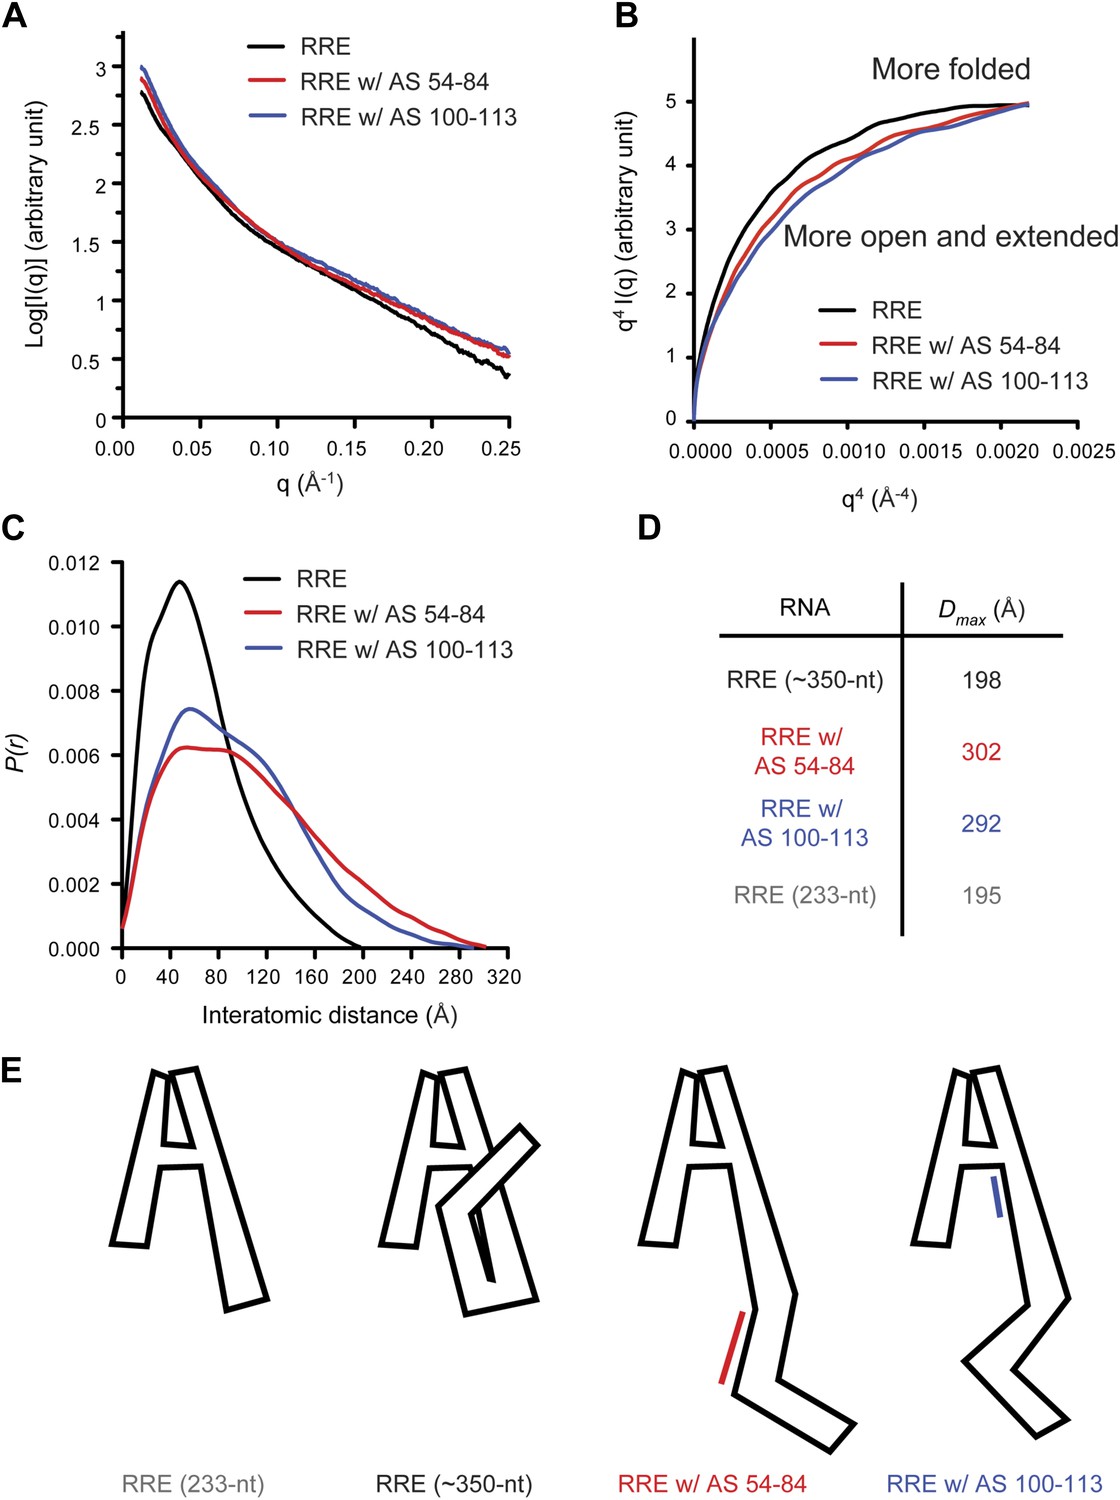
Model of the compact RRE RNA conformation.
(A) RRE-oligo complexes show scattering patterns different from that of the RRE RNA alone. (B) Porod-Debye plot of RRE RNA and RNA-oligo complexes indicates the native RNA is more folded and the RNA-oligo complexes are more open and extended. (C) Distance distribution function (P(r)) of RRE RNA and RNA-oligo complexes. (D) Comparison of particle maximum diameter (Dmax) of RRE RNA and RNA-oligo complex. Data for 233-nt RNA is as published (Fang et al., 2013). (E) Model for the compact fold of the RRE mediated by tertiary interactions between the 100-113 region and Stem I.
Figure 2—figure supplement 1
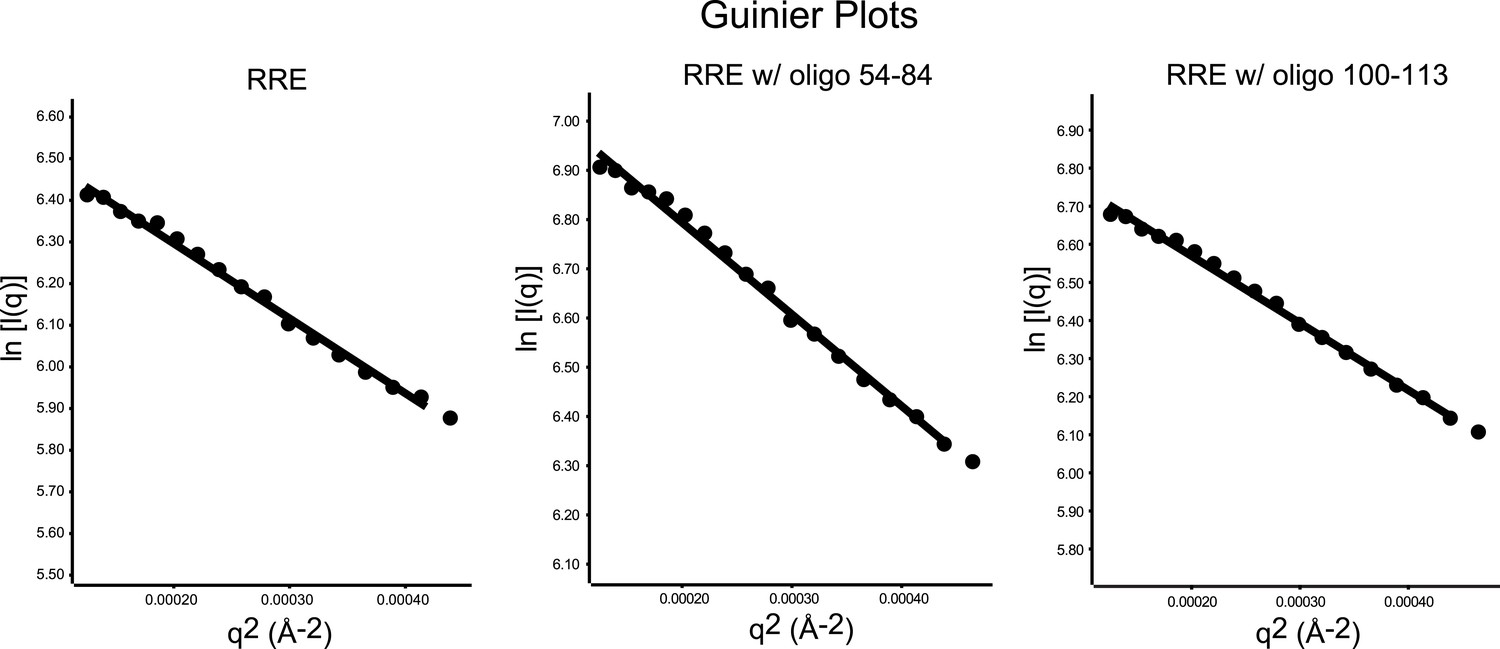
Guinier plots of the SAXS data.
Left, Guinier plot of the full-length RRE; middle, Guinier plot of the RRE with antisense oligonucleotide 54-84; Right, Guinier plot of the RRE with antisense oligonucleotide 100-113. Guinier analysis were performed on the data within the q-range limited by q * Rg < 1.3 (11–12 data points for each sample), a few more data points are plotted to demonstrate a longer linear range.
Figure 3 with 1 supplement
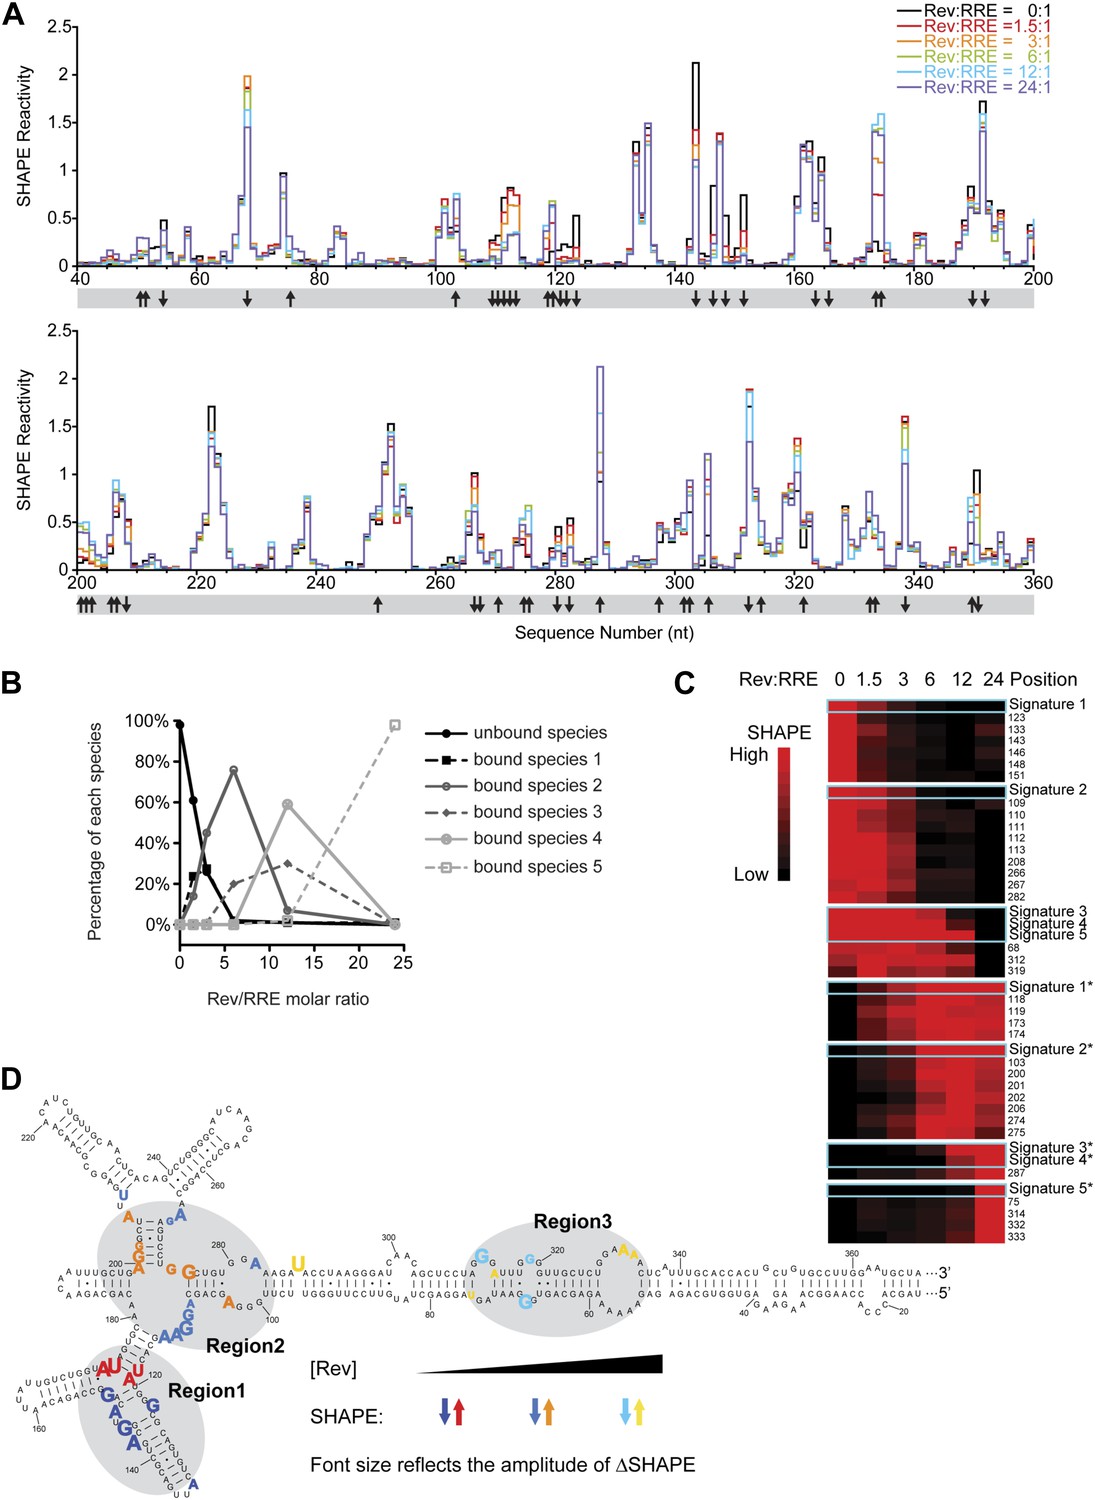
Thermodynamic studies on the Rev-RRE assembly pathway.
(A) SHAPE profiles from samples at different Rev:RRE ratio. The positions showing increase/decrease of SHAPE reactivity are indicated with arrows at the bottom of the plots. (B) Trend of emergence of each Rev-RRE sub-complex at increasing ratios of Rev. (C) k-means clustering result of nucleotides following distinct SHAPE signatures with the SHAPE signatures shown in cyan boxes. 5 of the 10 SHAPE signatures (Signatures*) represent increased SHAPE reactivity as a function of Rev concentration, while the other five (Signatures) reflect decreased SHAPE reactivity. They fall into seven clusters because some signatures are not distinct enough from others. Red indicates higher SHAPE reactivity while black indicates lower SHAPE reactivity. (D) Nucleotide positions affected by Rev binding. In red, orange and yellow shows positions with increased SHAPE reactivity upon Rev binding. In dark, medium and light blue shows positions with decreased SHAPE reactivity upon Rev binding. Changes emerging at lower Rev:RRE stoichiometry are shown in darker colors, while changes emerging at higher Rev:RRE stoichiometry are shown in lighter colors. Font size reflects the amplitude of SHAPE change. Region1, Region2 and Region3 are highlighted by gray shadows.
Figure 3—figure supplement 1
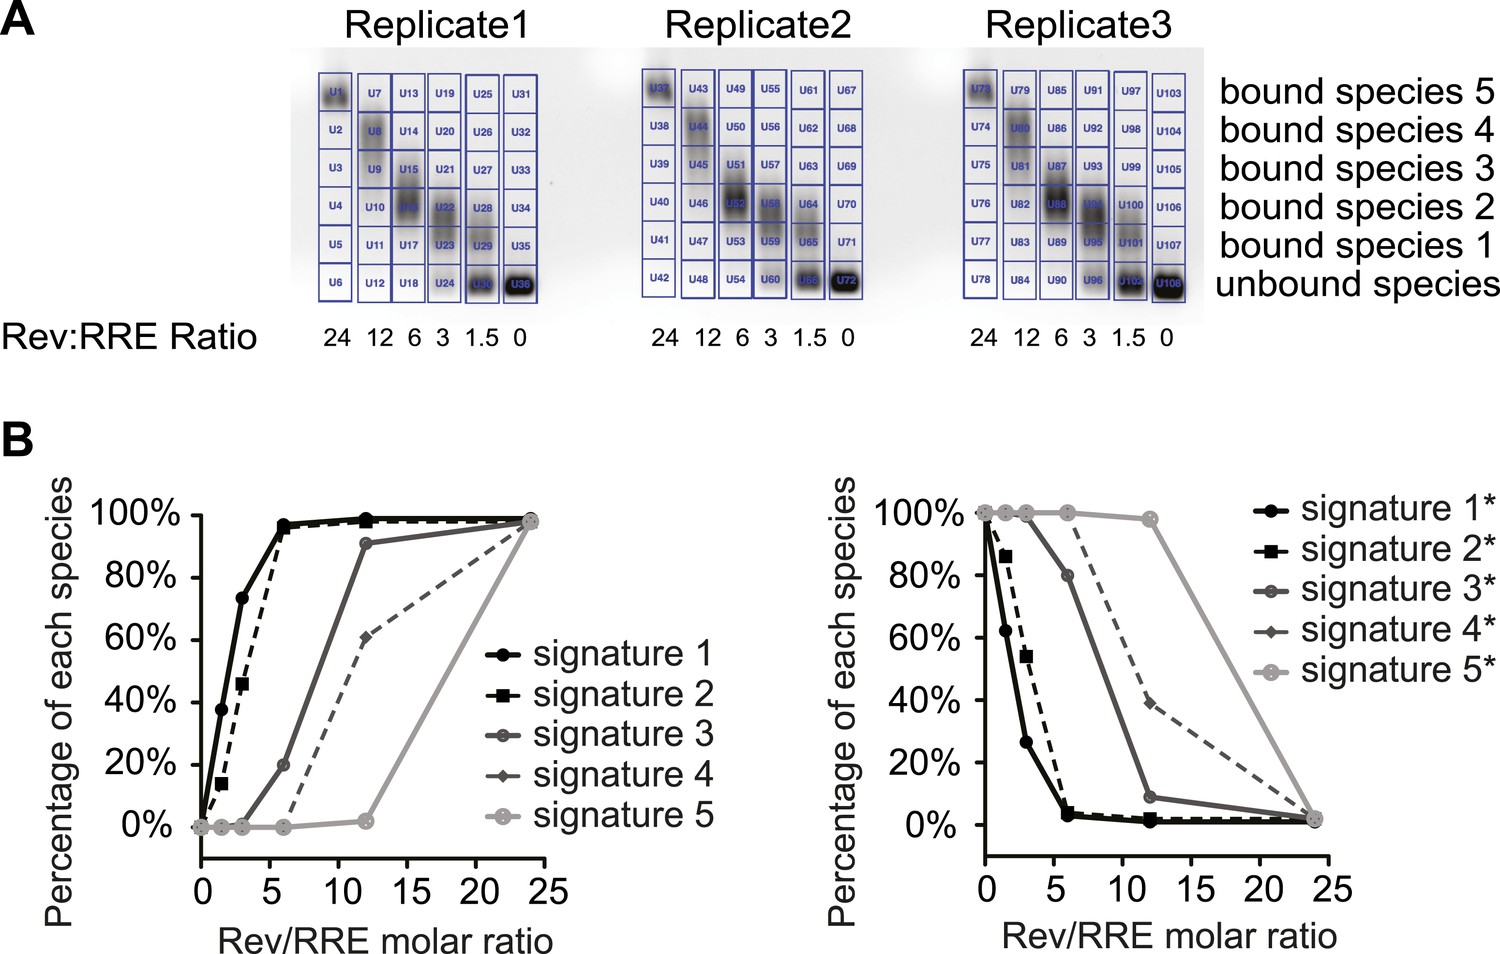
SHAPE signatures generated by EMSA.
(A) EMSAs for quantification of different Rev-RRE intermediate states. (B) SHAPE signatures calculated based on EMSAs results. Left, SHAPE signatures representing nucleotides with increased SHAPE reactivity upon Rev binding. Right, SHAPE signatures representing nucleotides with decreased SHAPE reactivity upon Rev binding.
Figure 4 with 2 supplements
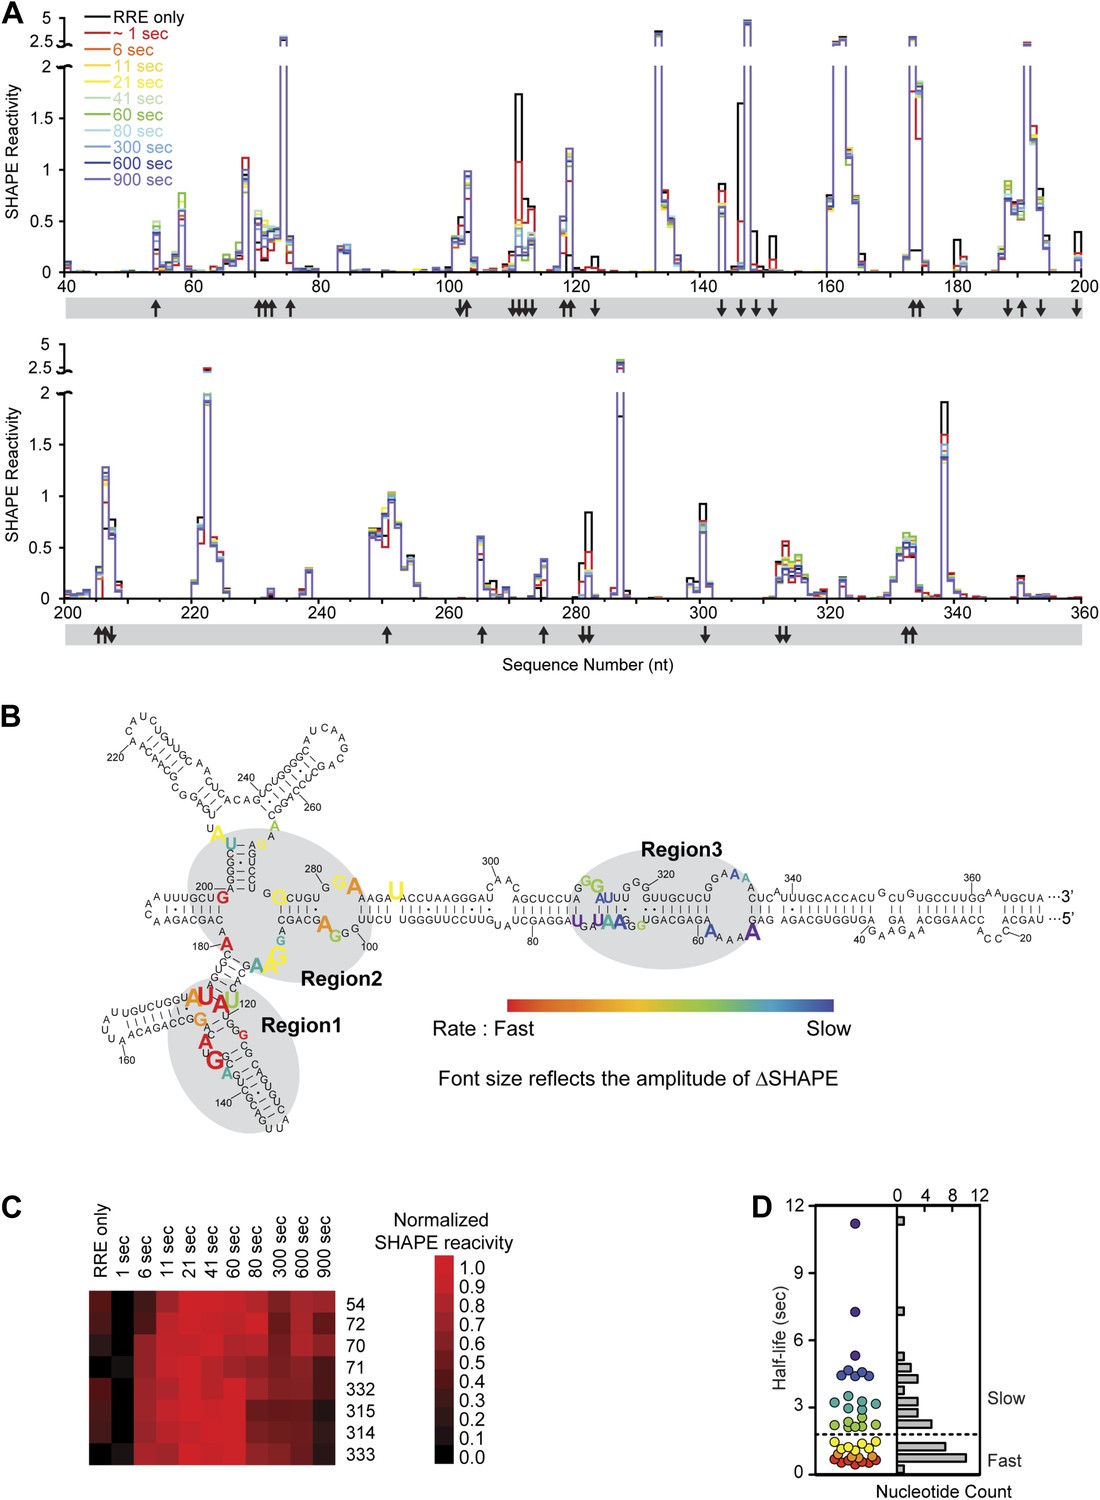
Dynamic assembly of the Rev-RRE RNP.
(A) SHAPE profiles for second-resolution snapshots of the RRE at different time points over the course of Rev-RRE assembly. The positions showing increase or decrease of SHAPE reactivity are indicated with arrows at the bottom of the plots. For ease of comparison, the theta values are converted to SHAPE reactivity values by renormalization following the 2%/8% rule for each SHAPE profile, with the top 2% of theta values being excluded and the next 8% of theta values being averaged to get the normalization factor, against which all the theta values are normalized (Low and Weeks, 2010; Lucks et al., 2011). (B) Nucleotide positions affected by Rev binding. Different nucleotides are labeled across the spectrum based on the rate of SHAPE change, with the fastest rate in red and the slowest in purple. Font size reflects the amplitude of SHAPE change. Region1, Region2 and Region3 are highlighted by gray shadows. (C) Heat map showing the SHAPE pattern as a function of time for the nucleotides with complex SHAPE-changing features. For each nucleotide in this panel, the SHAPE values are normalized to 0–1 in order to emphasize the trend of SHAPE change. (D) Scatterplot (left) and histogram (right) showing the distribution of the SHAPE change half-life for nucleotides showing significant SHAPE change. Colors used in the scatter plot correspond to those used in panel B. Both plots show a fast-SHAPE-changing group and a slow-SHAPE-changing group.
Figure 4—figure supplement 1
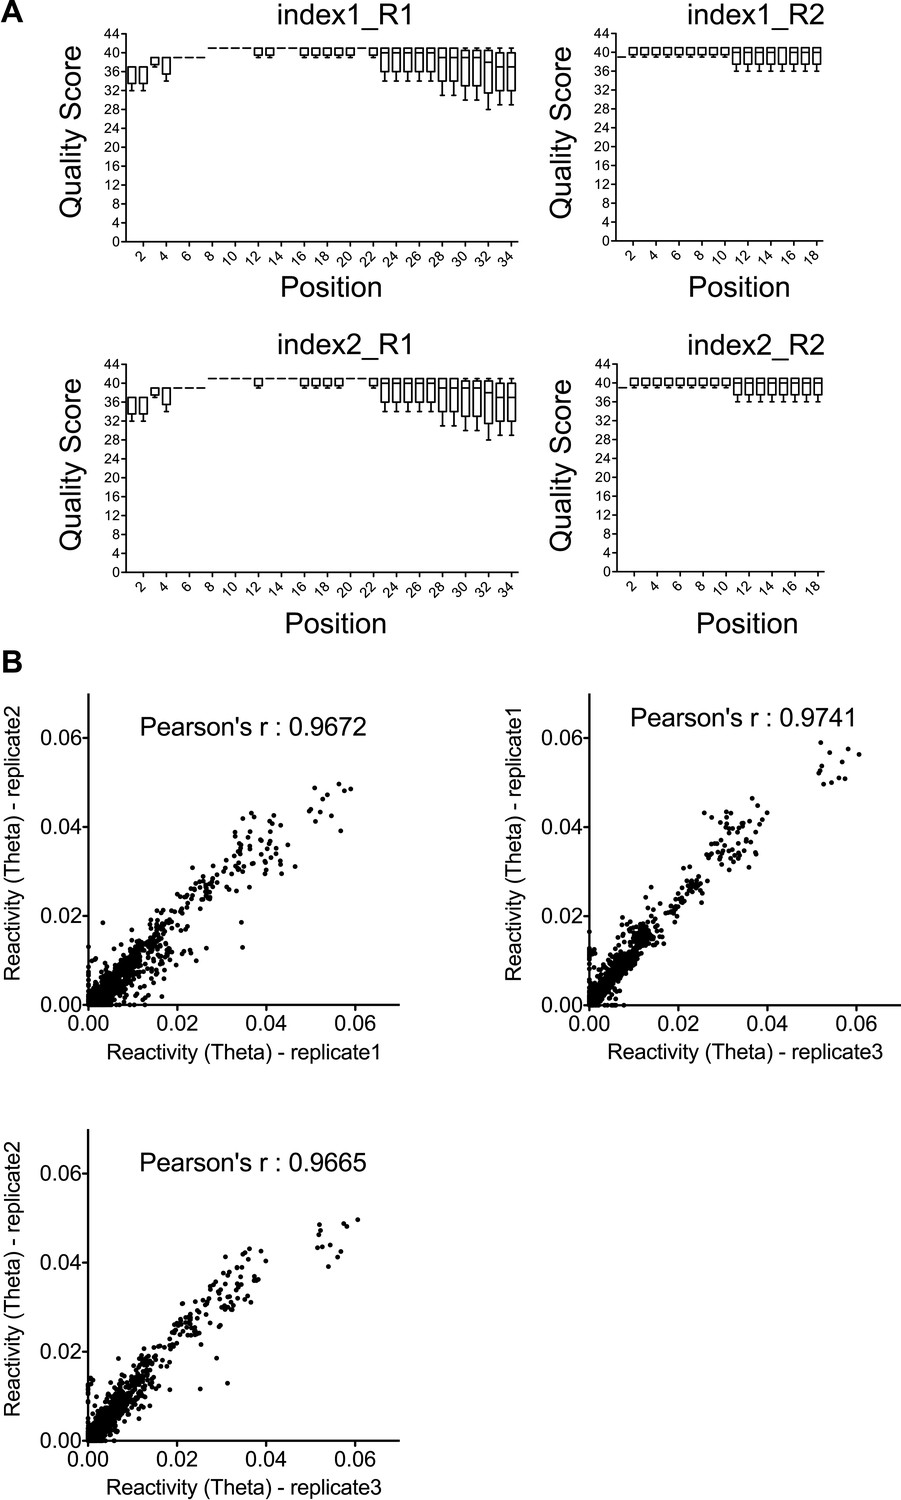
Quality and reproducibility test for the SHAPE-Seq data.
(A) Quality statistics for SHAPE-Seq reads used for analysis. Index1 and index2 are two barcodes introduced during the PCR amplification step. R1 and R2 represent the paired-end reads from both directions. (B) Correlation between the reactivity (theta) in any two of the three time-series datasets used for SHAPE change rate determination.
Figure 4—figure supplement 2
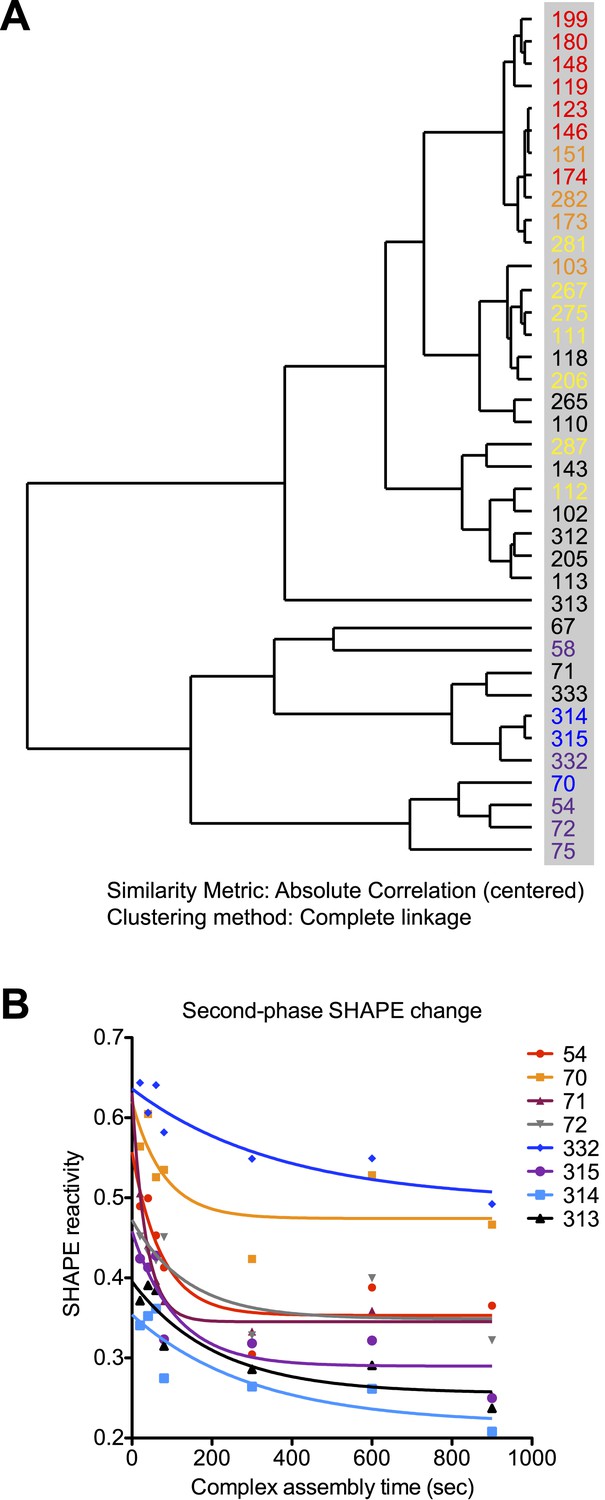
Rev-RRE assembly process exhibits two-step features.
(A) Dendrogram of the rates for SHAPE-reactivity changes at different nucleotides. All the fast-reacting and slow-reacting nucleotides are colored in the same way as in Figure 4, while intermediate reacting nucleotides are colored in black. (B) Second-phase SHAPE changes for positions with complex SHAPE-changing patterns. All these positions are located in Region3. Data from the first 10 s were excluded from the fitting. As a reference to show the slow decrease of SHAPE reactivity, all data is fitted to one-phase decay with automatic outlier elimination using GraphPad Prism 5.0b for Mac OS X.
Figure 5
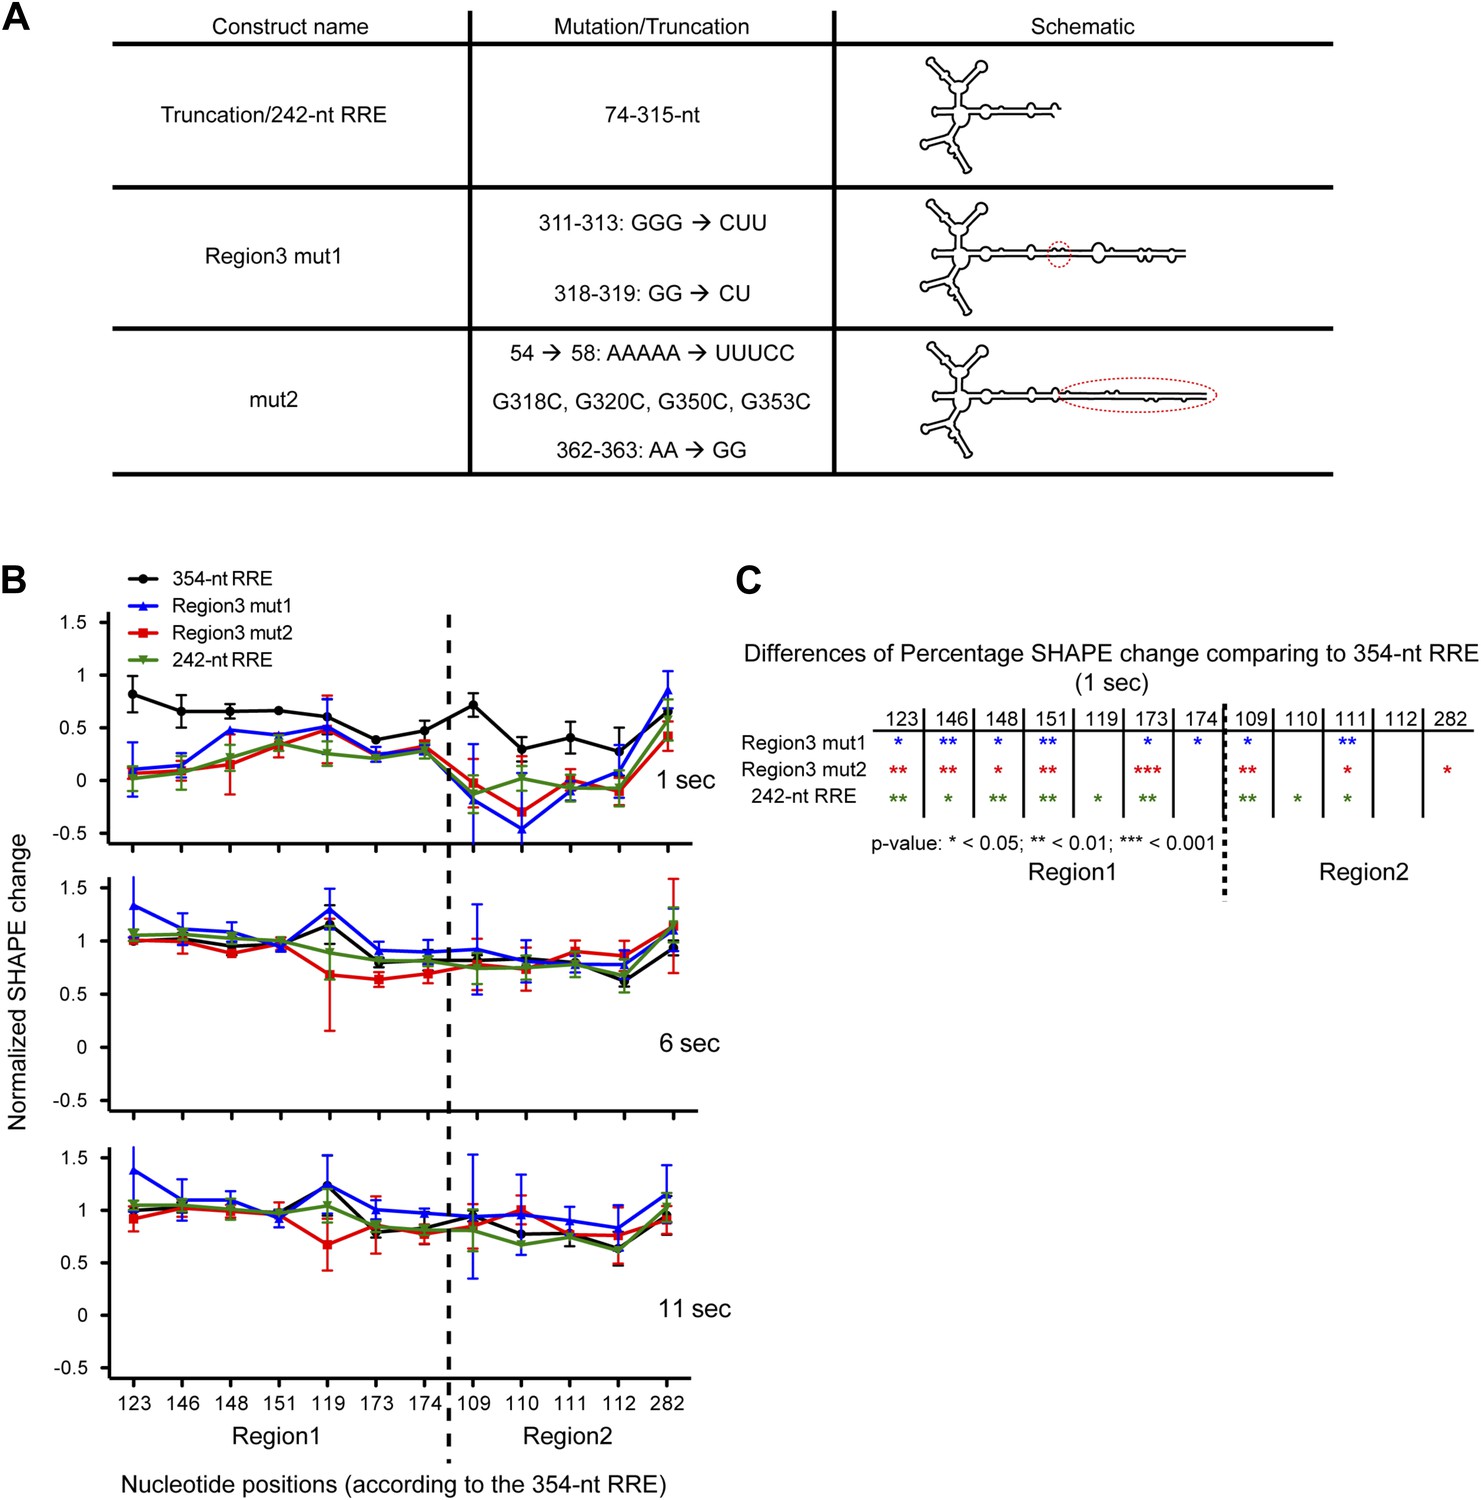
Functional importance of the Region3.
(A) Table showing the mutations used in this figure. (B) Normalized SHAPE change at 1, 6 and 11 s after Rev binding. The ∼354-nt RRE is shown in black, Region3 mut1 is shown in blue, mut2 is shown in red and the 242-nt RRE is shown in green. (C) Table indicating the significance of the differences in normalized SHAPE changes between different constructs at 1 s. All mutants are compared to the 354-nt WT RRE.
Figure 6
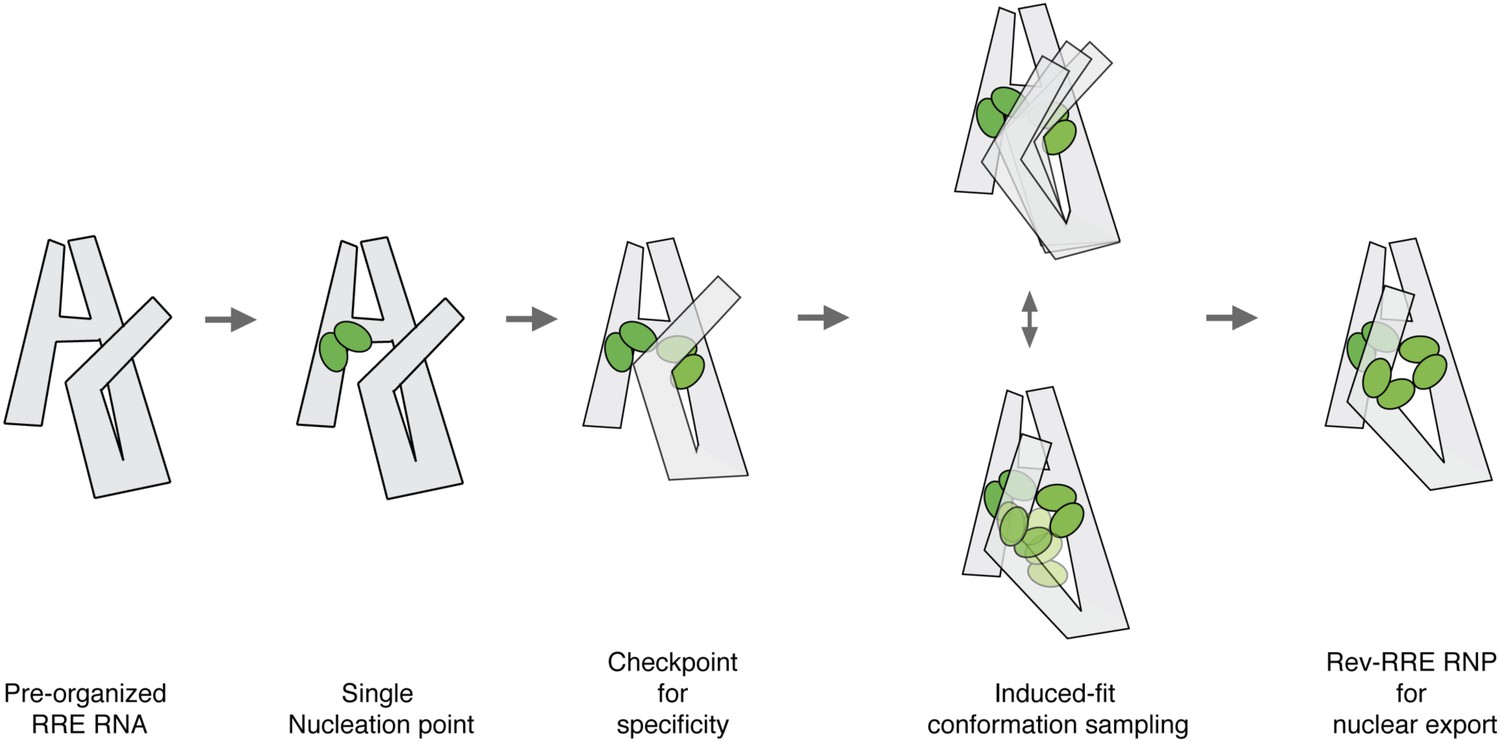
Model for pre-organized RRE RNA guides sequential binding of Rev to form the Rev-RRE RNP.
RRE RNA forms a compact fold in the absence of Rev. Rev assembly on the RRE starts from a single nucleation point. Region1 and Region2 binding are coupled and the four-Rev complex state can serve as a checkpoint to ensure specificity. Region2 Rev binding leads to conformational change of the RRE to allow additional Rev binding through induced-fit. Both Rev and RRE could sample a number of interaction conformations at the same time until an optimal binding state is reached. The high-oligomer complex is then ready for Crm1 binding and nuclear export.
Additional files
-
Supplementary file 1
Comparison of RRE alone and RRE in complex with antisense oligonucleotides.
- https://doi.org/10.7554/eLife.03656.015
-
Supplementary file 2
SHAPE-changing rate demonstrating half-life at different nucleotides. For positions with complex SHAPE reactivity changes, only the six earlier data points were used for the fitting. Data was fitted to one-phase decay/association with automatic outlier elimination using GraphPad Prism 5.0b for Mac OS X.
- https://doi.org/10.7554/eLife.03656.016
Download links
A two-part list of links to download the article, or parts of the article, in various formats.
Downloads (link to download the article as PDF)
Open citations (links to open the citations from this article in various online reference manager services)
Cite this article (links to download the citations from this article in formats compatible with various reference manager tools)
RNA-guided assembly of Rev-RRE nuclear export complexes
eLife 3:e03656.
https://doi.org/10.7554/eLife.03656


