Counteracting suppression of CFTR and voltage-gated K+ channels by a bacterial pathogenic factor with the natural product tannic acid
- Howard Hughes Medical Institute, University of Pennsylvania, United States
Figures
Figure 1
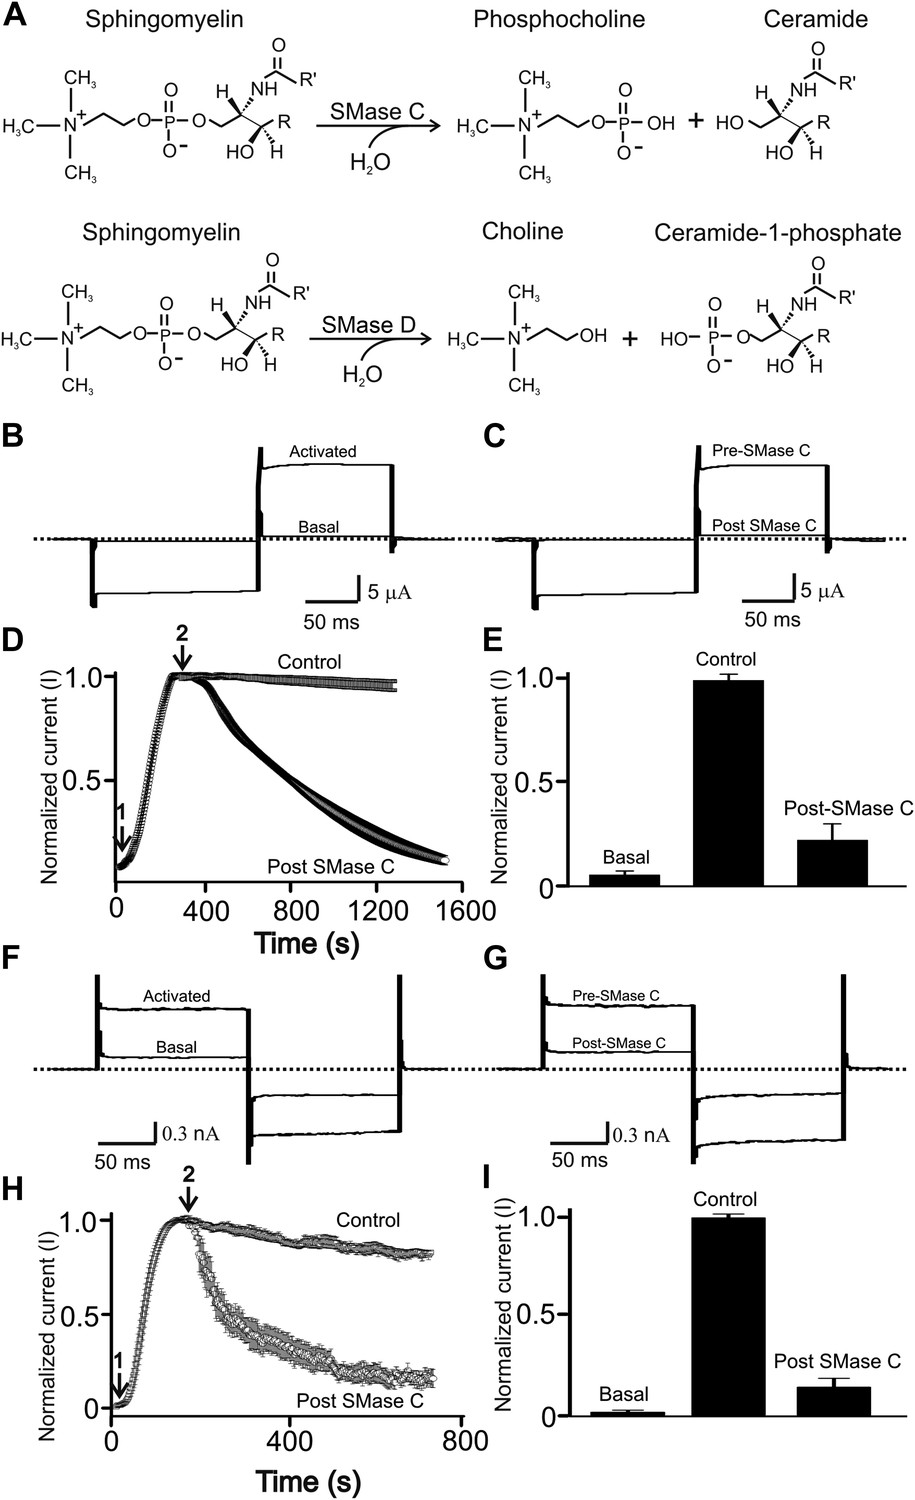
SMase C suppression of heretologously expressed and native CFTR currents.
(A) Sphingomyelin hydrolysis reactions catalyzed by SMases C and D. (B) and (C) Currents of an oocyte injected with cRNA encoding CFTR before or after activation with 50 µM forskolin and 1 mM IBMX in the bath solution (B) and activated CFTR currents pre- or post-application of SMase C from S.aureus (SaSMase C: 0.4 ng/μl) (C), elicited by stepping membrane voltage from the −30 mV holding potential to −80 mV and then to 50 mV. (D) Time course of normalized CFTR currents at 50 mV where the arrows indicate addition of forskolin plus IBMX (arrow 1) or SaSMase C (arrow 2) (mean ± s.e.m, n = 6). (E) Normalized current amplitude before or after activation by forskolin plus IBMX and post-SMase C treatment (mean ± s.e.m, n = 6). (F) and (G) Native currents of a Calu-3 cell before or after activation with 50 µM forskolin and 1 mM IBMX in the bath solution (F) and activated CFTR currents before and after addition of SaSMase C (G), elicited by stepping membrane voltage from the 0 mV holding potential to −80 mV and then to 80 mV. (H) Time course of normalized CFTR currents at 80 mV where the arrows indicate addition of forskolin plus IBMX (arrow 1) or SaSMase C (0.5 ng/μl; arrow 2) (mean ± s.e.m, n = 7). (I) Normalized current amplitude before or after activation by forskolin plus IBMX and post-SMase C treatment (mean ± s.e.m, n = 7).
Figure 2
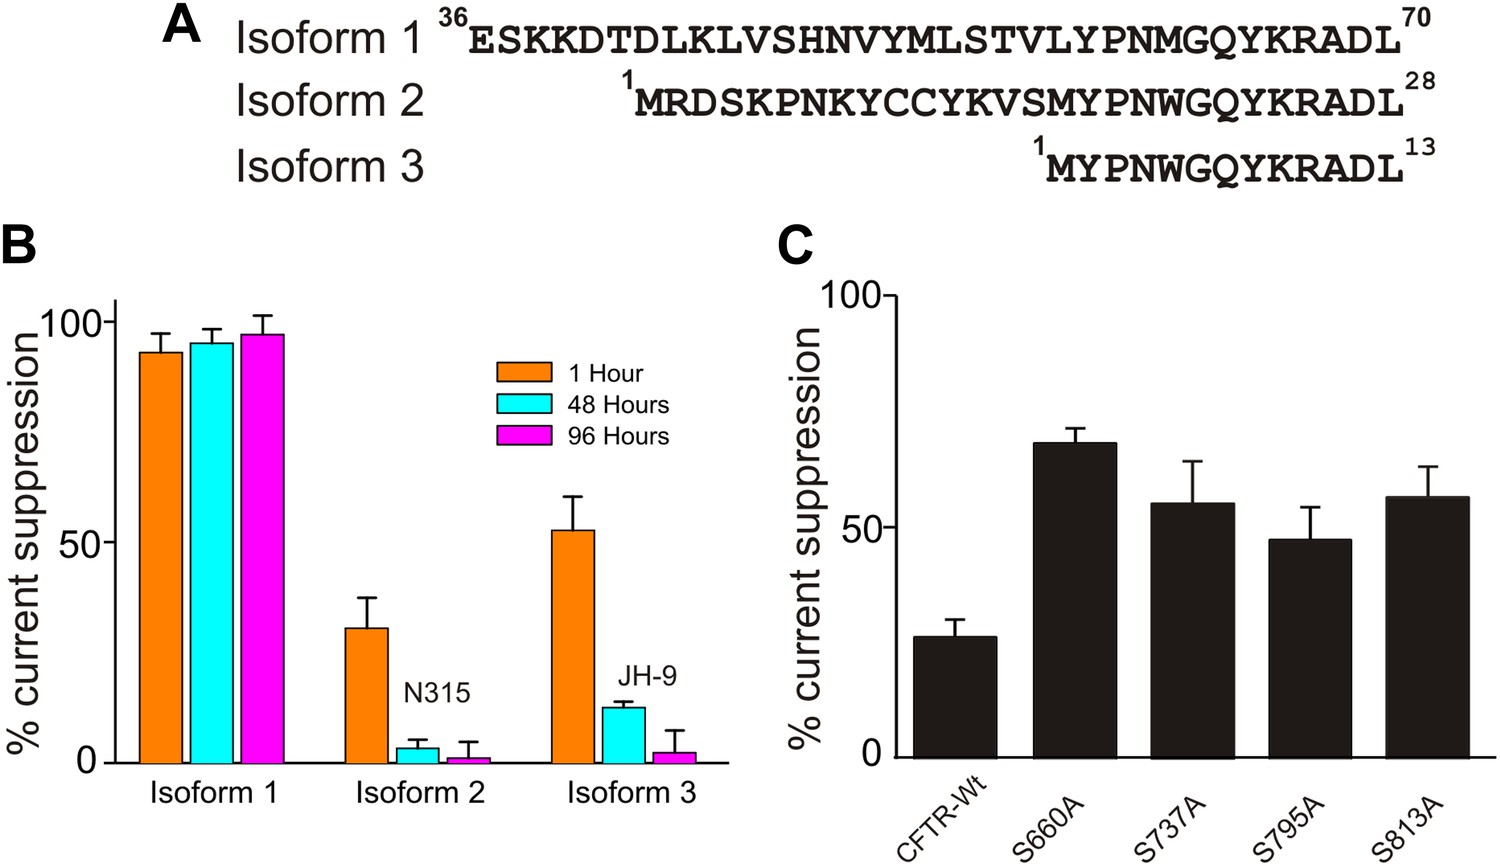
Effects of isoforms and mutations on SaSMase C suppression of CFTR current.
(A) N-terminal sequences of three SaSMase C isoforms. (B) Percentage of SaSMase C suppression of CFTR current by individual isoforms at 1, 48 and 96 hr after final purification of SMase C (mean ± s.e.m, n = 5), where the final concentration was 0.4 ng/µl for isoform 1 and 40 ng/µl for isoforms 2 and 3. (C) Percentage of SaSMase C suppression of wild-type and mutant CFTR currents activated by expressing cRNA encoding the PKA catalytic subunit (mean ± s.e.m, n = 7–10).
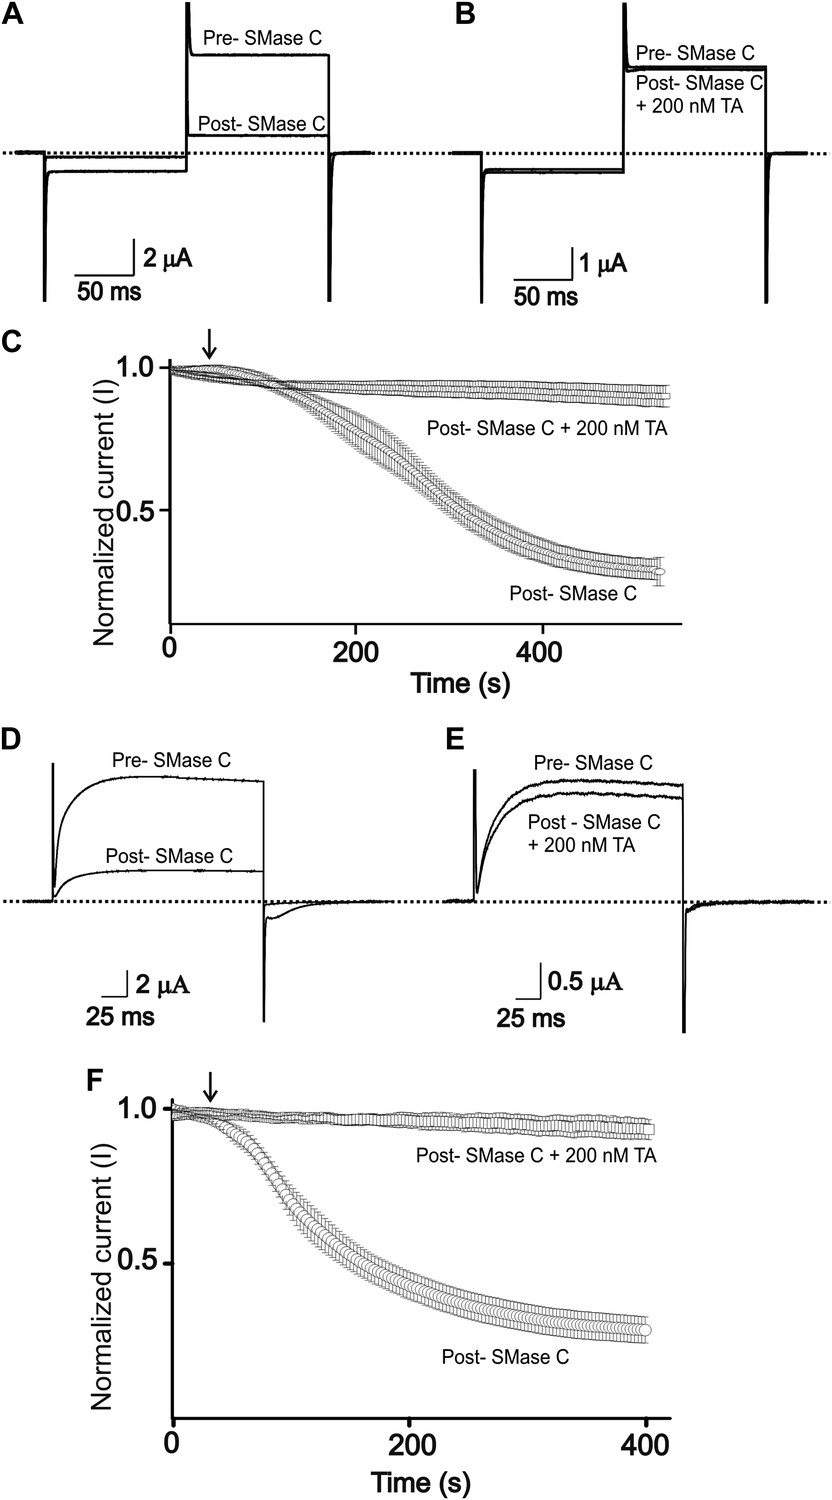
Figure 3

Tannic acid (TA) counteracts SaSMase C and SMase D suppression of CFTR current.
(A) Correlation plot of Z scores (raw scores minus the mean of the population, divided by the standard deviations of individual compounds) of individual compounds tested in two repeated screens; 27 compounds with higher Z scores are colored orange. (B) Percentage SaSMase C suppression of CFTR currents in the presence of 27 tested compounds, each at 10 µM. (C) Time course of normalized CFTR currents at 50 mV without or with 10 µM tannic acid (TA) present in the bath; arrow indicates addition of SaSMase C (0.6 ng/µl). (D) and (E) Time courses of normalized CFTR currents at 50 mV without and with 100 or 200 nM (D) or 300 nM (E) tannic acid present in the bath; arrow indicates addition of SaSMase C (D) and SMase D (E) (mean ± s.e.m, n = 3–5). (F) Apparent activities of SaSMase C (1 and 2) or SMase D (0.6 ng/μl) (3) plotted against the concentration of tannic acid, where the activities are expressed as half-time of the time course of sphingomyelin hydrolysis (1) or CFTR inhibition (2 and 3), which were obtained by the Amplex red assay (1) or by electrophysiological recordings (2 and 3). The half-time values were normalized to the corresponding ones obtained in the presence of relevant enzymes and the absence of tannic acid.
Figure 4
Tannic acid antagonizes suppression of CFTR and Kv1.3 currents by SMase C of B.anthracis (BaSMase C).
(A) and (B) Currents of an oocyte injected with cRNA encoding CFTR, which was activated as in Figure 1, before (pre) and after (post) addition of BaSMase C (0.6 ng/μl) without (A) and with (B) 200 nM TA present. (C) Time course of normalized CFTR currents at 50 mV without or with 200 nM TA present in the bath; arrow indicates addition of BaSMase C (mean ± s.e.m, n = 10). (D) and (E) Currents of an oocyte injected with cRNA encoding Kv1.3 before (pre) and after (post) addition of BaSMase C without (D) and with (E) 200 nM TA, elicited by stepping membrane voltage from the −80 mV holding potential to 20 mV and then back to −80 mV. (F) Time course of normalized Kv1.3 currents at 20 mV without or with 200 nM TA in the bath; arrow indicates addition of BaSMase C (mean ± s.e.m, n = 4).
Download links
A two-part list of links to download the article, or parts of the article, in various formats.
Downloads (link to download the article as PDF)
Open citations (links to open the citations from this article in various online reference manager services)
Cite this article (links to download the citations from this article in formats compatible with various reference manager tools)
Counteracting suppression of CFTR and voltage-gated K+ channels by a bacterial pathogenic factor with the natural product tannic acid
eLife 3:e03683.
https://doi.org/10.7554/eLife.03683


