Measurement of average decoding rates of the 61 sense codons in vivo
- Stony Brook University, United States
Figures
Figure 1
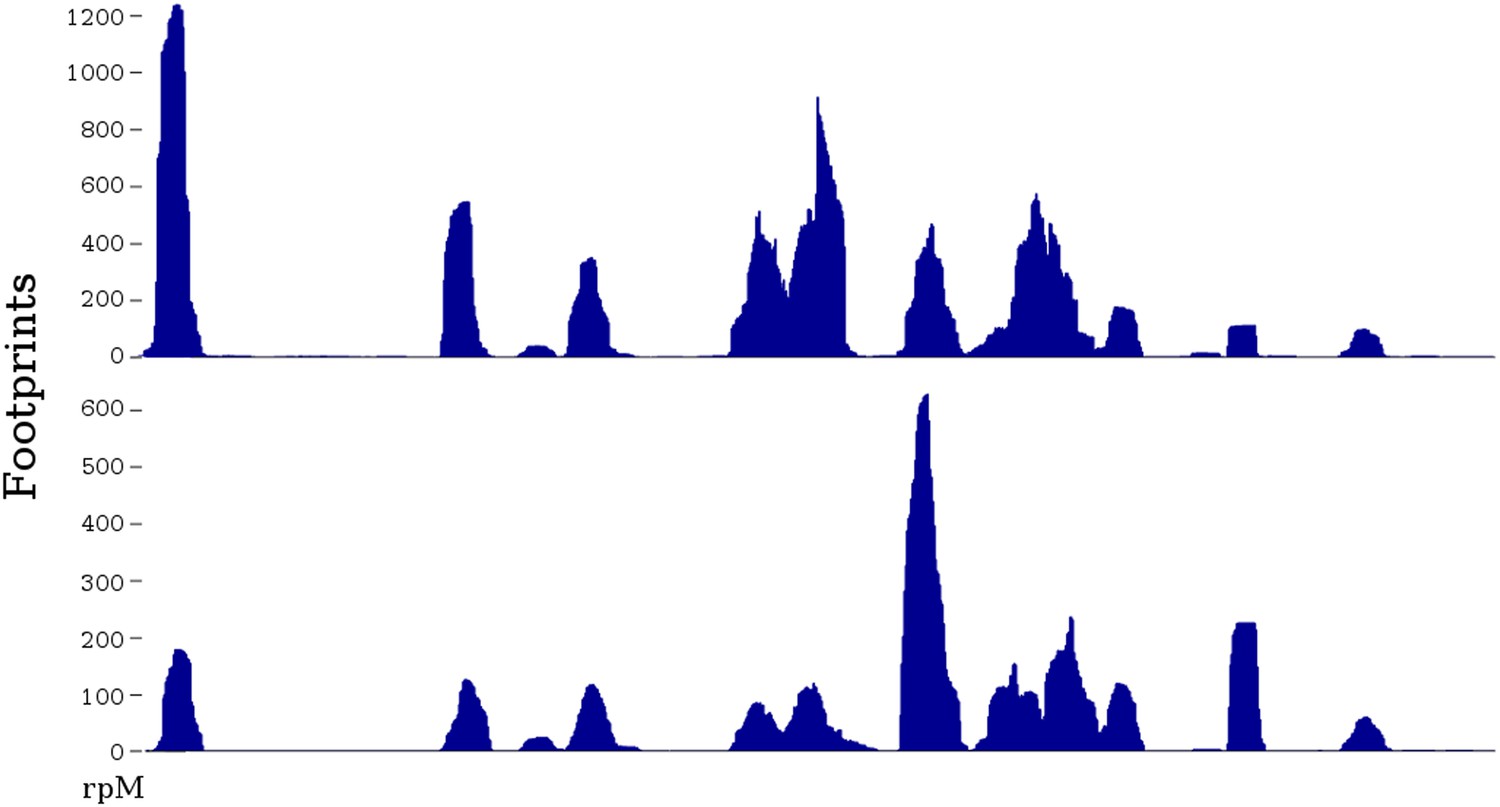
Two ribosome profiles of the TDH1 gene.
Top profile is from the data of Ingolia et al., 2009; bottom profile is from the SC-lys dataset (‘Materials and methods’). The first (leftmost) peak in the profiles is at the ATG start codon; it may differ in relative height because the SC-lys dataset was generated using flash-freezing.
Figure 2
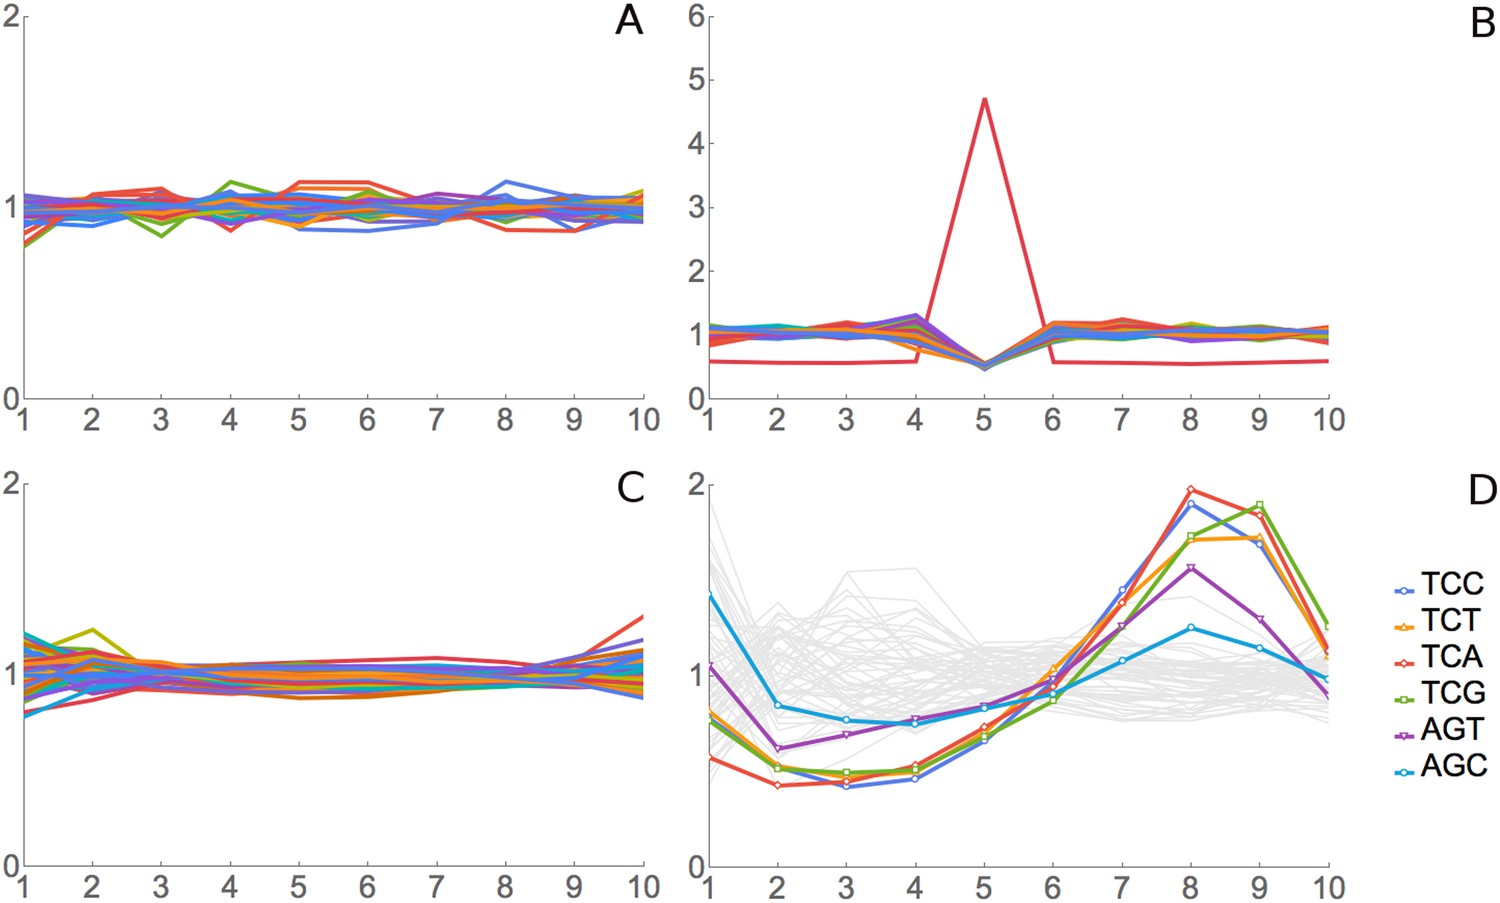
Validation for ribosome residence time analysis.
(A) Simulated data, negative control. Real footprint data from the SC-lys dataset were randomly assigned to codons, and RRT analysis was carried out. A flat line with an RRT value of 1 indicates no signal. (B) Simulated data, positive control. A dataset of 2 million simulated reads was generated but biased to give more reads over the codon AAA at position 6. (C) Real data, negative control. RNA-seq data from naked fragments of RNA 30 nucleotides long, processed as if for ribosome profiling, were analyzed. (D) Real data, positive control. Real ribosome footprinting data from Li et al. were analyzed (Li et al., 2012). In this experiment, E. coli were starved for serine. Note that the highest Ser peak is for TCA, which is the rarest Ser codon in E. coli, and the lowest Ser peak is for AGC, which is the most common Ser codon in E. coli. High values at position 9 as well as 8 may indicate that the A-site may be at position 8 in some fragments and position 9 in others.
Figure 3
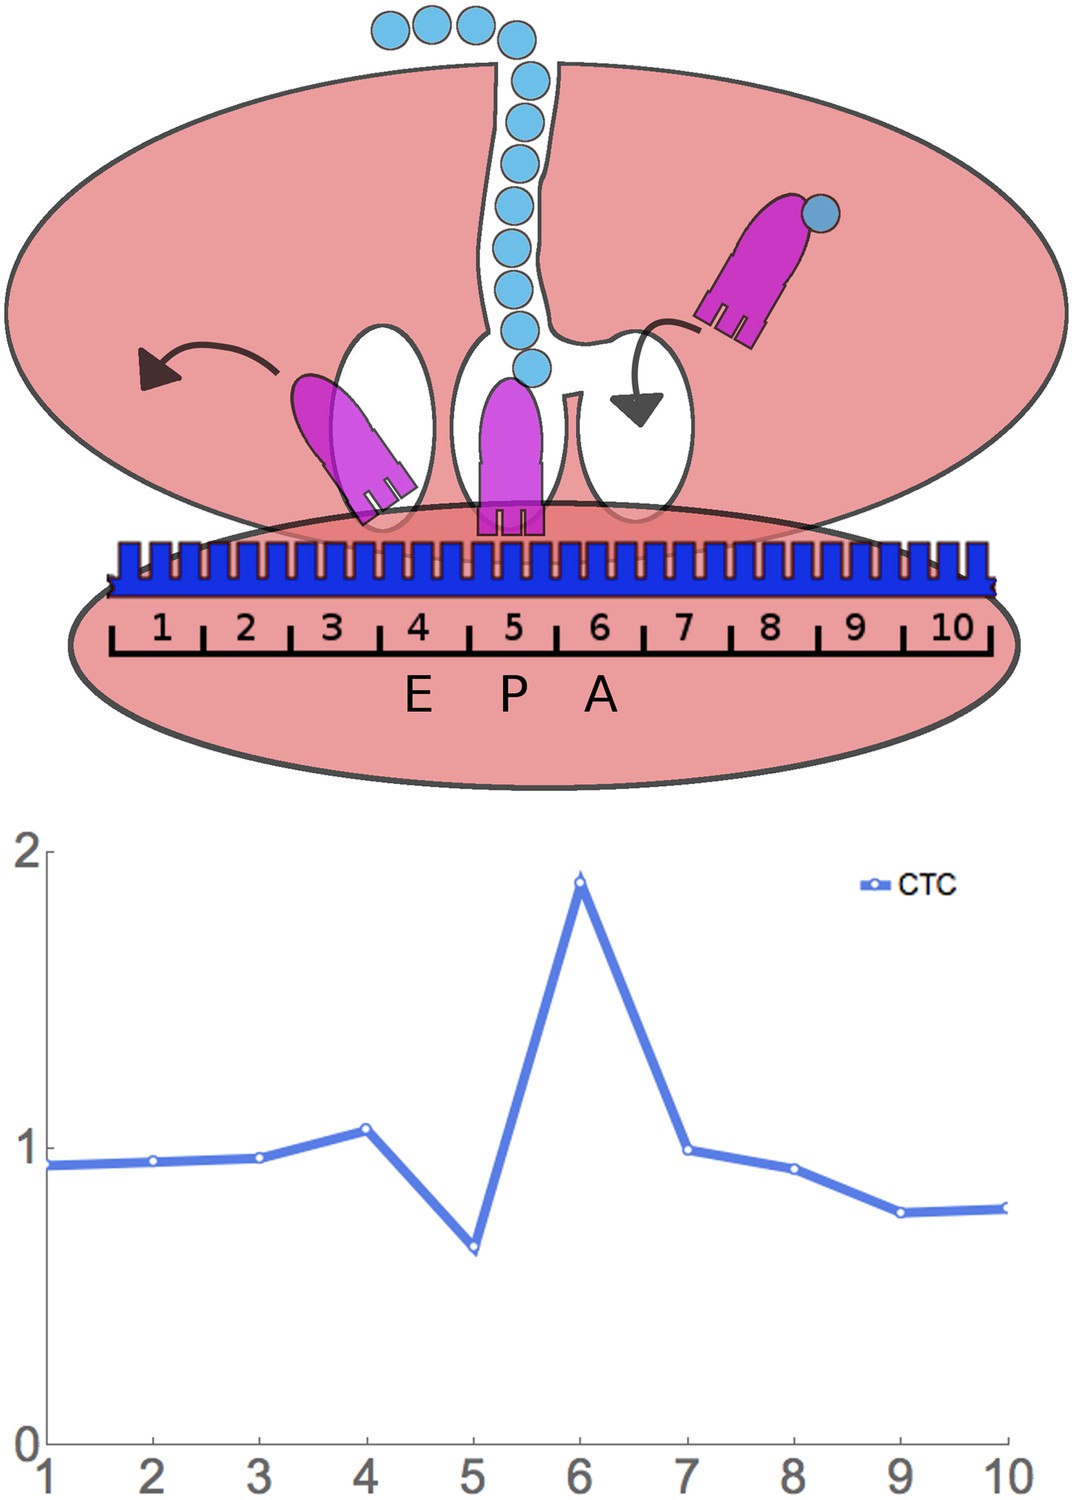
Principle of ribosome residence time analysis.
The ribosome protects a 30 nt ‘footprint’ of RNA centered around the A, P, and E sites (positions 6, 5, and 4). The rare Leu codon CTC has a high RRT at position 6, which is likely the A-site.
Figure 4
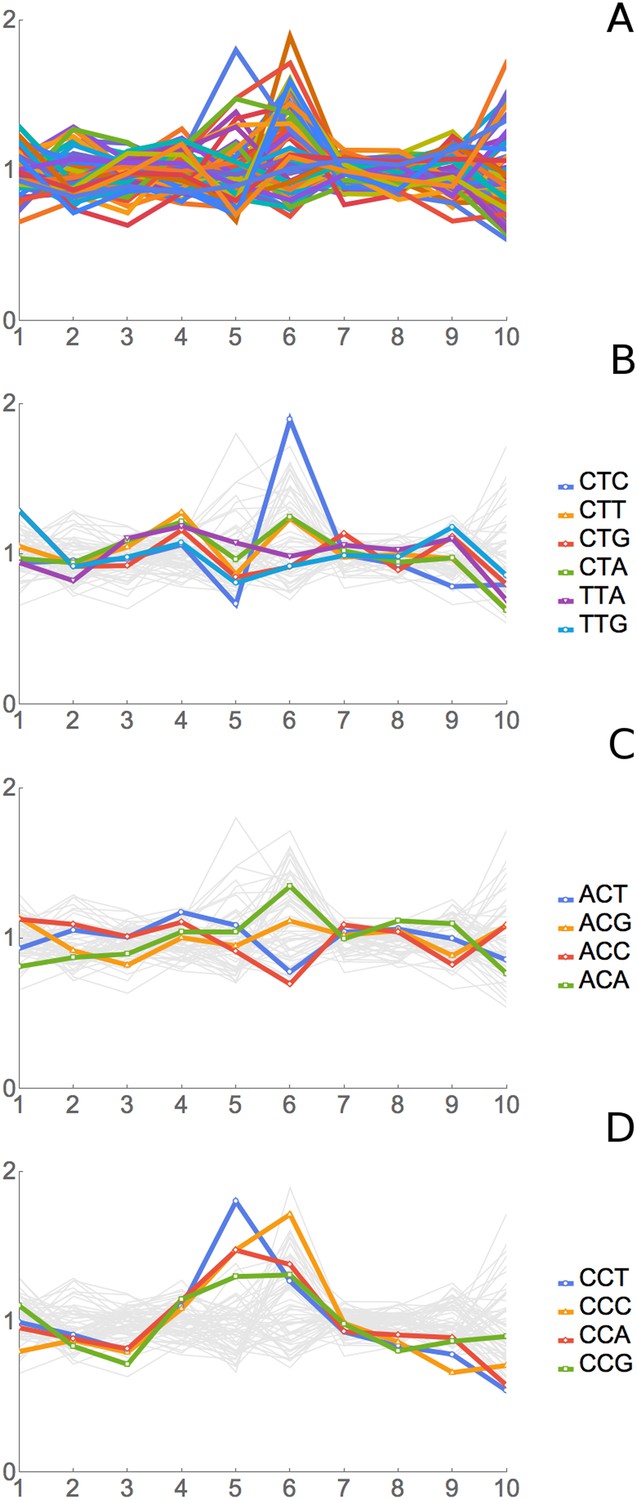
Results of Ribosome Residence Time analysis.
(A) The pattern of RRTs for all codons at all positions. Most peaks are at position 6, with some at position 5. (B) The RRTs for the six leucine codons. CTC has the highest RRT of any codon at position 6. (C) The RRTs for the four threonine codons. ACC has the lowest RRT of any codon at position 6. (D) The RRTs for the four proline codons. Proline has peaks at position 5, the P-site, as well as at position 6.
Figure 5

Correlation of ribosome residence times with codon properties.
(A) Correlation of RRT with codon usage. RRT is plotted against the frequency of each codon per 1000 codons. (B) Correlation of RRT with the GC content of each codon. The codons were divided into quartiles by RRT (Fastest–Slowest), and the GC content of those ∼15 codons is shown in a violin plot.
Figure 6
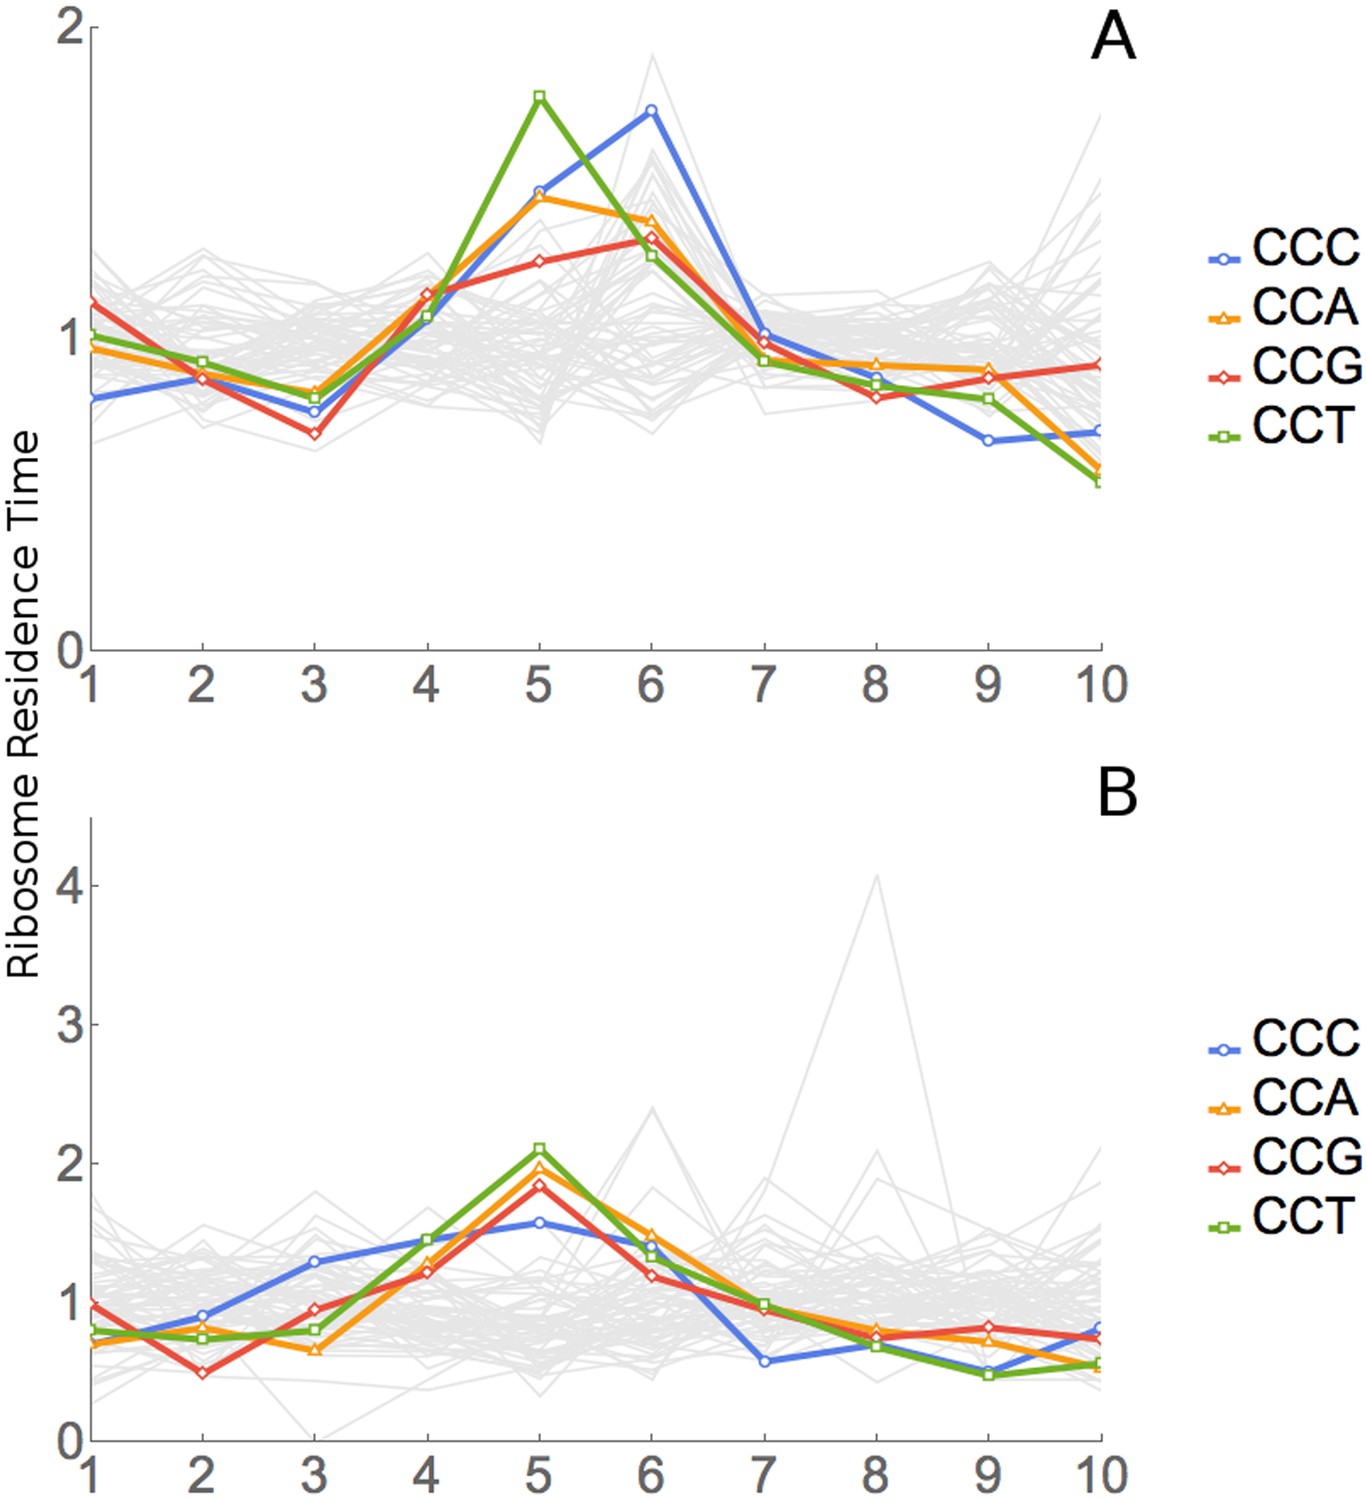
Analysis of ProPro dipeptides.
(A) RRT analysis of windows containing no ProPro dipeptides. (B) RRT analysis of windows containing ProPro dipeptides.
Figure 7
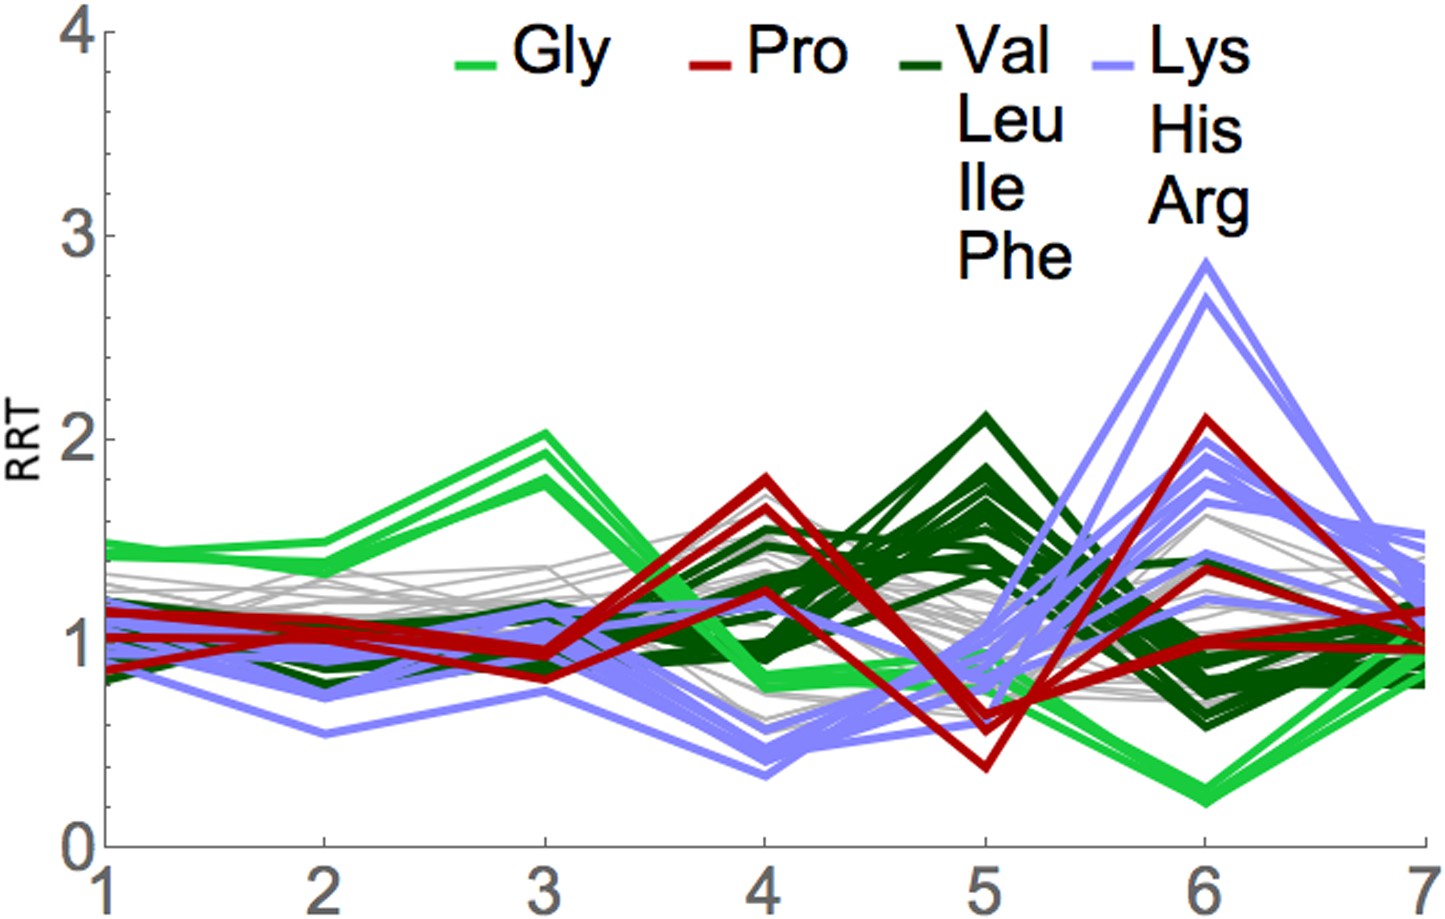
RRT analysis of short footprints from anisomycin treatment.
The short, seven-codon footprints from anisomycin treatment (dataset 1b) from Lareau et al. (2014) were analyzed for RRT. All 61 sense codons are shown; codons for selected amino acids are color-coded by amino acid. Position along the footprint is shown on the x-axis.
Figure 8
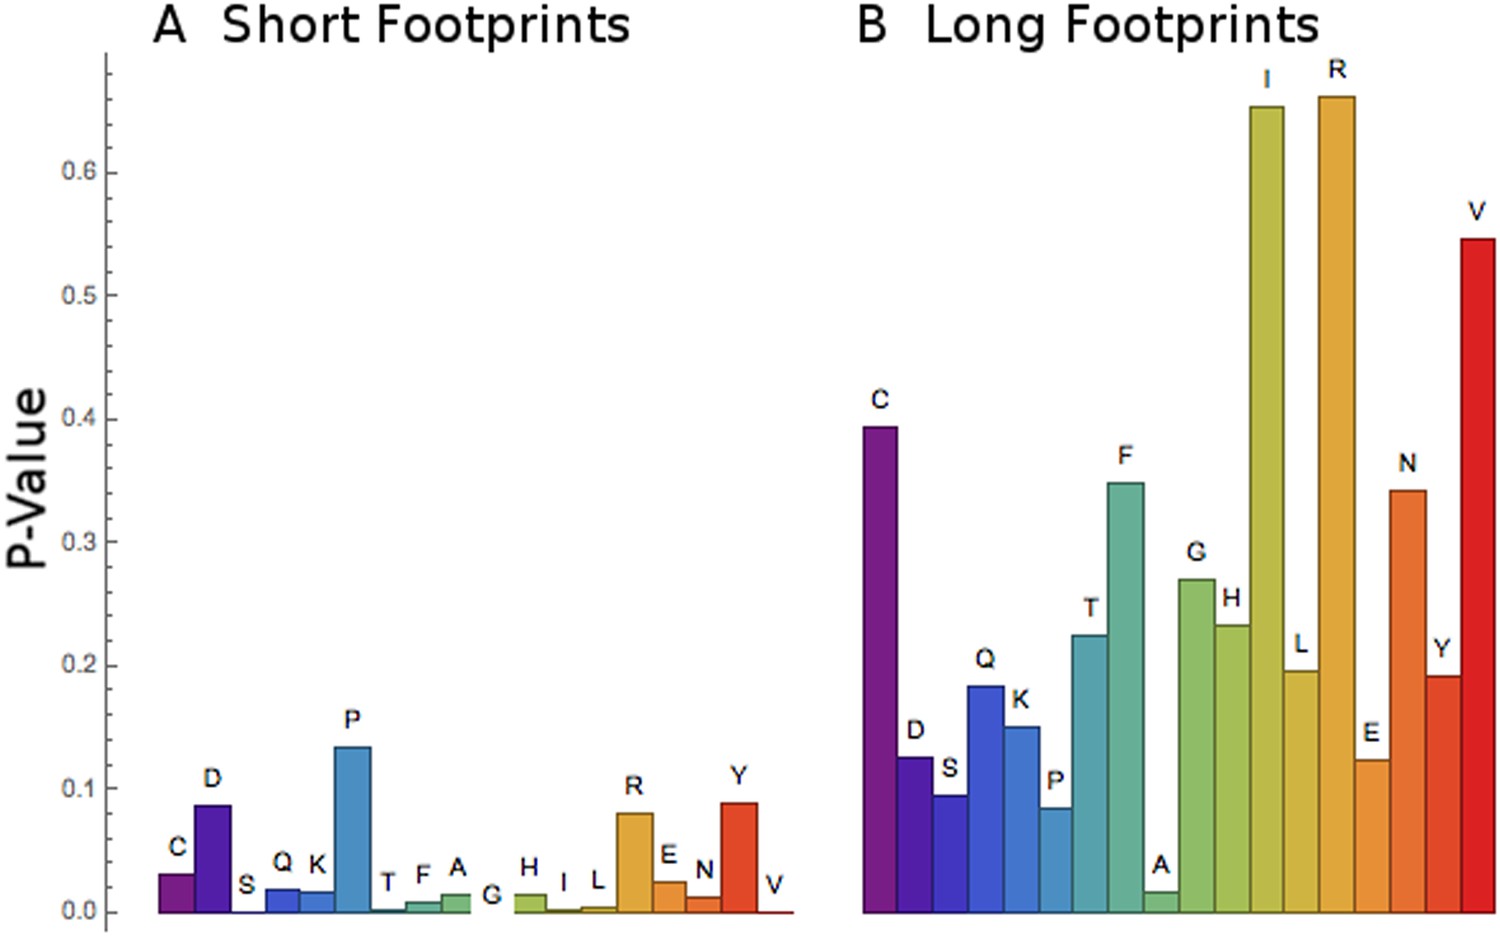
Short footprints are amino acid-specific; long footprints are codon-specific.
For the set of codons corresponding to each amino acid (x-axis), a test was done to see if all the codons behaved similarly or not. For the short footprints (left, panel A), p-values (y-axis) are generally small, showing that each codon for a particular amino acid behaves similarly (‘Materials and methods’). For the long footprints (right, panel B), p-values are generally large, showing that the codons for each particular amino acid behave differently (‘Materials and methods’).
Tables
Table 1
Top ten RRTs at position 8 in E. coli starved for serine
| Codon | AA | Usage | RRT |
|---|---|---|---|
| TCA | Ser | 8.1 | 1.98 |
| TCC | Ser | 9.0 | 1.90 |
| TCG | Ser | 8.8 | 1.73 |
| TCT | Ser | 8.7 | 1.71 |
| AGT | Ser | 9.4 | 1.57 |
| ATA | Ile | 5.5 | 1.42 |
| AGC | Ser | 16.0 | 1.25 |
| ATT | Ile | 29.7 | 1.18 |
| CCT | Pro | 7.2 | 1.15 |
| CCA | Pro | 8.4 | 1.13 |
Table 2
Ribosome residence time at position 6 (A) and 5 (B)
| A | ||||
|---|---|---|---|---|
| Codon | AA | Usage | RRT | p value |
| CTC | Leu | 5.4 | 1.89 | *0.0001 |
| CCC | Pro | 6.8 | 1.71 | *0.0001 |
| GGG | Gly | 6 | 1.61 | *0.0001 |
| AGG | Arg | 9.2 | 1.59 | *0.0001 |
| ATA | Ile | 17.8 | 1.57 | *0.0001 |
| GGA | Gly | 10.9 | 1.56 | *0.0001 |
| TGG | Trp | 10.4 | 1.53 | *0.0001 |
| GTG | Val | 10.8 | 1.52 | *0.0001 |
| CGC | Arg | 2.6 | 1.45 | *0.0001 |
| CGA | Arg | 3 | 1.45 | *0.0008 |
| CGG | Arg | 1.7 | 1.44 | *0.0010 |
| TCG | Ser | 8.6 | 1.43 | *0.0001 |
| CCA | Pro | 18.3 | 1.38 | *0.0001 |
| ACA | Thr | 17.8 | 1.35 | *0.0001 |
| CCG | Pro | 5.3 | 1.31 | *0.0001 |
| GTA | Val | 11.8 | 1.31 | *0.0001 |
| GCA | Ala | 16.2 | 1.28 | *0.0001 |
| CCT | Pro | 13.5 | 1.27 | *0.0001 |
| TCA | Ser | 18.7 | 1.26 | *0.0001 |
| TAC | Tyr | 14.8 | 1.25 | *0.0001 |
| TAT | Tyr | 18.8 | 1.25 | *0.0001 |
| GAG | Glu | 19.2 | 1.25 | *0.0001 |
| CTA | Leu | 13.4 | 1.25 | *0.0001 |
| CTT | Leu | 12.3 | 1.24 | *0.0001 |
| TGC | Cys | 4.8 | 1.23 | *0.0001 |
| GGC | Gly | 9.8 | 1.22 | *0.0001 |
| CAG | Gln | 12.1 | 1.15 | *0.0002 |
| ACG | Thr | 8 | 1.12 | 0.0069 |
| AGT | Ser | 14.2 | 1.10 | 0.0060 |
| AGC | Ser | 9.8 | 1.09 | 0.0213 |
| CAC | His | 7.8 | 1.08 | 0.0098 |
| TTT | Phe | 26.1 | 1.05 | 0.0529 |
| GAA | Glu | 45.6 | 1.04 | 0.0538 |
| AGA | Arg | 21.3 | 1.01 | 0.3014 |
| TTC | Phe | 18.4 | 1.00 | 0.4955 |
| GCG | Ala | 6.2 | 0.99 | 0.4650 |
| TCC | Ser | 14.2 | 0.99 | 0.3341 |
| TTA | Leu | 26.2 | 0.99 | 0.3166 |
| TCC | Ser | 23.5 | 0.98 | 0.2249 |
| CAT | His | 13.6 | 0.93 | 0.0188 |
| GGT | Gly | 23.9 | 0.93 | *0.0003 |
| ATG | Met | 20.9 | 0.92 | 0.0027 |
| ATT | Ile | 30.1 | 0.92 | *0.0005 |
| TTG | Leu | 27.2 | 0.92 | *0.0001 |
| CTG | Leu | 10.5 | 0.92 | 0.0139 |
| AAT | Asn | 35.7 | 0.88 | *0.0001 |
| AAA | Lys | 41.9 | 0.88 | *0.0003 |
| CGT | Arg | 6.4 | 0.87 | *0.0002 |
| CAA | Gln | 27.3 | 0.87 | *0.0001 |
| GCC | Ala | 12.6 | 0.86 | *0.0001 |
| GAC | Asp | 20.2 | 0.85 | *0.0001 |
| TGT | Cys | 8.1 | 0.81 | *0.0001 |
| GCT | Ala | 21.2 | 0.81 | *0.0001 |
| ATC | Ile | 17.2 | 0.80 | *0.0001 |
| ACT | Thr | 20.3 | 0.78 | *0.0001 |
| GAT | Asp | 37.6 | 0.76 | *0.0001 |
| AAC | Asn | 24.8 | 0.76 | *0.0001 |
| GTT | Val | 22.1 | 0.75 | *0.0001 |
| GTC | Val | 11.8 | 0.75 | *0.0001 |
| AAG | Lys | 30.8 | 0.74 | *0.0001 |
| ACC | Thr | 12.7 | 0.70 | *0.0001 |
| B | ||||
|---|---|---|---|---|
| Codon | AA | Usage | RRT | p value |
| CCT | Pro | 13.5 | 1.80 | *0.0001 |
| CCC | Pro | 6.8 | 1.48 | *0.0001 |
| CCA | Pro | 18.3 | 1.48 | *0.0001 |
| AAT | Asn | 35.7 | 1.39 | *0.0001 |
| CGC | Arg | 1.7 | 1.34 | 0.0070 |
| CCG | Pro | 5.3 | 1.30 | *0.0001 |
-
A. Usage of each codon per 1000 codons and the Ribosome Residence Time (RRT) at position 6 (the A-site of the ribosome). The p-value for a difference between the calculated RRT value and an RRT value of 1 is shown. p-values less than or equal to 0.001 are marked with an asterisk. B. As for A, but for the six highest values at position 5 (the P-site).
Table 3
Correlations between experiments
| YPD1 | -His | YPD2 | Ingo. | |
|---|---|---|---|---|
| -Lys | 0.80 | 0.35 | 0.76 | 0.22 |
| YPD1 | 0.53 | 0.96 | 0.55 | |
| -His | 0.58 | 0.37 | ||
| YPD2 | 0.53 |
-
The pairwise Spearman correlations between the RRT values at position 6 are shown for five independent experiments, where the experiments are named YPD1, YPD2, SC-Lys, SC-His, and Ingolia. The SC-Lys and SC-His experiments were carried out by JG, and used flash-freezing as the initial method for stopping ribosome movement. The YPD1 and YPD2 experiments were carried out by YC (Cai and Futcher, 2013), and used addition of ice and cycloheximide to the culture as the initial method for stopping ribosome movement. The ‘Ingo’ experiment was that carried out by Ingolia et al. (2009). Further details are given in ‘Materials and methods’. Complete RRT values for each position in each experiment are provided in Supplementary file 1.
Table 4
Top 10 RRTs at positions 3 through 6 of the anisomycin-generated short footprints
| Pos 3 | Pos 4 | Pos 5 | Pos 6 |
|---|---|---|---|
| Gly GGG 2.64 | Pro CCC 2.36 | Leu TTA 2.75 | Arg CGA 3.72 |
| Gly GGC 2.52 | Pro CCA 2.34 | Leu CTC 2.73 | Arg CGG 3.50 |
| Gly GGT 2.36 | Met ATG 2.25 | Val GTA 2.43 | Pro CCG 2.74 |
| Gly GGA 2.32 | Pro CCT 2.17 | Leu CTA 2.36 | Lys AAA 2.59 |
| Asp GAC 1.80 | Ala GCC 2.13 | Leu TTG 2.29 | Lys AAG 2.49 |
| Ala GCC 1.79 | Phe TTC 2.03 | Val GTG 2.21 | Arg CGC 2.46 |
| Ala GCA 1.70 | Ala GCA 2.01 | Leu CTT 2.16 | Arg CGT 2.34 |
| Ala GCT 1.65 | Ala GCT 1.98 | Val GTC 2.12 | Arg AGG 2.32 |
| Ala GCG 1.59 | Tyr TAC 1.98 | Val GTT 2.11 | Arg AGA 2.21 |
| Blu GAG 1.58 | Ser TCC 1.97 | Ile ATA 2.03 | Asp GAT 2.12 |
Additional files
-
Supplementary file 1
Complete Ribosome Residence Times for each codon at each of the 10 possible codon positions in a 30 nt (or, for Ingolia data, 24 nt) ribosome footprint. Each Excel spreadsheet is based on data from an independent biological experiment. Four of these experiments were done during the course of this work, two experiments by JG and two experiments by YC, while the fifth experiment was published by Ingolia et al. (2009). (A) Ribosome Residence Time analysis for all codons from the SC-lys expt. (B) Ribosome Residence Time analysis from the YPD1(WT) expt. (C) Ribosome Residence Time analysis from the YPD2 (whi3) expt. (D) Ribosome Residence Time analysis from the SC-his expt. (E) Ribosome Residence Time analysis from the Ingolia expt.
- https://doi.org/10.7554/eLife.03735.015
-
Supplementary file 2
Complete Ribosome Residence Times for each codon at each of the 7 possible codon positions in a 21 nt ribosome footprint. Each Table is based on one of the three anisomycin datasets of Lareau et al. (2014). (A) RRT for short footprints; aniso2 dataset. (B) RRT for short footprints; aniso1B dataset. (C) RRT for short footprints; aniso1A dataset.
- https://doi.org/10.7554/eLife.03735.016
-
Source code 1
Source code 1 is a plain text file containing stage 1 of the Perl code for Ribosome Residence Time analysis.
- https://doi.org/10.7554/eLife.03735.017
-
Source code 2
Source code 2 is a plain text file containing stage 2 of the Perl code for Ribosome Residence Time analysis.
- https://doi.org/10.7554/eLife.03735.018
Download links
A two-part list of links to download the article, or parts of the article, in various formats.
Downloads (link to download the article as PDF)
Open citations (links to open the citations from this article in various online reference manager services)
Cite this article (links to download the citations from this article in formats compatible with various reference manager tools)
Measurement of average decoding rates of the 61 sense codons in vivo
eLife 3:e03735.
https://doi.org/10.7554/eLife.03735


