How IGF-1 activates its receptor
- Johns Hopkins University School of Medicine, United States
- University of the Sciences, United States
- DE Shaw Research, United States
- Johns Hopkins University, United States
- Columbia University, United States
Figures
Figure 1 with 3 supplements
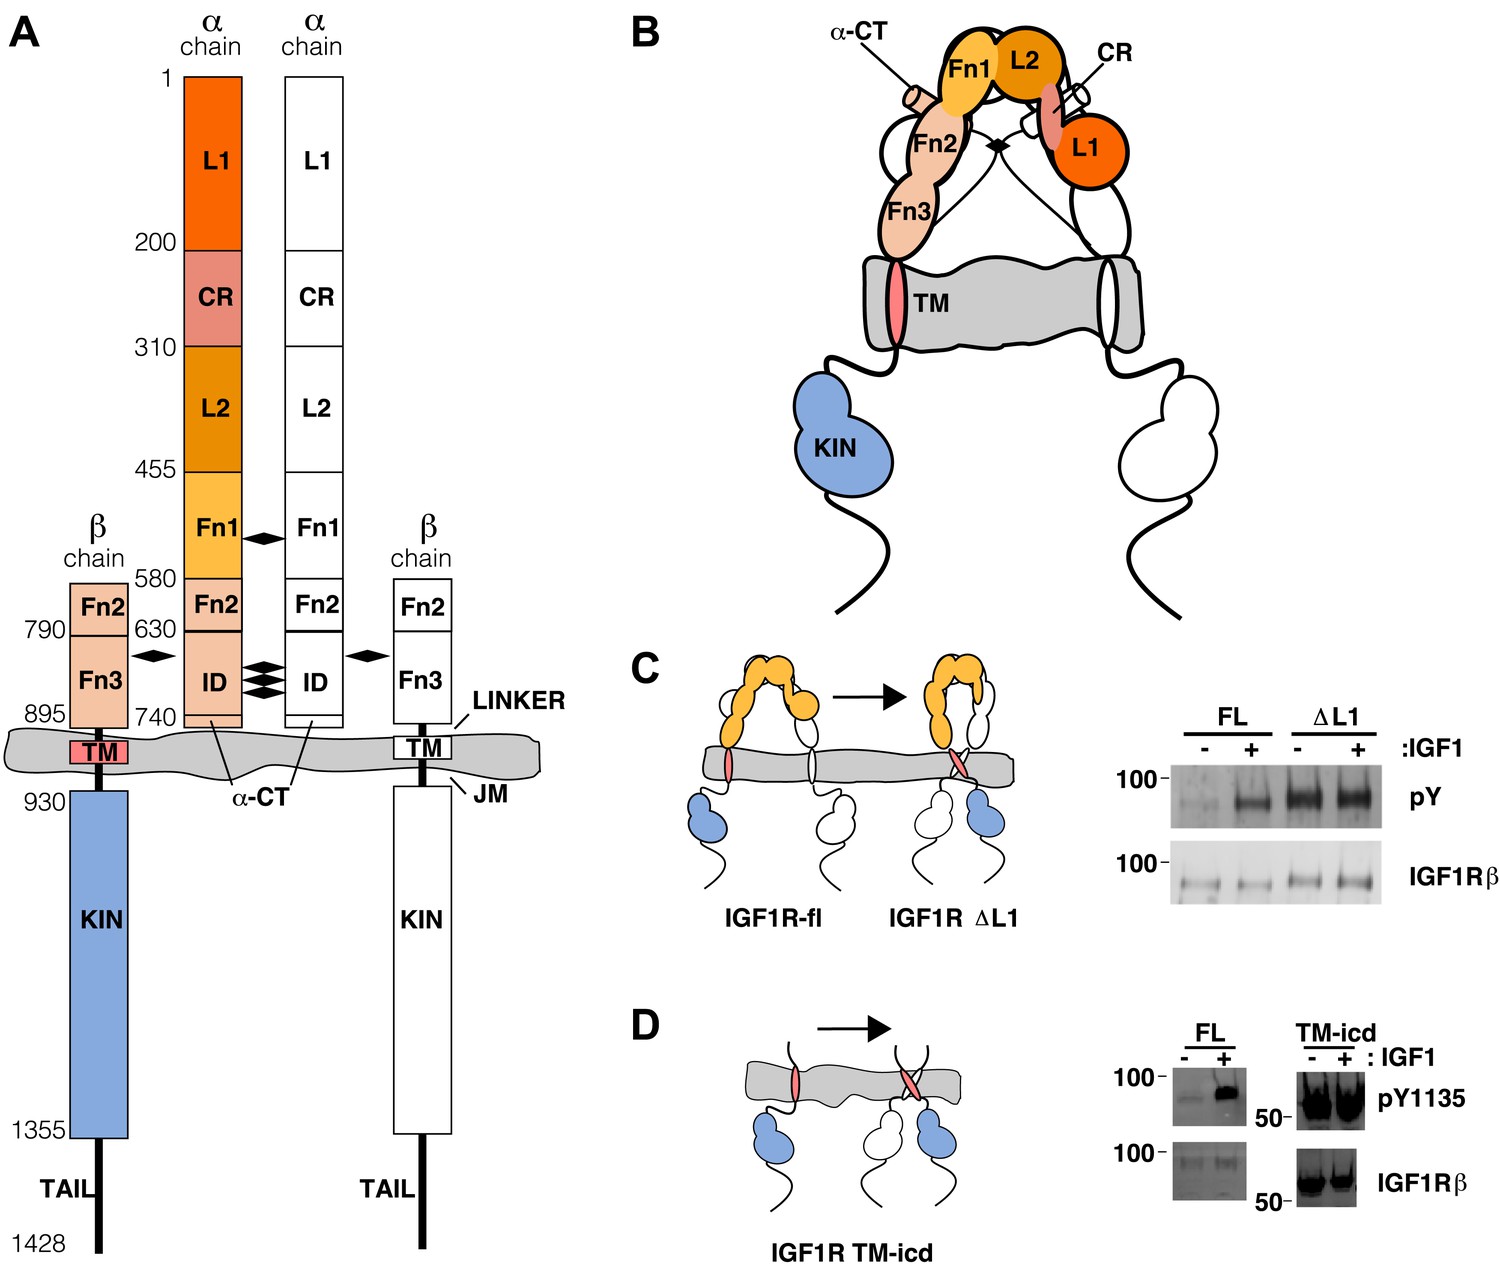
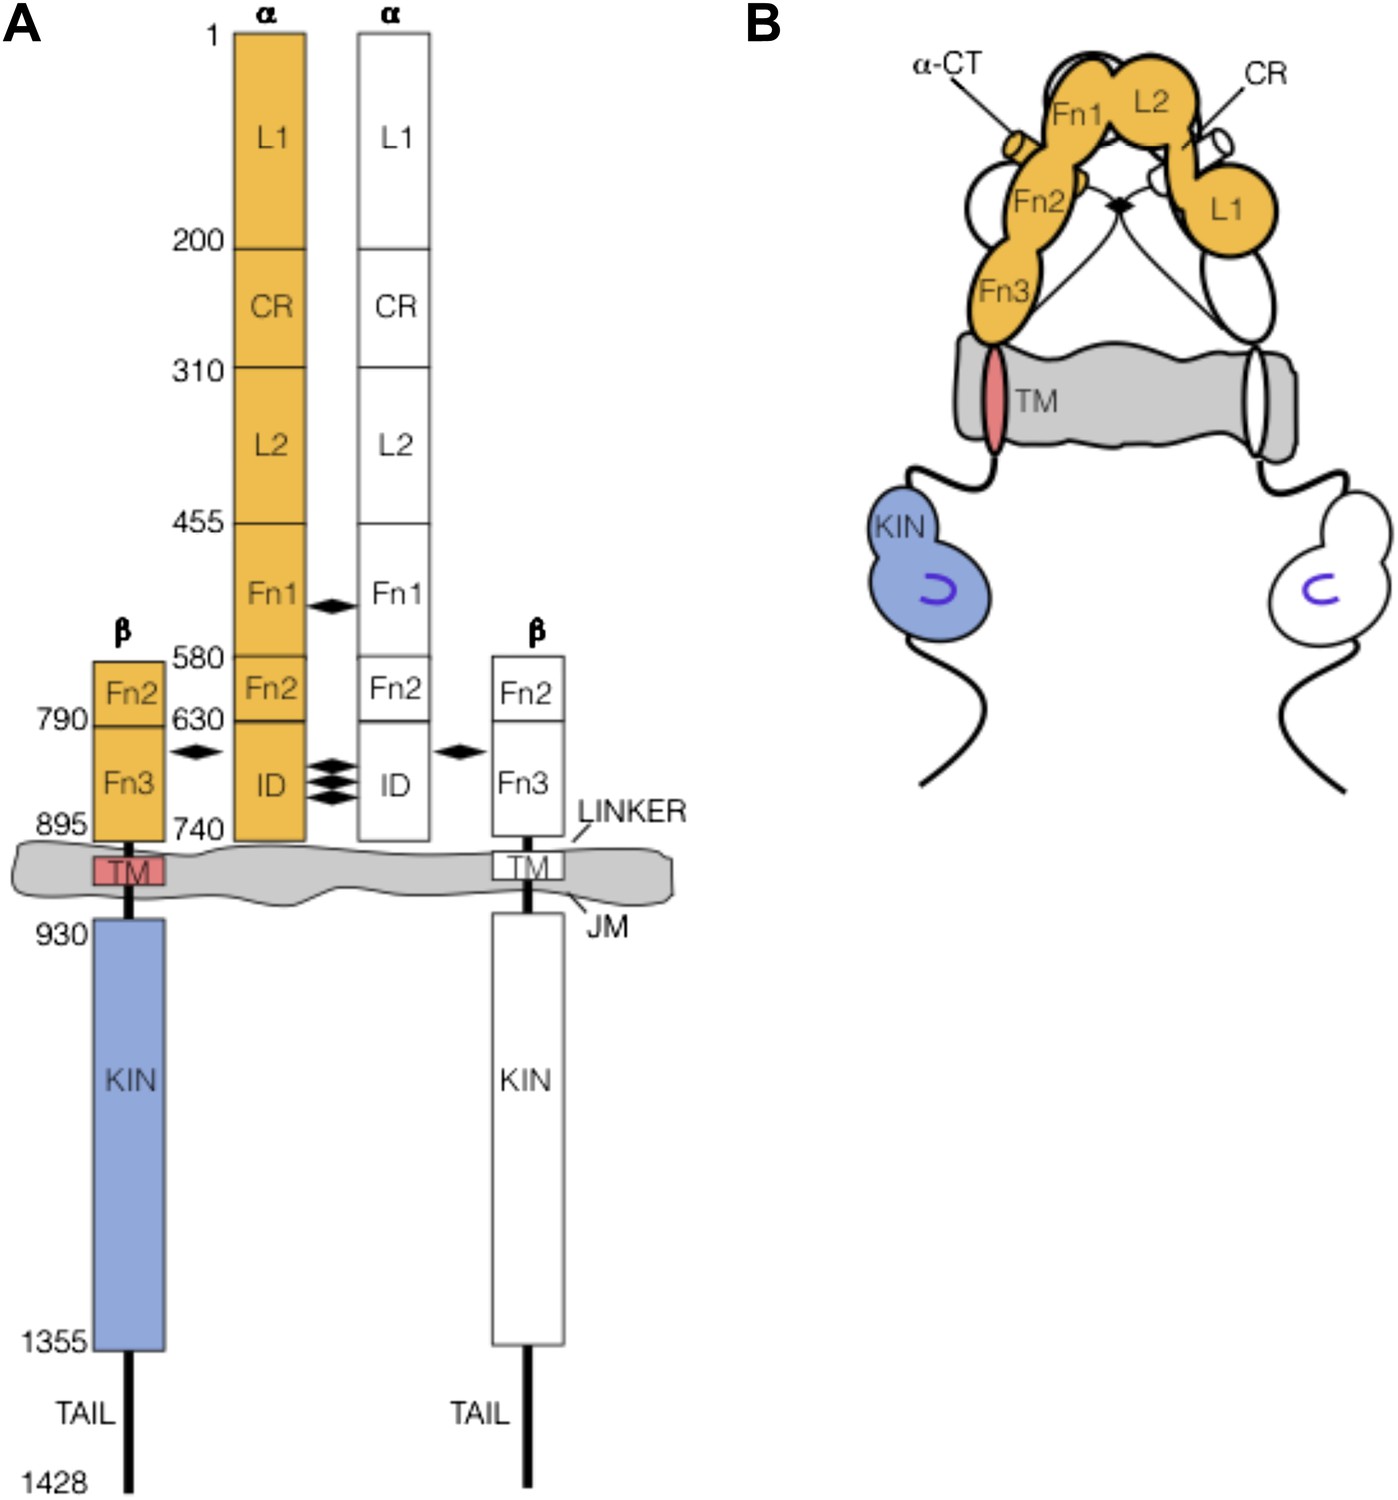
The extracellular domain of IGF1R autoinhibits IGF1R activity.
(A, B) Schematic and cartoon representations of IGF1R. Numbering refers to human IGF1R excluding the signal sequence. Disulfide bonds are indicated by black diamonds. One αβ subunit is shown in outline and the other in color. (C) Cartoon of IGF1R full-length (IGF1R-fl) or an IGF1R fragment lacking the L1 domain (IGF1R ΔL1) (left). HEK293 cells expressing either IGF1R-fl (FL) or IGF1R ΔL1 (ΔL1) were incubated with or without IGF1. IGF1R proteins were immunoprecipitated from normalized cell lysates and levels of autophosphorylation or IGF1R expression detected by Western blot with anti-phosphotyrosine (pY) or anti-IGF1Rβ antibodies (right). Molecular weight standards indicated to the left of each panel (D). Diagram of IGF1R variant lacking the ECD (IGF1R TM-icd) (left). Western blots probed with anti-pY1135, which recognizes a phosphotyrosine on the activation loop of the IGF1R kinase domain, and anti-IGF1Rβ of normalized lysates from cells expressing IGF1R-fl (FL) or IGF1R TM-icd (TM-icd), in the presence and absence of IGF1 (right). All panels are from the same blot. See also supplemental figures.
Figure 1—figure supplement 1
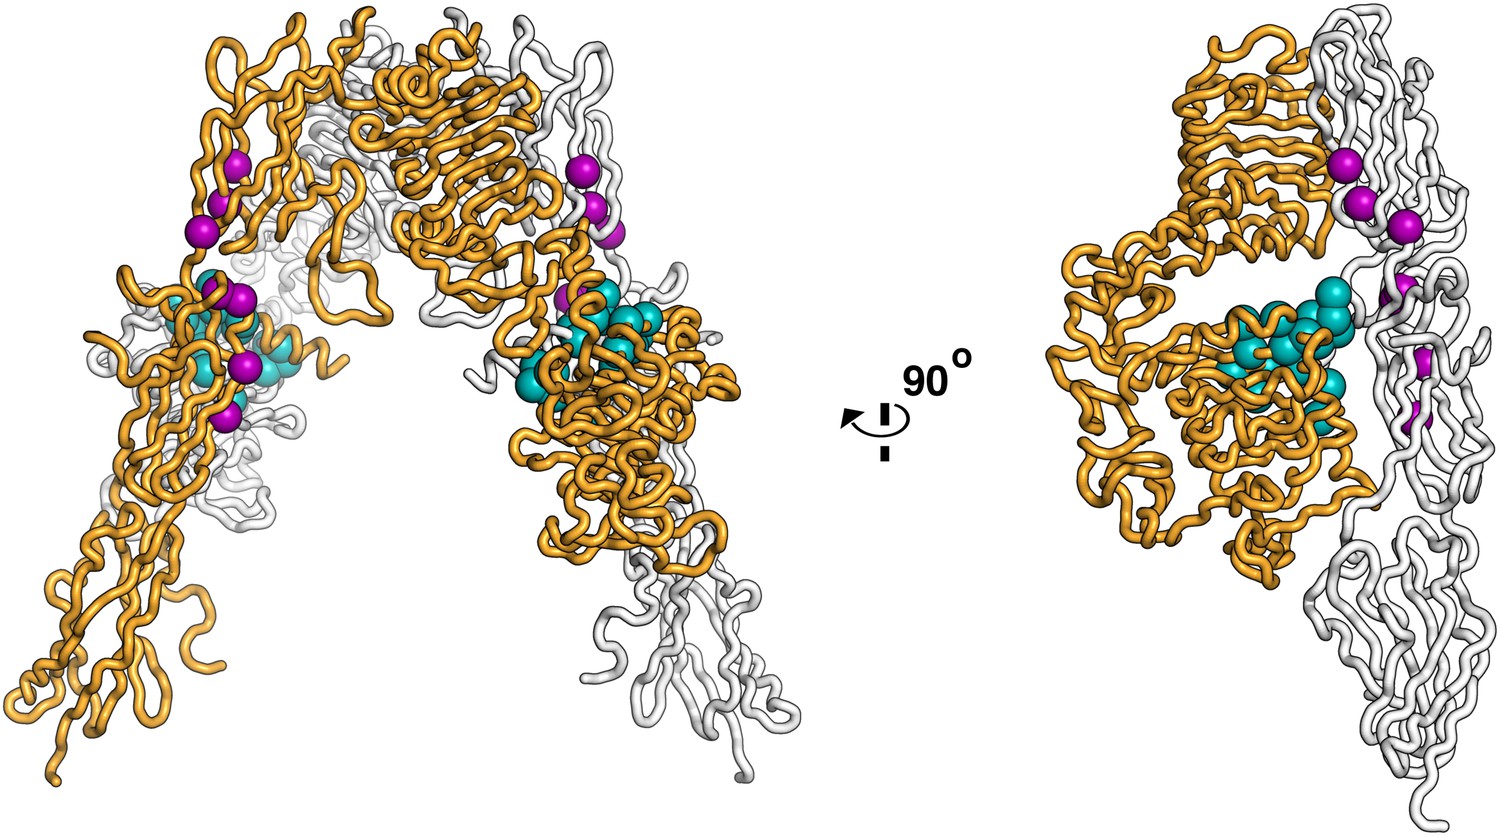
Residues on IR important for ligand binding.
Worm diagram of the unliganded IR ECD with one αβ subunit colored white and the other orange. Residues implicated in forming the Site 1 binding surface are shown as cyan spheres and residues implicated in forming the Site 2 binding surface are shown in purple spheres (Mynarcik et al., 1996; Whittaker et al., 2001; Whittaker and Whittaker, 2005; Whittaker et al., 2008).
Figure 1—figure supplement 2
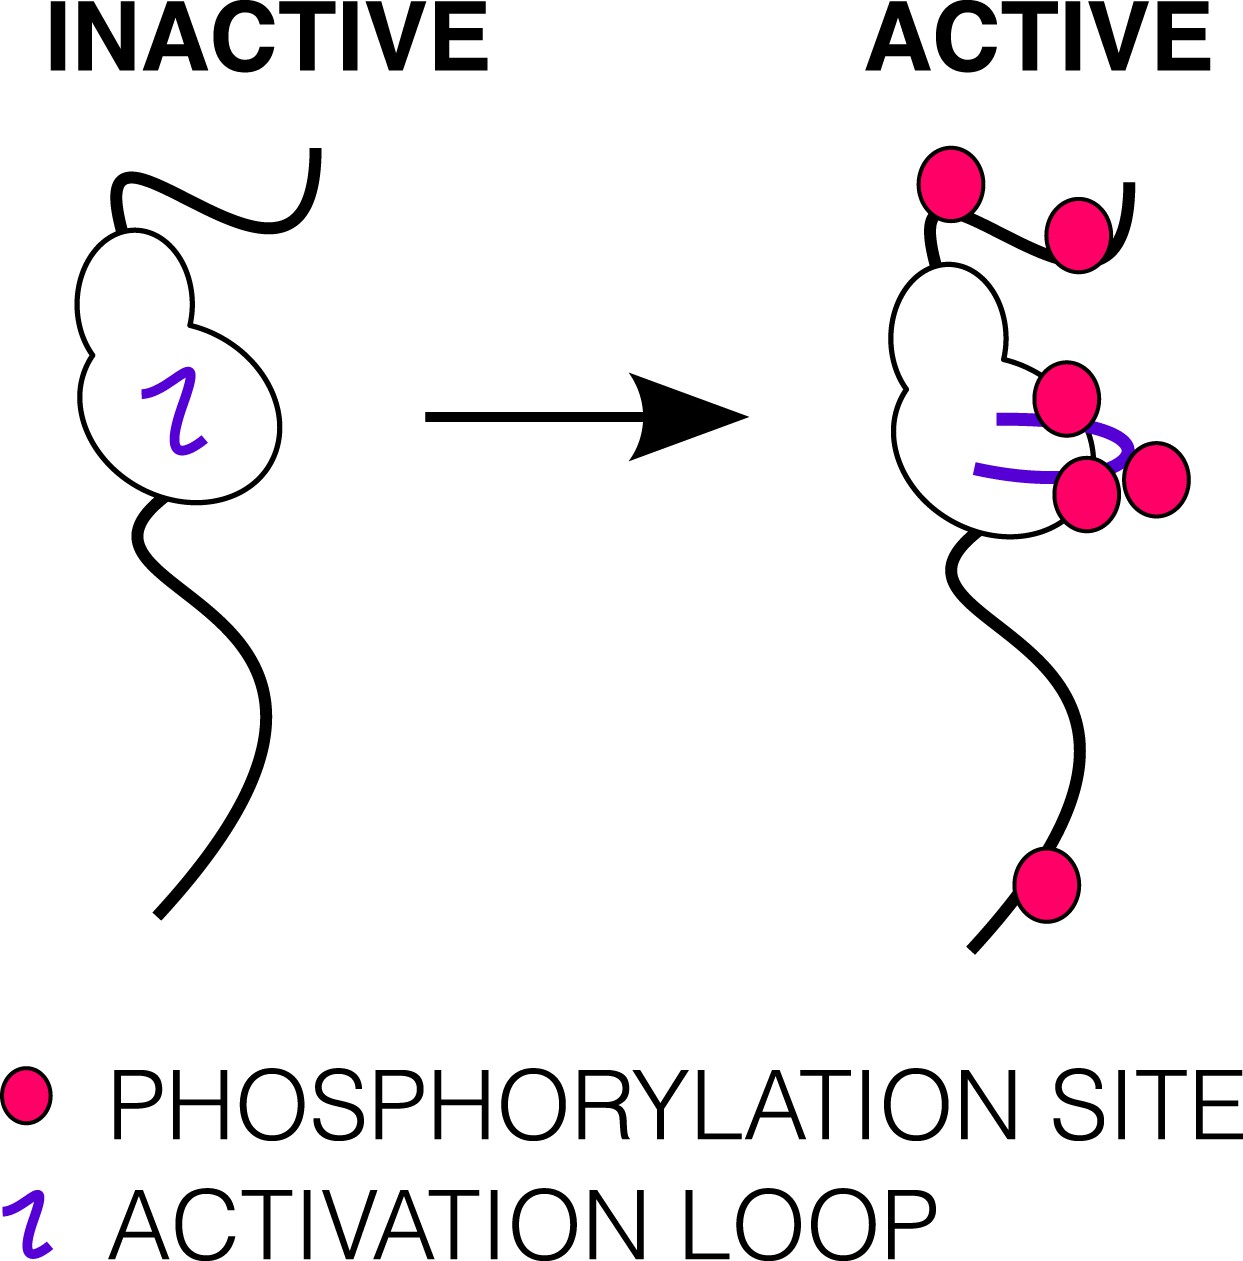
Phosphorylation of the ICD.
Cartoon of IGF1R-icd in the inactive or active, phosphorylated conformations. The activation loop is indicated by a purple line and phosphorylation sites as pink circles.
Figure 1—figure supplement 3
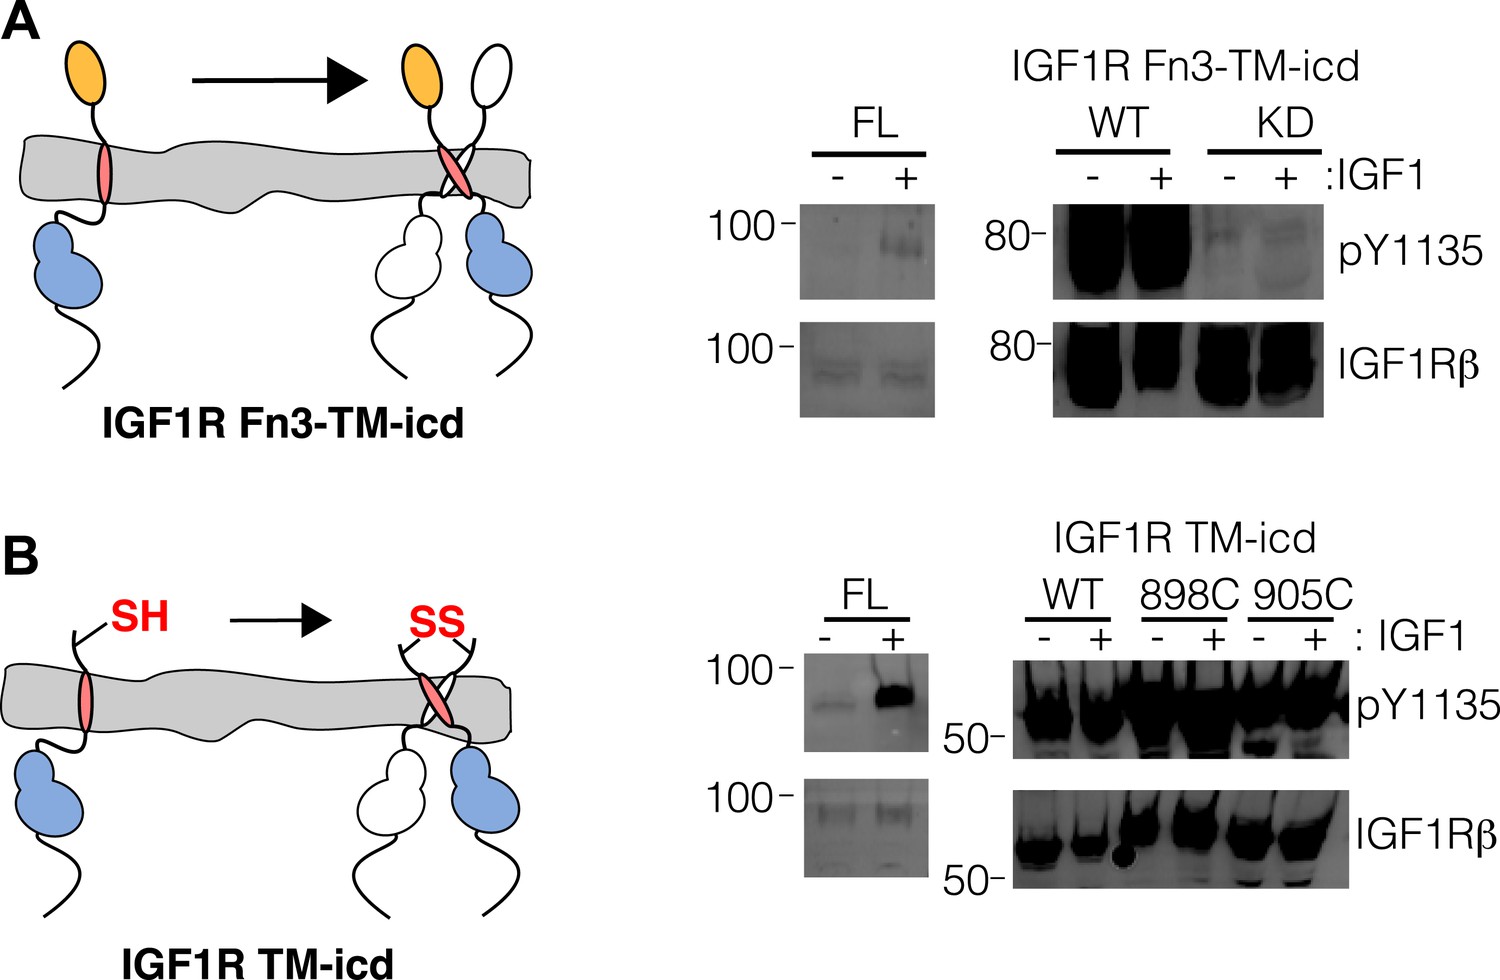
Activity assay of IGF1R TM-icd.
(A) Cartoon of IGF1R Fn3-TM-icd used in the cell-based assay (left). Western blots of normalized cell lysates of HEK293 cells expressing IGF1R-fl (FL), wild-type IGF1R Fn3-TM-icd (WT), or an IGF1R Fn3-TM-icd variant with a kinase inactivating point mutation (KD) probed with either anti-pY1135 or anti-IGF1Rβ antibodies (right). All panels are from the same blot and the molecular weight standards are indicated to the left. (B) Cartoon of IGF1R TM-icd protein bearing cysteine substitutions used in cell-based activity assays (left). The position of the cysteine is indicated. HEK293 cells expressing either IGF1R-fl or wild-type and cysteine substituted IGF1R TM-icd fragments (WT, 898C or 905C) were incubated with or without IGF1. Levels of autophosphorylation from normalized cell lysates were detected by Western blot with anti-pY1135 and anti-IGF1Rβ antibodies (right). All panels are from the same blot and the molecular weight standards are indicated to the left.
Figure 2
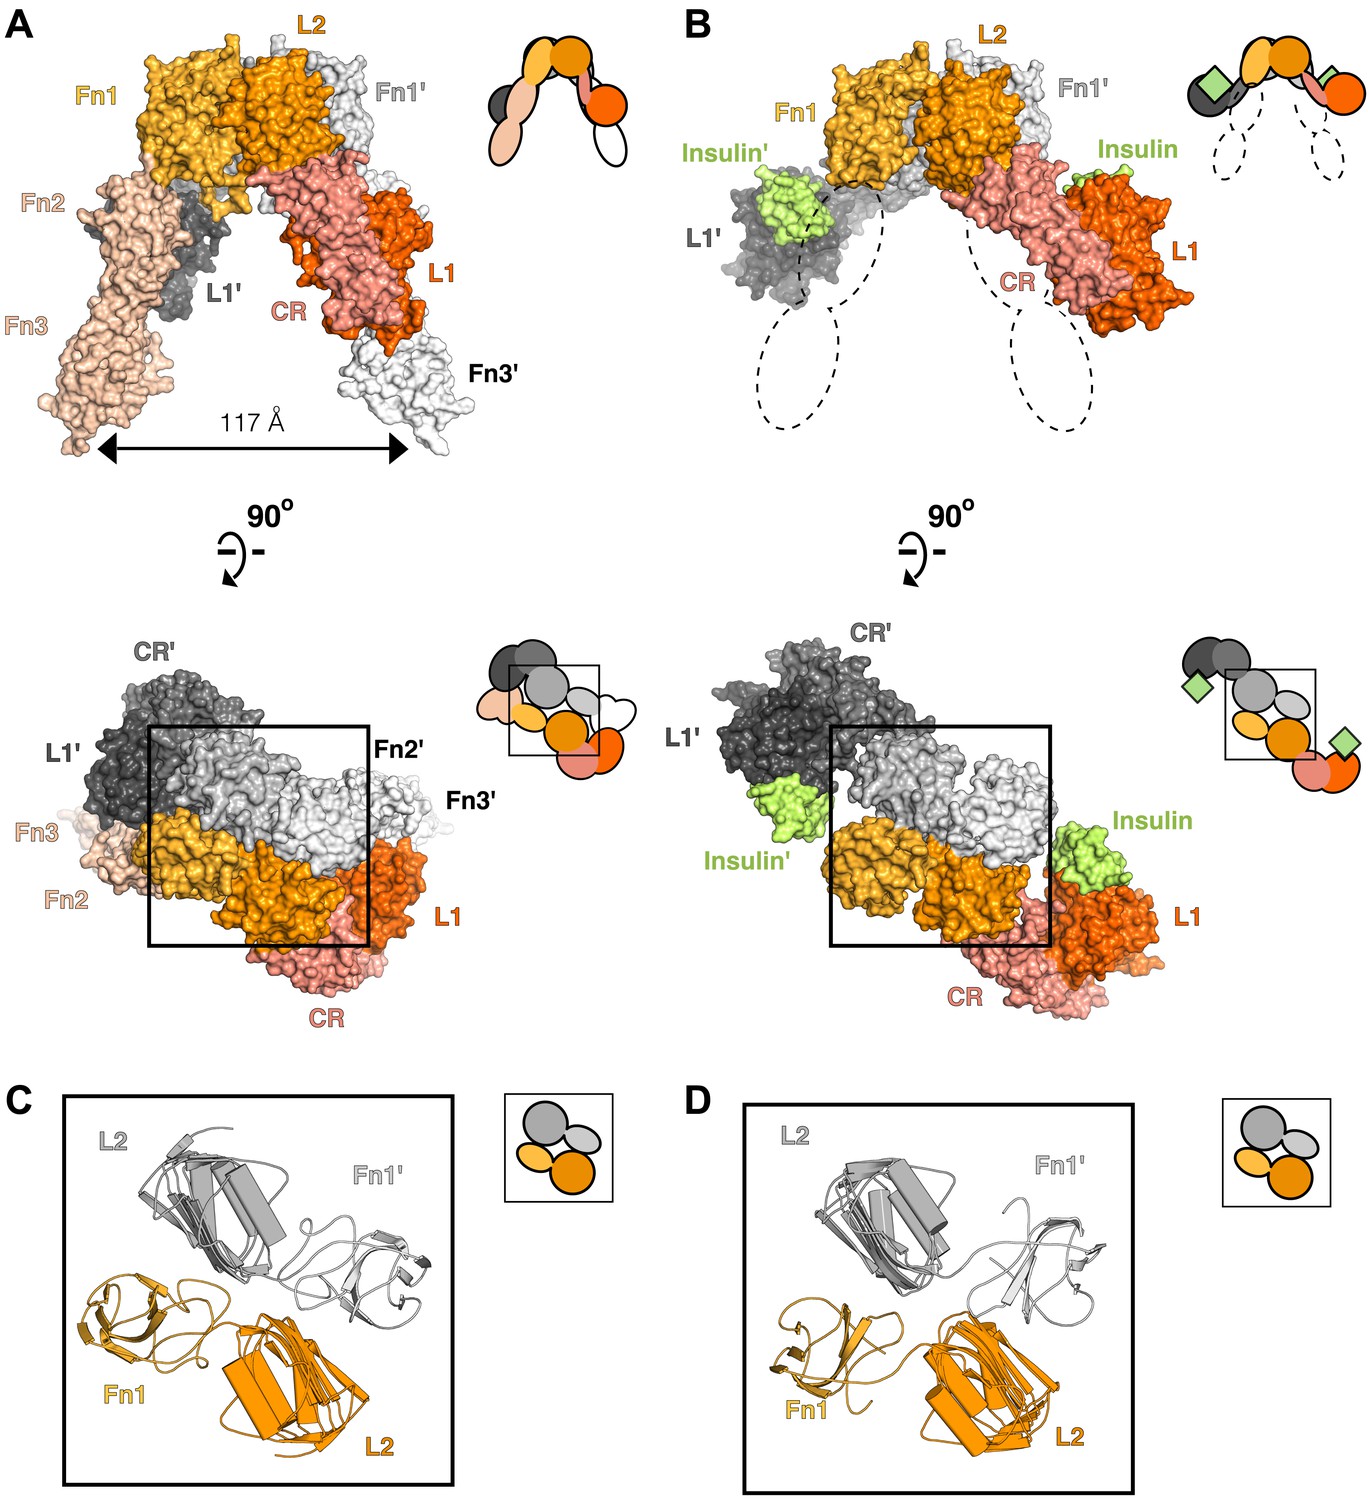
Conserved IR ECD dimer interaction.
Surface representations of (A) the unliganded IR ECD dimer (PDB 3LOH; Smith et al., 2010) and (B) the IR ECD fragment bound to Insulin (PDB 3W14; Menting et al., 2013). Domains of one αβ subunit are colored in shades of orange, the other in shades of gray, and Insulin in light green. N-terminal domains are in darker shades. The conserved L2-Fn1:L2'-Fn1' interface is marked by a black box. Ribbon diagrams of these domain pairs are shown for the unliganded (C) and liganded (D) IR ECD dimer. A cartoon of domains shown are included at the upper right of each structure. Dashed lines represent the missing Fn2-3 domain tandems.
Figure 3
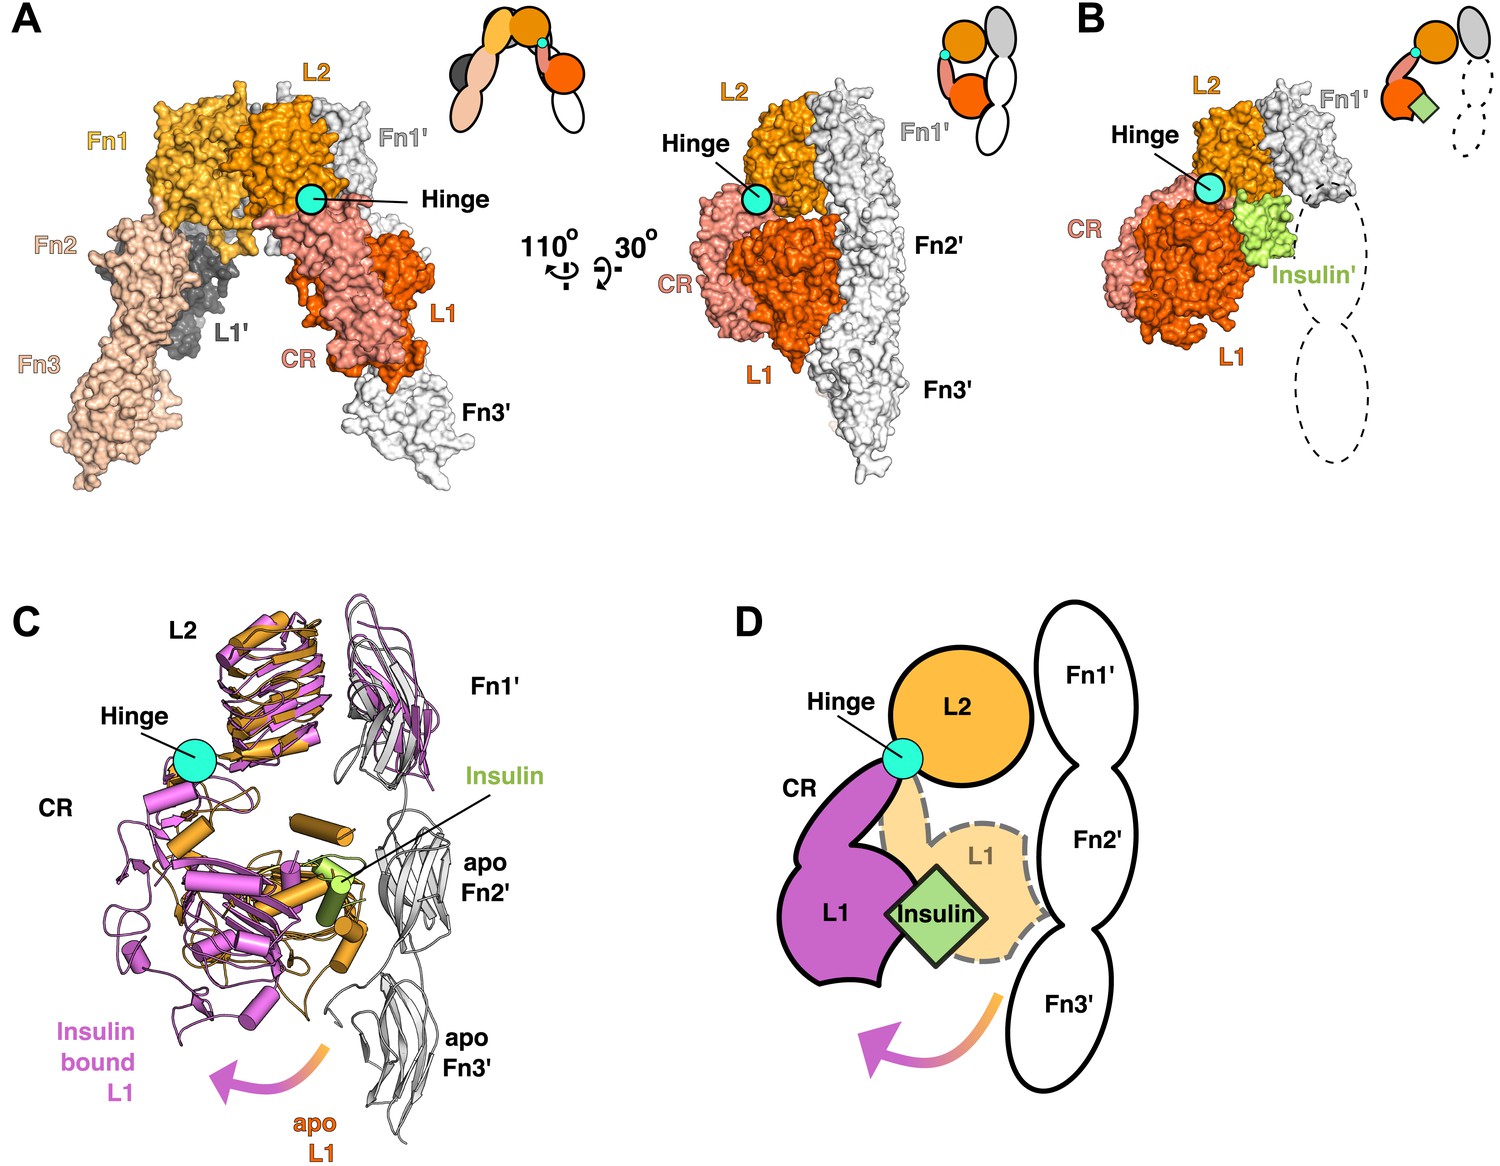
Ligand-induced conformational change in the IR ECD.
(A) Surface representation of the unliganded IR ECD (PDB 3LOH; Smith et al., 2010) oriented to show the L1:Fn2'-3' interface. The hinge between CR and L2 is indicated by a cyan circle. Cartoons of domains shown are to the upper right of each structure. (B) Surface representation of ligand-bound IR ECD fragment (PDB 3W14; Menting et al., 2013) in the same orientation as in A. The missing Fn2-3 domains are indicated by dashed lines. (C) Superposition of the ligand-bound IR structure (purple ribbon) onto the unliganded structure (orange and white ribbon) using the L2-Fn1 domain pairs. Insulin is displayed in light green. An arrow shows the direction of the relative movement of unsuperposed L1-CR domains about a hinge (cyan circle) between the CR and L2 domains. Complementary halves of each receptor subunit were omitted for clarity. (D) A cartoon showing the movement of the L1-CR domain tandems.
Figure 4 with 5 supplements
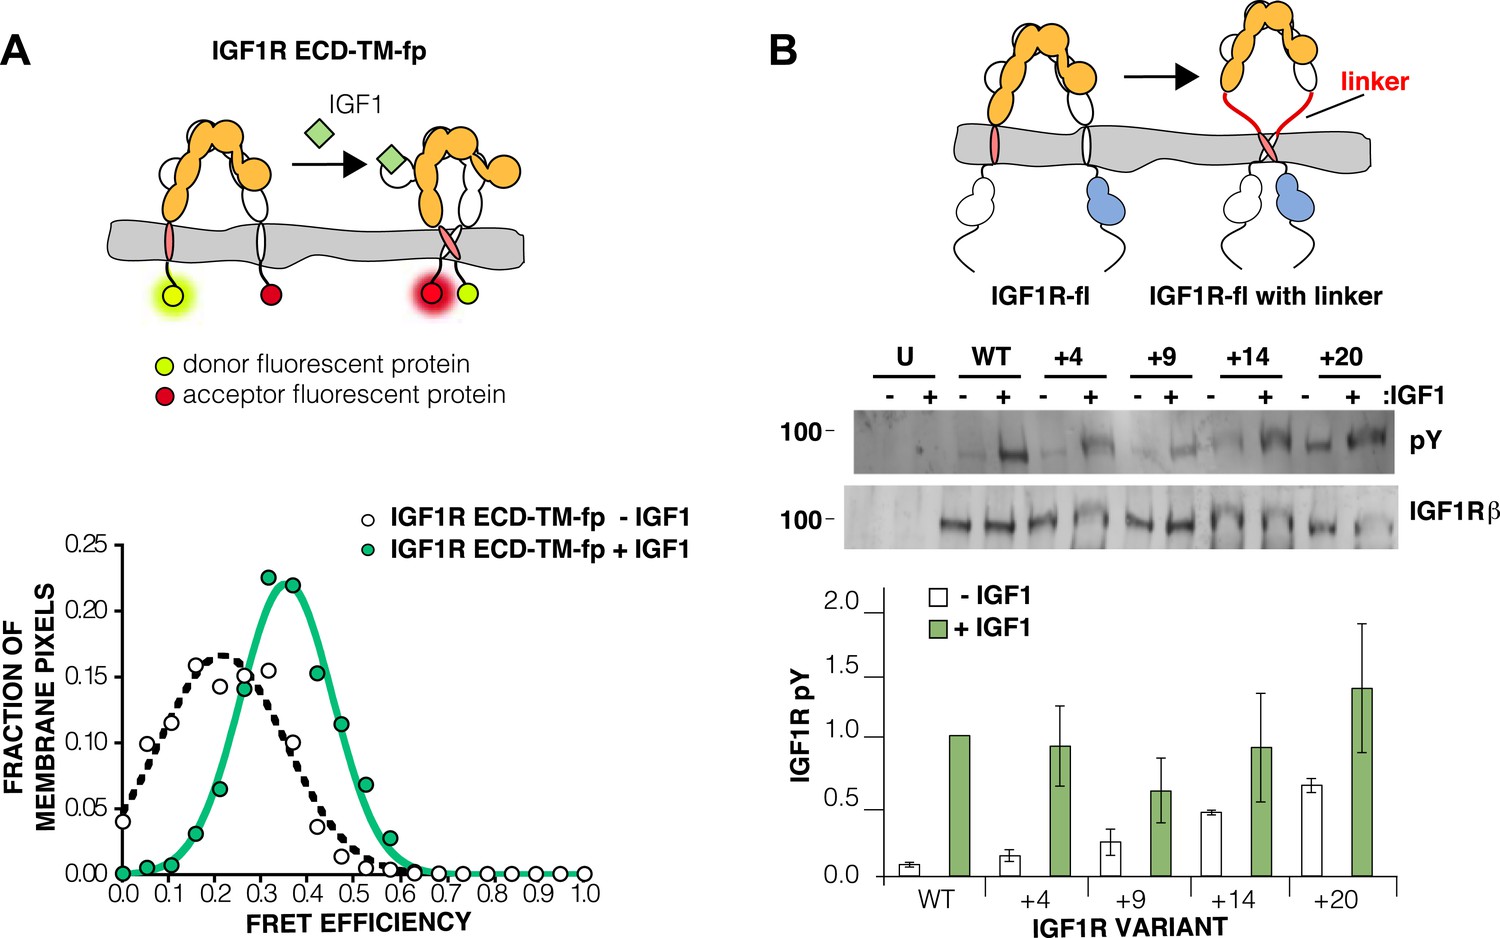
The IGF1R ECD maintains TM separation.
(A) Cartoon of the IGF1R ECD-TM-fp variant utilized in the live cell FRET assay (top). Frequency distribution of FRET efficiency values per membrane pixel of IGF1R ECD-TM-fp in the presence (green) or absence (white) of IGF1 (bottom). Data were fit to a normal distribution with peak values of 0.34 ± 0.09 and 0.21 ± 0.13 in the presence and absence of IGF1, respectively. (B) Cartoon of the IGF1R-fl and IGF1R variants with flexible linkers (top). Representative western blots probed with either anti-pY and anti-IGF1Rβ antibodies of immunopreciptated, normalized cell lysates of untransfected cells (U) or cells transfected with IGF1R-fl (WT) or IGF1R variants with an additional 4 (+4), 9 (+9), 14 (+14), or 20 (+20) glycine and serine residues per αβ chain (middle). Bar graph of average IGF1R phosphorylation normalized to total receptor concentration (±s.e.m.) from at least three separate experiments, except for +14 which was from 2. Results from cells incubated in the absence of IGF1 are shown in white and in the presence of IGF1 shown in green (bottom). See also supplemental figures.
Figure 4—figure supplement 1

Apparent FRET efficiency measured in membrane-derived vesicles.
Measured FRET efficiencies between isolated IGF1R TM-fp (pink circles), IGF1R ECD-TM-fp with IGF1 (green circles) or without IGF1 (white circles), IGF1R ECD-ΔL1-TM-fp (blue circles), and IGF1R ECD-TM-fp H905C (red circles) plotted as a function of the acceptor, IGF1R-YFP, concentration. Also shown is the monomeric control of ErbB2 ECD-TM-fp (purple circles). Each data point represents the binned FRET efficiency from at least eight vesicles (±s.d. in x and y). The FRET expected from random proximity is shown as a dotted line (King et al., 2014).
Figure 4—figure supplement 2
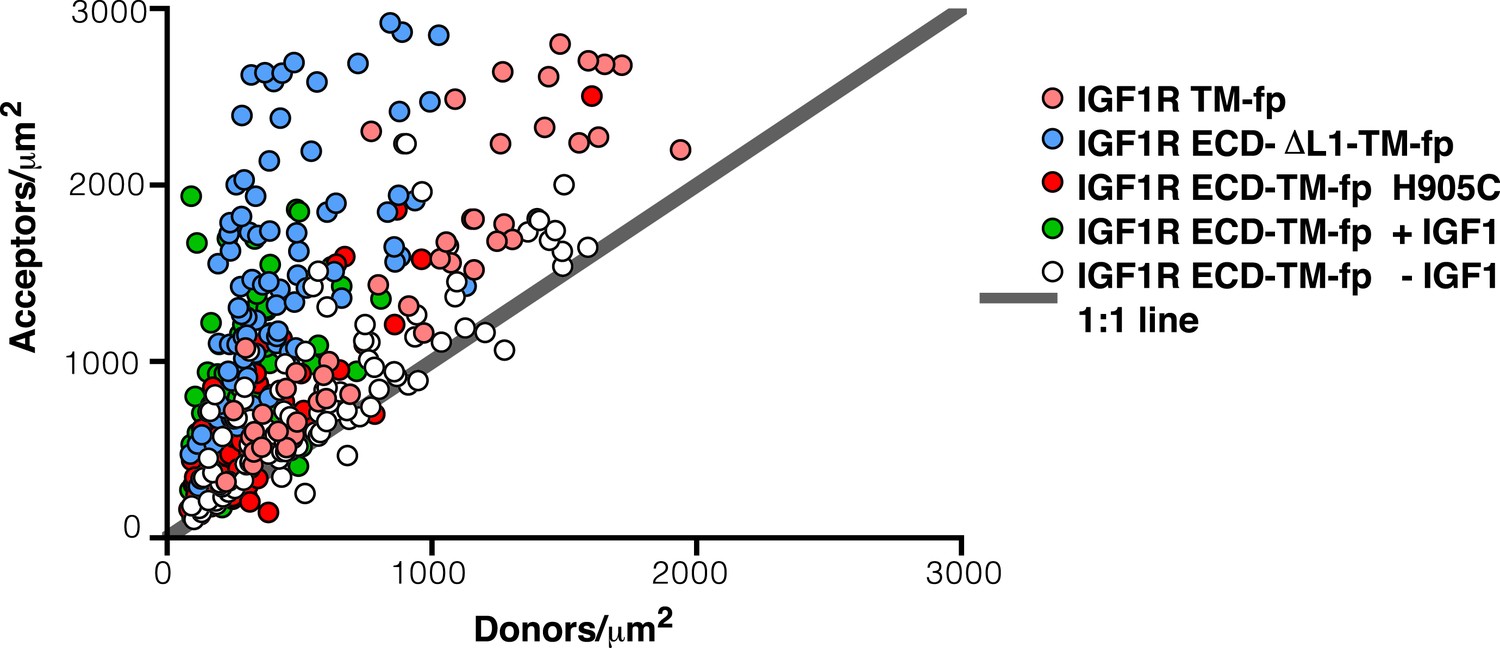
Ratio of donor to acceptor molecules in membrane-derived vesicles.
Each data point represents the measured number of donors and acceptors per square micron measured for a single vesicle from experiments on IGF1R TM-fp (pink circles), IGF1R ECD-TM-fp with IGF1 (green circles) or without IGF1 (white circles), IGF1R ECD-ΔL1-TM-fp (blue circles), and IGF1R ECD-TM-fp H905C (red circles).
Figure 4—figure supplement 3
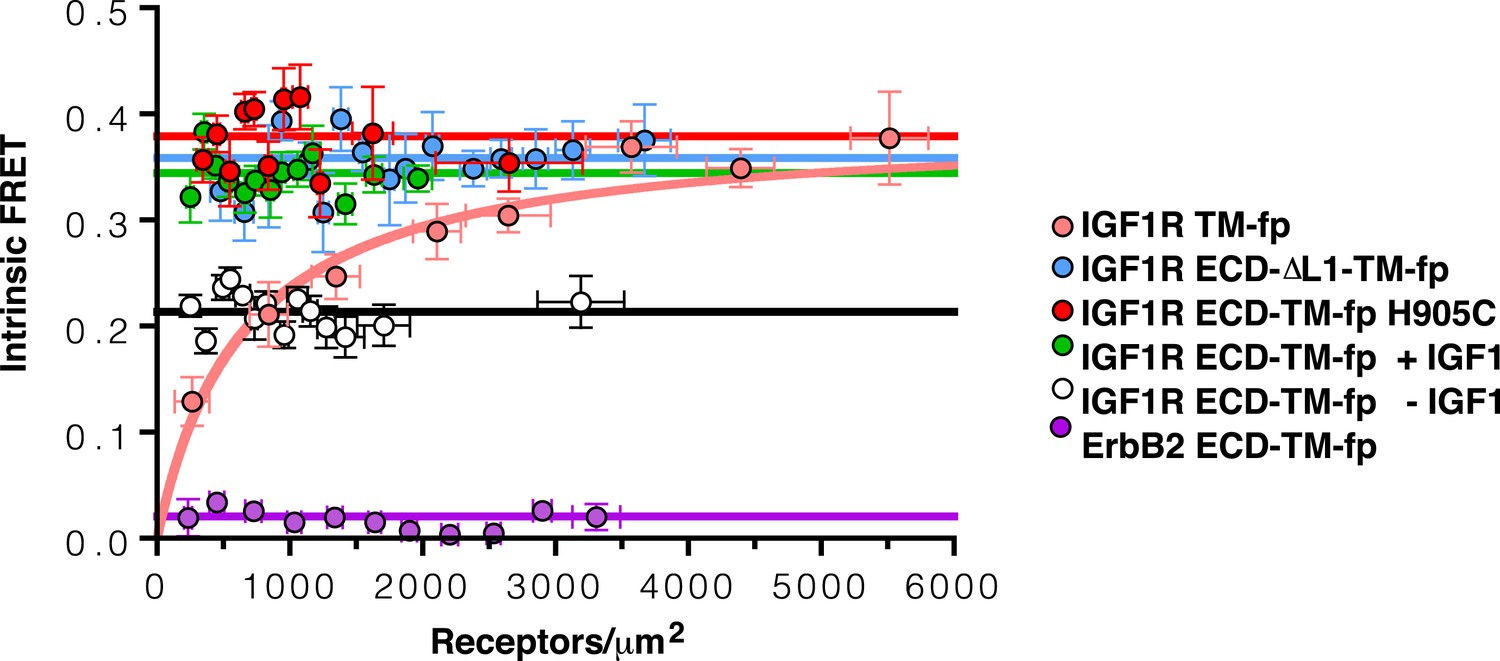
Intrinsic FRET efficiency in vesicles, corrected for proximity FRET and varying donor-to-acceptor ratios.
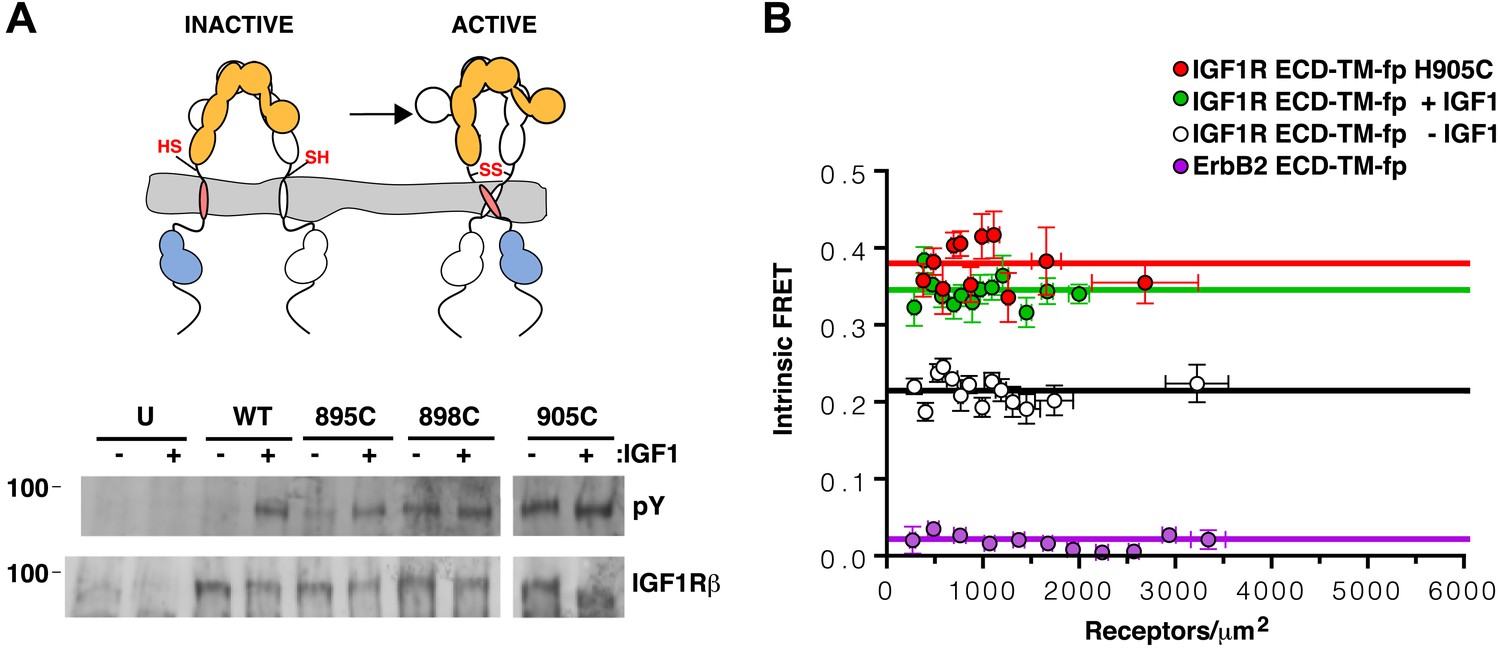
Intrinsic FRET efficiencies between isolated IGF1R TM-fp (pink circles), IGF1R ECD-TM-fp with IGF1 (green circles) or without IGF1 (white circles), IGF1R ECD-ΔL1-TM-fp (blue circles), and IGF1R ECD-TM-fp H905C (red circles), or ErbB2 ECD-TM-fp (purple circles) plotted as a function of the total receptor, IGF1R-YFP and IGF1R-mCherry, concentration. Each data point represents the binned FRET efficiency measured from at least eight vesicles (±s.e.m. in x and y). Intrinsic FRET is the observed FRET corrected for differences in expression of donor and acceptor proteins and corrected for FRET resulting in random proximity. For IGF1R TM-fp the data were fit to a two state association model with a peak value of 0.38 ± 0.02. The remaining data were fit to a horizontal line with y intercept of 0.21 ± 0.01 for IGF1R ECD-TM-fp without IGF1 or 0.34 ± 0.02 for with IGF1, 0.36 ± 0.02 for IGF1R ECD-ΔL1-TM-fp and 0.38 ± 0.02 for IGF1R ECD-TM-fp H905C, and 0.02 ± 0.01 for the ErbB2 ECD-TM-fp.
Figure 4—figure supplement 4
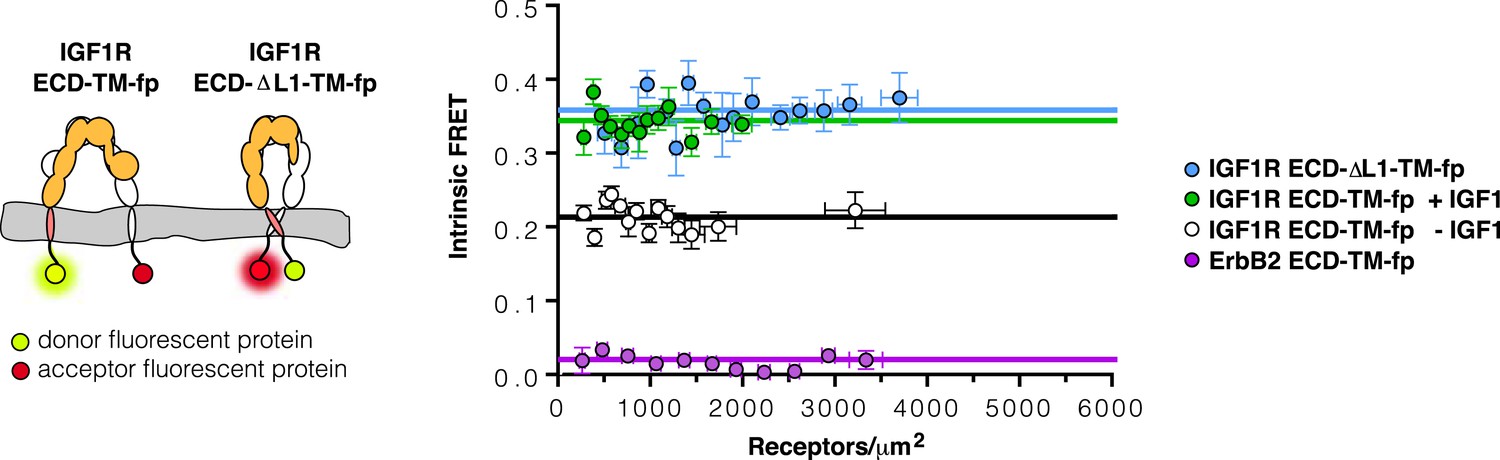
The TMs associate in IGF1R ECD-ΔL1-TM-fp.
Cartoons of IGF1R ECD-TM-fp and IGF1R ECD-ΔL1-TM-fp used in FRET assays (left). The intrinsic FRET of IGF1R ECD-ΔL1-TM-fp (blue) in vesicles plotted as a function of receptor concentration and fit to a horizontal line with a y intercept of 0.36 ± 0.02 (right). Each data point represents the binned average of at least eight vesicles with error bars (±s.e.m. in both x and y). Shown for reference are the data and fits of IGF1R ECD-TM-fp without IGF1 (white), with IGF1 (green), or the monomeric control ErbB2 ECD-TM-fp (purple).
Figure 4—figure supplement 5
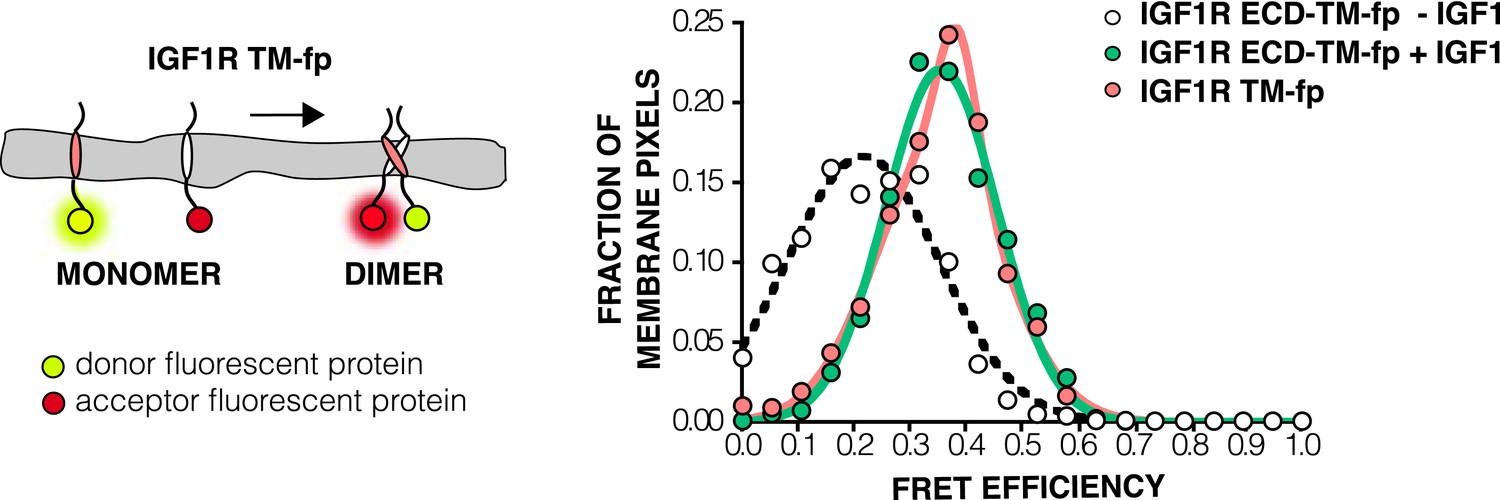
FRET efficiency in live cells of isolated TMs.
A Cartoon of the IGF1R TM-fp utilized FRET assays (left). The frequency distribution is plotted of FRET efficiency values per membrane pixel in live cells of IGF1R TM-fp (pink) (right). The data for IGF1R TM-fp were fit to a two state distribution with peak values of 0.37 ± 0.03 and 0.33 ± 0.11. Shown for reference are the FRET distributions and fits for IGF1R ECD-TM-fp in the presence (green) or absence (white) of IGF.
Figure 5 with 3 supplements
IGF1R TMs associate.
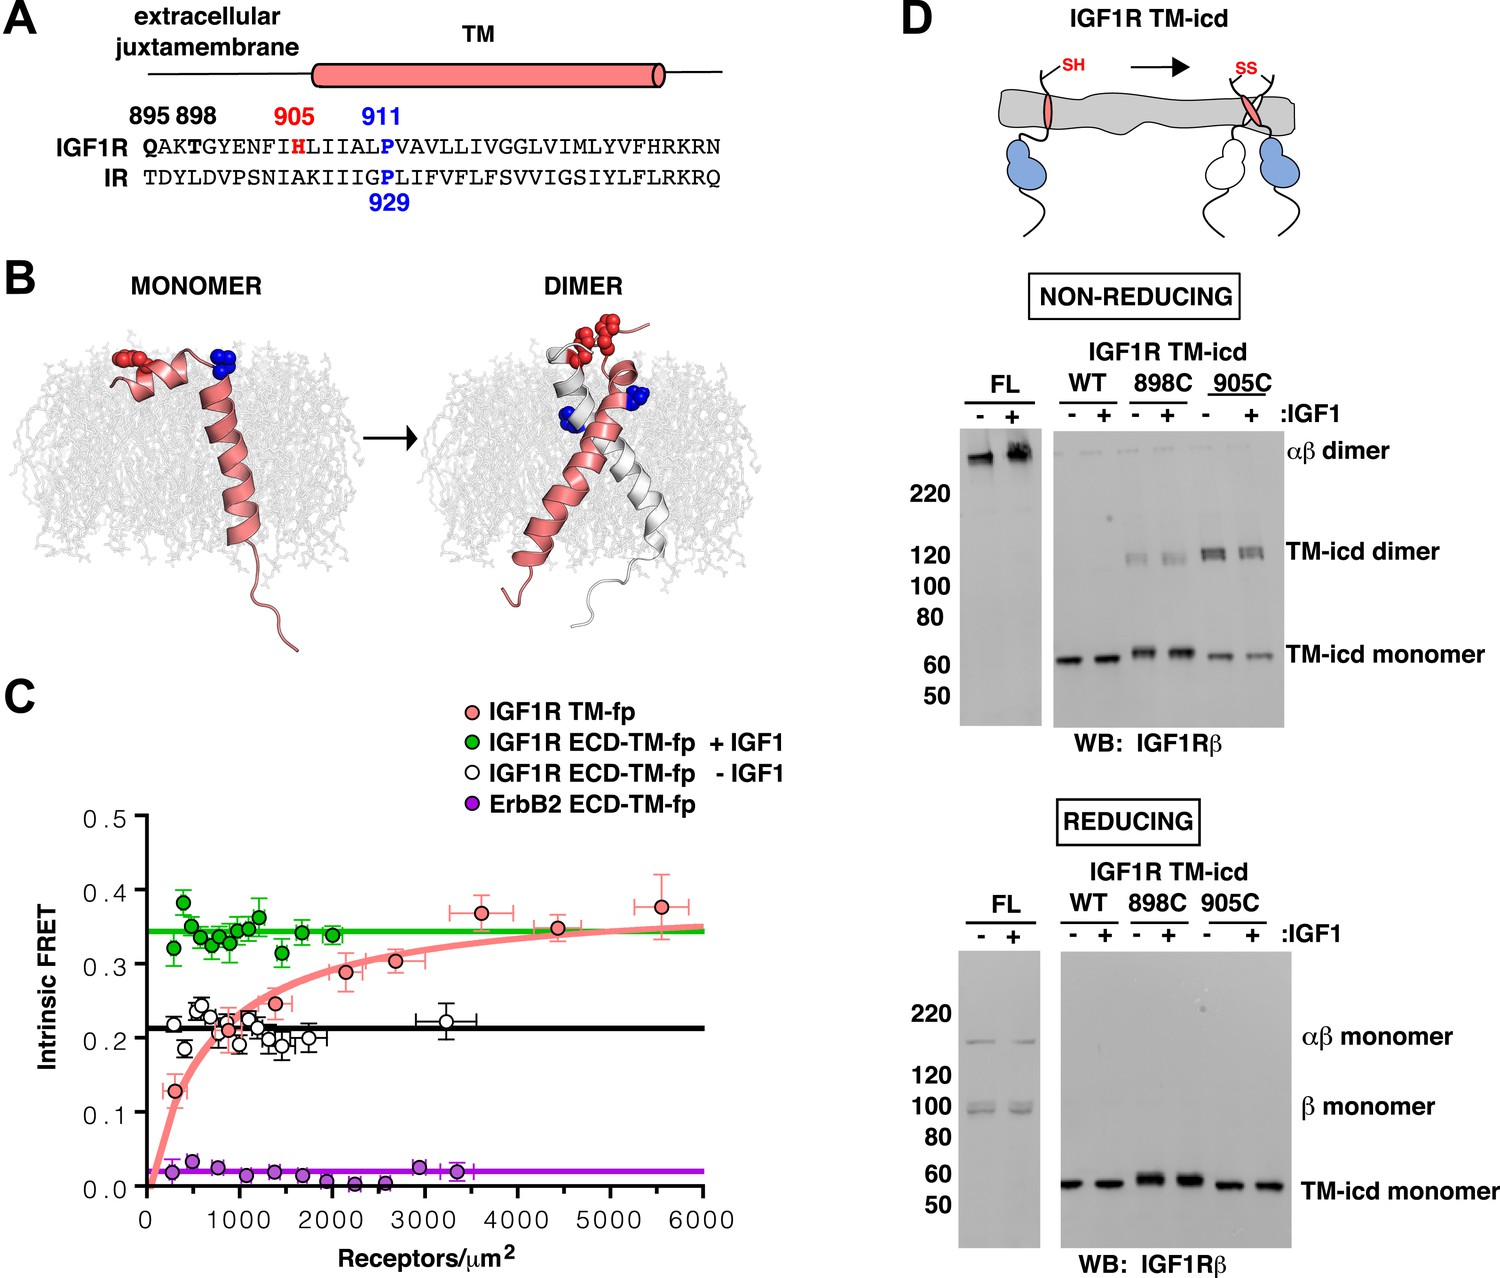
(A) Sequence alignment of human IGF1R and IR extracellular juxtamembrane and TM regions. The position of the TM is indicated above the alignment. Bold lettering highlights residues targeted for substitution. H905 (red) and P911 (blue) are colored. (B) IGF1R TM monomer and dimer structures observed in MD simulations are shown in ribbon (white and pink). Shown in spheres are P911 (blue) and H905 (red). The lipid bilayer is in light gray. (C) The intrinsic FRET efficiency for IGF1R TM-fp plotted (pink) as a function of TM concentration. Also shown for reference are a monomeric control (ErbB2 ECD-TM-fp) in purple and the IGF1R ECD-TM-fp in the presence (green) or absence (white) of ligand. Each data point represents the binned average of at least eight vesicles (±s.e.m. in both x and y). For IGF1R TM-fp, the data were fit to a two state association model with a peak value of 0.38 ± 0.02. (D) Cartoon of IGF1R TM-icd with the positions of single-site cysteine mutations indicated in red (top). Anti-IGF1Rβ Western blots of lysates of HEK293 cells expressing either IGF1R-fl or IGF1R TM-icd fragments (WT, 898C or 905C) incubated with or without IGF1 and analyzed on non-reducing (middle) or reducing gels (bottom).
Figure 5—figure supplement 1
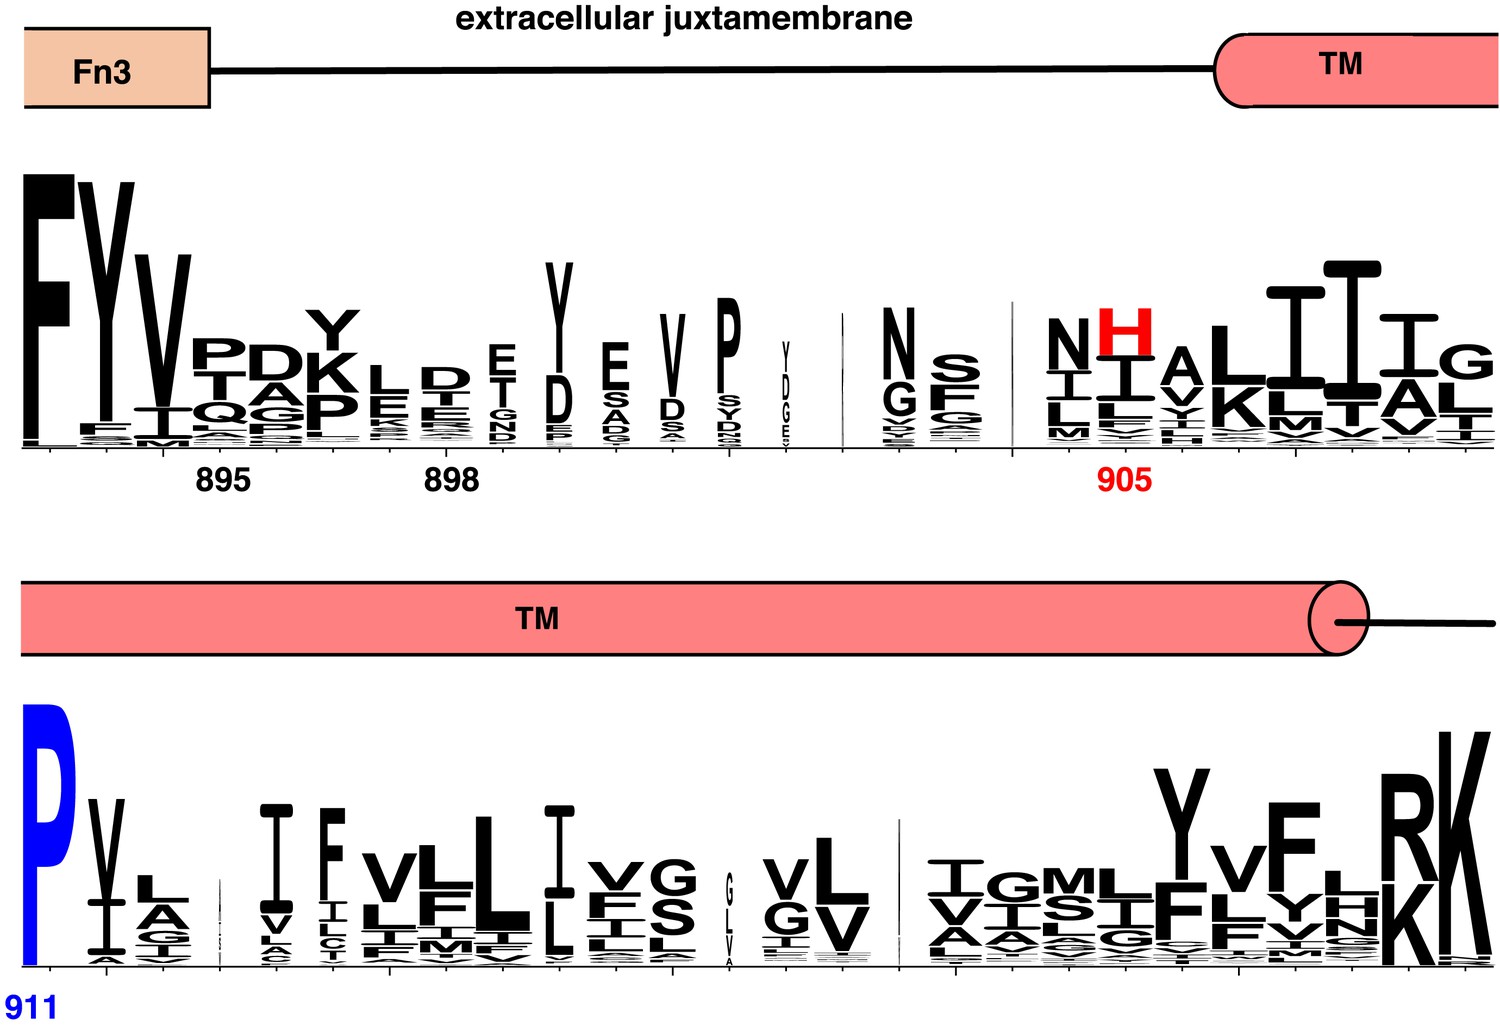
Conservation of extracellular juxtamembrane and TM regions in IR family members.
Weblogo plot showing conservation of the extracellular juxtamembrane and TM residues of 175 non-redundant sequences of Insulin family receptors generated in a BLAST search (Crooks et al., 2004). Domain assignments are shown above the sequence. Numbering corresponds to the position in the human IGF1R sequence.
Figure 5—figure supplement 2

P911 is not required for proper IGF1R activation.
IGF1R proteins were immunoprecipitated from normalized cell lysates in the presence or absence of IGF1 and analyzed by Western blots probed with either anti-pY or anti-IGF1Rβ. HEK293 cells were transiently transfected with IGF1R-fl wild-type (WT), IGF1R-fl bearing P911L mutation (P911L), isoleucine substitutions to the alanine residues either side of P911 (IxPxI), or the same with the proline mutated to leucine (IxLxI), or not transfected (U).
Figure 5—figure supplement 3
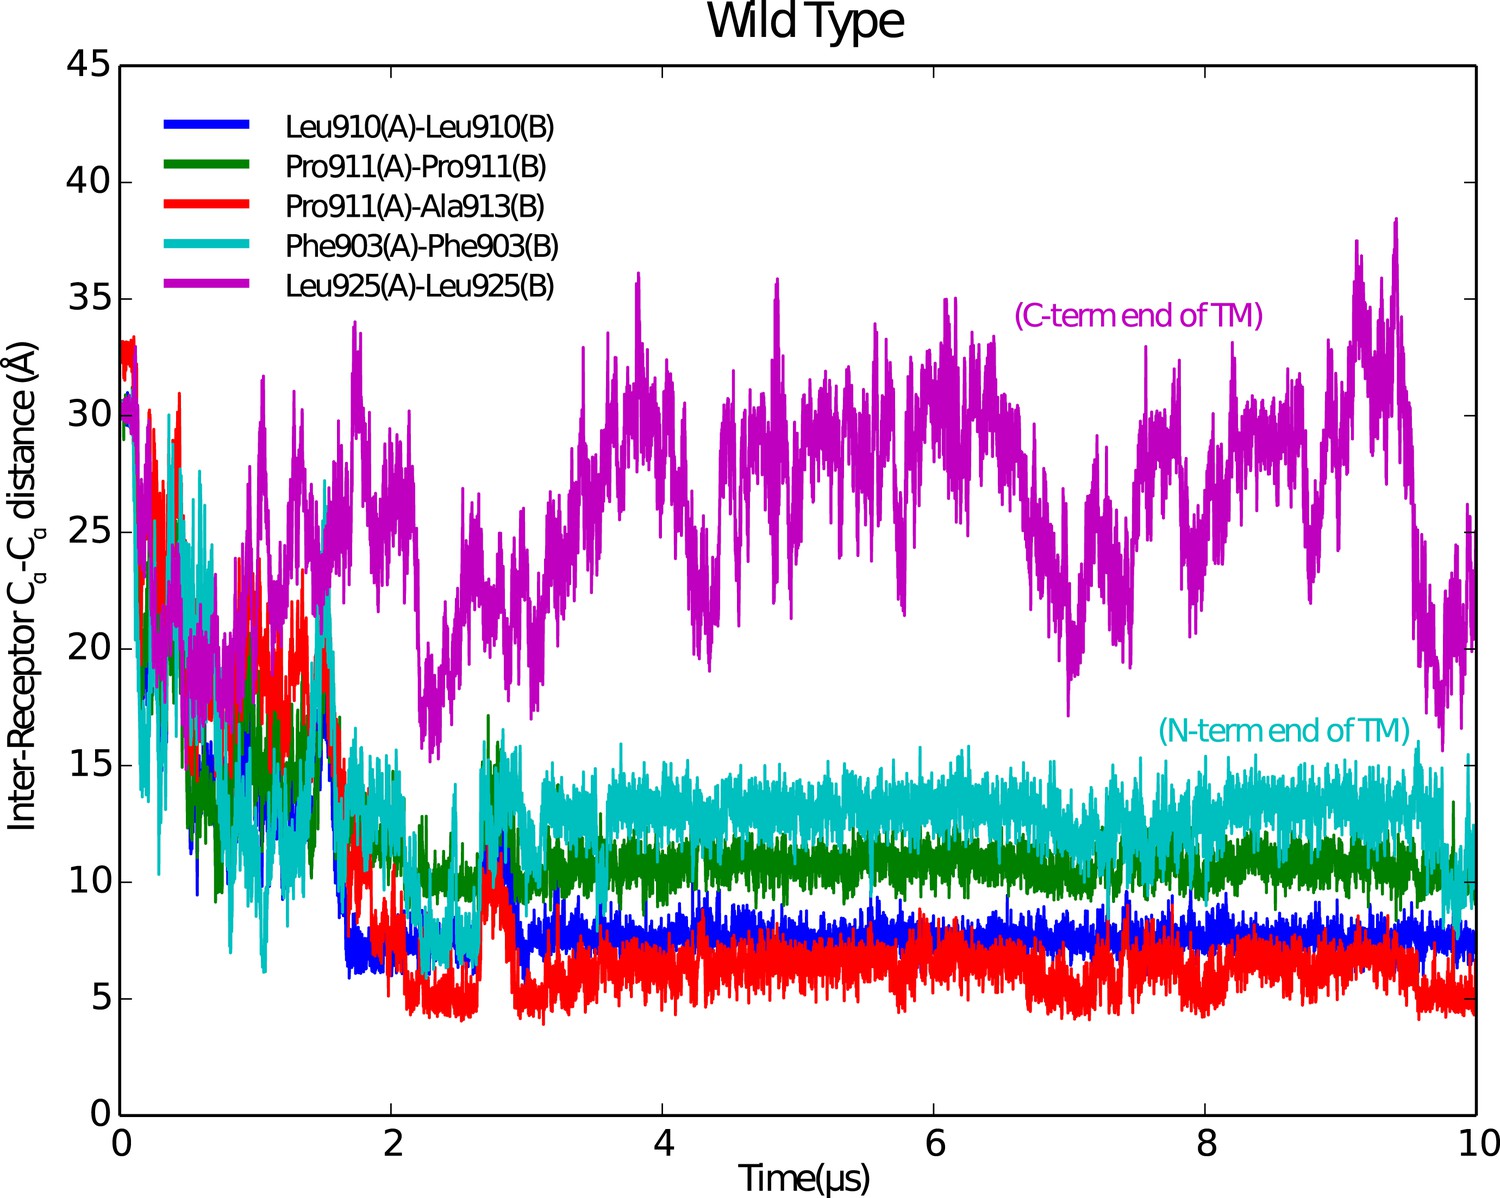
Stable IGF1R TM dimers form during MD simulations.
Reciprocal Cα-Cα distances for selected residues along the IGF1R TM region are shown as a function of time during the simulation. A stable dimer of IGF1R TMs forms after ∼2 μs in which a contact is made near P911, which occurs near the N-terminus of the IGF1R TM.
Figure 6 with 1 supplement
TMs associate in active IGF1R-fl.
(A) Cartoon of IGF1R-fl with cysteine substitutions (top). Western blots of immunoprecipitated normalized cell-lysates from untransfected cells (U) or cells transfected with IGF1R-fl (WT) or IGF1R-fl proteins with cysteine substitutions (895C, 898C, or 905C) incubated the presence or absence of IGF1 (bottom). All panels are from the same blot. (B) Plot of the intrinsic FRET efficiency of IGF1R ECD-TM-fp with the H905C substitution (red) and fit to a horizontal line with a value of 0.38 ± 0.02. Each data point represents the binned average of at least eight vesicles (±s.e.m. in both x and y). For reference, the intrinsic FRET efficiencies and fits for IGF1R ECD-TM-fp with ligand (green) or without ligand (white) and the ErbB2 ECD-TM-fp negative control (purple) are also shown. See also supplemental figures.
Figure 6—figure supplement 1
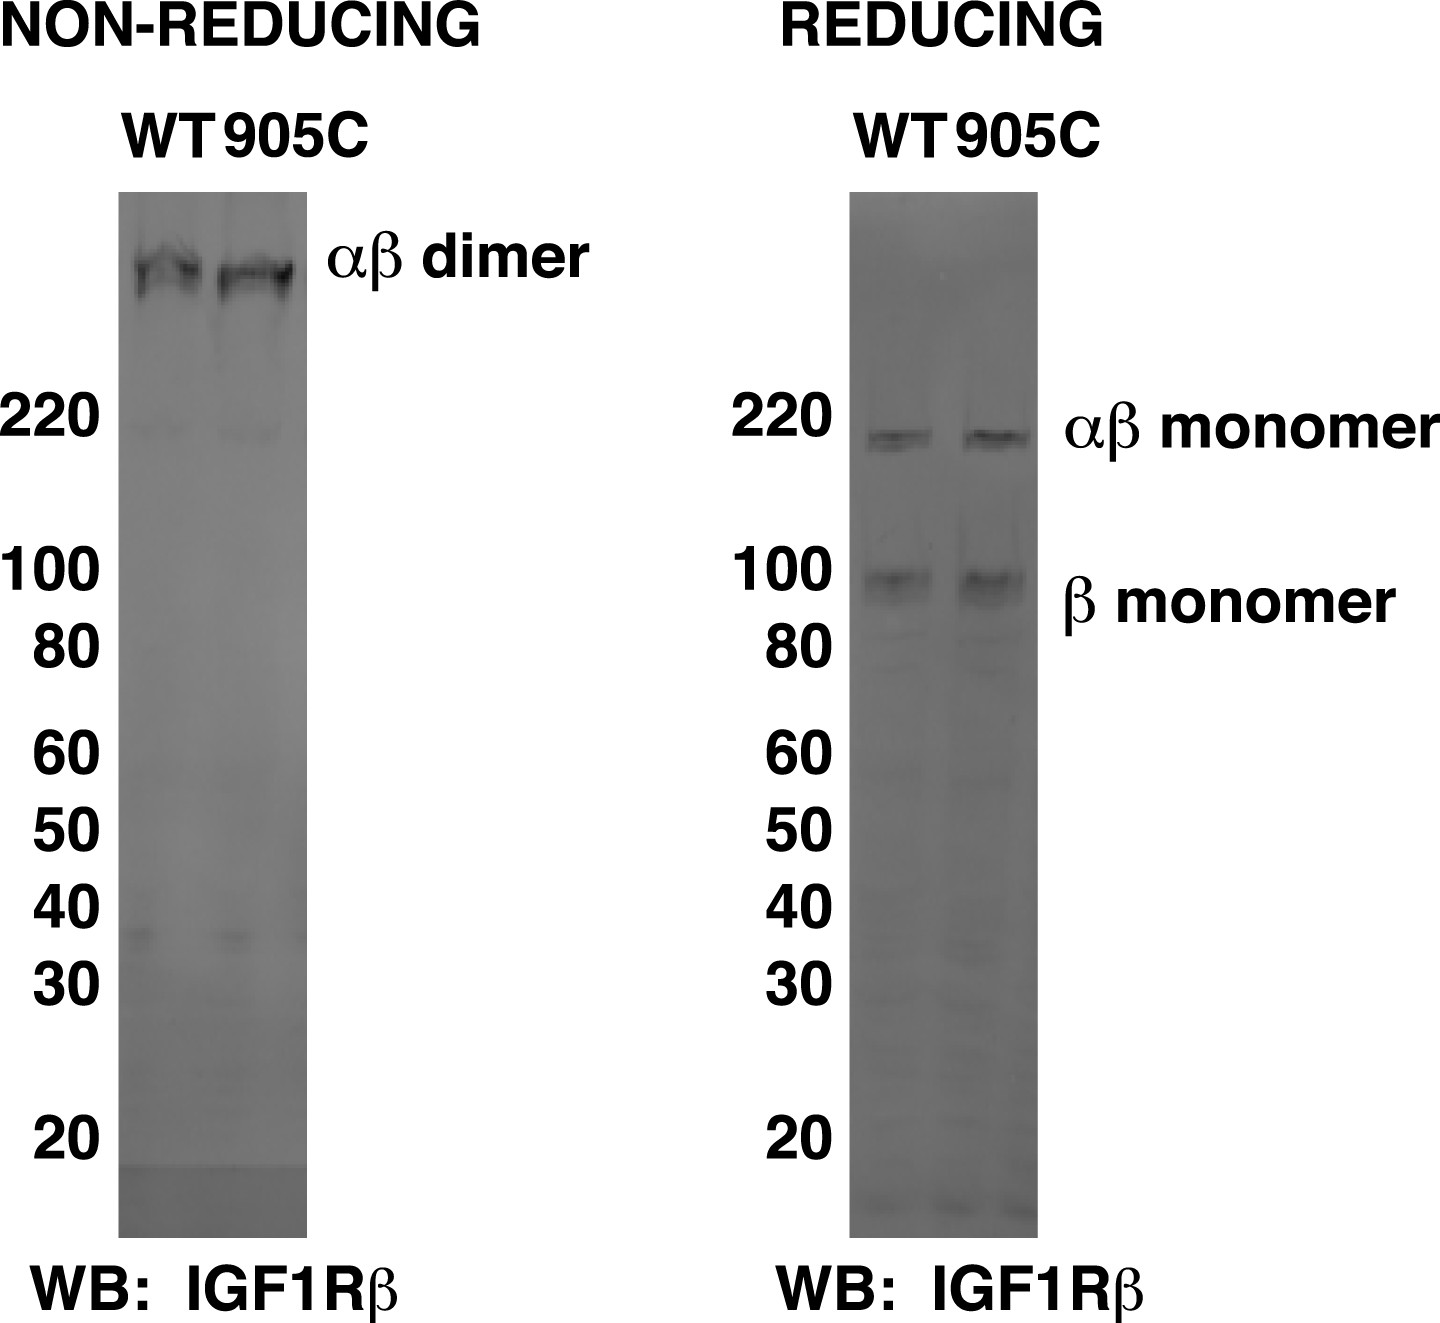
Matching migration patterns of wild-type and H905C IGF1R-fl.
HEK293 cell lysates normalized to total protein concentration from cells expressing either IGF1R-fl (WT) or the H905C variant (905C) were run on non-reducing and reducing SDS-PAGE and analyzed by Western blots probed with anti-IGF1Rβ. The ratio of dimer and monomer band intensities for H905C IGF1R matches that for wild-type IGF1R.
Figure 7 with 3 supplements
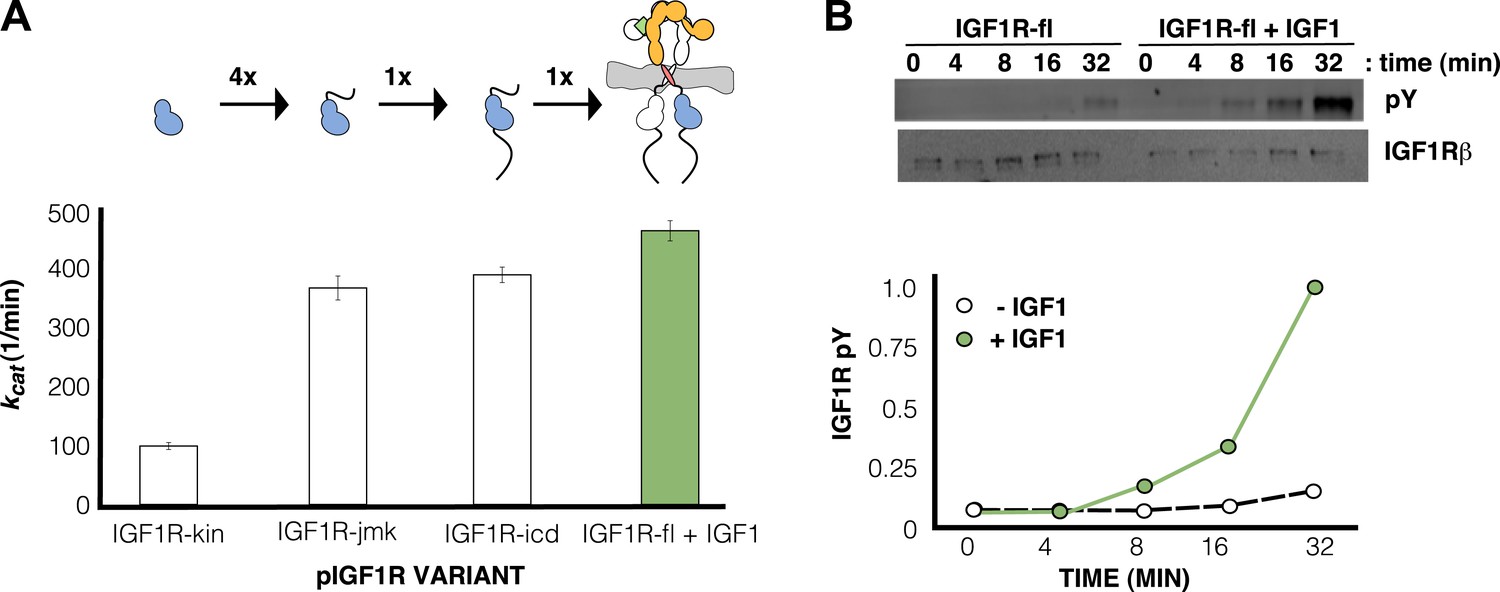
IGF1 stimulates autophosphorylation.
(A) Bar graphs of kcat (min−1) measurements are shown for phosphorylated forms of indicated IGF1R proteins. Diagrams of the specific fragments and the fold differences in activation are shown. (B) Anti-phosphotyrosine (pY) and anti-IGF1Rβ Western blots of IGF1R-fl as a function of time in the presence and absence of IGF1 (top). Quantification of band intensities in the presence (green circles) and absence (white circles) of IGF1 (bottom). See also supplemental figures.
Figure 7—figure supplement 1
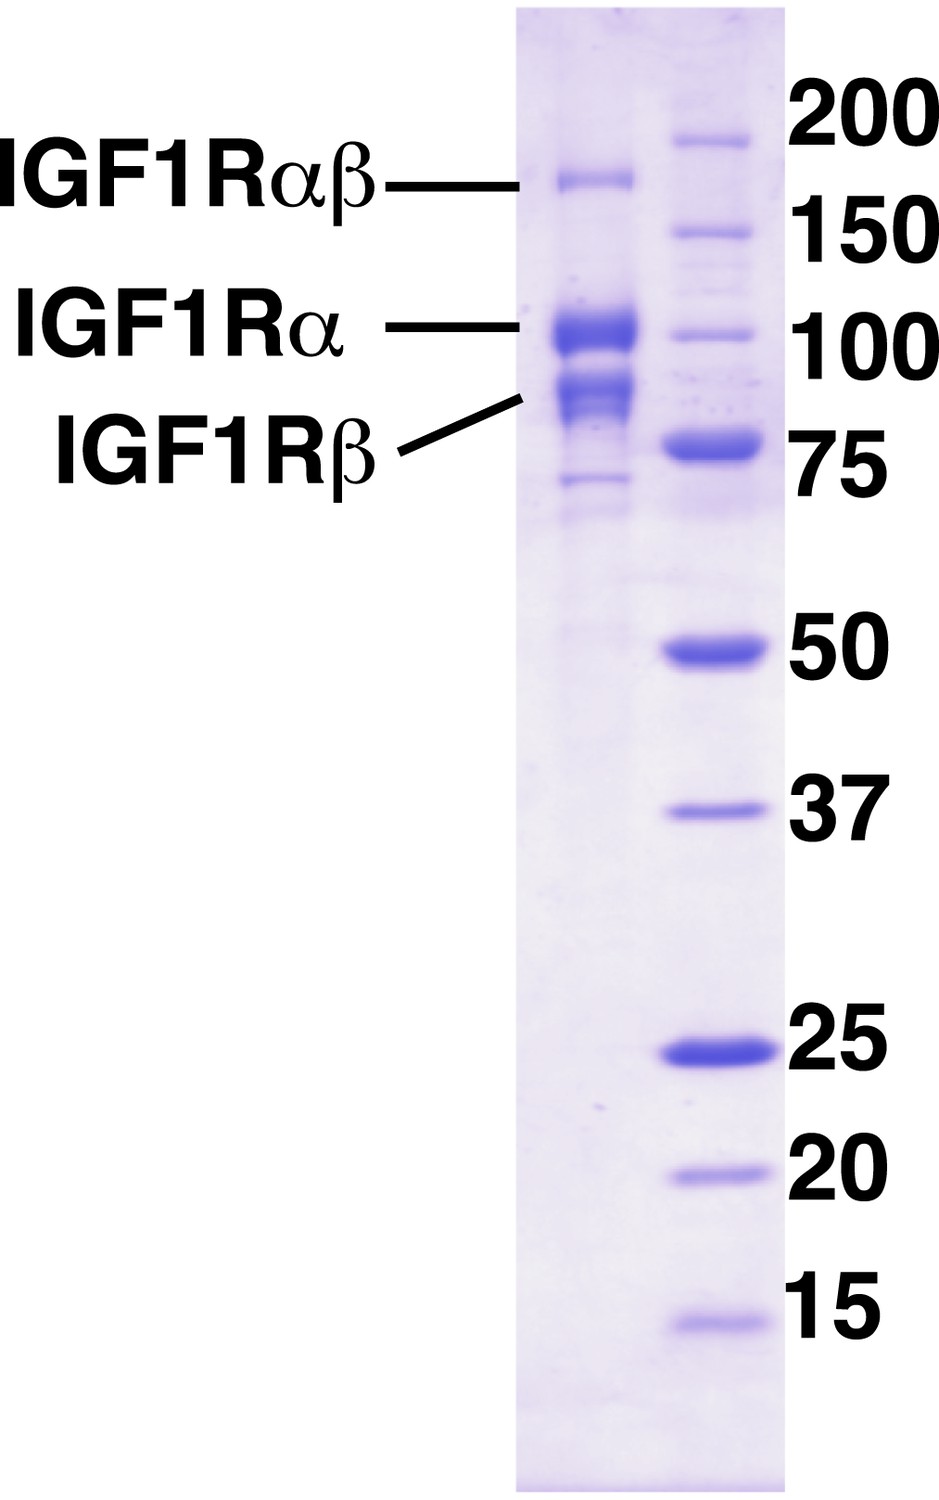
Purity of IGF1R-fl.
Coomassie-blue stained reducing SDS-PAGE analysis of purified IGF1R-fl.
Figure 7—figure supplement 2

IGF1 does not co-purify with IGF1R-fl.
To investigate if IGF1 from the growth medium co-purified with IGF1R-fl, we compared a fixed amount of the purified receptor sample to known quantities of purified IGF1 by Sypro-Ruby stained SDS-PAGE. For lanes containing the IGF1 standards, the percentage of a one IGF1 to one receptor complex equivalent to the amount of IGF1 loaded in that lane is marked above. Therefore, >99.4% of the IGF1R-fl protein purified is unliganded.
Figure 7—figure supplement 3

Analysis of phosphorylation states of IGF1R fragments.
Coommassie-blue stained native gel of phosphorylated and unphosphorylated forms of IGF1R-kin, IGF1R-jmk, and IGF1R-icd.
Figure 8 with 3 supplements
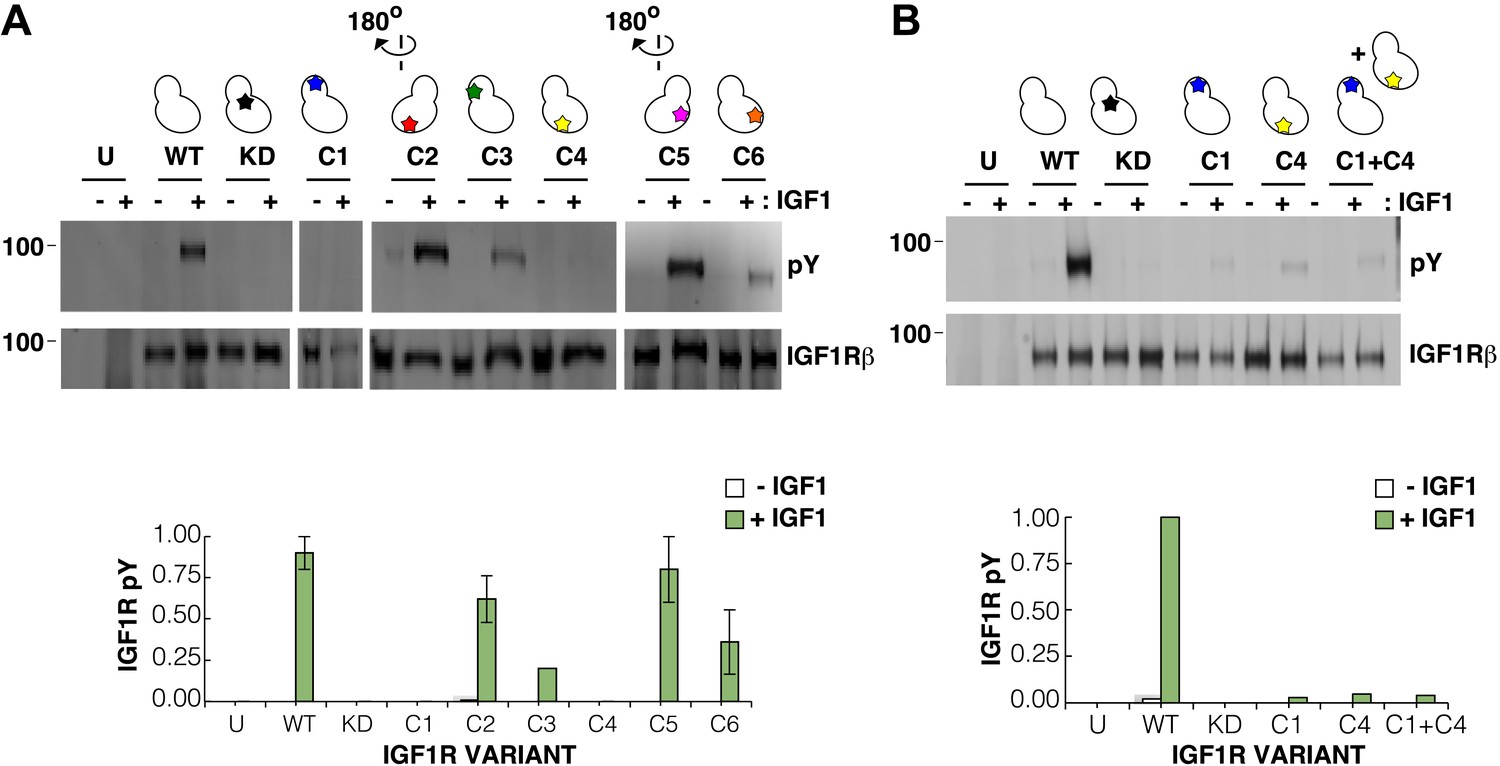
Surface mutations on the IGF1R kinase domain disrupt receptor activation.
(A) Anti-pY and anti-IGF1Rβ Western blots of tagged IGF1R proteins immunoprecipitated from cells incubated in the presence or absence of IGF1. HEK293 cells were transiently transfected with IGF1R-fl (WT), IGF1R bearing the kinase-inactivating mutation D1105A (KD), IGF1R with clusters of surface mutations (C1-C6), or not transfected (U). Approximate locations of the mutated clusters indicated by a star on the kinase domain cartoons above each lane (top). Bar graphs showing mean receptor phosphorylation (±s.e.m.) from three independent experiments normalized to total receptor expression (for C3, only one experiment). White bars indicate cells incubated without IGF1 and green bars cells with IGF1 (bottom). (B) Western blots of IGF1R phosphorylation when C1 and C4 variants are co-transfected (top). Bar graph of receptor phosphorylation normalized to total receptor expression with the same coloring as in (A) (bottom). See also supplemental figures.
Figure 8—figure supplement 1

Buried surface analysis of crystal lattice pairs of IR and IGF1R kinase domains.
A scatter plot of the buried surface area (Å2) of each crystal lattice pair of IR or IGF1R kinase domains. A dashed line (red) at 800 Å2 represents the minimal threshold of a biological interface (Bahadur et al., 2004) and a list of structures used in analysis and the numbering of the corresponding kinase pairs generated for each (Hubbard et al., 1994; Hubbard, 1997; Favelyukis et al., 2001; Parang et al., 2001; Pautsch et al., 2001; Till et al., 2001; Munshi et al., 2002; Hu et al., 2003; Li et al., 2003; Munshi et al., 2003; Depetris et al., 2005; Li et al., 2005; Velaparthi et al., 2007; Mayer et al., 2008; Wu et al., 2008; Miller et al., 2009; Patnaik et al., 2009).
Figure 8—figure supplement 2
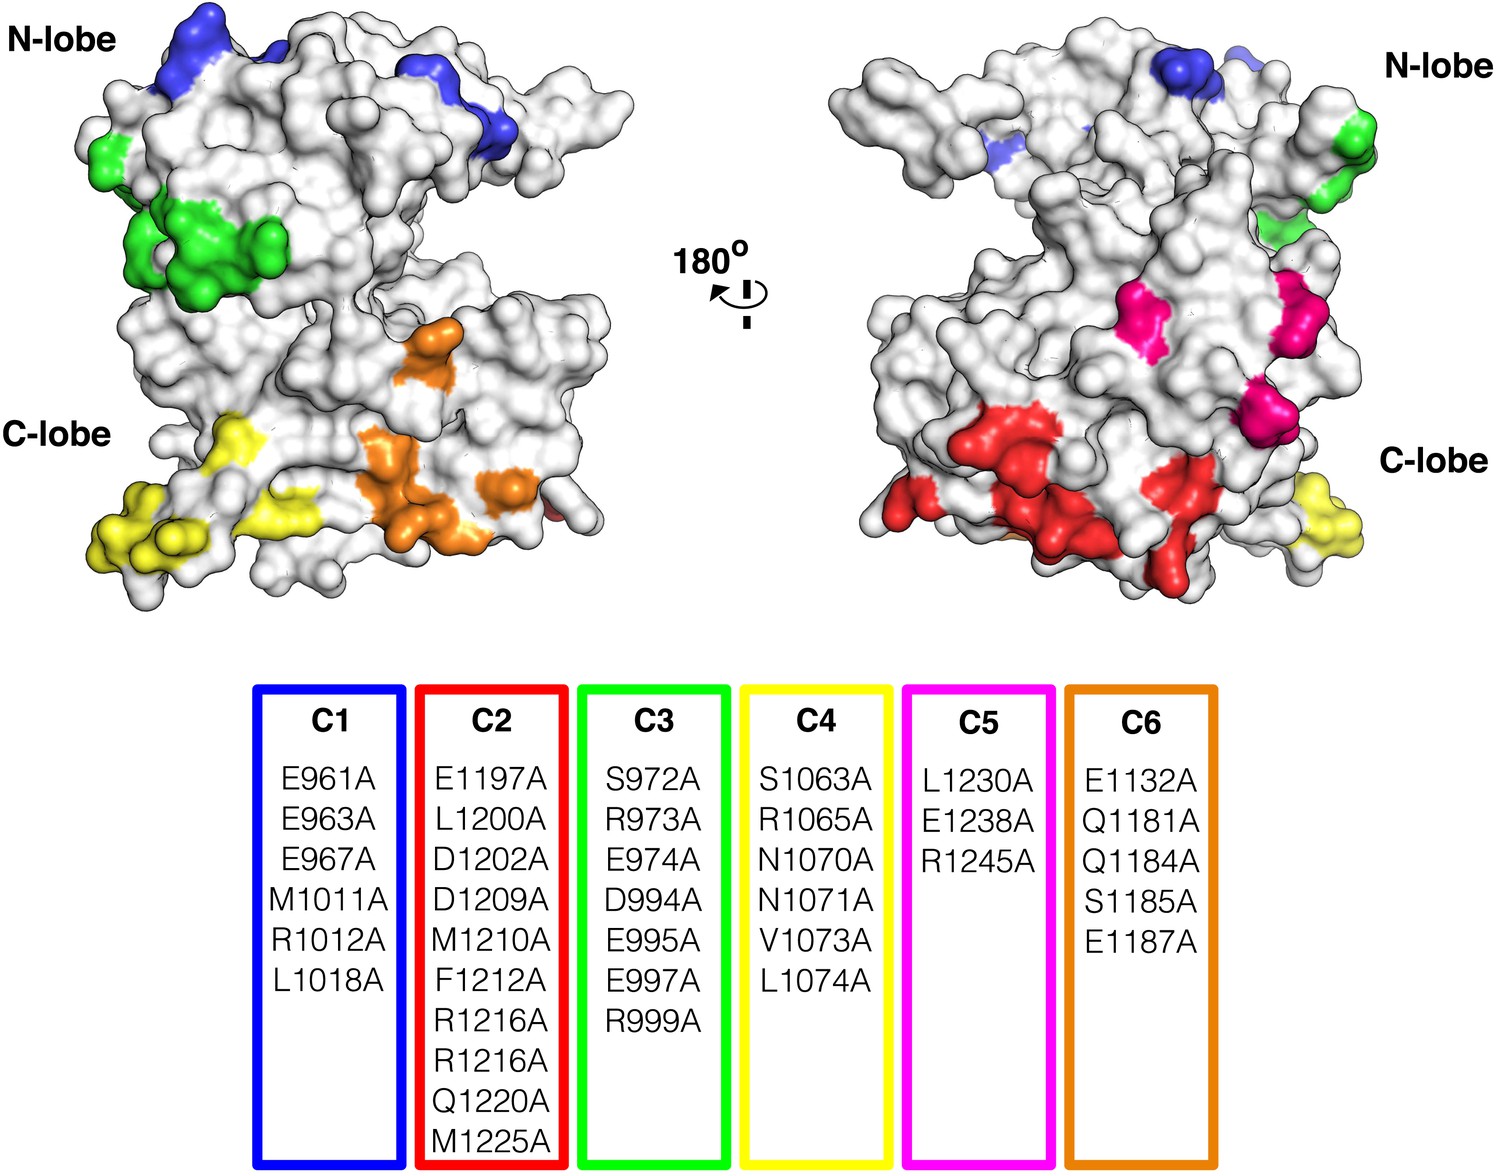
Surface analysis of IGF1R kinase domain.
The IGF1R kinase displayed in surface representation showing the location of each cluster colored according to the table of alanine substitutions made for each cluster (PDB 1P4O, Munshi et al., 2002).
Figure 8—figure supplement 3

Analysis of the autophosphorylation of IGF1R kinase clusters.
Autophosphorylation of IGF1R-kin wild-type (WT), cluster 1 (C1) and cluster 4 (C4) as a function of time monitored by anti-pY Western-blot. All lanes shown are from the same blot.
Figure 9 with 1 supplement
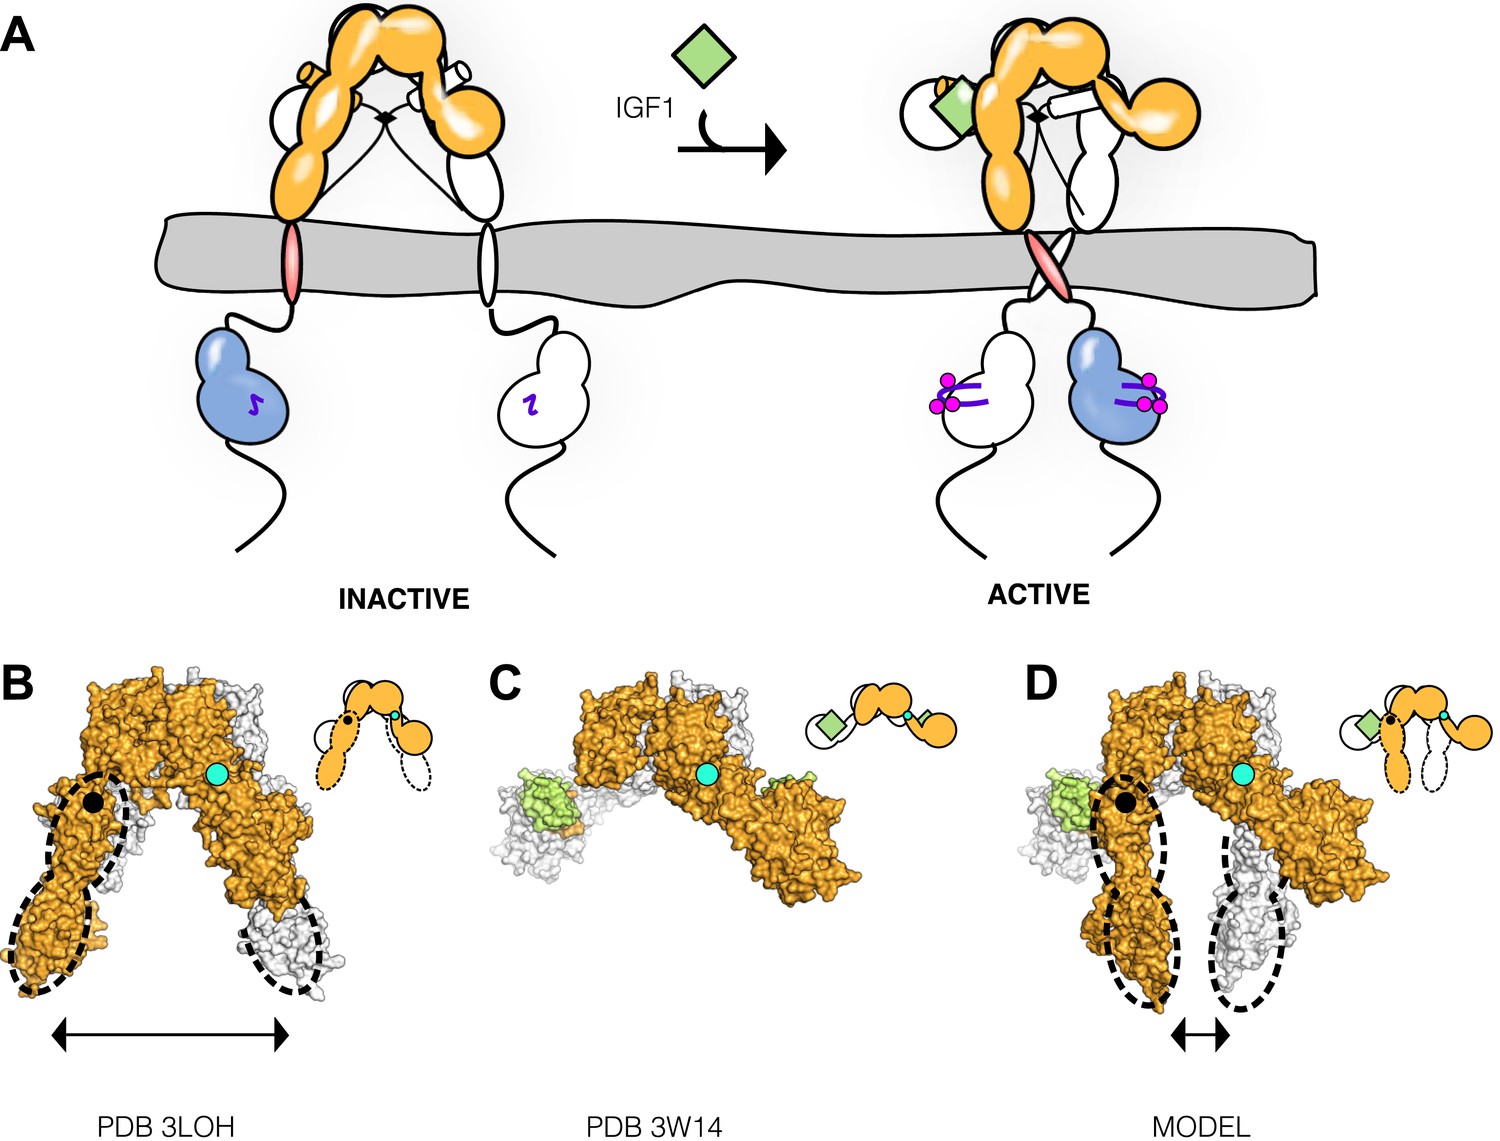
Model of IGF1R activation.
(A) Cartoon model of IR family activation. The IDs are shown as black lines in the ECDs, the disulfide linkages as black diamonds, phosphorylation as pink circles, activation loops as purple lines, ligand as green diamonds, and αCTs as cylinders. Surface representations and corresponding cartoon diagrams of (B) the ECD of unliganded-IR (PDB 3LOH; Smith et al., 2010), (C) insulin bound to the IR ECD fragment (PDB 3W14; Menting et al., 2013), or (D) a model of the entire IR ECD bound to two Insulin molecules. For each panel, one αβ subunit is colored white and the other orange, and Insulin green. Dashed lines outline the Fn2-3 domain tandems. The hinge point between F1 and Fn2-3 domains is indicated by black circles and cyan circles indicate the hinge point between CR and L2 domains.
Figure 9—figure supplement 1
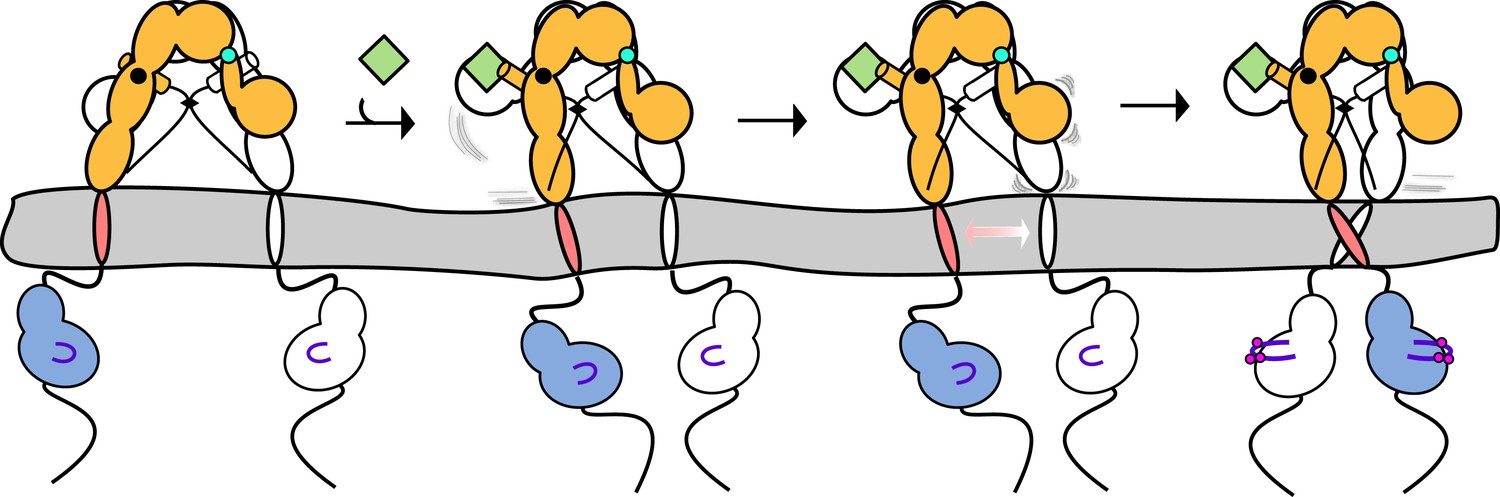
Linkage of αCTs contributes to negative cooperativity through destabilization of the second L1’:Fn2'-3' site following ligand binding.
Cartoon model depicting the destabilization of the L1':Fn2-3 interaction after ligand binding at the first L1:Fn2'-3' site. The IDs are shown as black dashed lines, the disulfide linkages as black diamonds, phosphorylation as pink circles, activation loops as purple lines, ligand as green squares, and αCTs as cylinders. The two hinge points are shown in either black or cyan circles.
Author response image 1
(A) IR family schematic and (B) cartoon representation. Disulfide bonds indicated by black diamonds.
Tables
Table 1
| enzyme pY | Kmapp ATP (μM) | Kmapp Peptide (μM) | kcat (min−1) | kcat/Kmapp(ATP) | |
|---|---|---|---|---|---|
| IGF1R-fl + IGF1 | + | 82 ± 11 | 48 ± 8 | 459 ± 17 | 5.6 |
| IGF1R-fl + IGF1 | − | 356 ± 61 | 68 ± 19 | 44 ± 3 | 0.1 |
| IGF1R-fl | + | 89 ± 18 | 91 ± 8 | 749 ± 22 | 8.5 |
| IGF1R-fl | − | 172 ± 35 | 66 ± 17 | 62 ± 5 | 0.4 |
| IGF1R-icd | + | 79 ± 9 | 110 ± 12 | 385 ± 13 | 4.9 |
| IGF1R-icd | − | >1000* | >1000* | N.D.† | 0.0013 |
| IGF1R-jmk | + | 68 ± 12 | 52 ± 5 | 363 ± 20 | 6.9 |
| IGF1R-jmk | − | >1000* | >1000* | N.D. † | 0.0029 |
| IGF1R-kin | + | 115 ± 24 | 114 ± 26 | 98 ± 6 | 0.85 |
| IGF1R-kin | − | >2000* | >1250* | N.D. † | 0.0019 |
-
*
The absolute value of Km could not be determined but is greater than value stated.
-
†
kcat value could not be measured.
-
‡
Enzymatic values (±s.d.) calculated from duplicate experiments are shown.
-
§
See also supplemental figures.
-
Table 1—source data 1
Representative curves of steady-state kinetic analyses for each IGF1R protein characterized.
Each data point was performed in duplicate and is shown separately.
- https://doi.org/10.7554/eLife.03772.022
-
Table 1—source data 2
Enzyme behavior is linear with respect to time.
Product/Enzyme plotted vs time (minutes) for each IGF1R protein investigated.
- https://doi.org/10.7554/eLife.03772.023
-
Table 1—source data 3
Enzyme behavior is linear with respect to enzyme concentration.
Velocity (nM of product/min) plotted vs enzyme concentration (nM) for each IGF1R protein investigated.
- https://doi.org/10.7554/eLife.03772.024
Download links
A two-part list of links to download the article, or parts of the article, in various formats.
Downloads (link to download the article as PDF)
Open citations (links to open the citations from this article in various online reference manager services)
Cite this article (links to download the citations from this article in formats compatible with various reference manager tools)
How IGF-1 activates its receptor
eLife 3:e03772.
https://doi.org/10.7554/eLife.03772


