HIV-1 DNA predicts disease progression and post-treatment virological control
- John Radcliffe Hospital, United Kingdom
- Institute for Emerging Infections, United Kingdom
- Institute of Clinical Trials and Methodology, University College London, United Kingdom
- Oxford National Institute of Health Research Biomedical Research Centre, United Kingdom
- Brighton and Sussex University Hospitals, United Kingdom
- University College London, United Kingdom
- The Kirby Institute of New South Wales, Australia
- Universidade Federal do Rio de Janeiro, Brazil
- Ospedale San Raffaele, Italy
- Wright Fleming Institute, Imperial College, United Kingdom
- Leidos Biomedical Research Inc., Frederick National Laboratory for Cancer Research, United States
- Ragon Institute of MGH, MIT and Harvard, United States
- St Vincent's Centre for Applied Medical Research, Australia
Figures
Figure 1 with 3 supplements
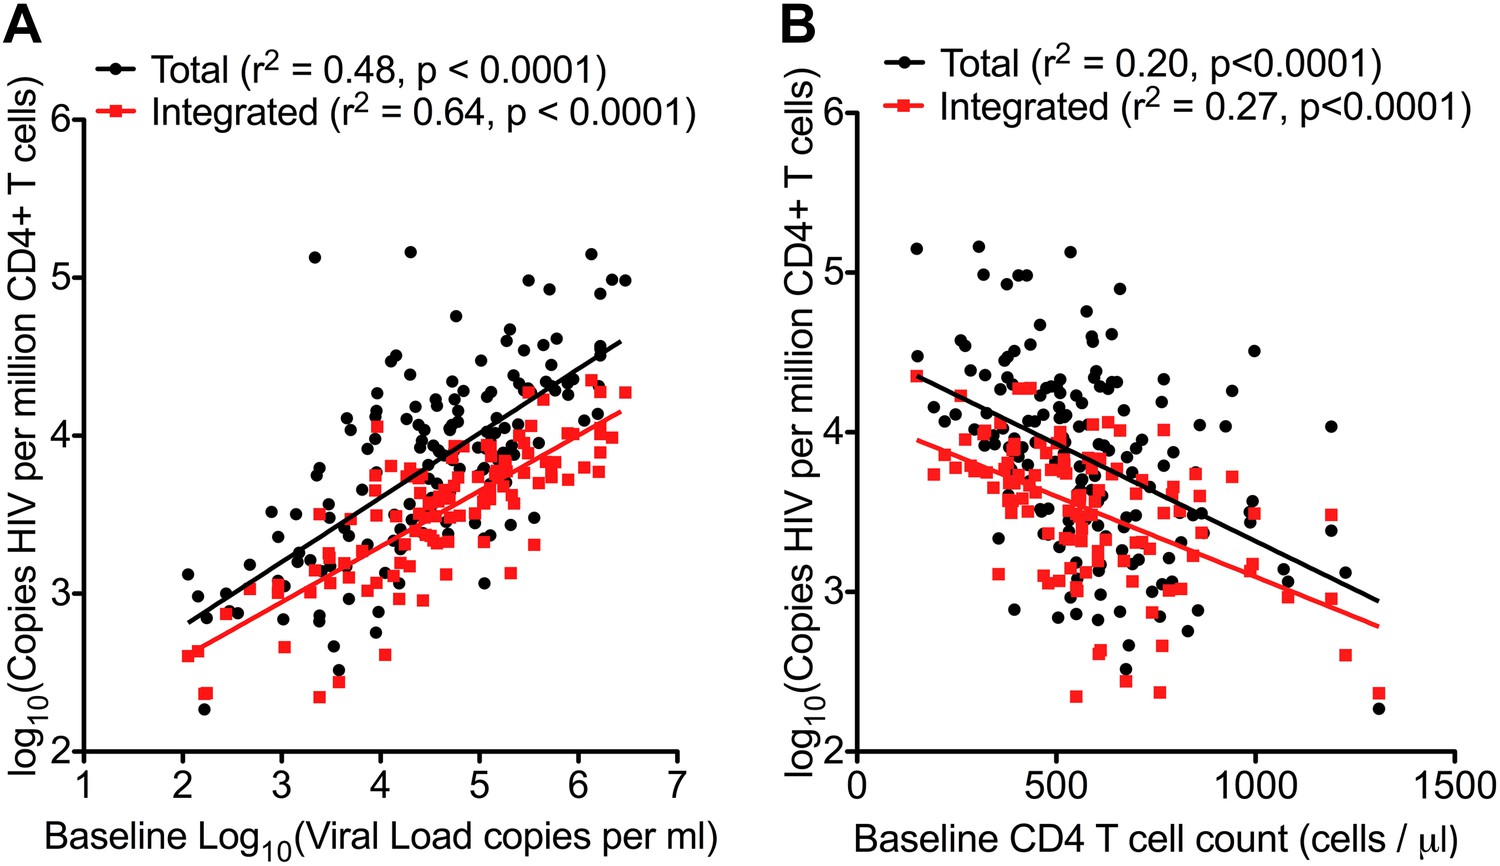
HIV-1 DNA correlates with baseline plasma viral load and CD4 T cell count.
Pre-therapy ‘baseline’ Total HIV-1 DNA (black points and line) (n = 154) and Integrated HIV-1 DNA (n = 111) (red points and line) correlated with log10 plasma HIV-1 RNA (A) and CD4 cell count (B).
Figure 1—figure supplement 1
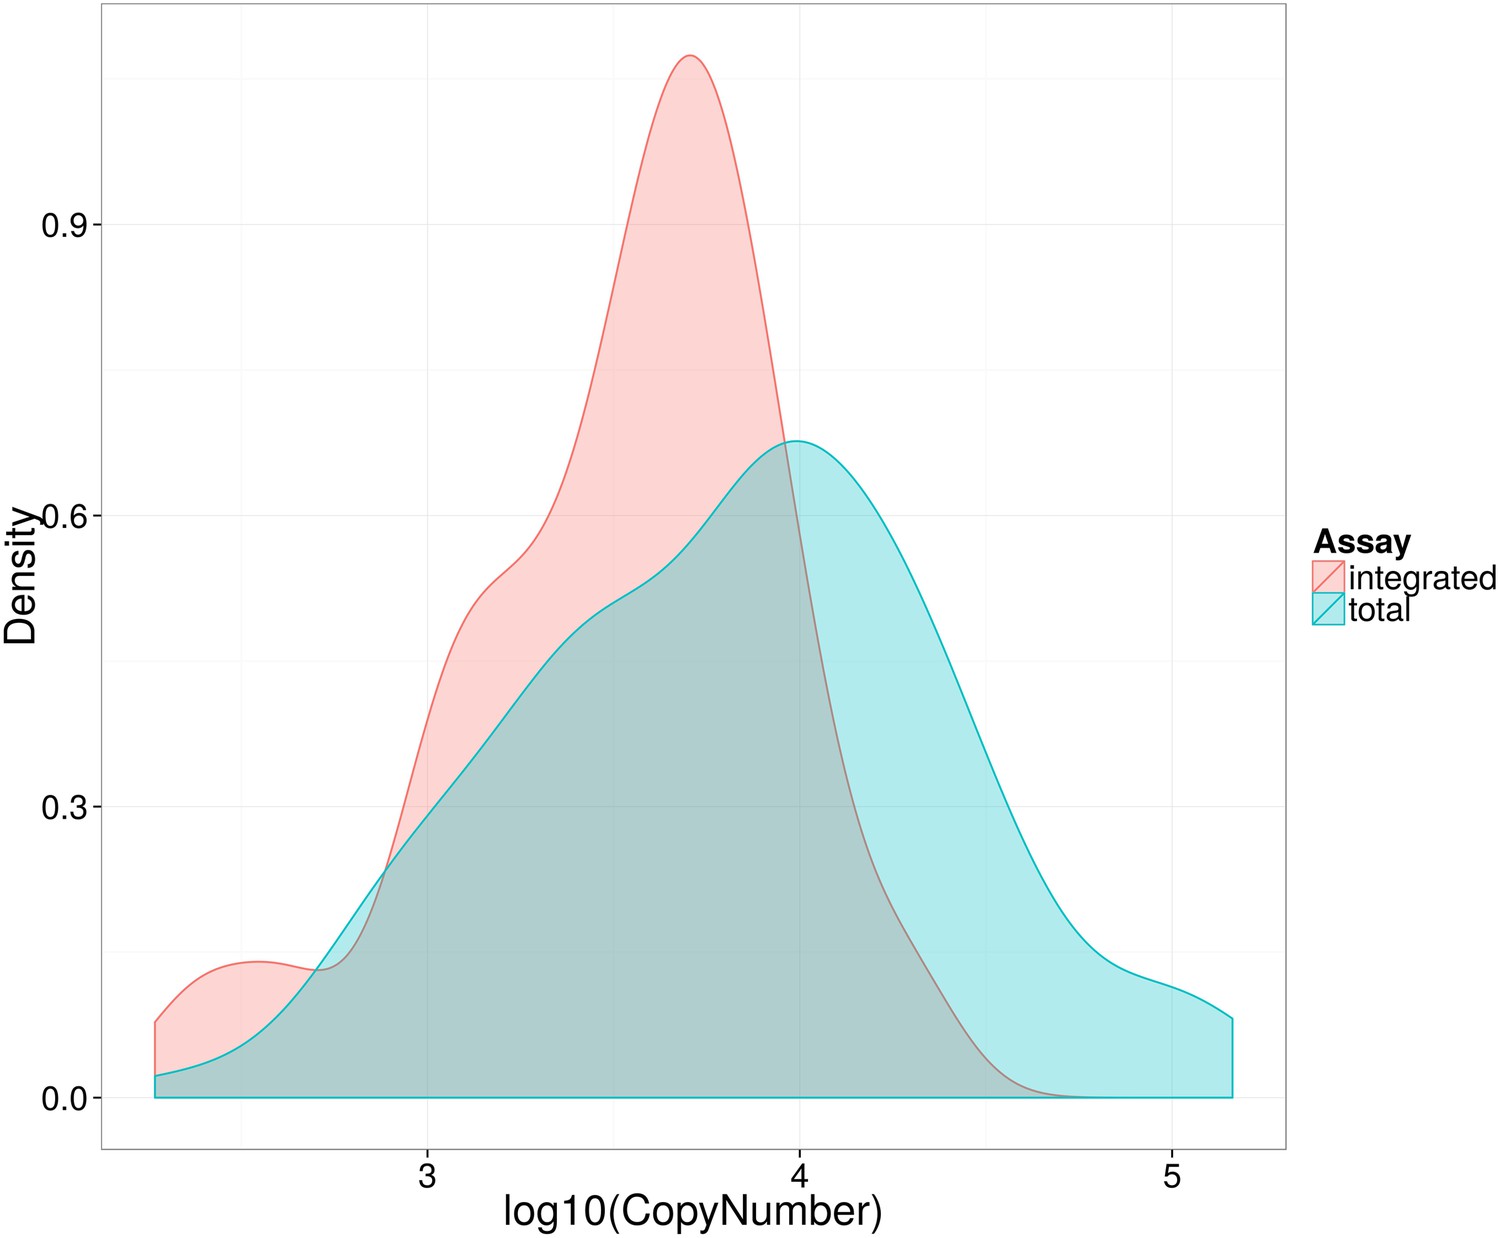
Distribution of log10 total and integrated HIV-1-DNA levels in untreated patients at baseline.
Kernel density plot to show distribution of Total (blue) and Integrated (red) HIV-1-DNA at baseline.
Figure 1—figure supplement 2
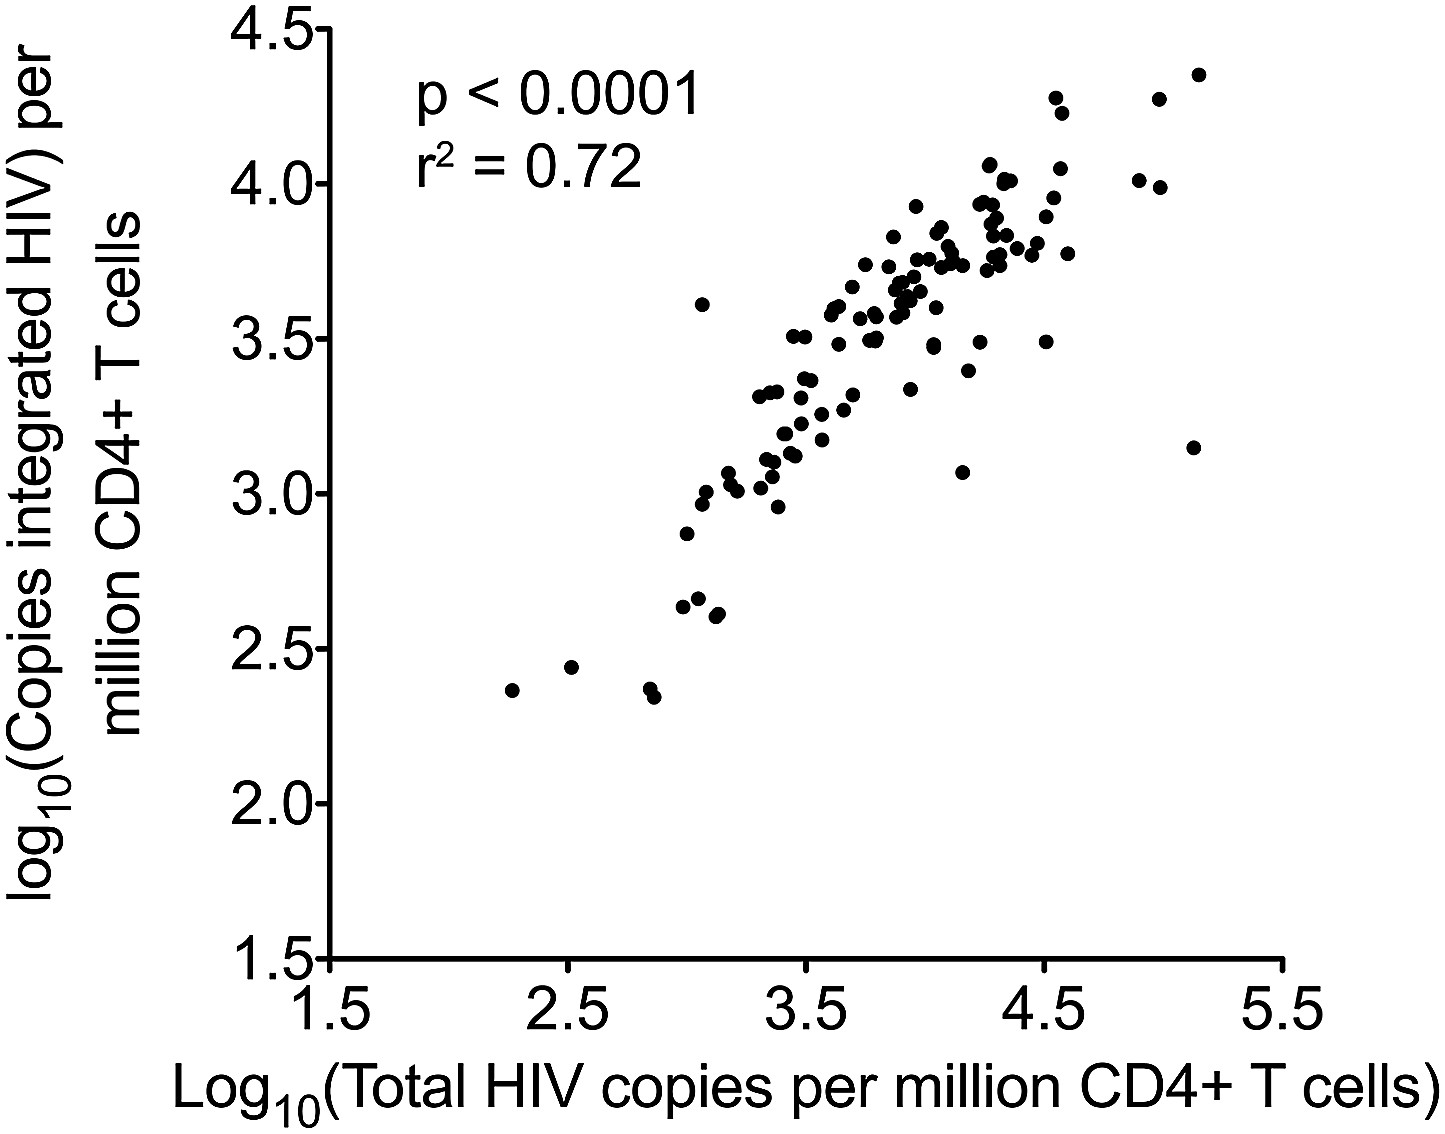
Pearson correlation for total and integrated HIV-1 DNA levels in untreated patients at baseline.
https://doi.org/10.7554/eLife.03821.006
Figure 1—figure supplement 3
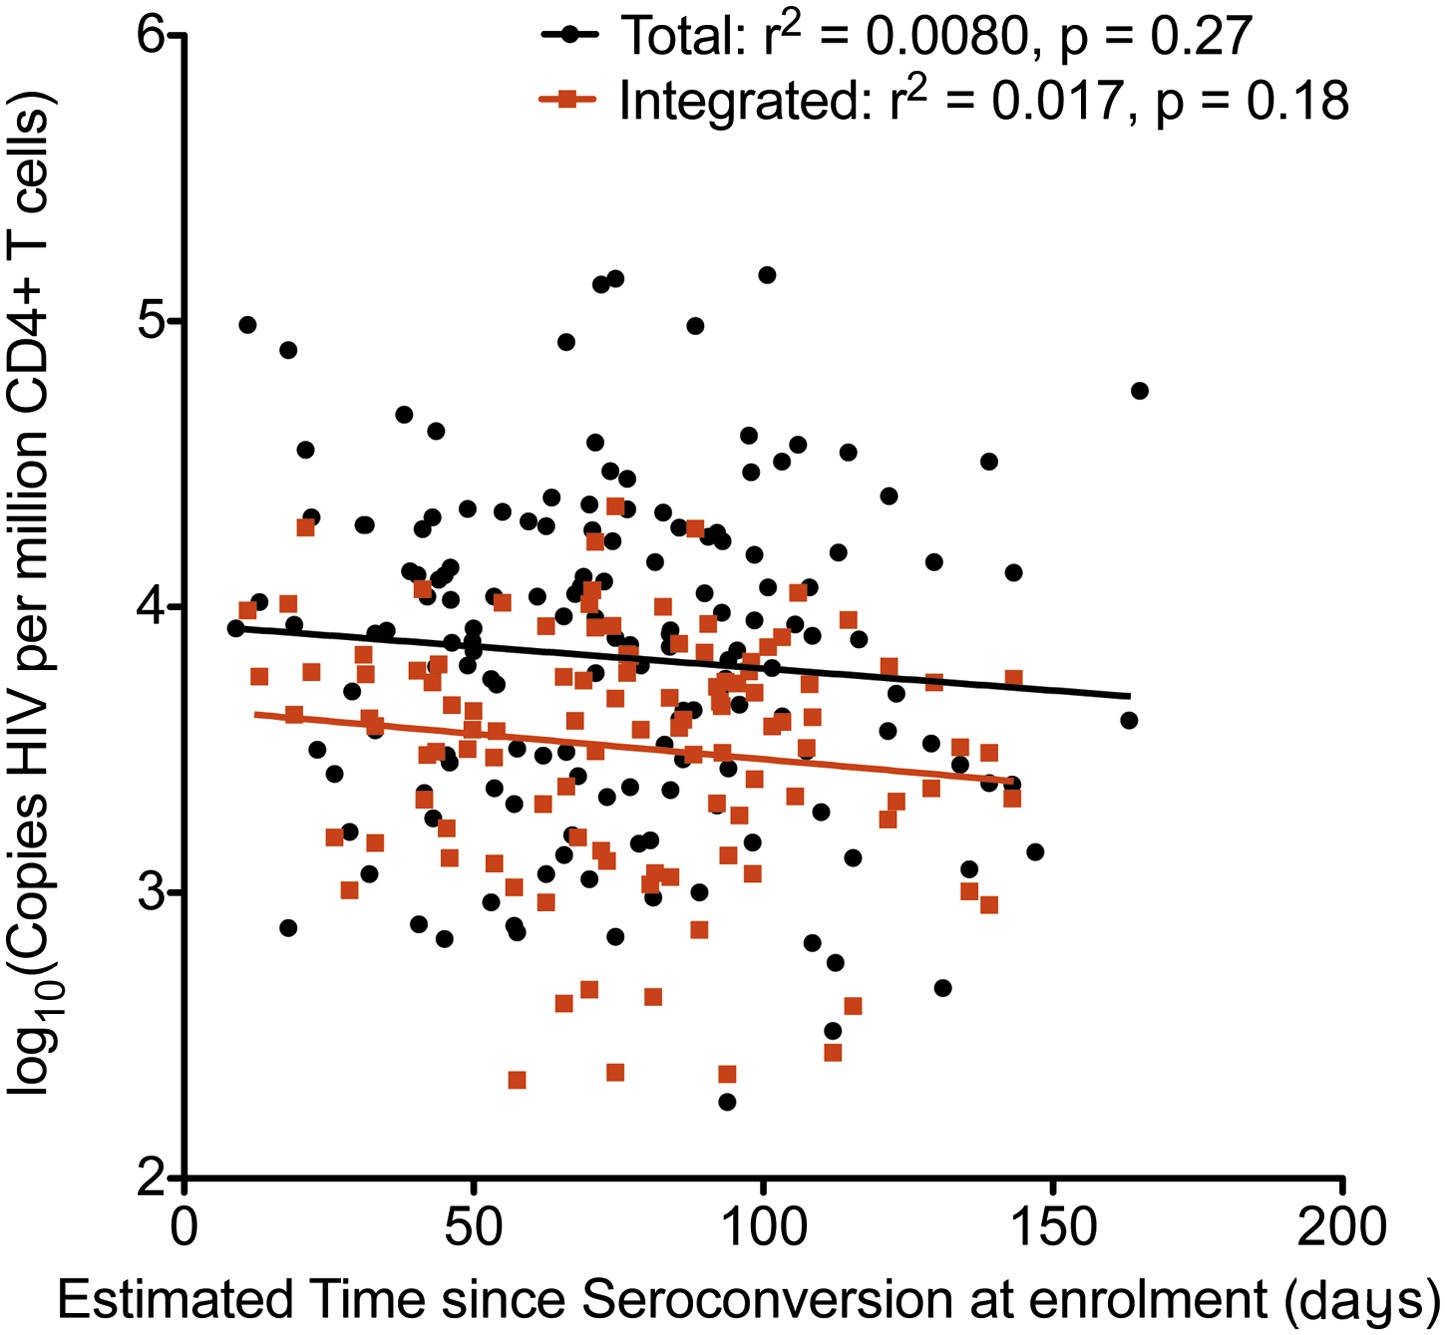
Relationship between estimated time since seroconversion and HIV-1 DNA levels.
Linear regression of HIV-1 DNA levels (Total in black; Integrated in Red) vs the estimated time since seroconversion (weeks) (total n = 154, integrated n = 109).
Figure 2
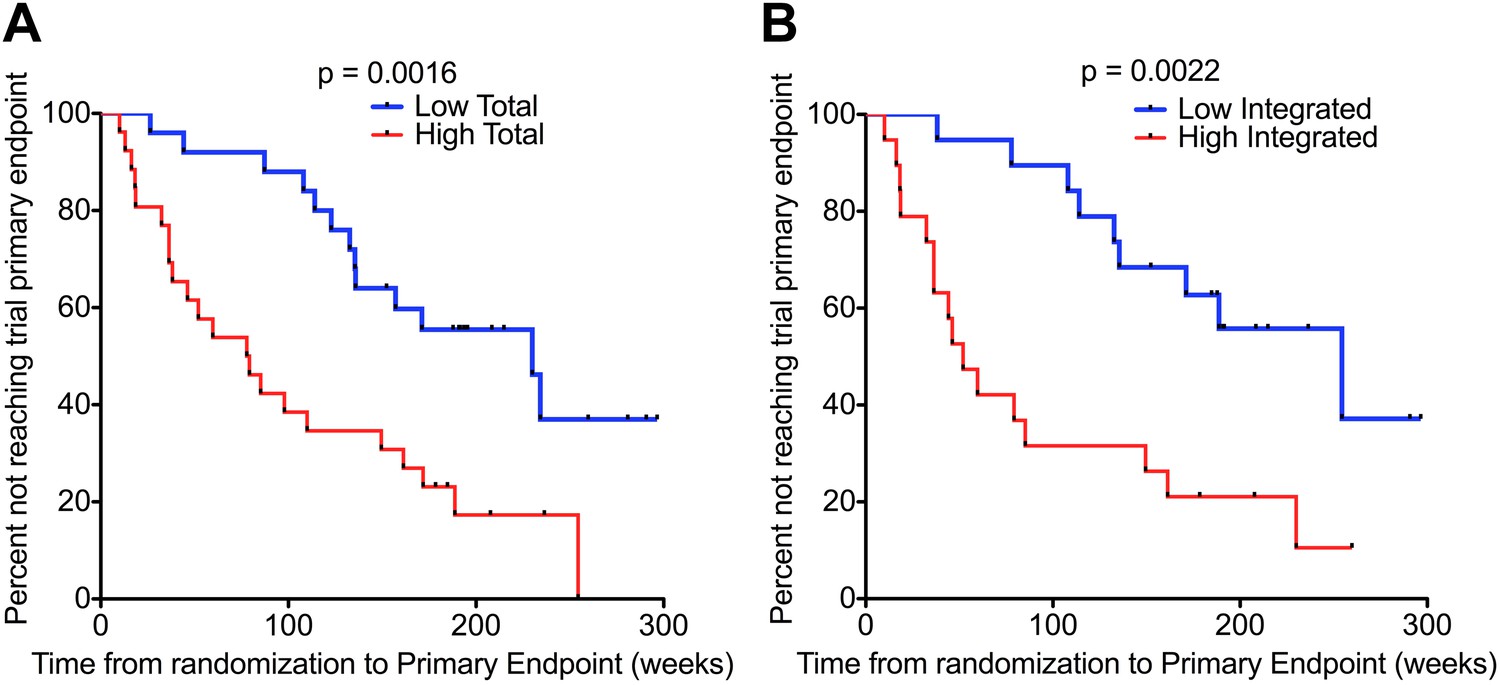
HIV-1 DNA predicts clinical progression in absence of ART.
Kaplan–Meier survival analyses for (A) Total (n = 51) and (B) Integrated (n = 38) HIV-1 DNA and clinical progression, based on time from randomization to the SPARTAC trial primary endpoint of a CD4 T cell count of 350 cells/μl or starting long-term ART. HIV-1 DNA data was divided into two ‘high’ and ‘low’ at the median level, which was 4.02 and 3.61 copies HIV-1 DNA per million CD4 T cells for Total and Integrated, respectively. Significance was determined by log rank test.
Figure 3 with 1 supplement
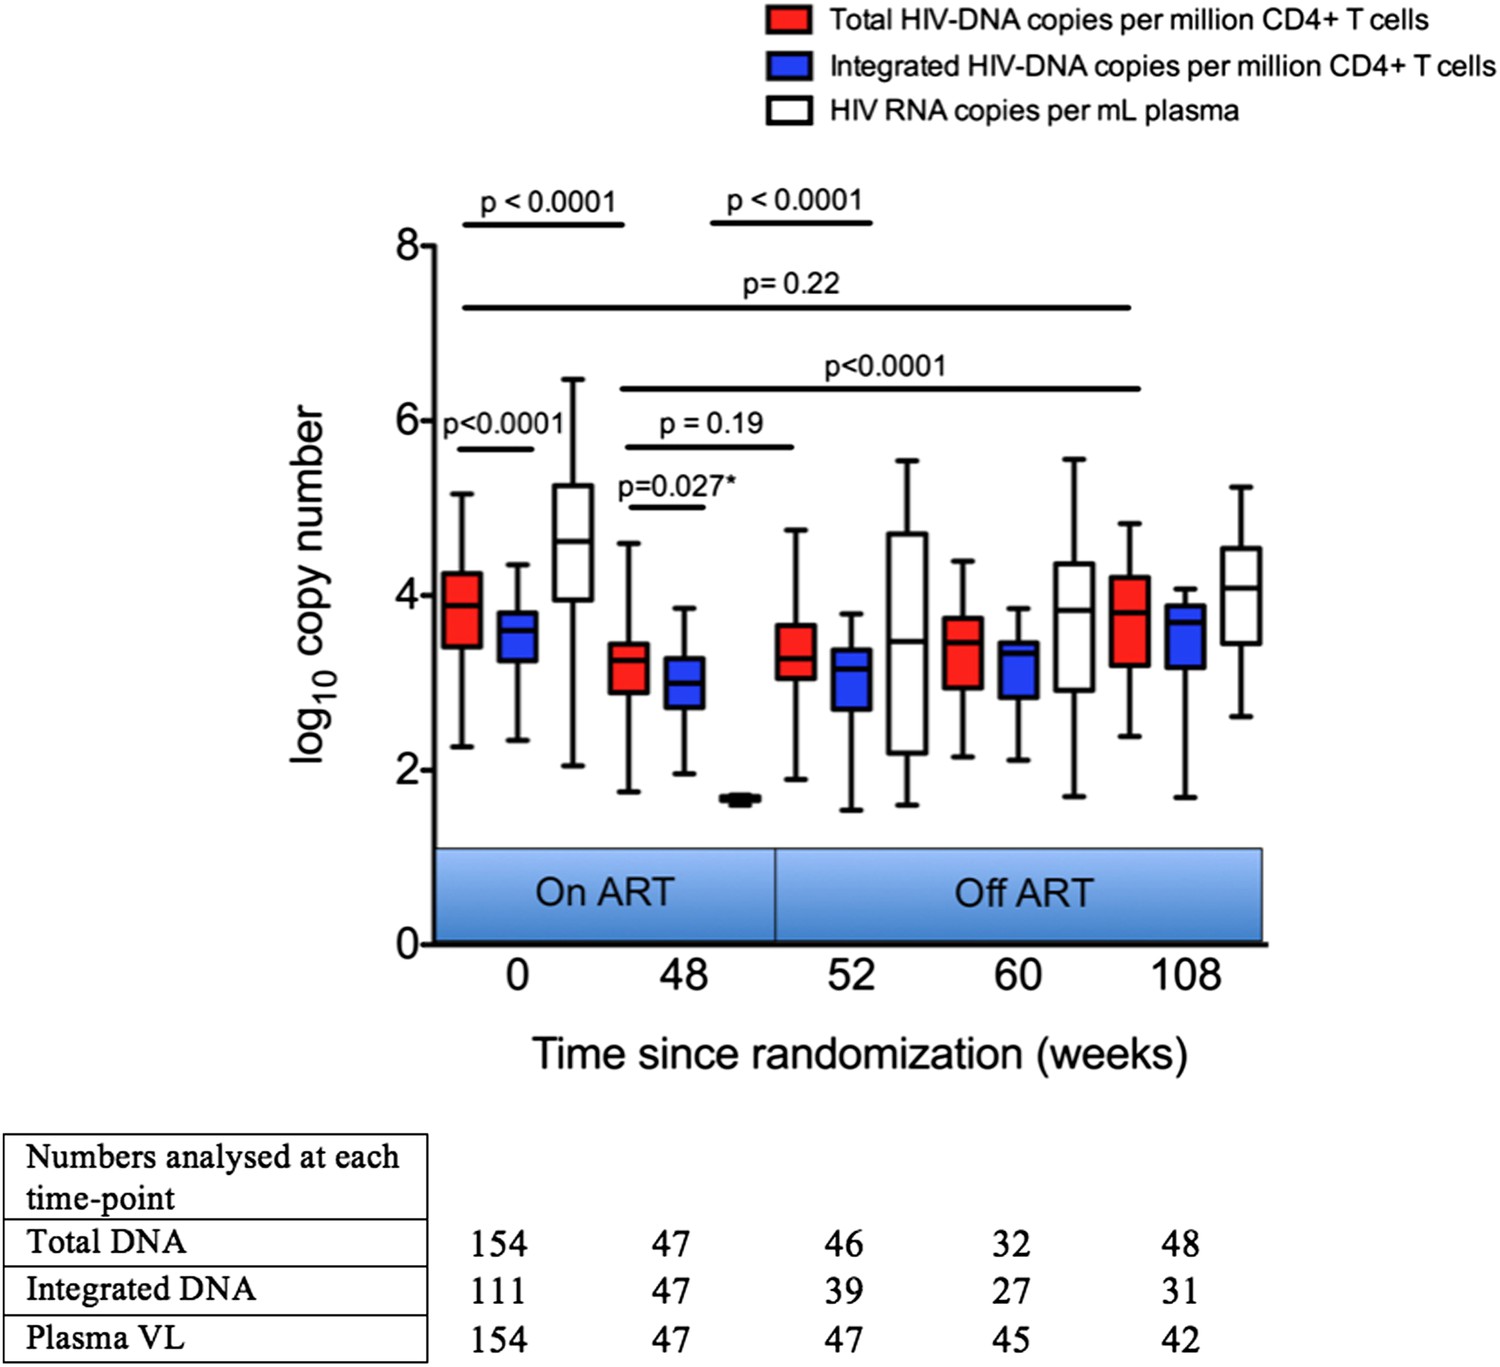
Analysis of impact on HIV-1 DNA of antiretroviral therapy.
Total and Integrated HIV-1 DNA levels and plasma viral load (HIV-1 RNA) were measured at Week 0 ‘baseline’ (in participants from all three trial arms prior to any therapy) and also in those receiving 48 weeks of ART (weeks 48, 52, 60 and 108 after baseline). DNA levels (log10 copies/million CD4 T cells) and viral load (log10 copies/ml plasma) were measured at all time-points, but not all participants were sampled at all time-points dependent on sample availability. Significance was determined by unpaired Students t Tests or paired t test (marker with *) when samples at the two time-points being compared were matched.
Figure 3—figure supplement 1
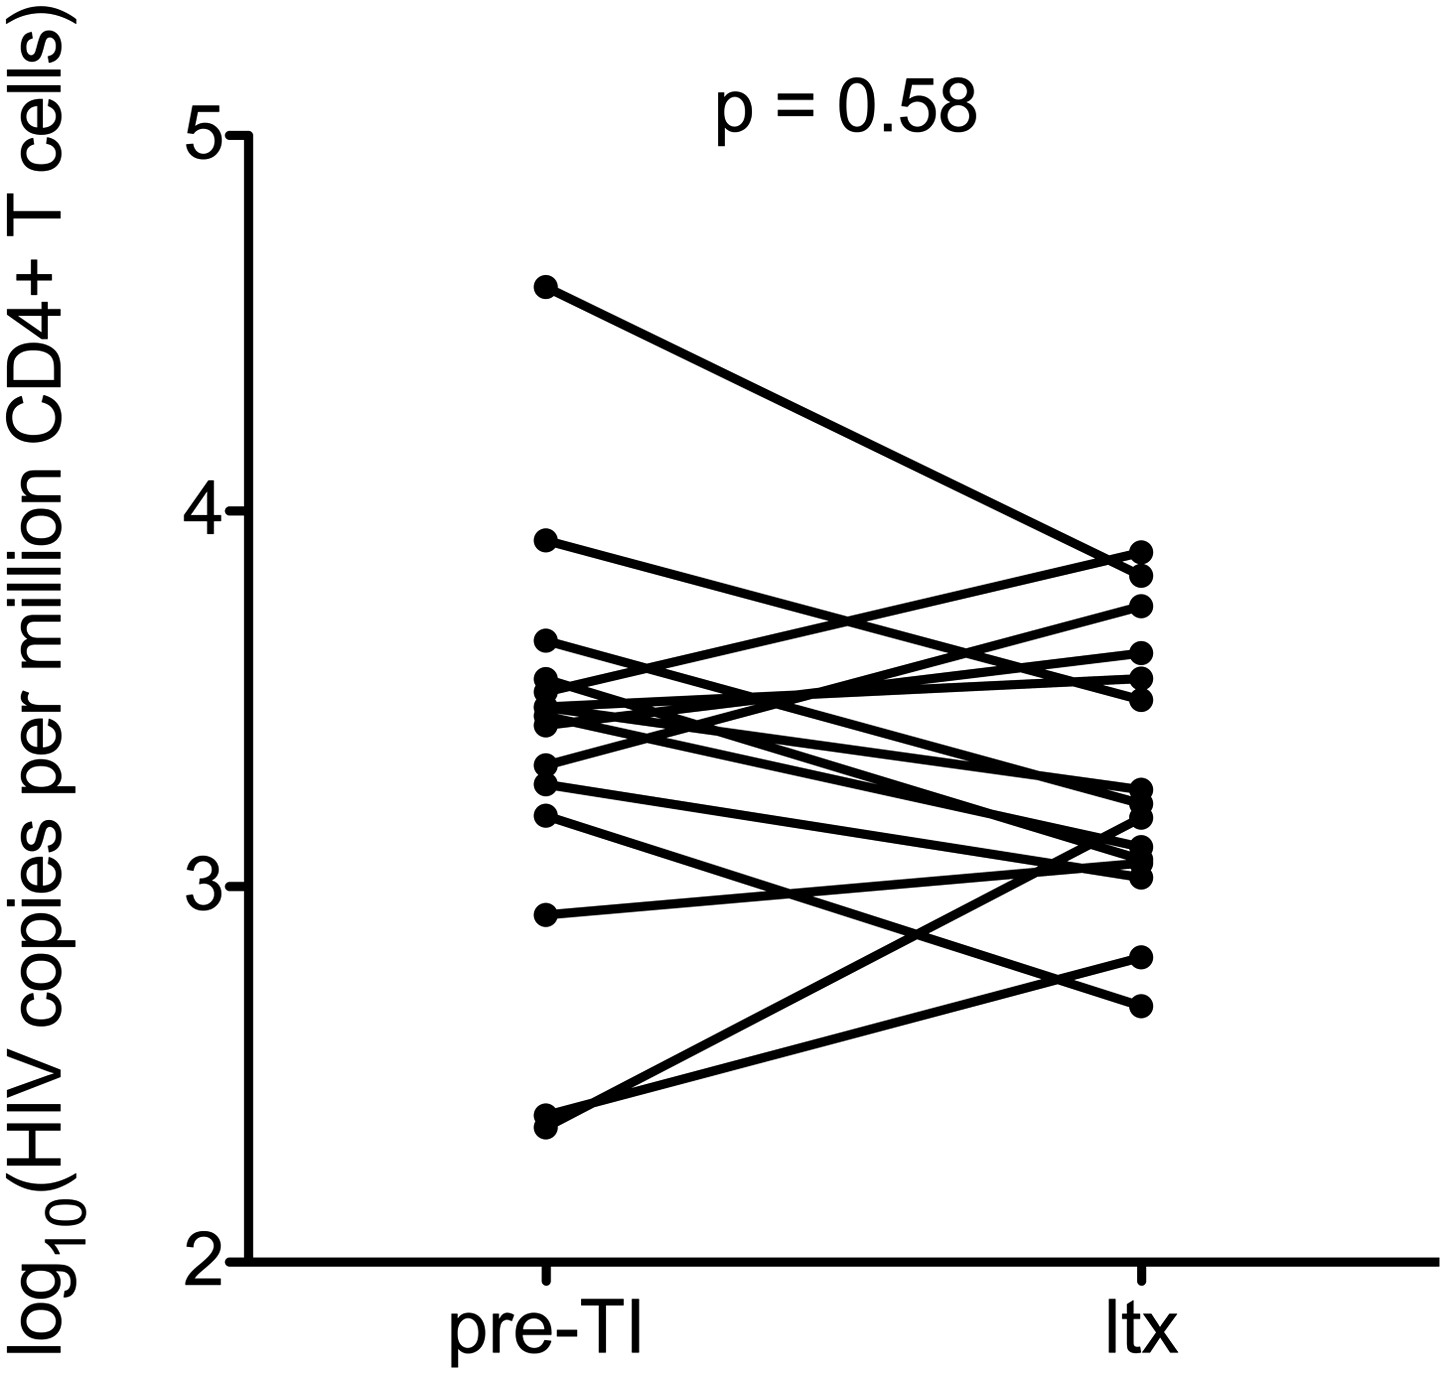
Impact of stopping and re-starting ART on HIV-1 DNA.
Total HIV-1 DNA levels were calculated in 15 patients on ART before TI (pre-TI) These patients subsequently started long-term ART (ltx). DNA was sampled at least 6 months post ltx start date. Significance was established using a paired students t test.
Figure 4
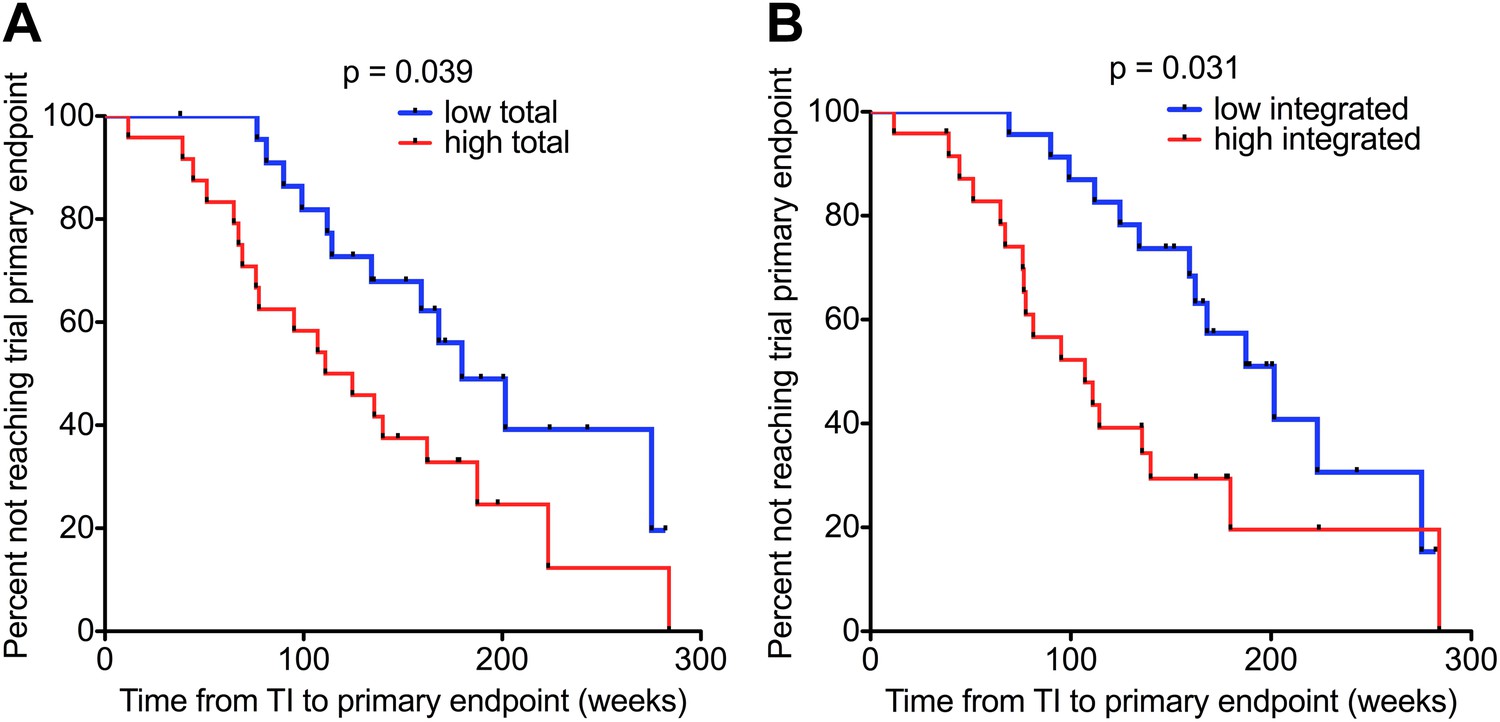
HIV-1 DNA on ART predicts clinical progression following treatment interruption.
Kaplan–Meier survival analyses for (A) Total (n = 47) and (B) Integrated (n = 47) HIV-1 DNA and clinical progression, based on time to the SPARTAC trial primary endpoint of a CD4 T cell count of 350 cells/μl or starting back on long-term ART. HIV-1 DNA data was divided into ‘high’ and ‘low’ at the median. Significance was determined by log rank test. Participants had received a median of 48 weeks of ART and then undertook a treatment interruption. DNA levels were measured at week 48, at the point of stopping ART. Time from TI to primary endpoint is plotted on the x-axis.
Figure 5

HIV-1 DNA at ART interruption predicts time to viral rebound.
Survival analyses of time to viral rebound (weeks) in participants undertaking TI after 48 weeks of ART. HIV-1 DNA levels are presented divided at the median level into high (red) and low (black). Rebound to 400 HIV-1 RNA copies (n = 46) is presented for Total (A) and Integrated (B) HIV-1 DNA. Rebound to 50 HIV-1 RNA copies (n = 45) is presented for Total (C) and Integrated (D) HIV-1 DNA. Significance was determined by log rank test.
Tables
Table 1
Patient demographics
| Total participants available for analysis* | |
|---|---|
| Number | 154 |
| Patients with a Total HIV-1 DNA test | 154 (100%) |
| Patients with an Integrated HIV-1 test | 111 (72%) |
| Log10 baseline Total HIV-1 DNA copies/ml | 3.88 (3.42–4.24) |
| Log10 baseline Integrated HIV-1 DNA copies/ml | 3.6 (3.26–3.79) |
| Time since seroconversion (days) | 73.82 (49.2–95.8) |
| Log10 Baseline Viral Load copies/ml | 4.62 (3.95–5.25) |
| Baseline CD4 Cell count (cells/μl) | 558 (428–680.9) |
| Country of recruitment | |
| Australia | 21 (13.6%) |
| Italy | 18 (12%) |
| Brazil | 13 (8.4%) |
| UK | 102 (66.2%) |
| Viral Subtype (%) | B (100%) |
| Sex | |
| Female | 4 (3%) |
| Male | 150 (97%) |
-
Data shown are values (% of non-missing values) for categorical data or medians and interquartile ranges in brackets for continuous variables.
-
*
At the week 0 ‘baseline’ timepoint’. A subset of these patients (Supplementary files 1 and 2) was used for analyses at later time-points.
Table 2
Cox regression models for variables associated with clinical progression in untreated individuals followed up from PHI
| Univariable unadjusted | Multivariable adjusted | |||
|---|---|---|---|---|
| Covariate | HR (95% CI) | p Value | HR (95% CI) | p Value |
| Total DNA (log10 DNA copies) | 4.16 (2.1–8.26) | <0.001 | 3.57 (1.58–8.08) | 0.002 |
| Viral load (log10 RNA copies) | 1.74 (1.14–2.67) | 0.011 | 1.25 (0.80–1.95) | 0.33 |
| CD4+ T cell count/100 cells | 0.66 (0.53–0.82) | <0.001 | 0.67 (0.53–0.84) | <0.001 |
-
Univariable and multivariable cox regression models were used to determine predictors of clinical progression in untreated individuals followed up from Primary HIV-1 Infection. Progression was determined according to reaching the SPARTAC trial primary endpoint (Chun et al., 2010). Co-variables analysed were baseline (i.e. first pre-therapy trial sample) Total HIV-1 DNA, baseline plasma viral load and baseline CD4+ T cell count.
Additional files
-
Supplementary file 1
Additional demographics of randomized participants included in untreated and 48 week short-course ART analyses Demographics of participants available for analyses of those randomised to receive either no therapy from PHI (first column) and those randomised to receive 48 of weeks of ART from PHI (second column). Data as indicated were: † determined at pre-therapy baseline (trial week 0), * determined at week 48, prior to TI or + median (interquartile range). SOC: Standard of Care trial arm.
- https://doi.org/10.7554/eLife.03821.014
-
Supplementary file 2
Sample numbers available at each time-point by trial randomization. Numbers of samples available at each time-point are presented. Participants from all three trial arms were included at week 0 as they were all treatment naïve at this point. Not all patients at any one time-point are always represented at other time-points due to variation in sample availability. Trial arms: SOC: Standard of Care (untreated); ART-48: 48 weeks of ART after randomization; ART-12: 12 weeks of ART after randomization.
- https://doi.org/10.7554/eLife.03821.015
-
Supplementary file 3
Cox regression models for variables associated with time to rebound of 400 copies/ml and sampled at wk48. Table to show results of Cox regression analysis for time to virological rebound of 400 copies/ml of plasma with Total DNA and CD4 T cell count as covariables. Univariable and multivariable data are presented with Hazard Ratios (HR) with 95% Confidence Intervals (CI) and associated P values.
- https://doi.org/10.7554/eLife.03821.016
-
Supplementary file 4
2 × 2 table comparing the number of patients with different times to 50 and 400 copy/ml rebound and their total and integrated pre-TI HIV-1 DNA levels. Table to compare the association between HIV-1 DNA levels at TI (both Total and Integrated) and time to a plasma viral load of either between 50–400 copies/ml or greater than 400 copies/ml. HIV-1 DNA levels were split into ‘high’ and ‘low’ by the median value. The proportions are significantly different by Fisher's exact test for Total (p = 0.0074) but not Integrated HIV-1-DNA levels (p = 0.091).
- https://doi.org/10.7554/eLife.03821.017
Download links
A two-part list of links to download the article, or parts of the article, in various formats.
Downloads (link to download the article as PDF)
Open citations (links to open the citations from this article in various online reference manager services)
Cite this article (links to download the citations from this article in formats compatible with various reference manager tools)
HIV-1 DNA predicts disease progression and post-treatment virological control
eLife 3:e03821.
https://doi.org/10.7554/eLife.03821


