Genetic basis of sRNA quantitative variation analyzed using an experimental population derived from an elite rice hybrid
- Huazhong Agricultural University, China
Figures
Figure 1 with 5 supplements
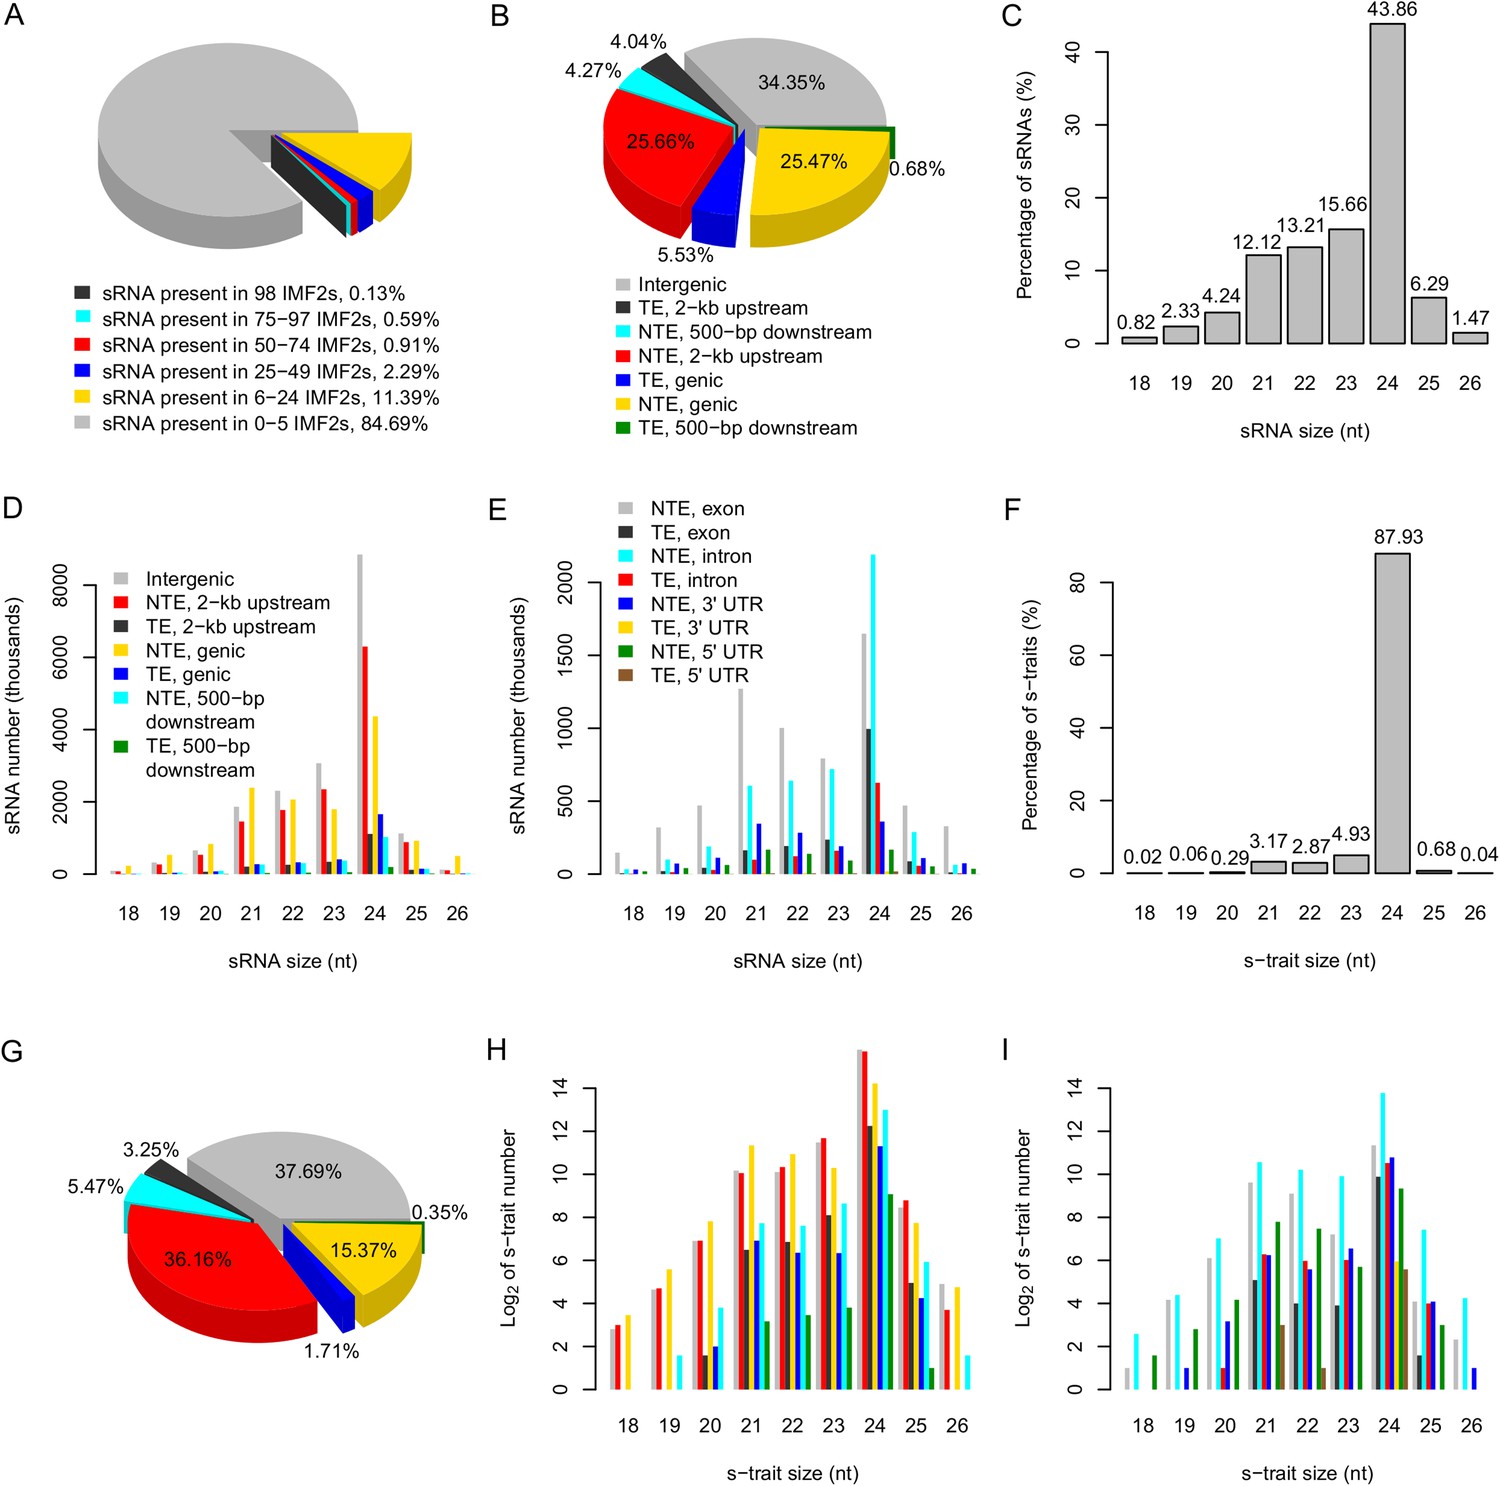
The distribution of sRNAs and s-traits in different genomic regions across the IMF2 population.
(A) The distribution of sRNAs across the IMF2 population. (B) The distribution of sRNAs aligned to the genic region, 2-kb upstream, and 500-bp downstream of annotated genes, as well as intergenic regions. TE: transposons; NTE: non-transposon genes. (C) The percentages of sRNAs of different sizes. (D) The distribution of sRNAs of different sizes in different genomic regions. (E) The distribution of sRNAs of different sizes in different portions of genic regions. (F) The percentages of s-traits of different sizes. (G) The distribution of s-traits aligned to the genic region, 2-kb upstream, and 500-bp downstream of annotated genes, as well as intergenic regions. The legend is the same as in (B). (H) The distribution of s-traits of different size in different genomic regions. The legend is the same as in (D). (I) The distribution of s-traits of different sizes in different portions of genic regions. The legend is the same as in (E).
Figure 1—figure supplement 1
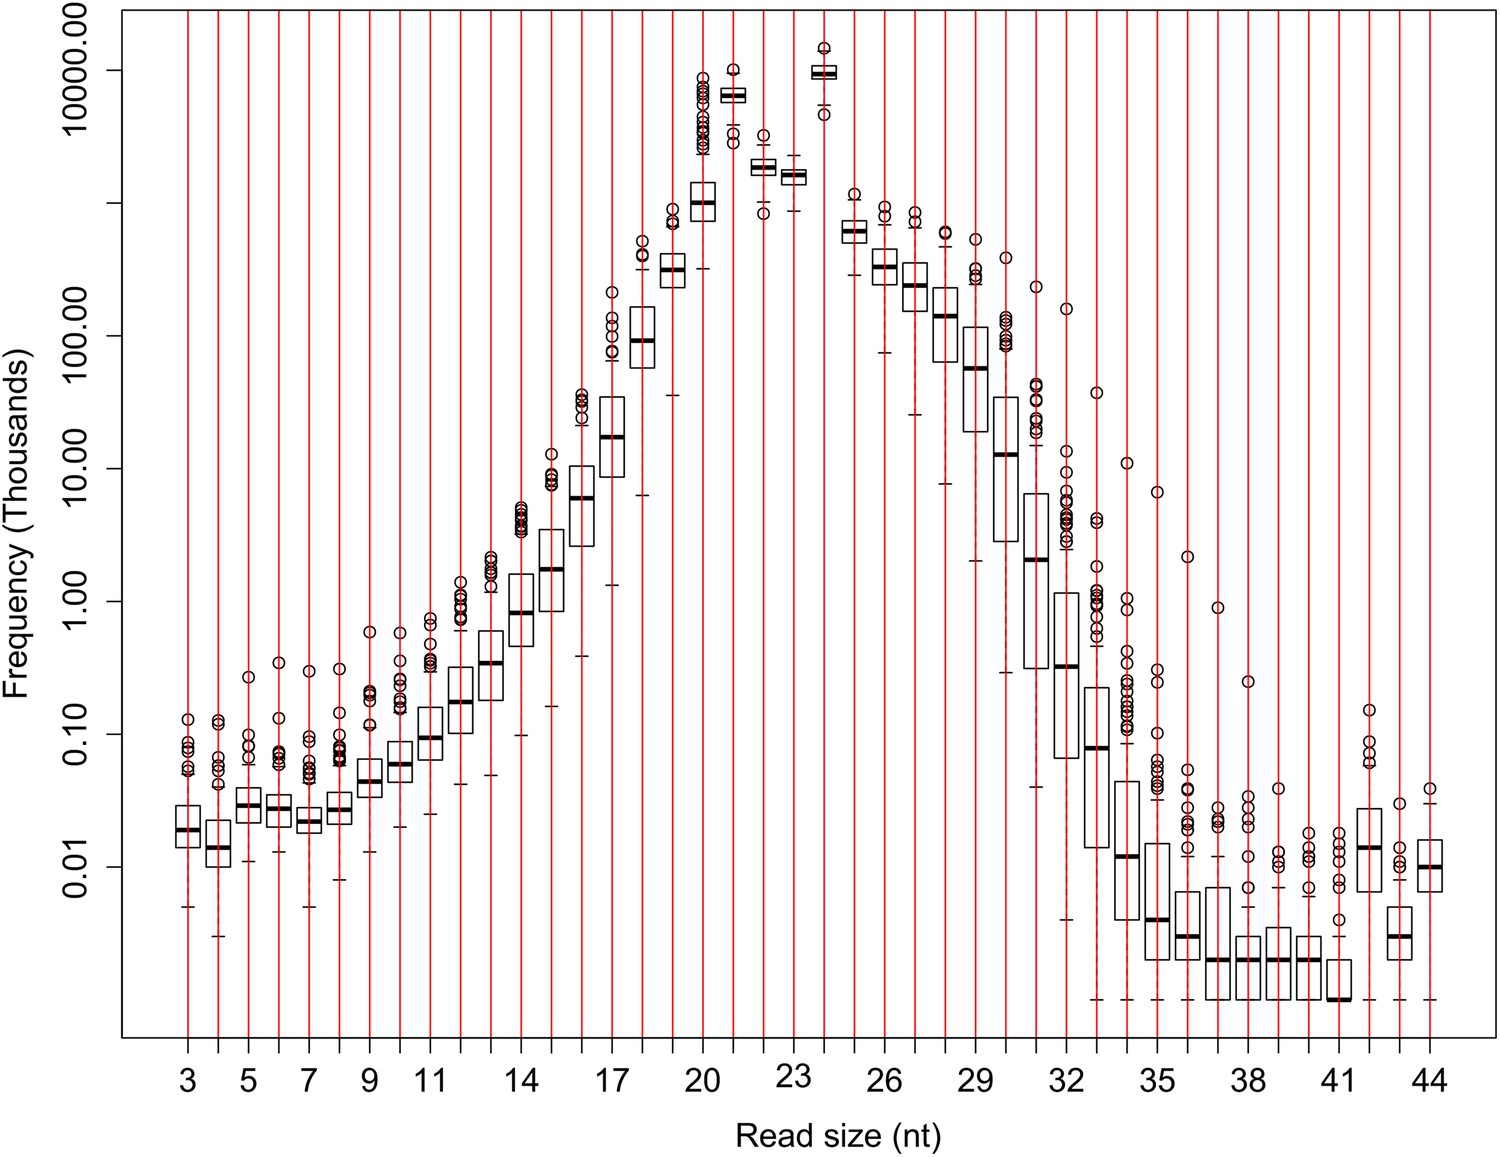
The number of sRNA reads of different lengths in the raw sequencing data of the IMF2 population.
The number of sRNAs with specific length for all the IMF2s is shown as box plot.
Figure 1—figure supplement 2
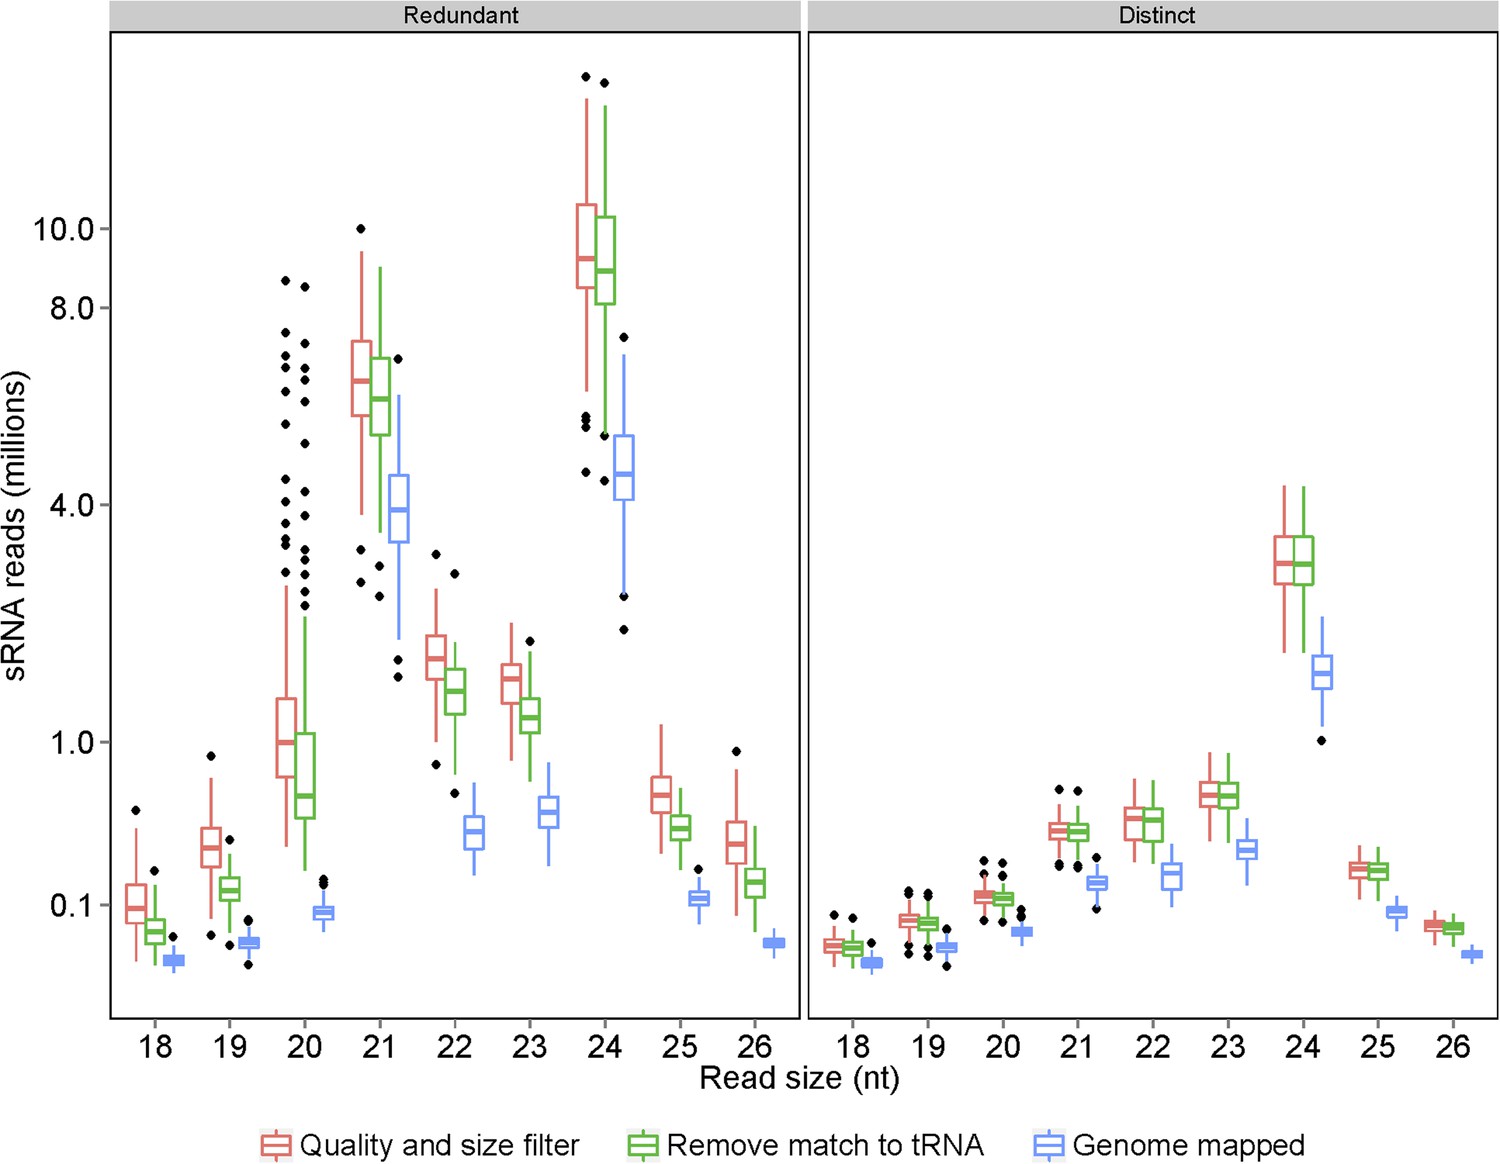
Processing of raw sRNA reads to genome-mapped reads.
The number of sRNAs of specific length in the IMF2 population is shown as box plot.
Figure 1—figure supplement 3
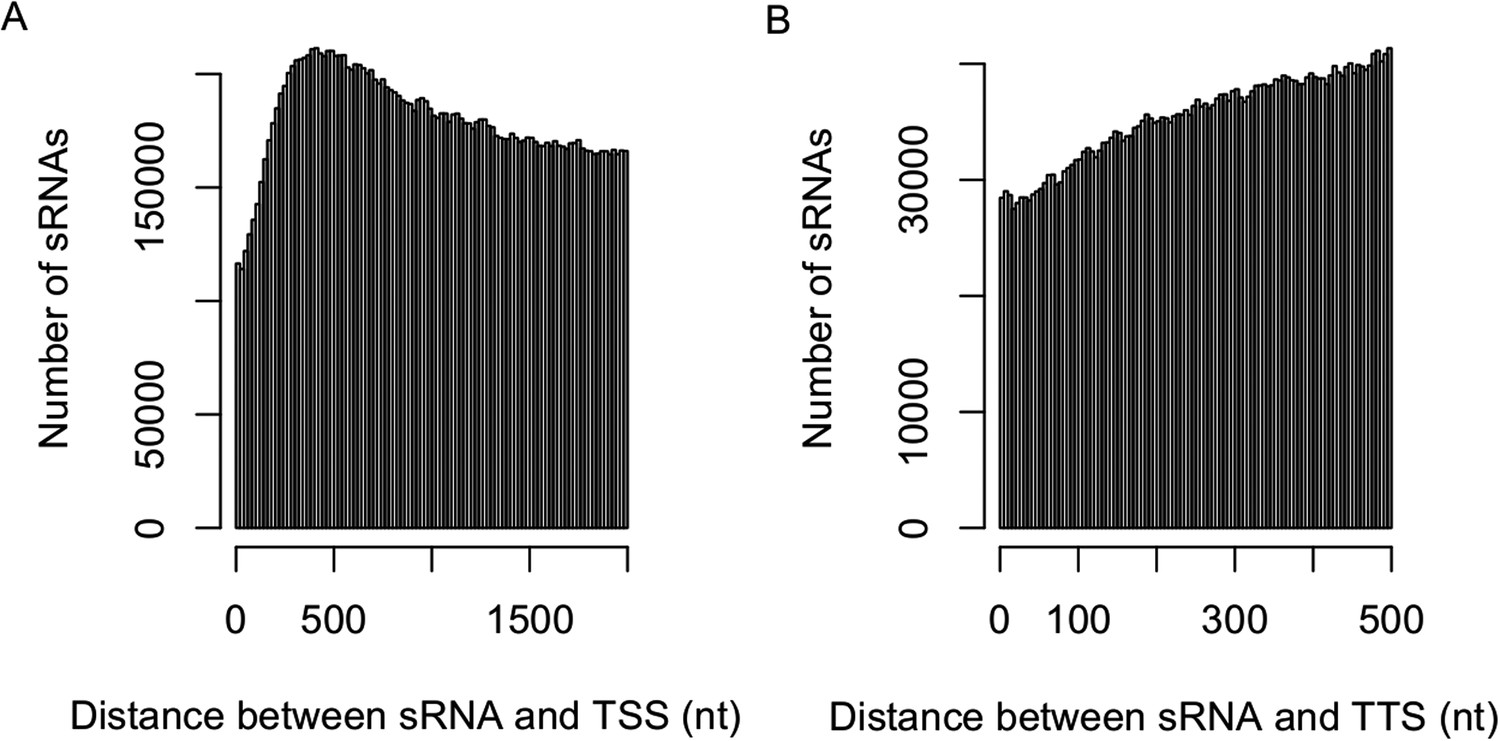
Distribution of sRNAs in the upstream and downstream of genic regions.
The distribution of the distance between sRNAs and transcription start site (TSS) (2-kb upstream) (A) and transcription termination site (TTS) (500-bp downstream) (B).
Figure 1—figure supplement 4
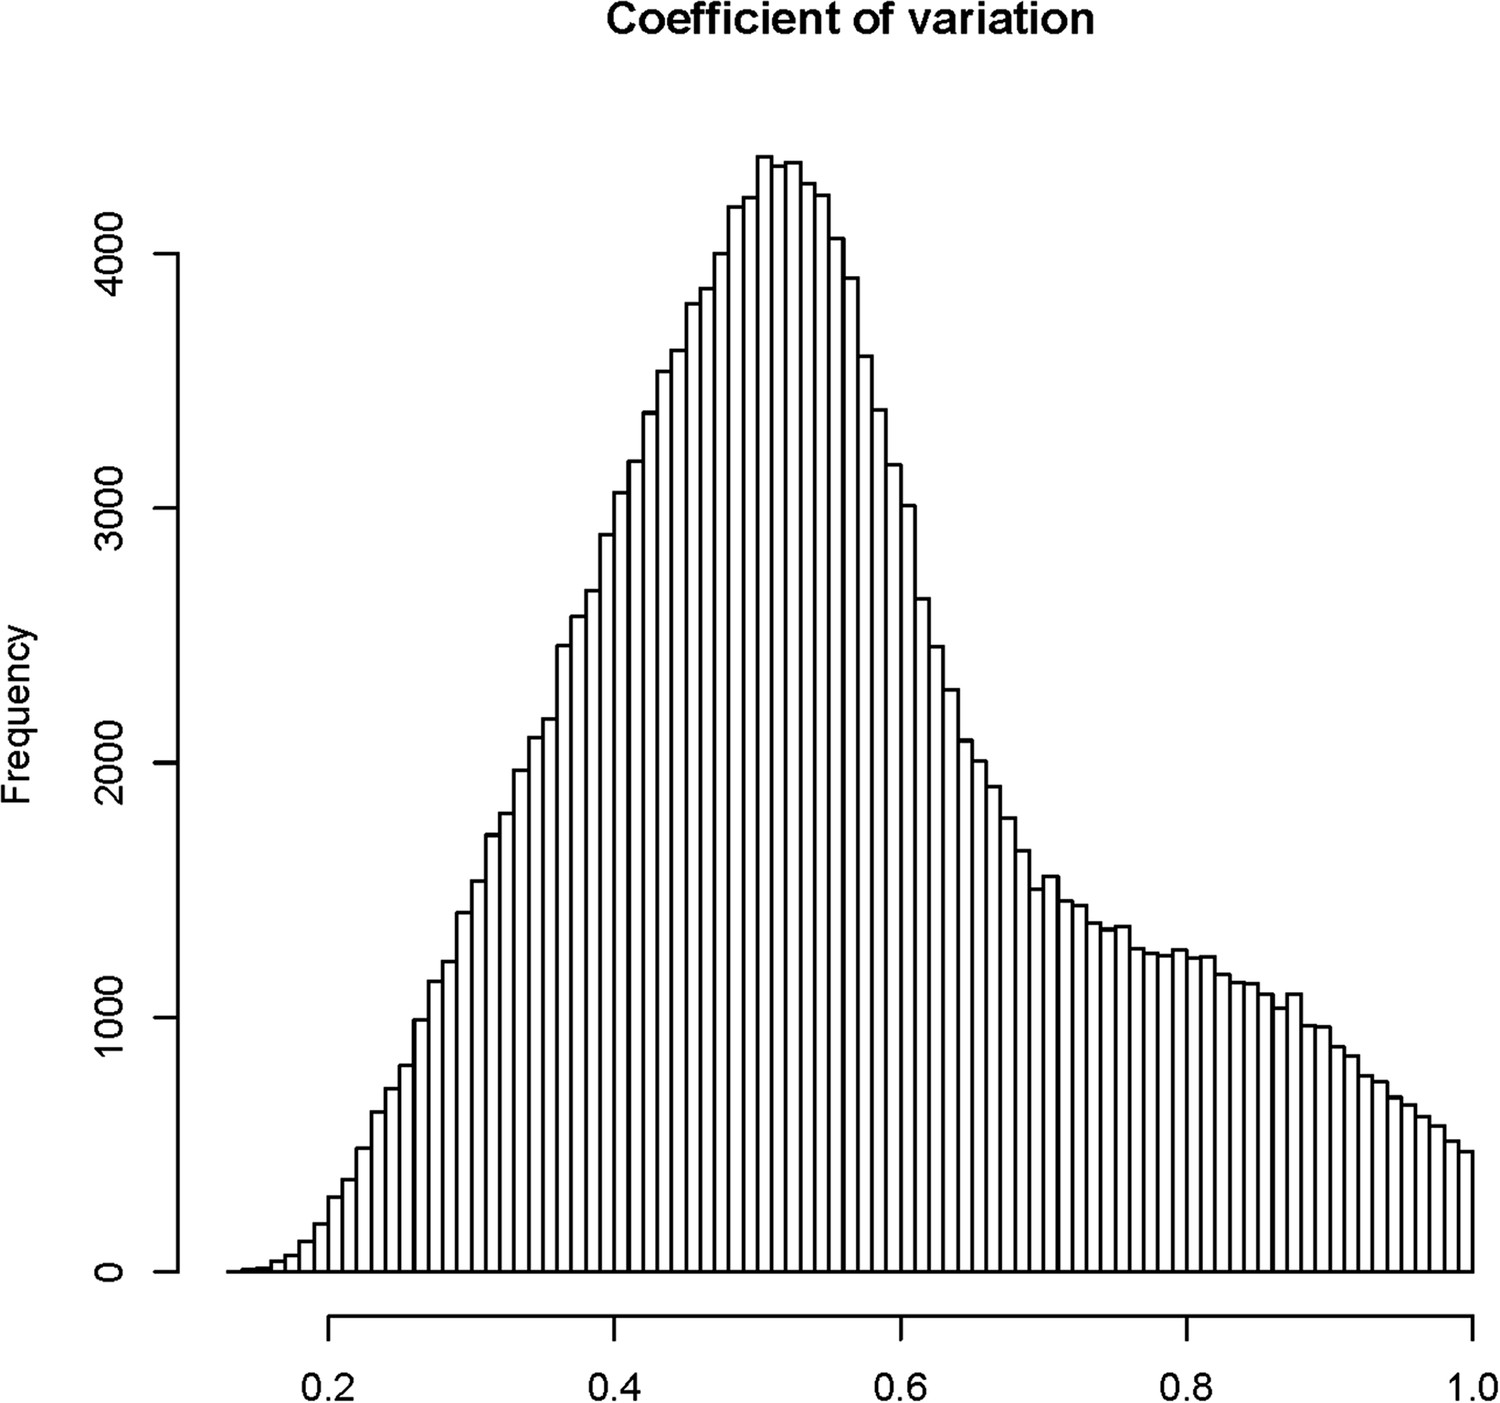
The distribution of coefficients of variation (CV) for 165,797 s-traits.
https://doi.org/10.7554/eLife.03913.008
Figure 1—figure supplement 5
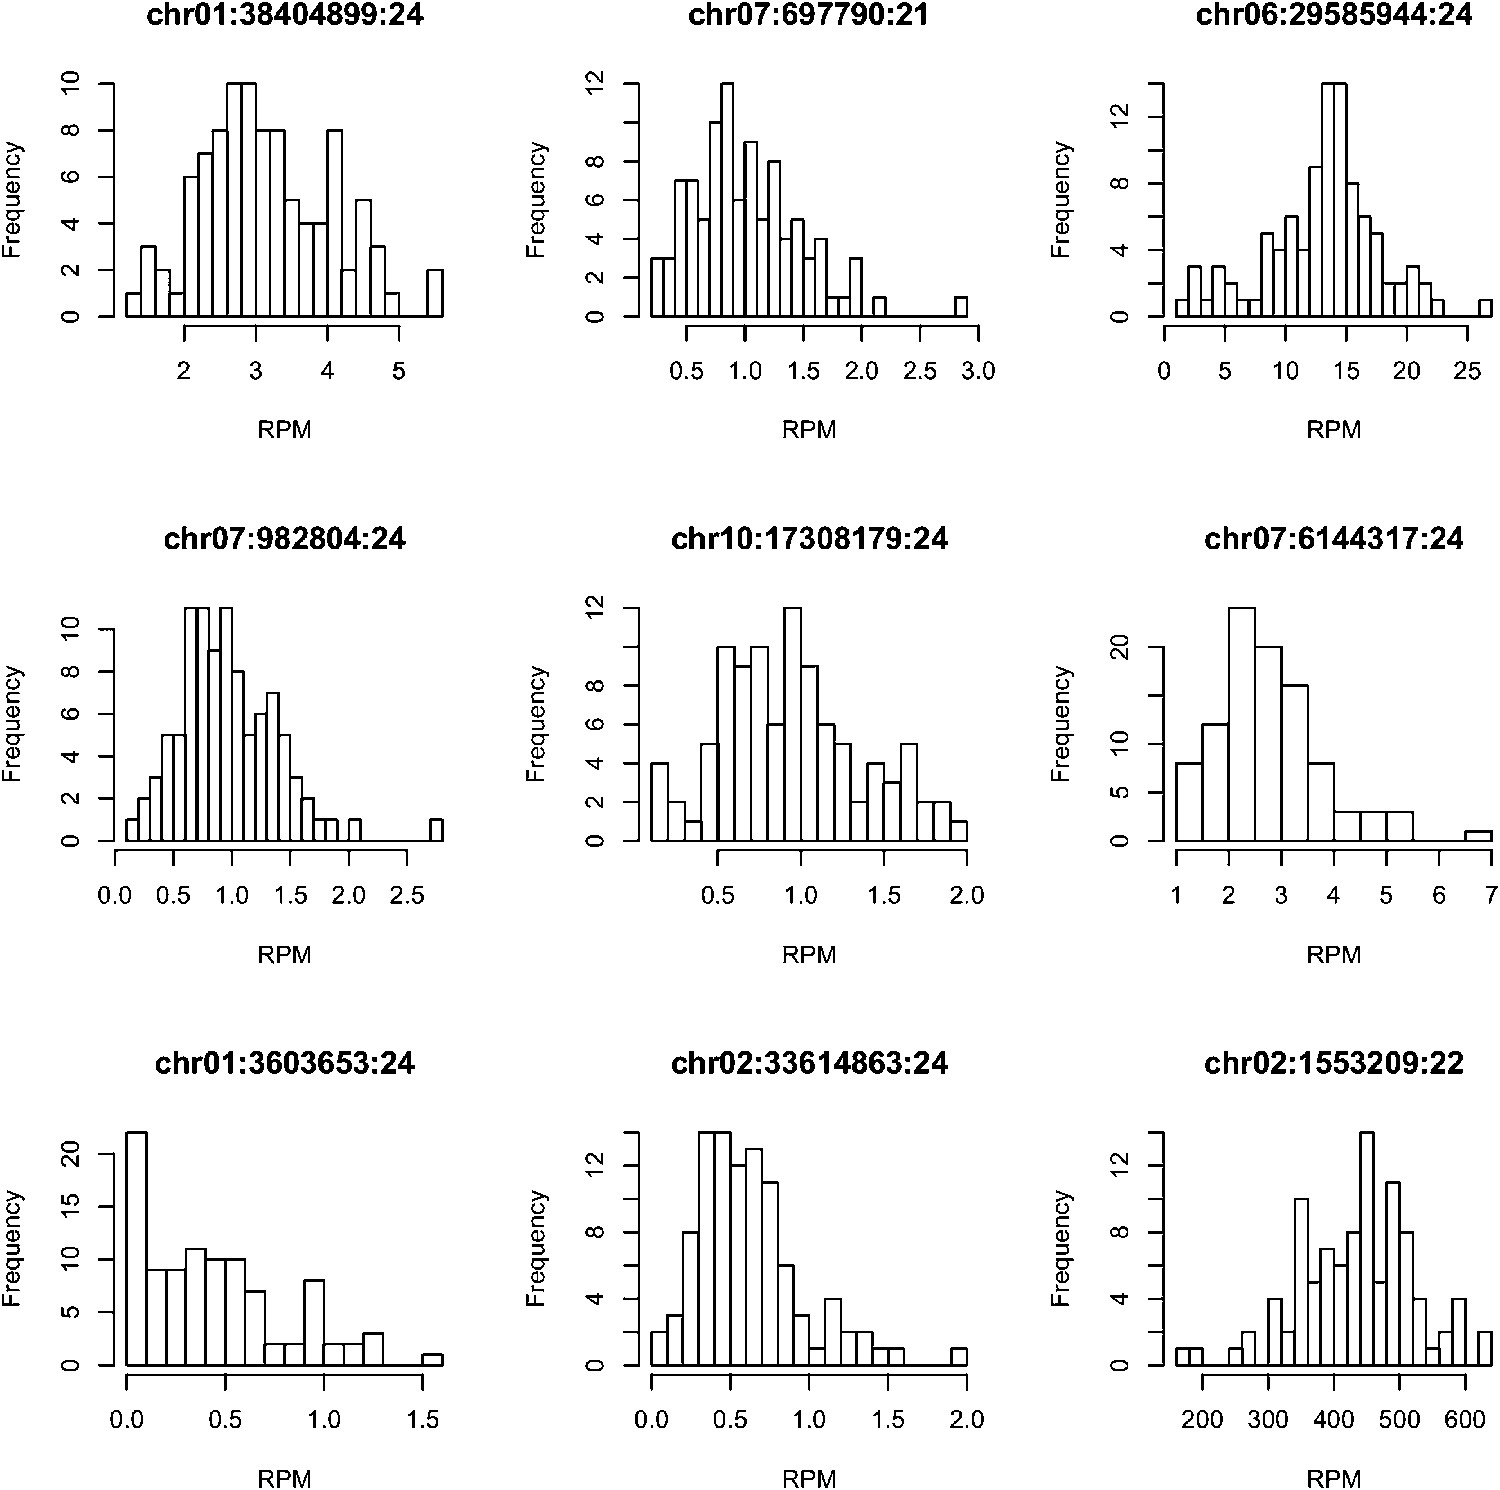
The distributions of the expression values across all the IMF2s for 9 randomly selected s-traits.
https://doi.org/10.7554/eLife.03913.009
Figure 2 with 5 supplements
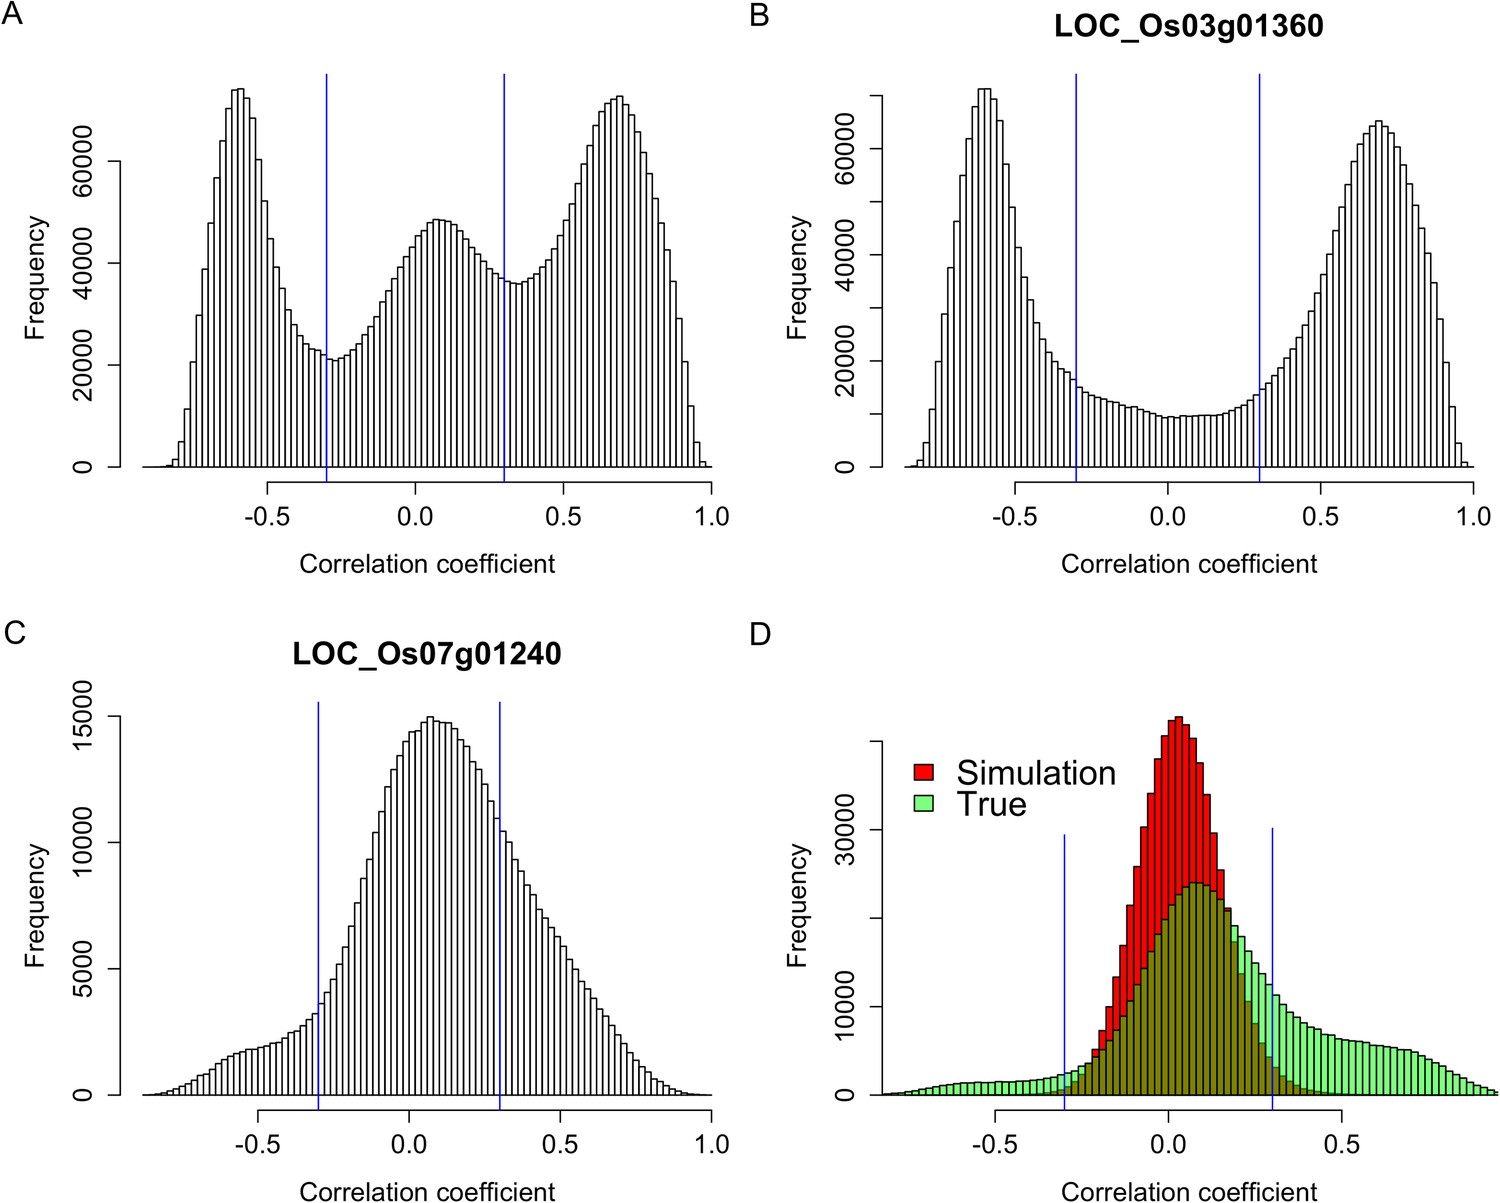
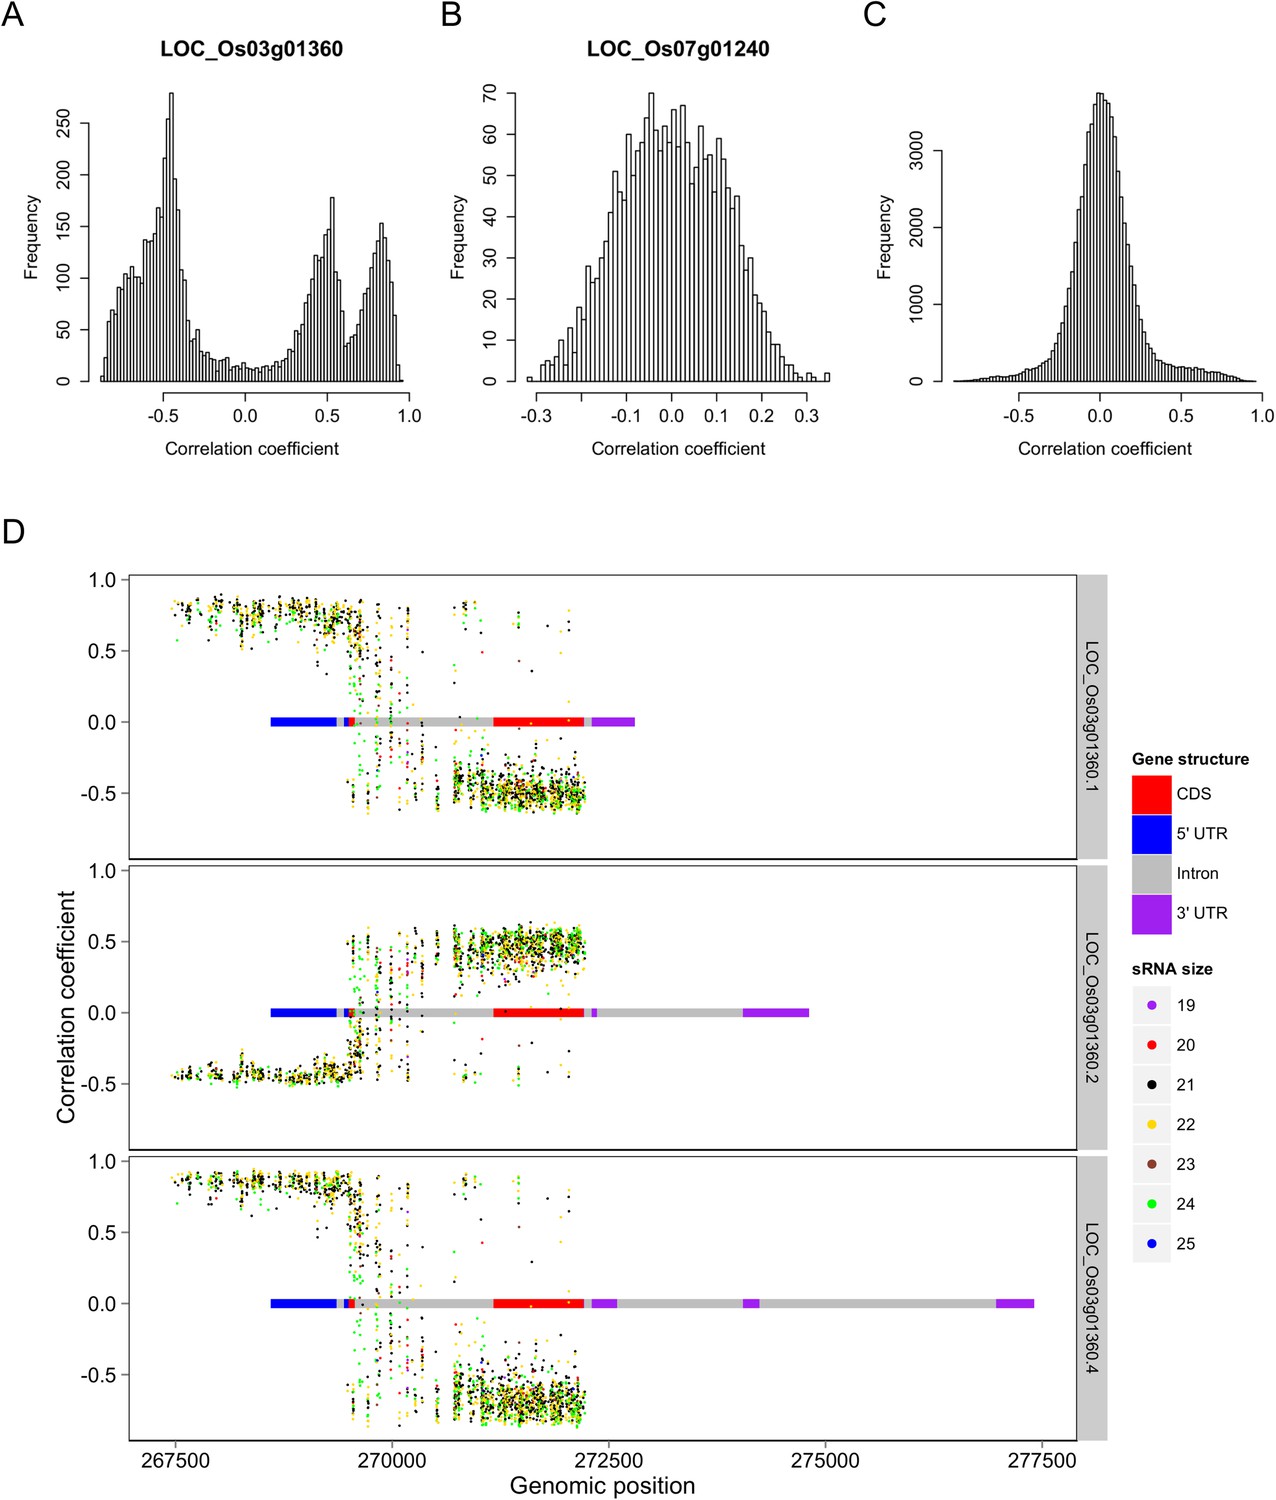
Expression correlations between s-traits originating from the same genes.
(A) The distribution of expression correlations between s-traits originating from the same genes. (B) The distribution of expression correlations between s-traits originating from LOC_Os03g01360. (C) The distribution of expression correlations between s-traits originating from LOC_Os07g01240. (D) Comparison of the distribution of expression correlations for the simulation data and the true data excluding s-traits from LOC_Os03g01360 and LOC_Os07g01240.
Figure 2—figure supplement 1
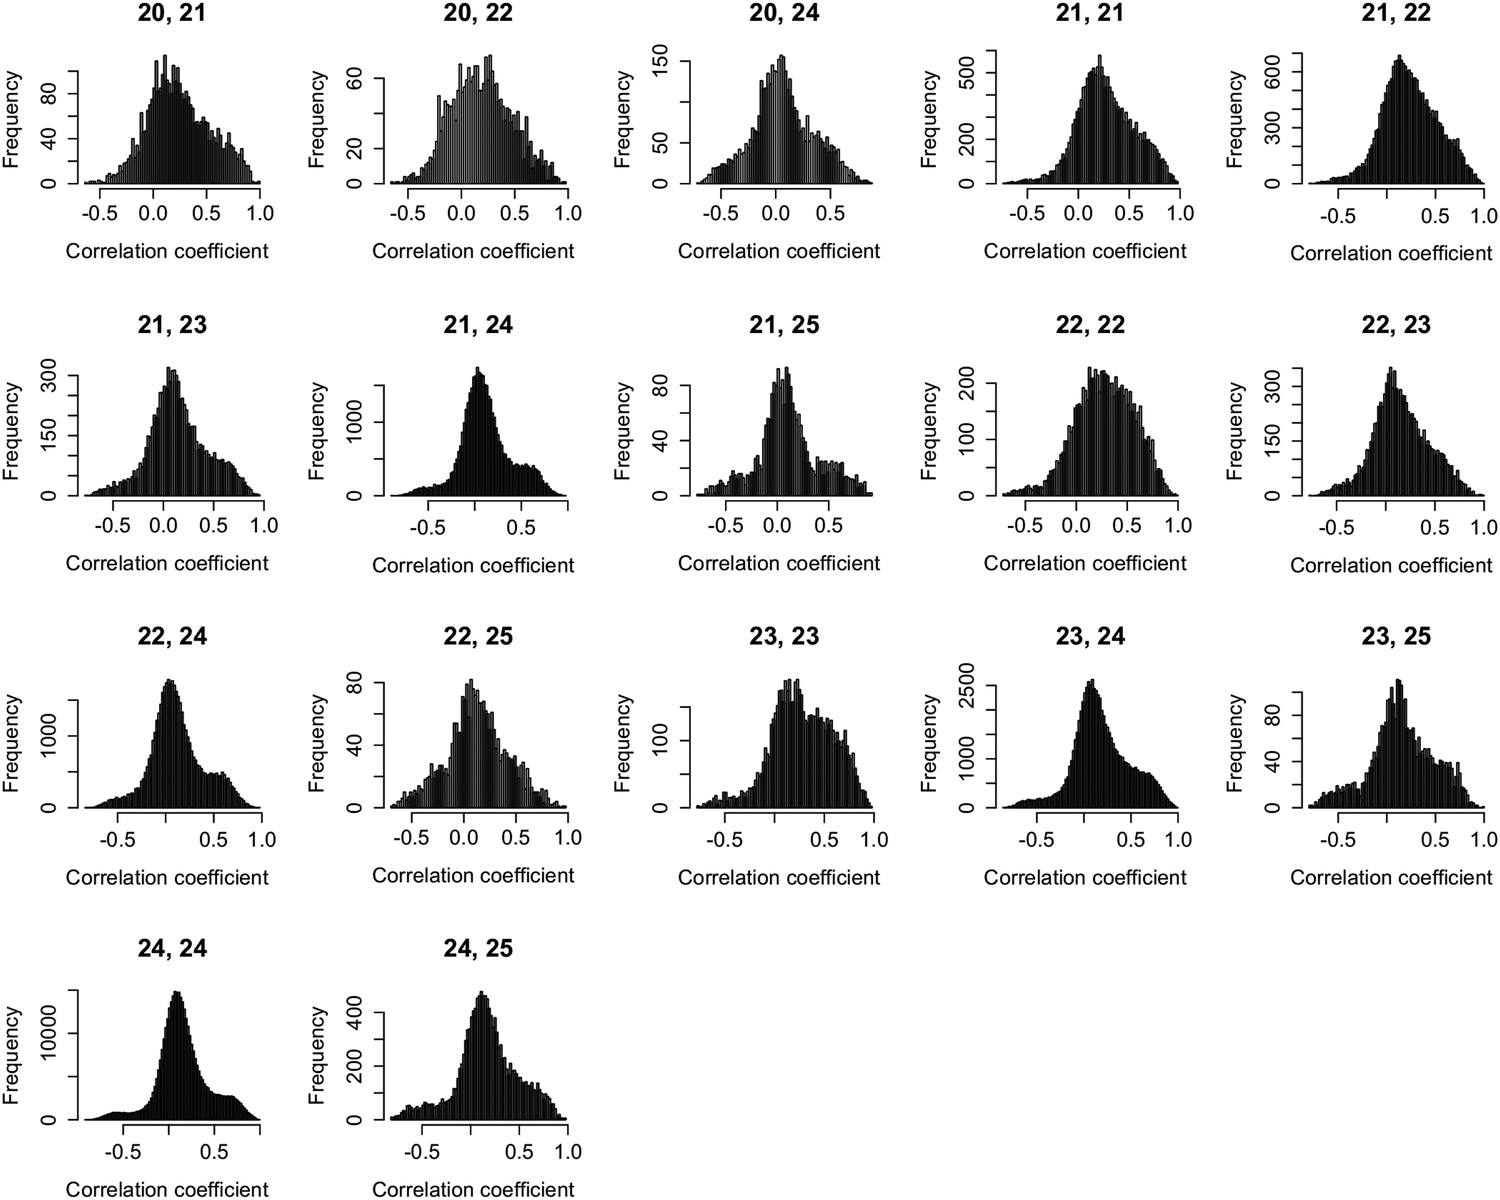
Expression correlations between s-traits of different sizes originating from the same genes.
The s-traits originated from same genes were grouped by their sizes. The expression correlations between s-traits from pairs of groups were calculated, and results with more than 2000 correlations are shown in each case. The numbers on top of each plot represent the sizes of two groups of s-traits.
Figure 2—figure supplement 2
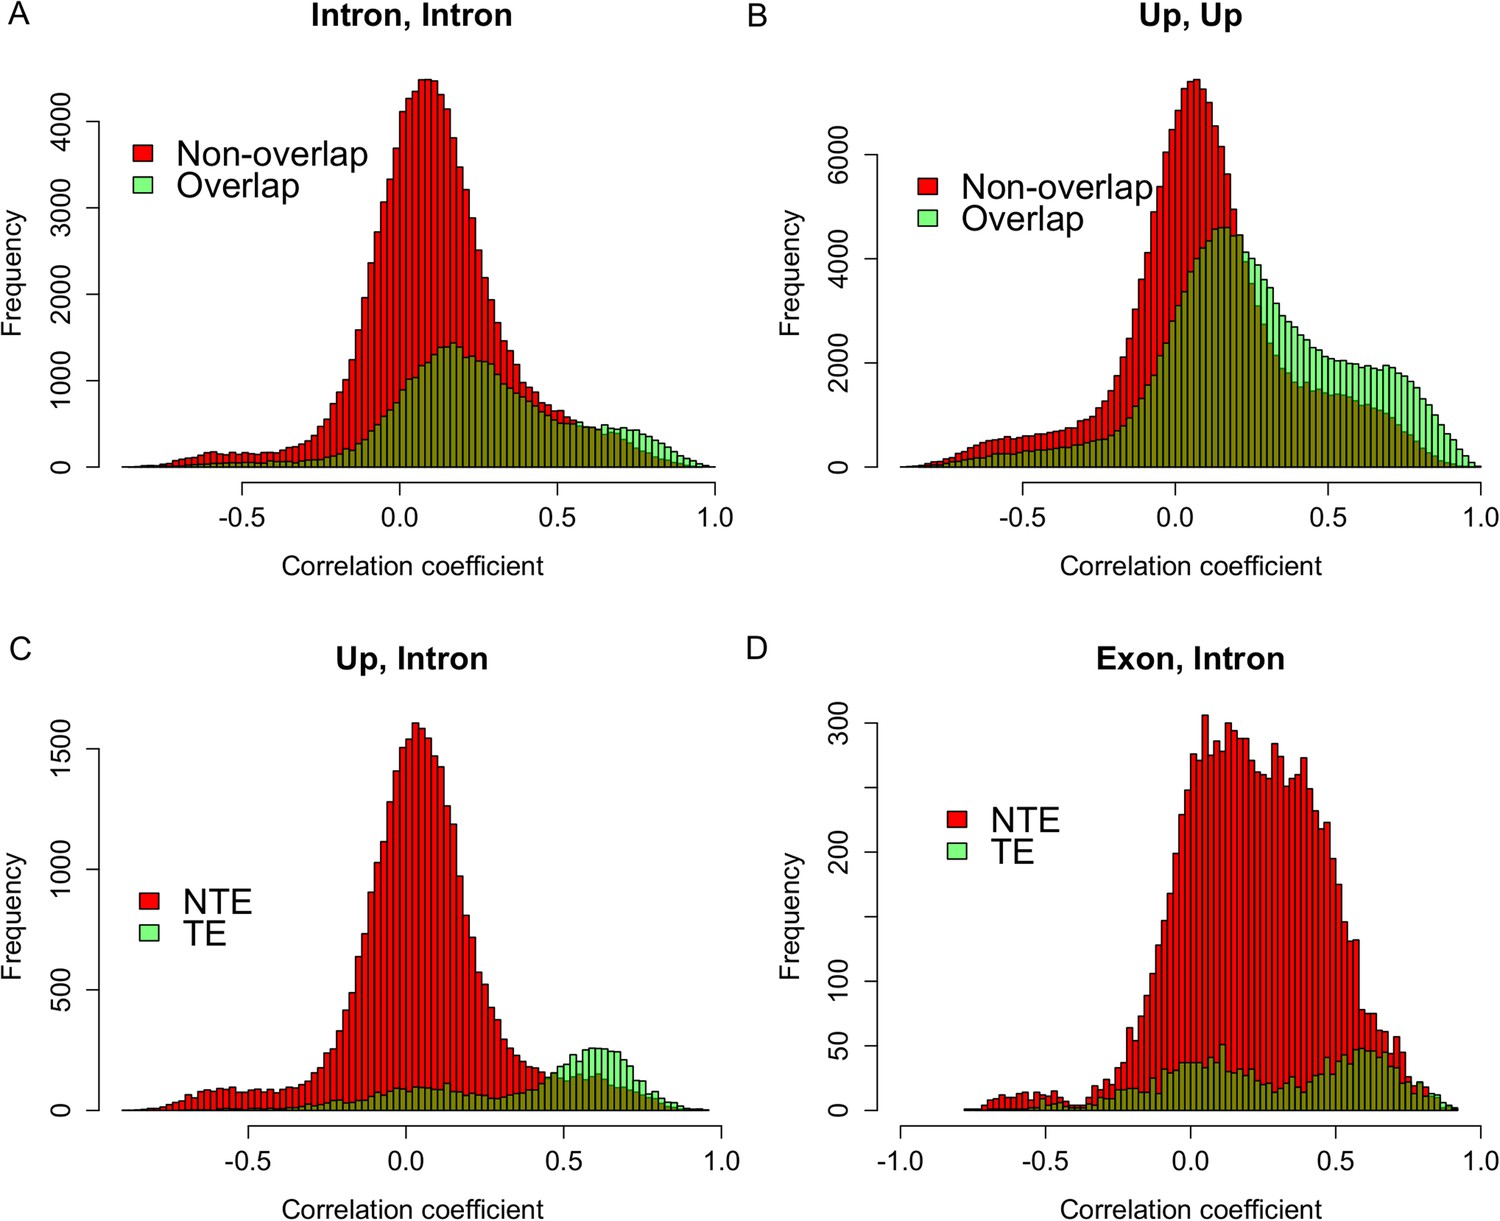
Expression correlations between s-traits originating from different regions of the same mother genes.
(A) The distribution of expression correlations between s-traits originating from introns of the same mother genes. (B) The distribution of expression correlations between s-traits originating from 2-kb upstream of the same mother genes. (C) The distribution of expression correlations between s-traits originating from 2-kb upstream and s-traits from introns of the same mother genes. TE: transposons; NTE: non-transposon genes. (D) The distribution of expression correlations between s-traits originating from exons and s-traits from introns of the same mother genes.
Figure 2—figure supplement 3
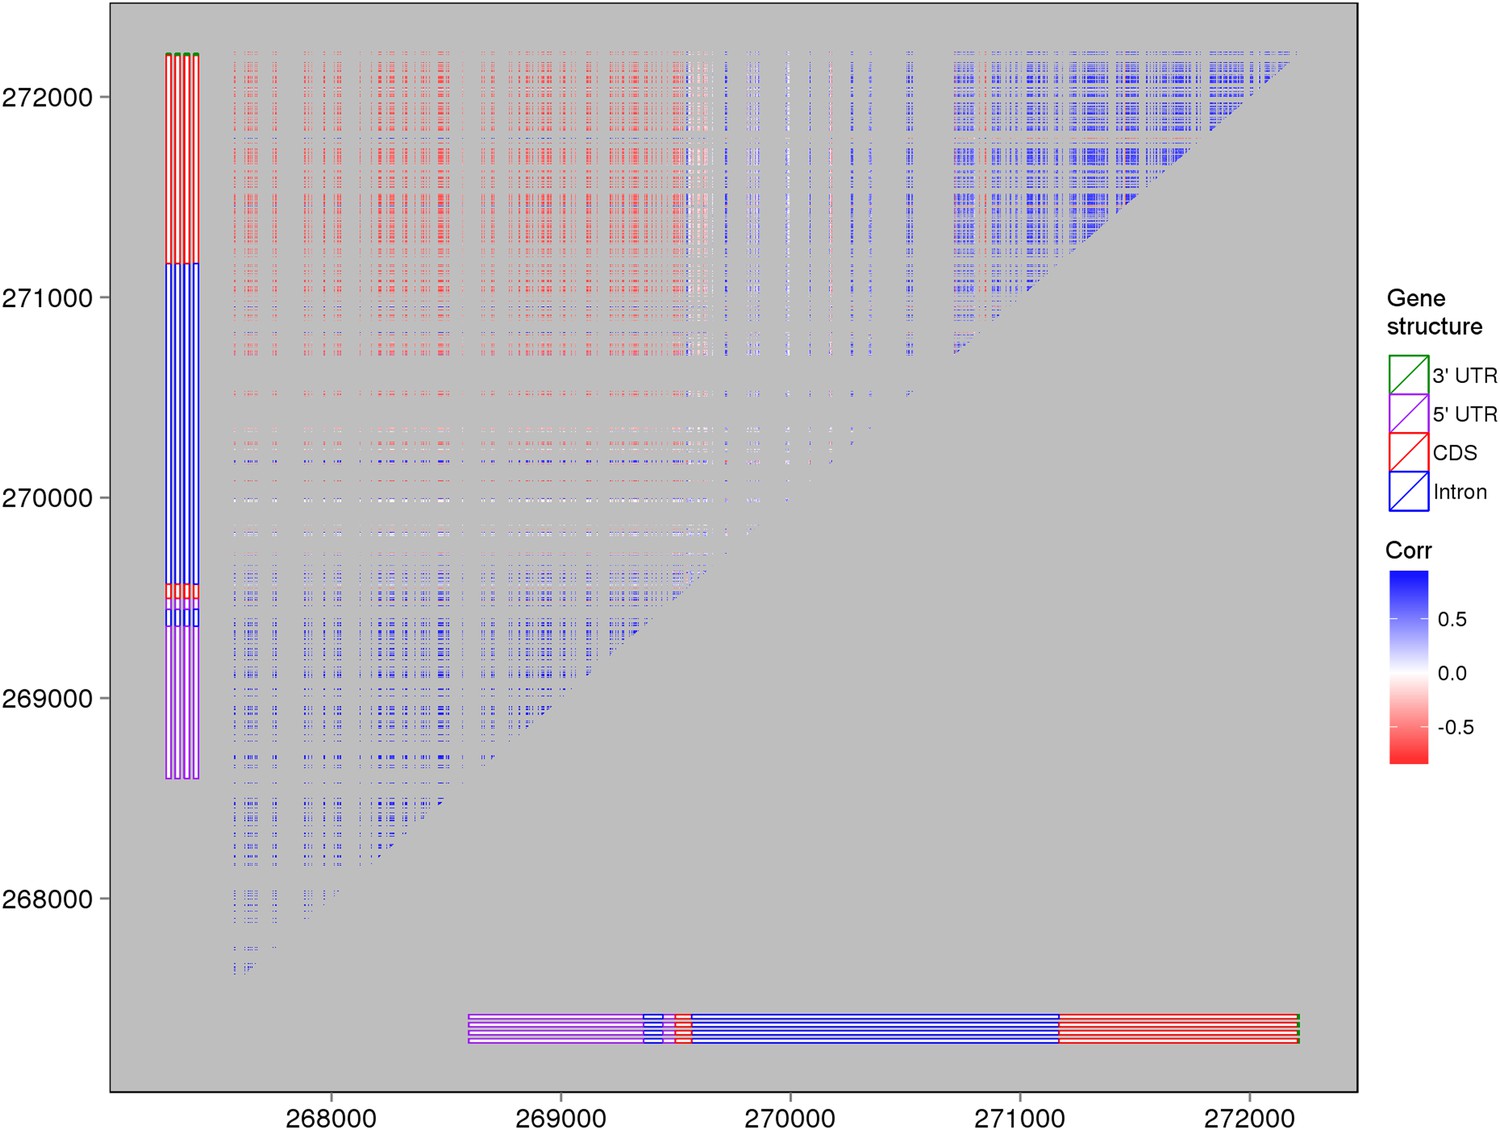
The expression correlations between s-traits originating from LOC_Os03g01360.
The structure of LOC_Os03g01360 is shown by the bars in the left and bottom of the plot. Each point represents the expression correlation between a pair of s-traits.
Figure 2—figure supplement 4
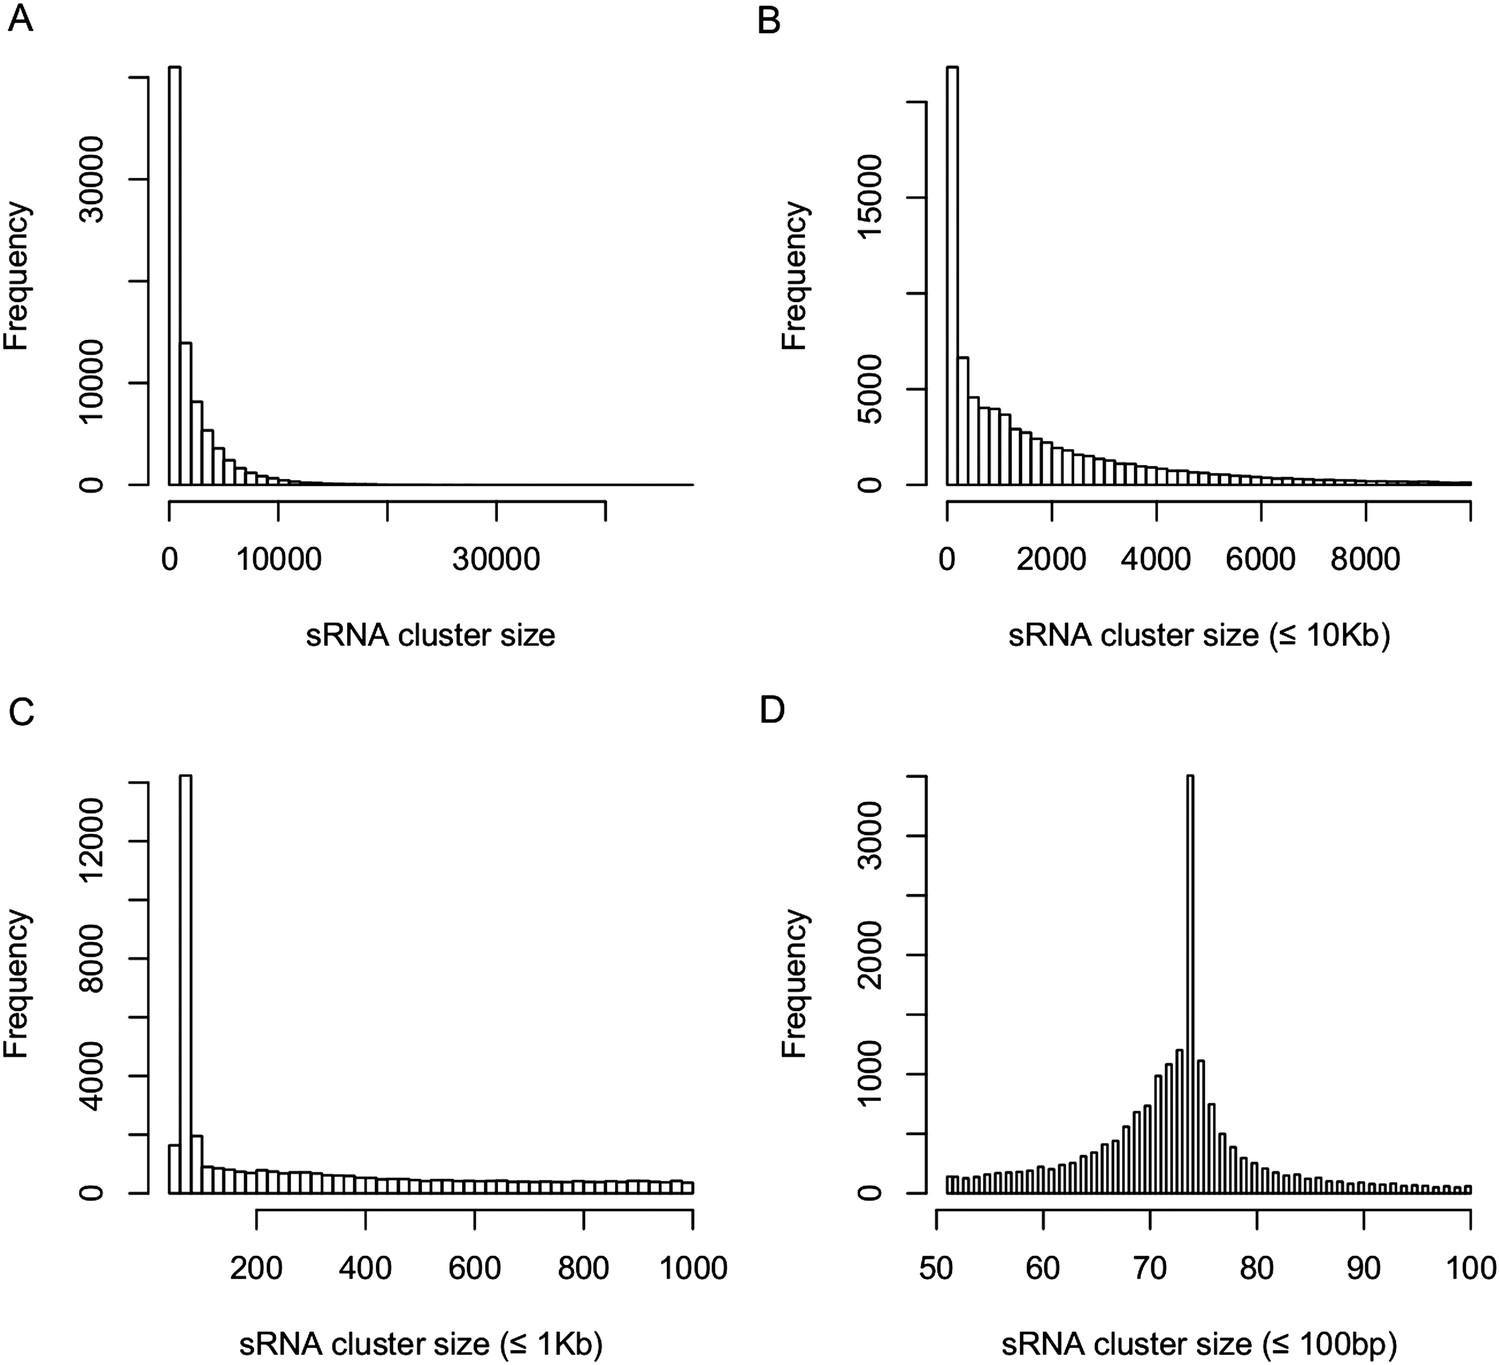
Distribution of sRNA cluster sizes.
(A) Distribution of the sizes of all 80,362 sRNA clusters. (B) Distribution of the sizes of sRNA clusters not longer than 10 kb. (C) Distribution of the sizes of sRNA clusters not longer than 1 kb. (D) Distribution of the sizes of sRNA clusters not longer than 100 bp.
Figure 2—figure supplement 5
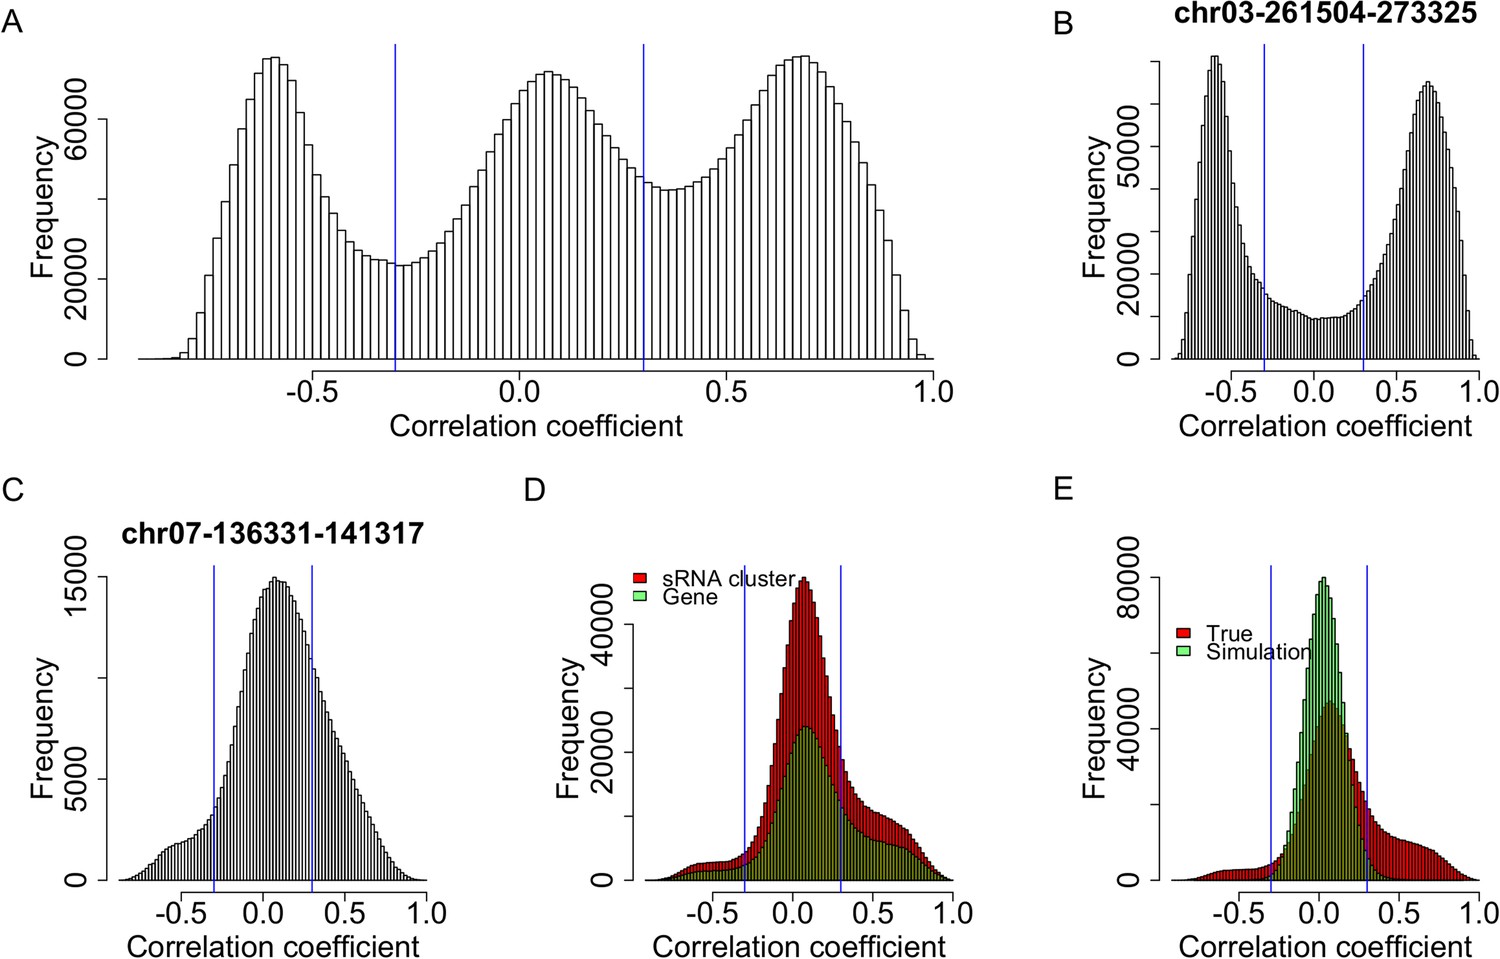
Expression correlations between s-traits originating from the same sRNA clusters.
(A) The distribution of expression correlations between s-traits originating from the same sRNA clusters. (B) The distribution of expression correlations between s-traits originating from chr03-261504-273325. (C) The distribution of expression correlations between s-traits originating from chr07-136331-141317. (D) Comparison of the distribution of expression correlations between s-traits originating from the same mother genes and s-traits from the same sRNA clusters. (E) Comparison of the distribution of expression correlations for the simulation data and the true data excluding s-traits from chr03-261504-273325 and chr07-136331-141317.
Figure 3 with 2 supplements
Correlations between the s-traits and the transcripts of their mother genes.
(A) Correlations between s-traits and e-traits derived from LOC_Os03g01360. (B) Correlations between s-traits and e-traits derived from LOC_Os07g01240. (C) Correlations between s-traits and e-traits originating from the same genes excluding the above two loci. (D) Correlations between s-traits and different e-traits derived from LOC_Os03g01360.
Figure 3—figure supplement 1
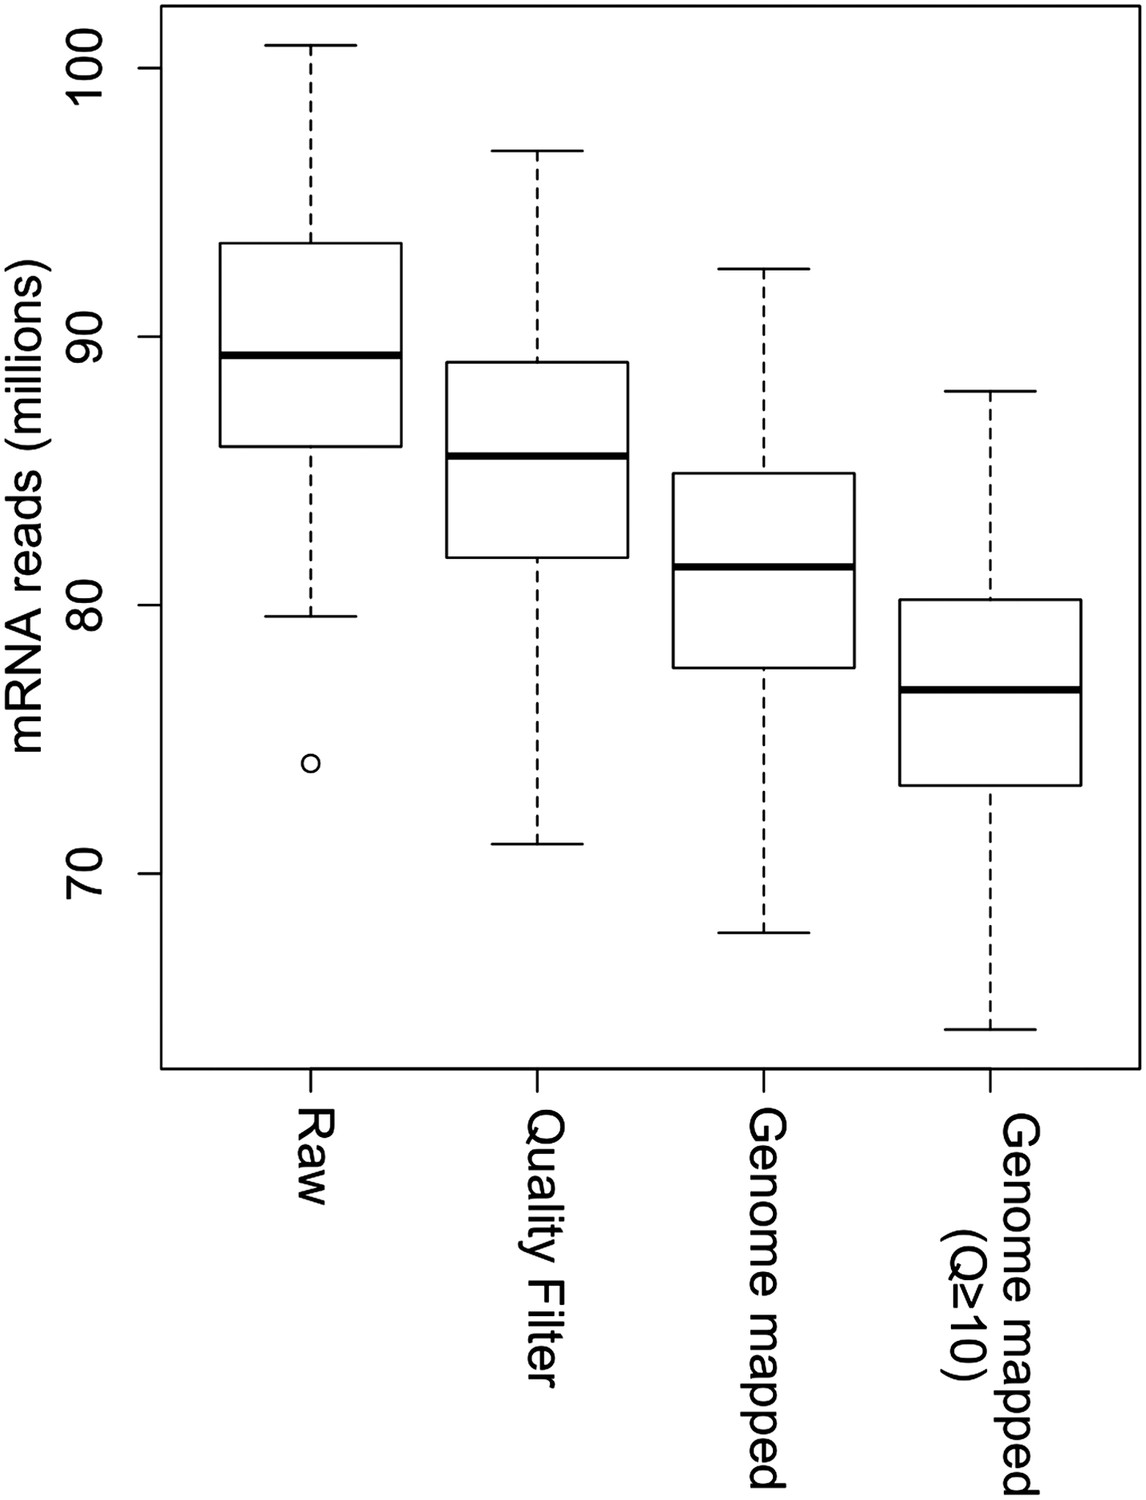
Processing of mRNA sequencing data from raw sequencing reads to genome-mapped reads.
The read number of all IMF2s in each step is shown as box plot.
Figure 3—figure supplement 2
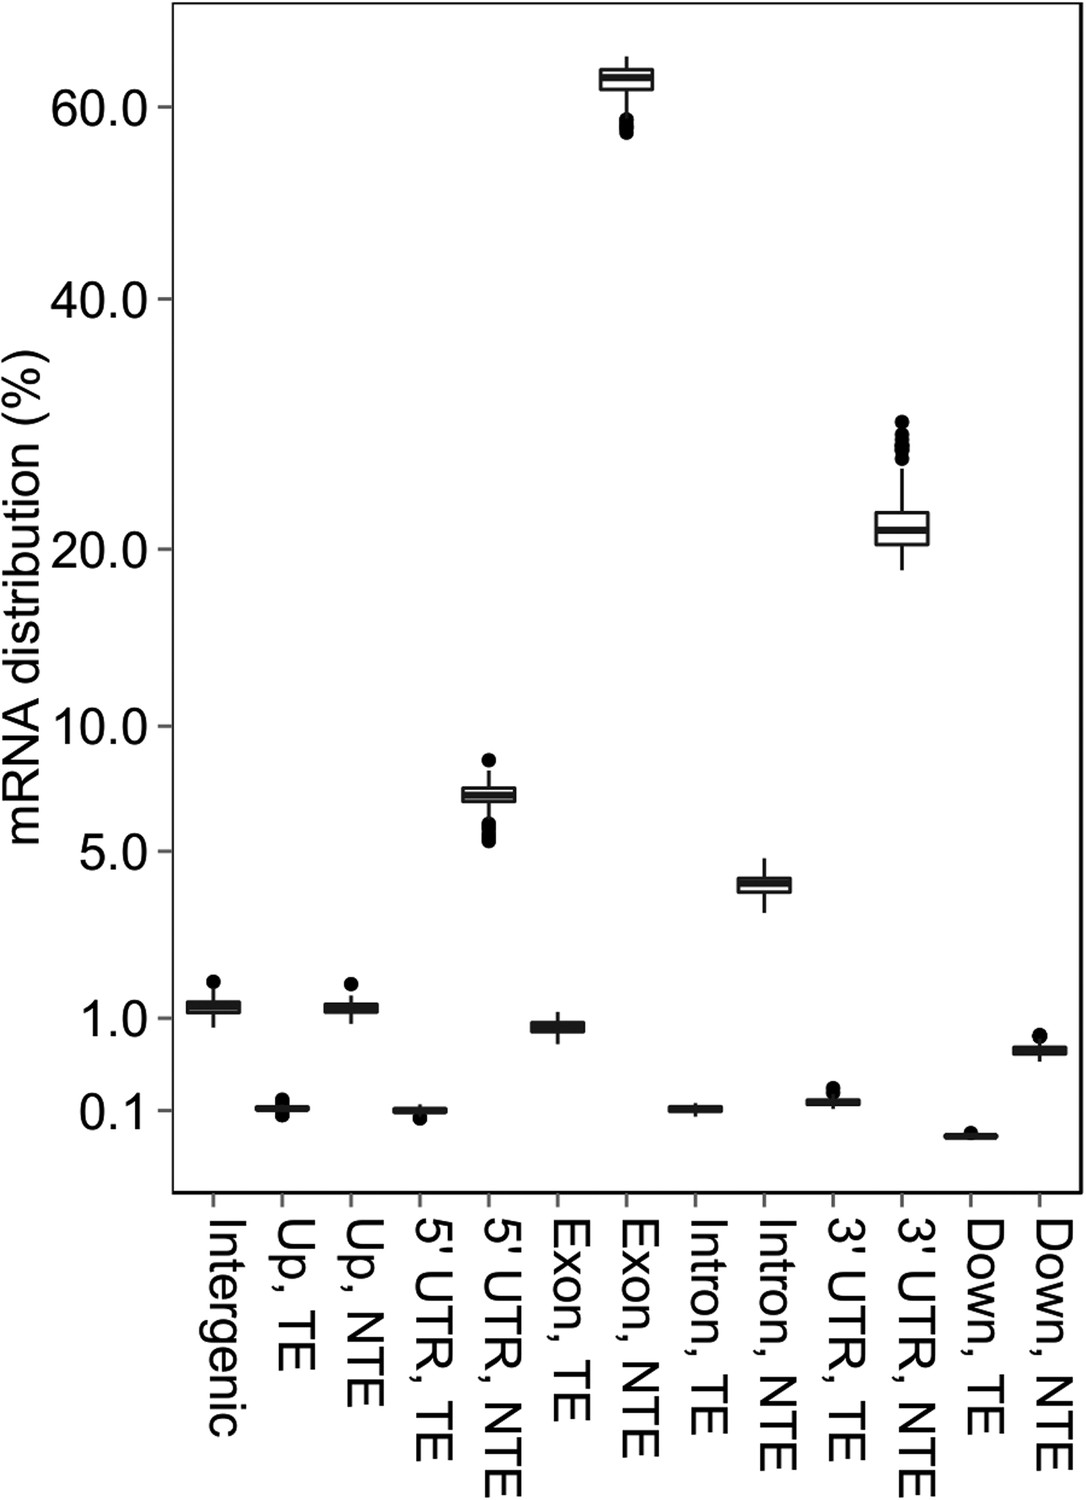
The distribution of mRNA sequencing reads in different genomic regions.
https://doi.org/10.7554/eLife.03913.018
Figure 4 with 8 supplements
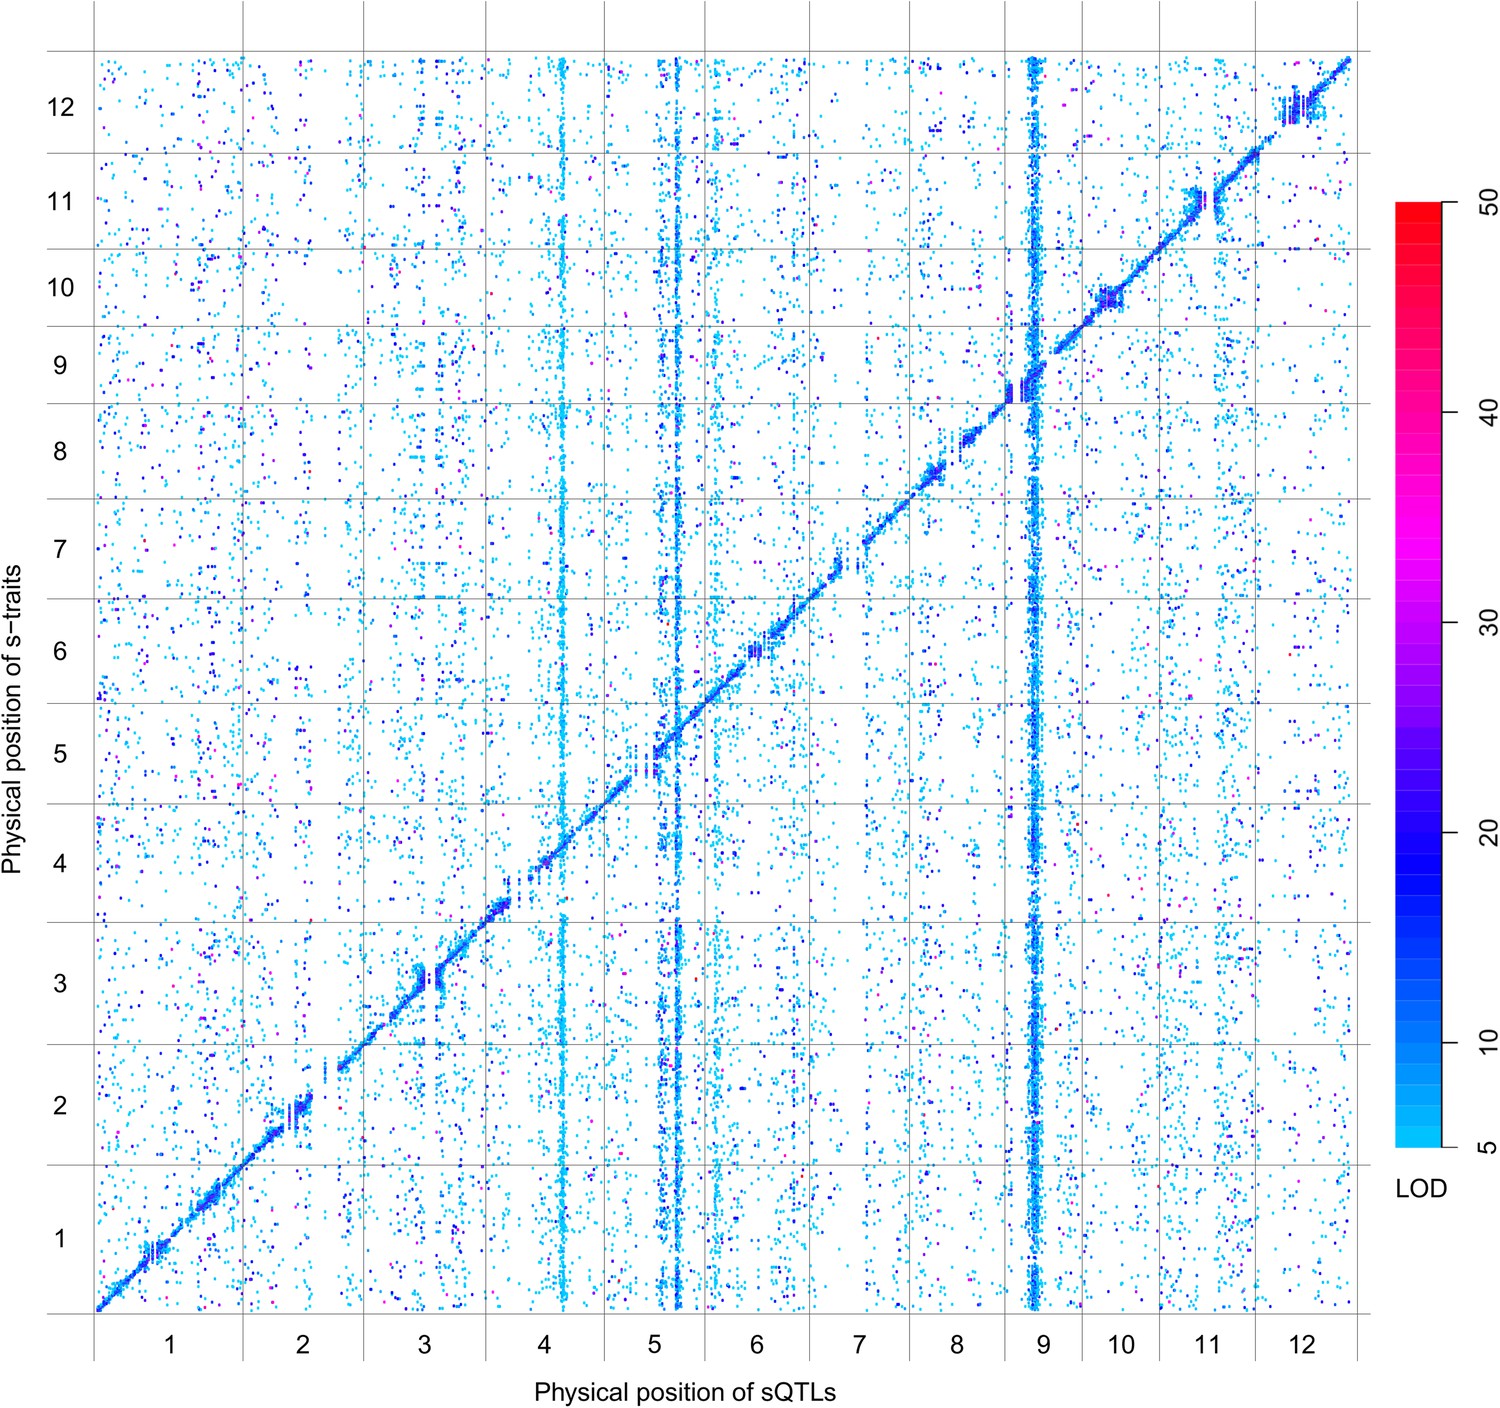
sQTLs for the 66,649 s-traits.
The color key shows the LOD value. X-axis, the physical position of sQTLs along the genome of 12 chromosomes. Y-axis, the physical position of s-traits. QTLs with LOD value <5 are not included in the presentation.
Figure 4—figure supplement 1
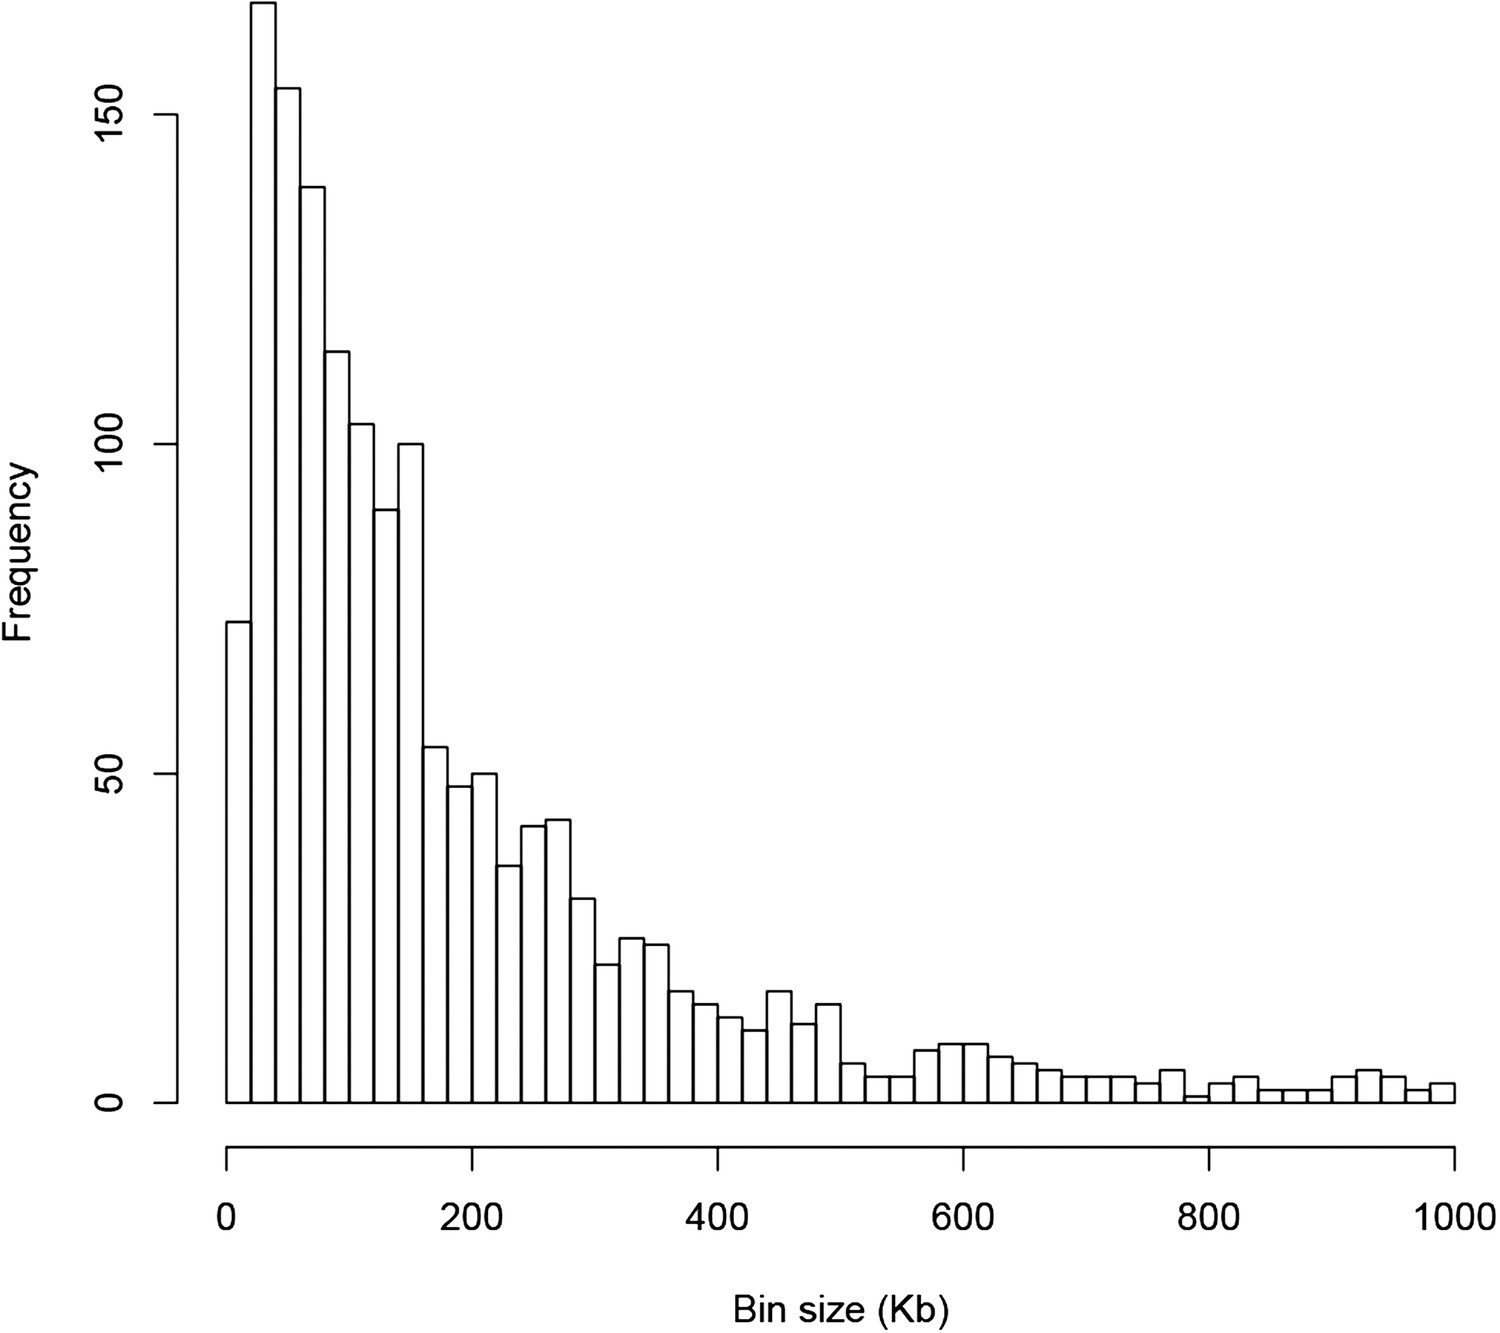
The distribution of the sizes of 1568 bins of the genetic map.
https://doi.org/10.7554/eLife.03913.020
Figure 4—figure supplement 2
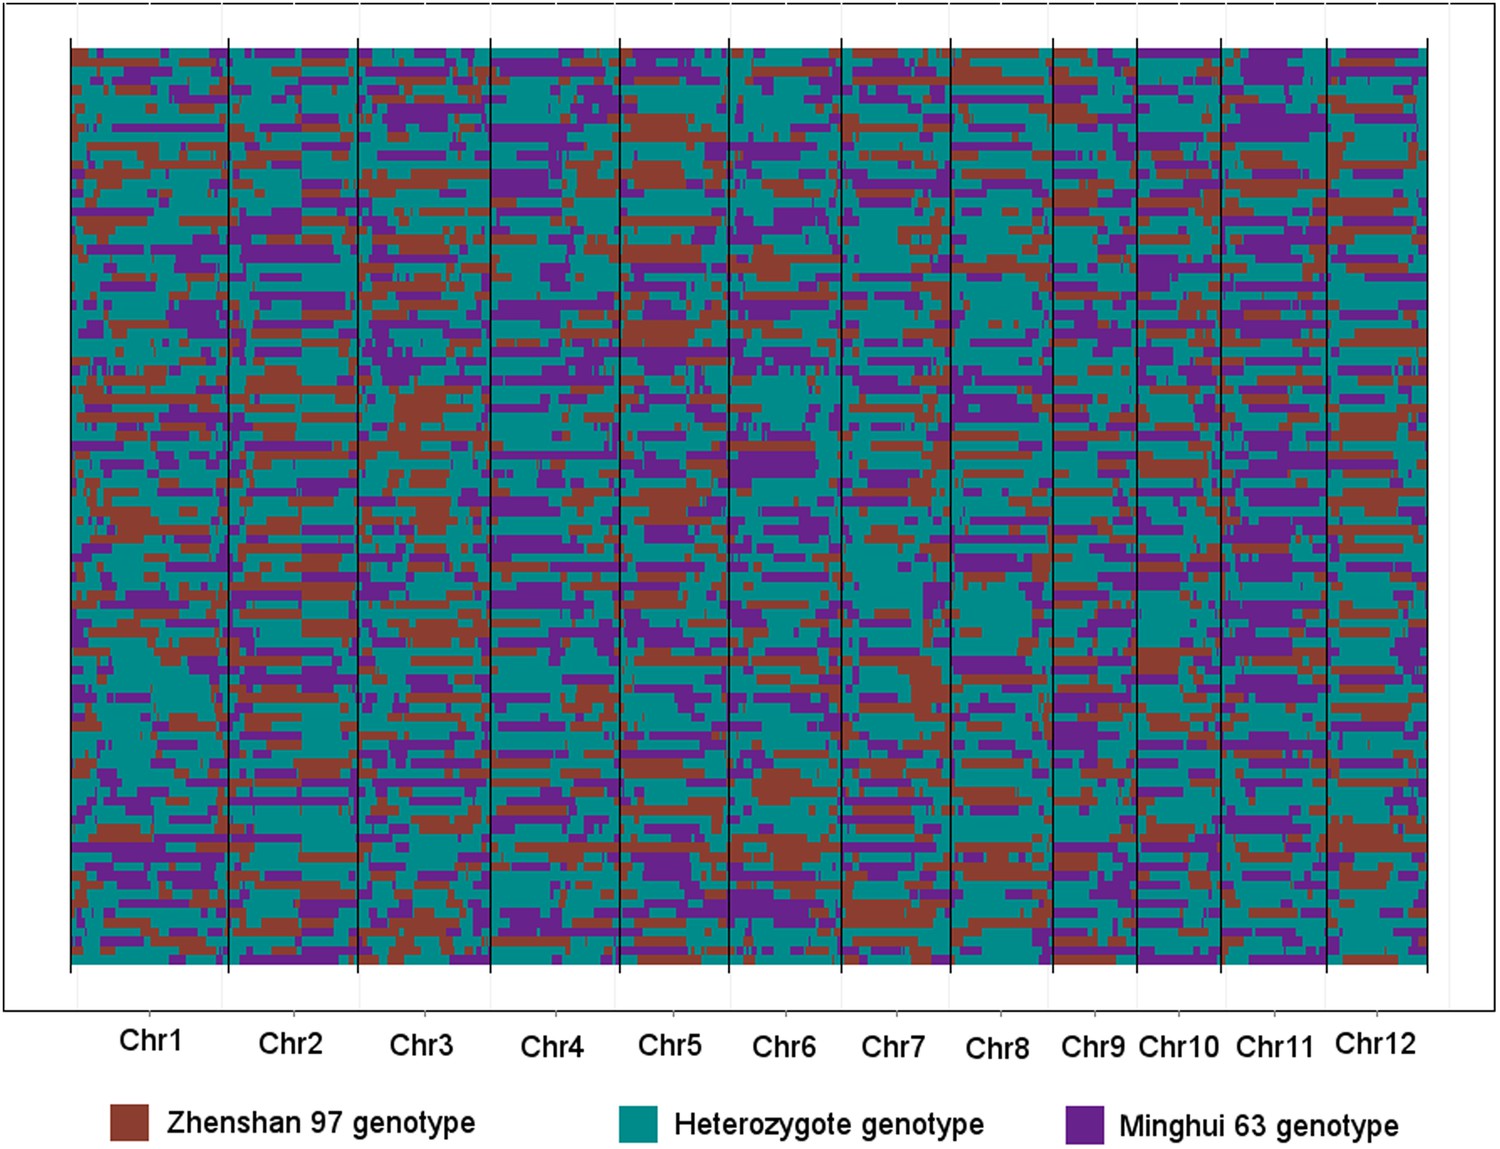
The genotypes of 98 IMF2s across the 1568 bins.
Each row represents an IMF2, while each column represents a bin. Different color indicates different genotype. The 12 chromosomes were separated by black vertical lines.
Figure 4—figure supplement 3
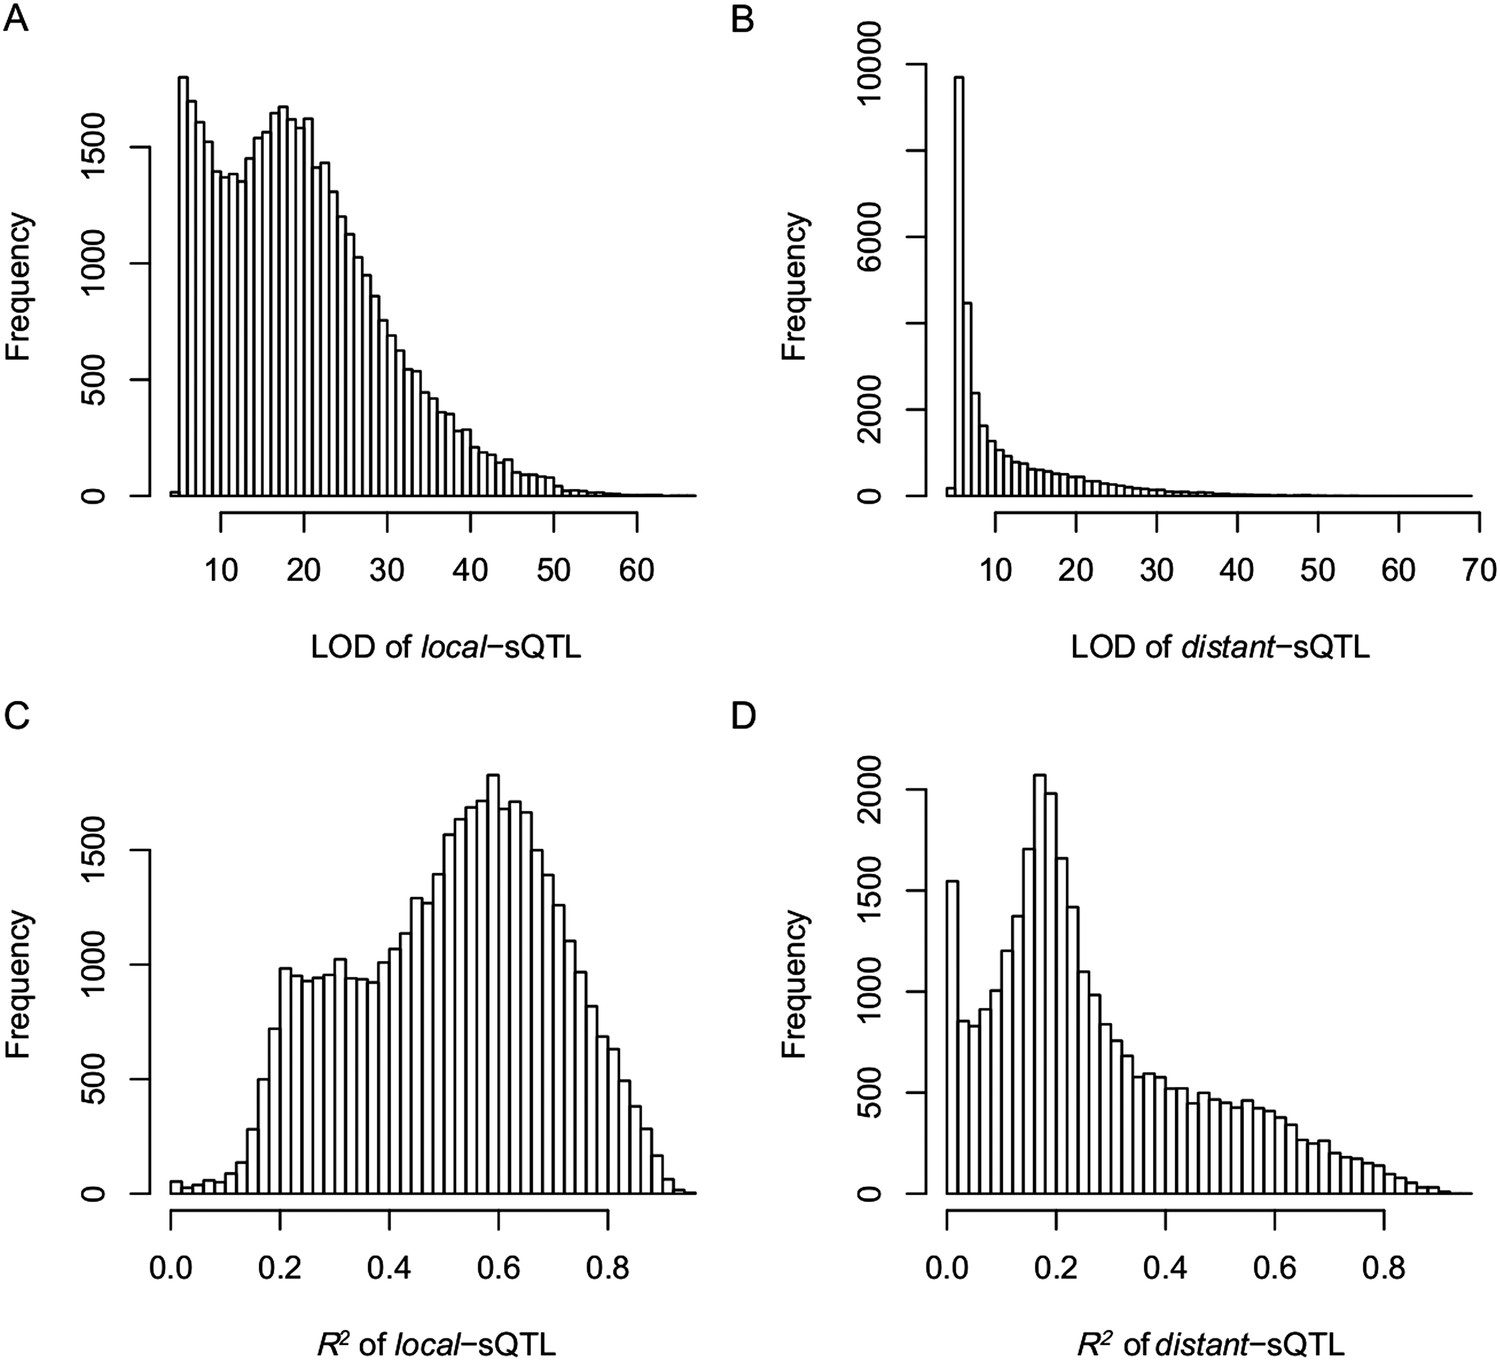
The LOD values and expression variations explained by sQTLs (R2) for local- and distant-sQTLs.
(A) The LOD values for local-sQTLs. (B) The LOD values for distant-sQTLs. (C) Expression variation explained by local-sQTL. (D) Expression variation explained by distant-sQTL.
Figure 4—figure supplement 4
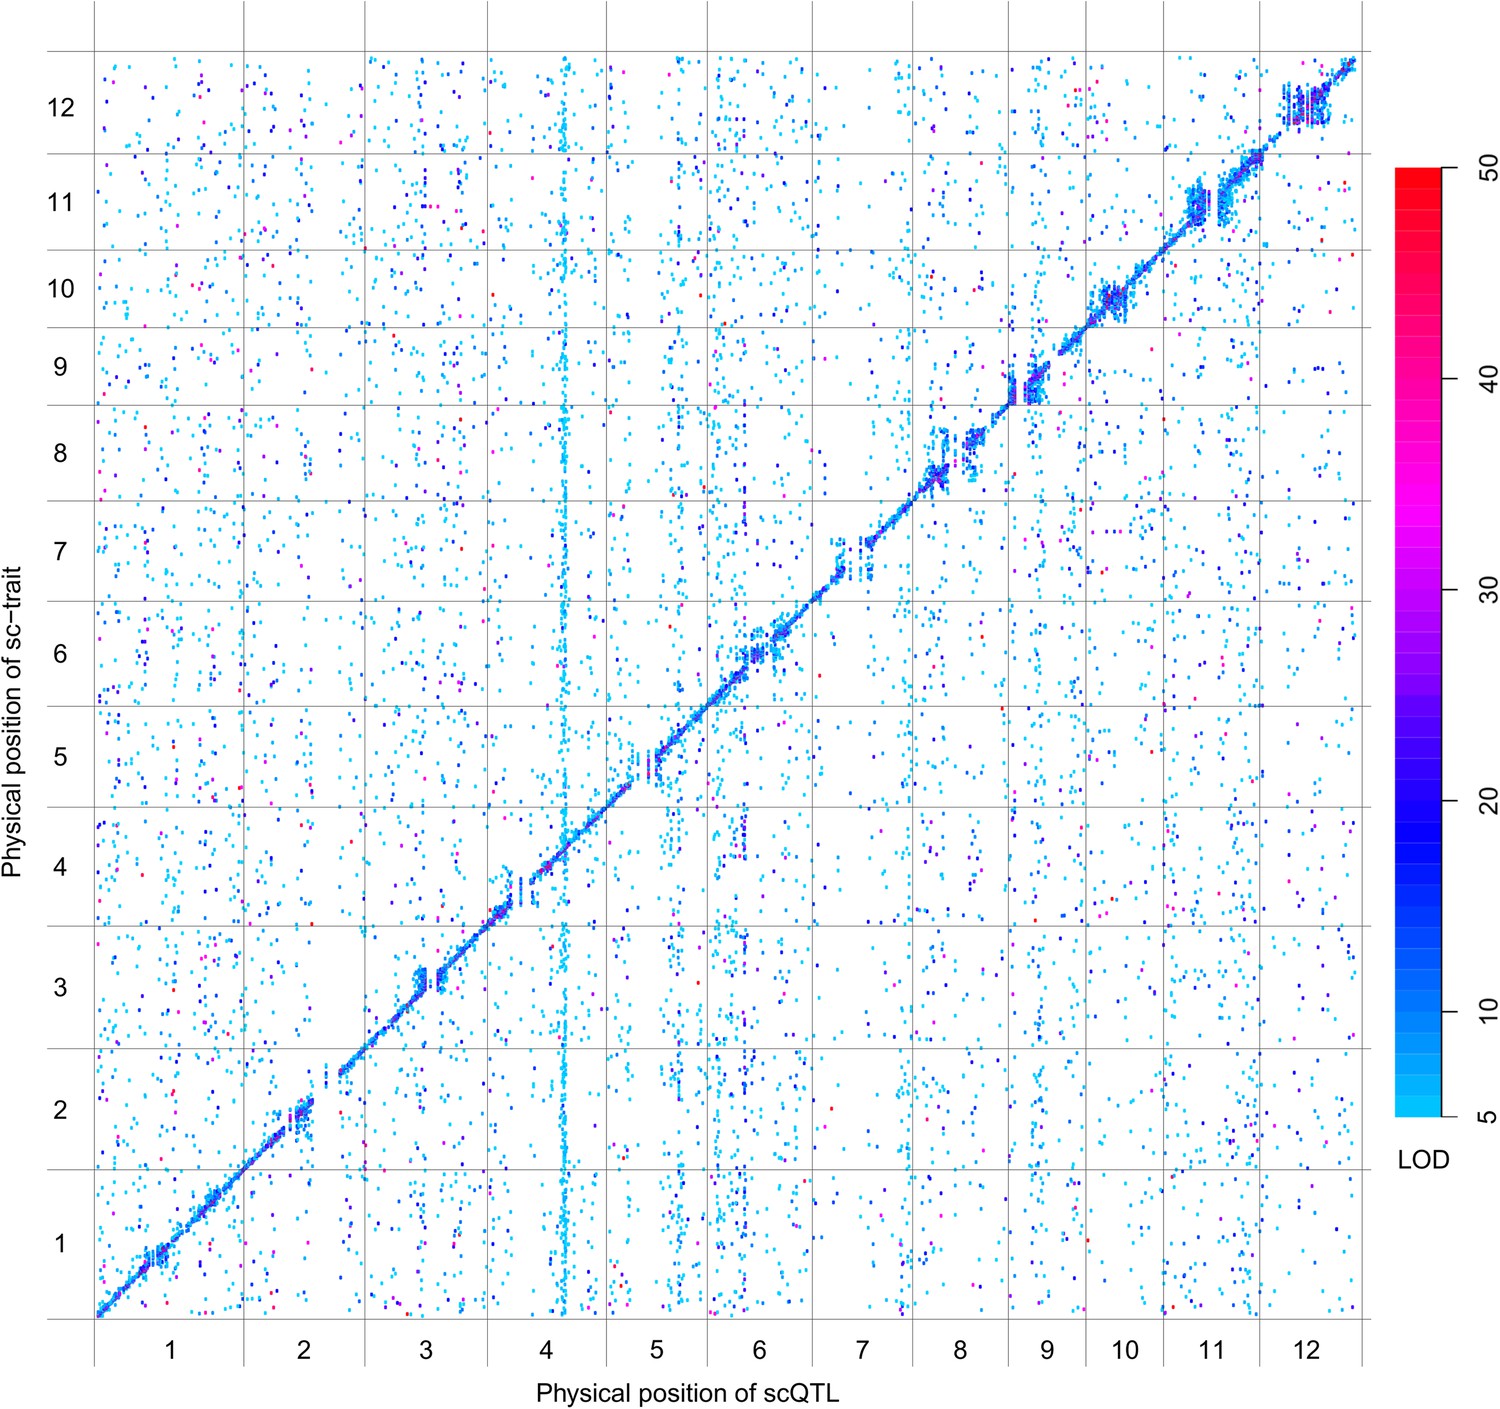
scQTLs for the 20,049 sc-traits.
The color key shows the LOD value. X-axis shows the physical position of scQTLs along the genome. Y-axis shows the physical position of sc-traits. QTLs with LOD value <5 are not included in the presentation.
Figure 4—figure supplement 5
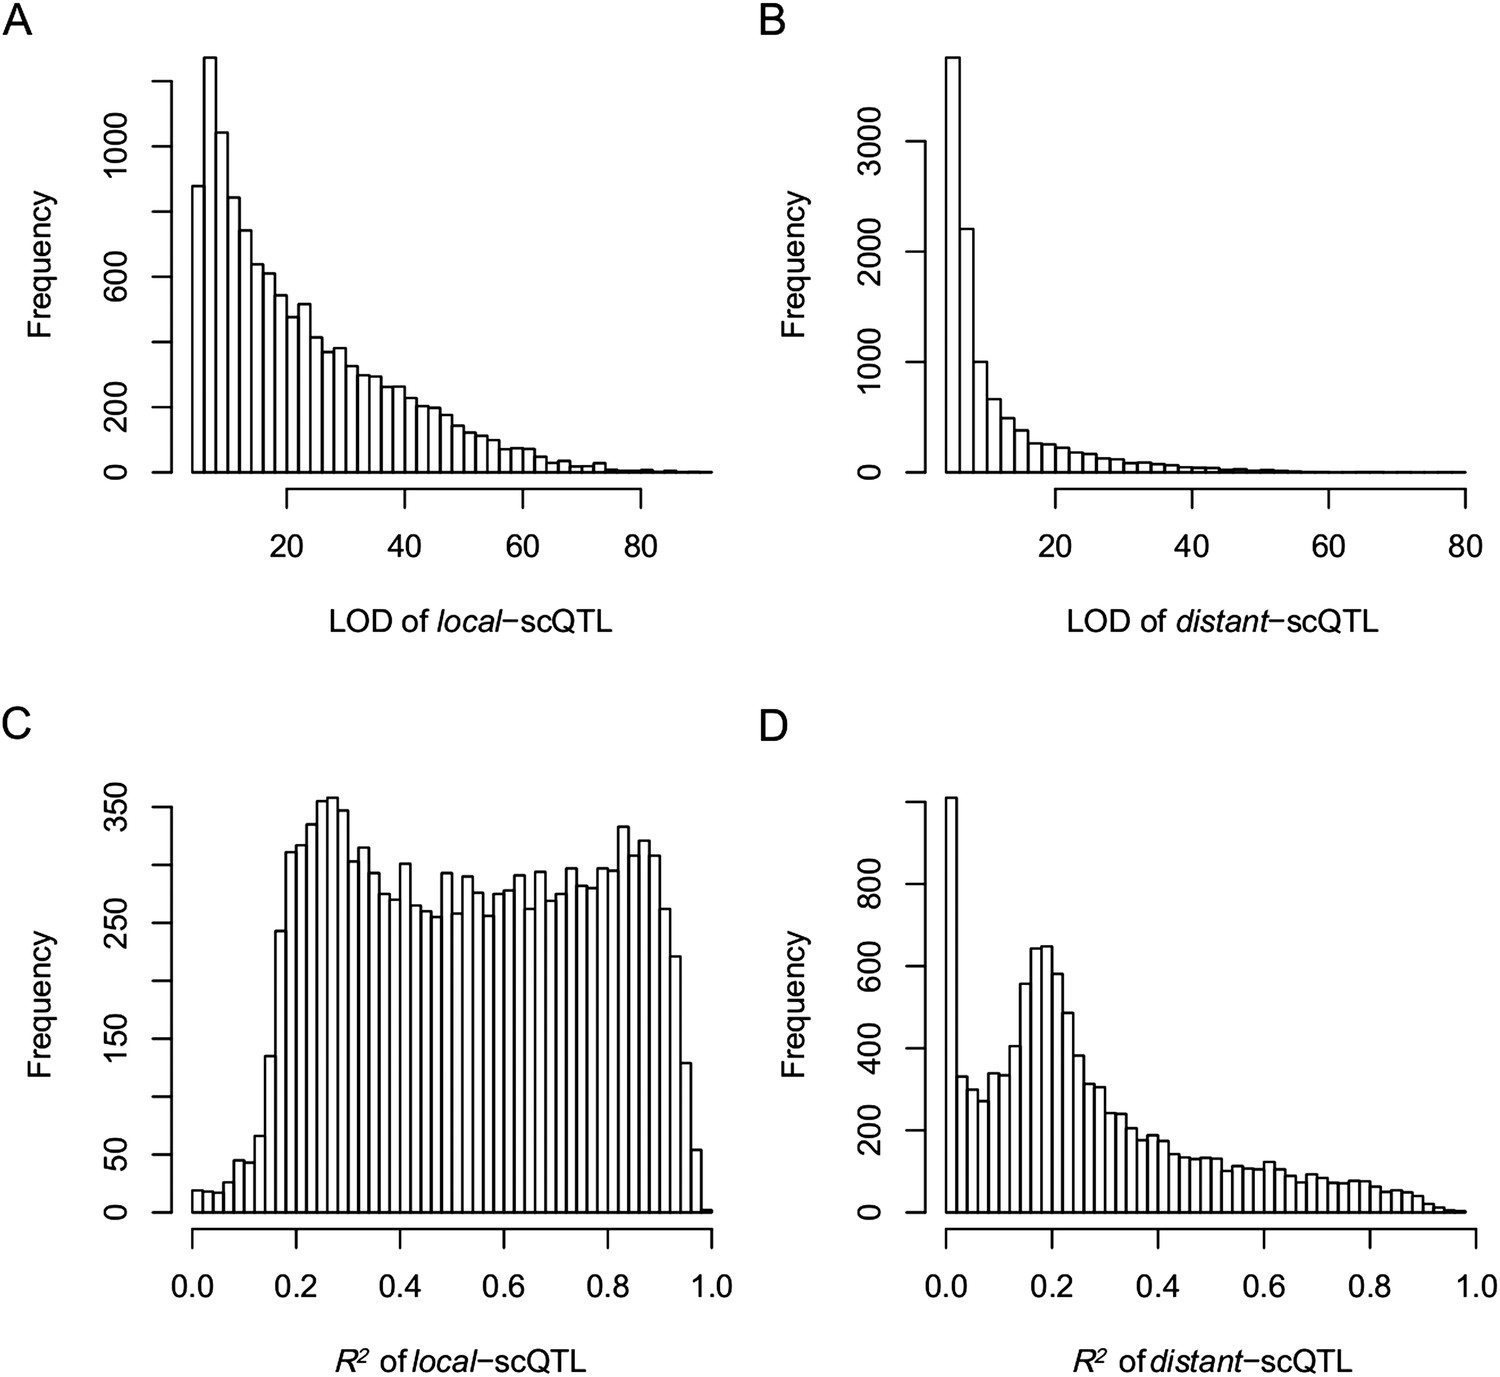
The LOD values and expression variations explained by scQTLs (R2) for local- and distant-scQTLs.
(A) The LOD values for local-scQTLs. (B) The LOD values for distant-scQTLs. (C) Expression variation explained by local-scQTL. (D) Expression variation explained by distant-scQTL.
Figure 4—figure supplement 6
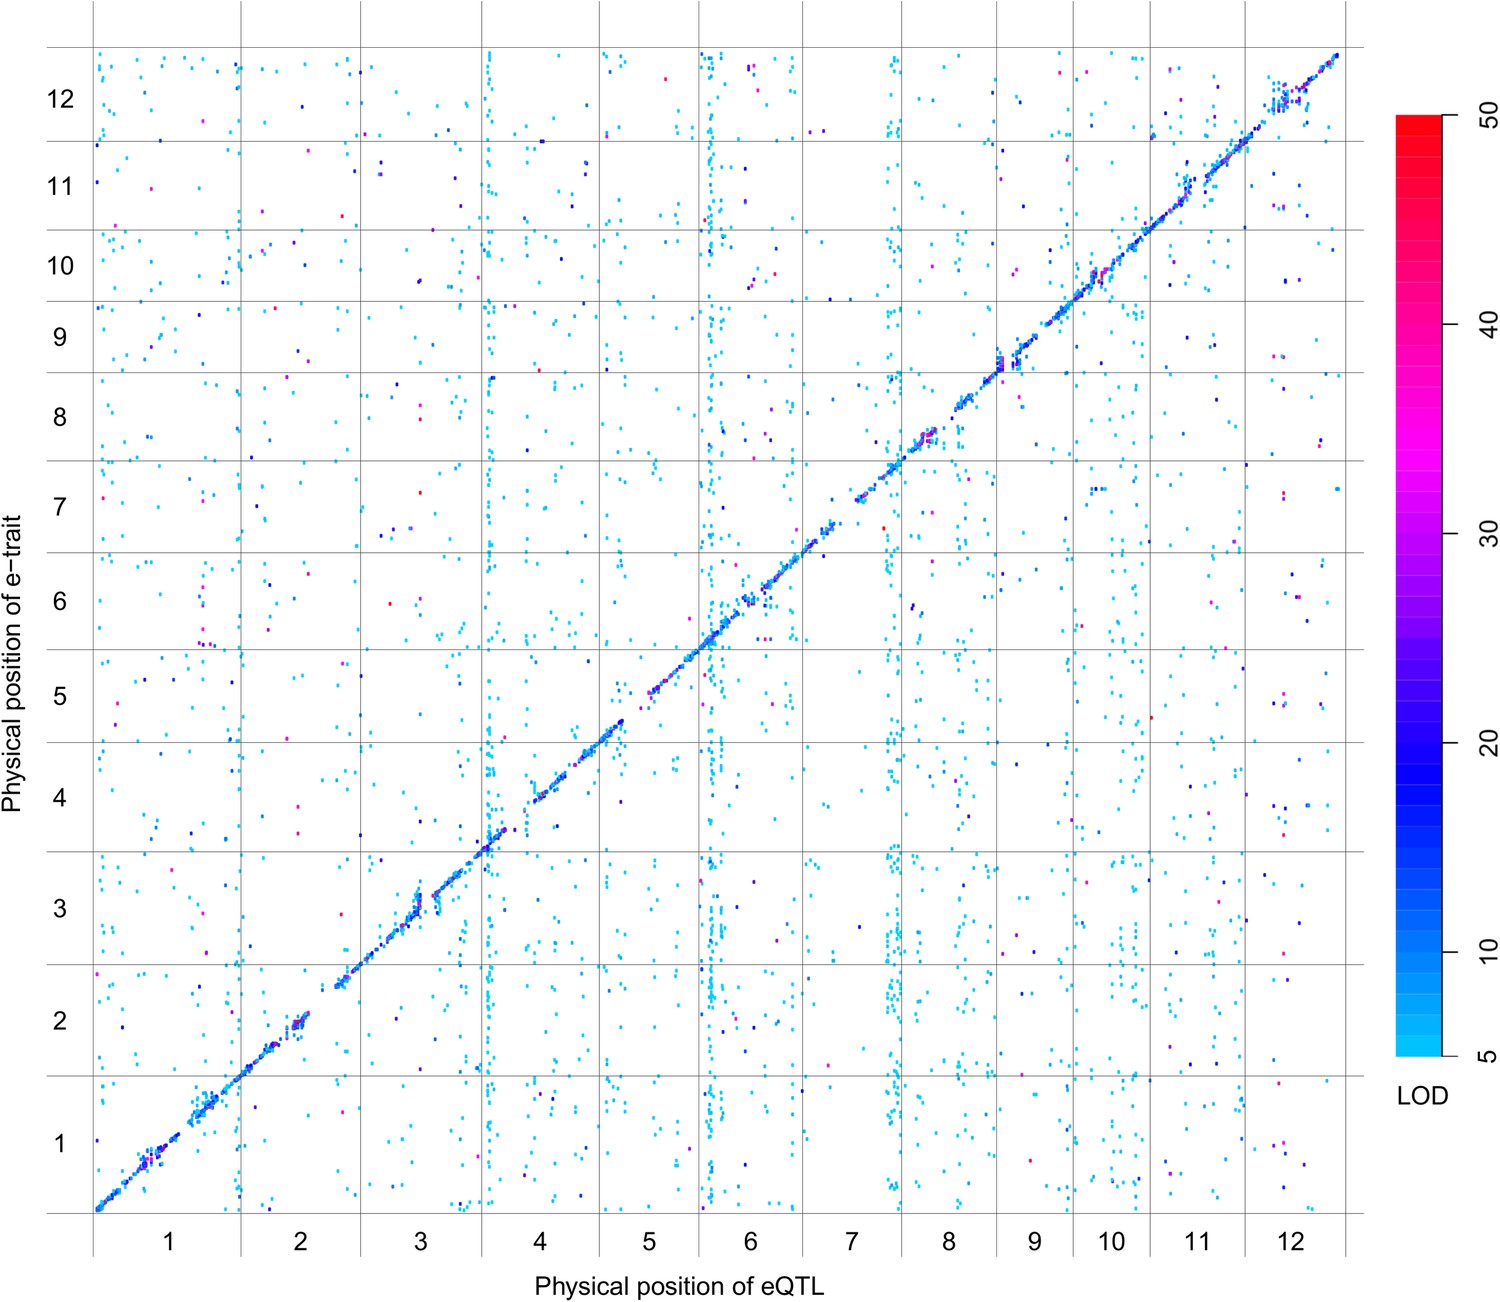
eQTLs for the 6123 e-traits.
The color key shows the LOD value. X-axis shows the physical position of eQTLs along the genome. Y-axis shows the physical position of e-traits. QTLs with LOD value <5 are not included in the presentation.
Figure 4—figure supplement 7
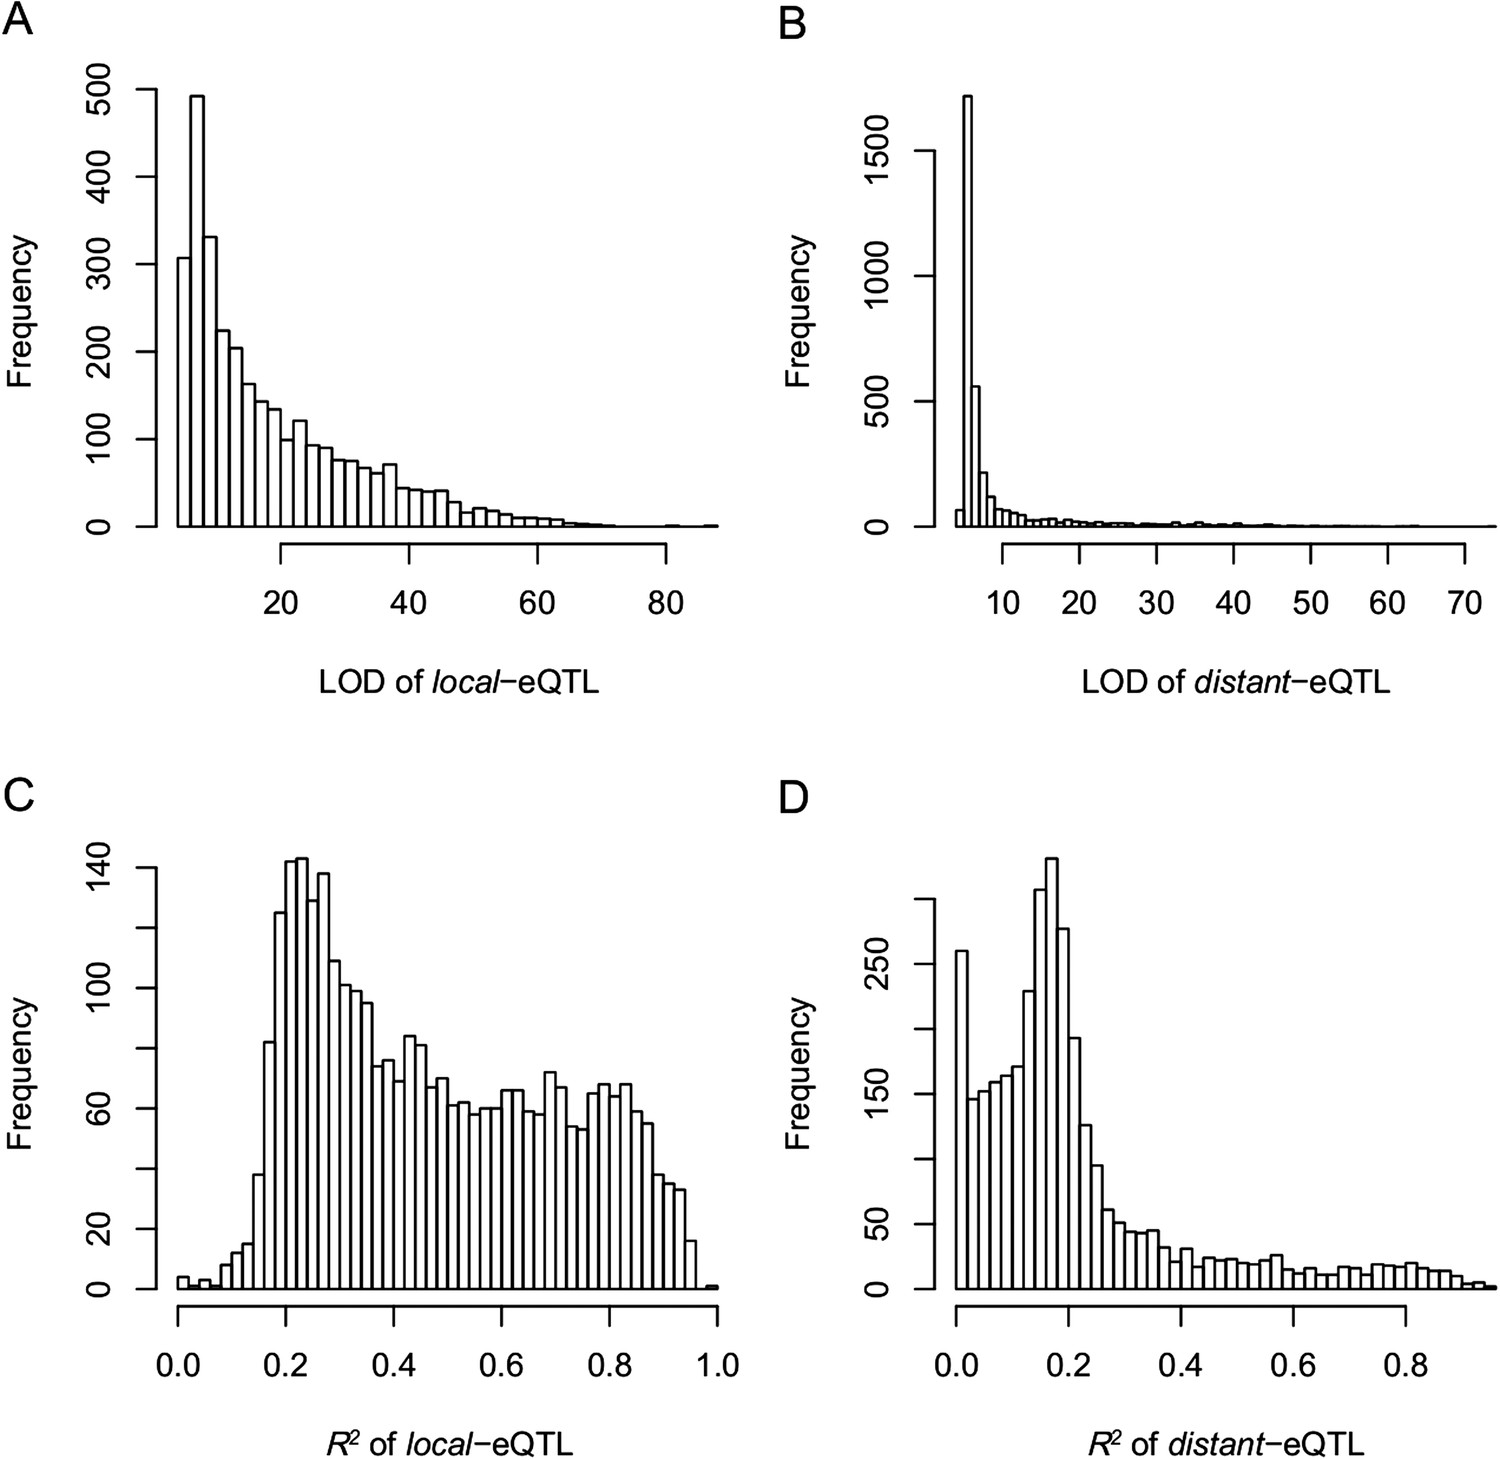
The LOD values and expression variations explained by eQTLs (R2) for local- and distant-eQTLs.
(A) The LOD values for local-eQTLs. (B) The LOD values for distant-eQTLs. (C) Expression variation explained by local-eQTL. (D) Expression variation explained by distant-eQTL.
Figure 4—figure supplement 8
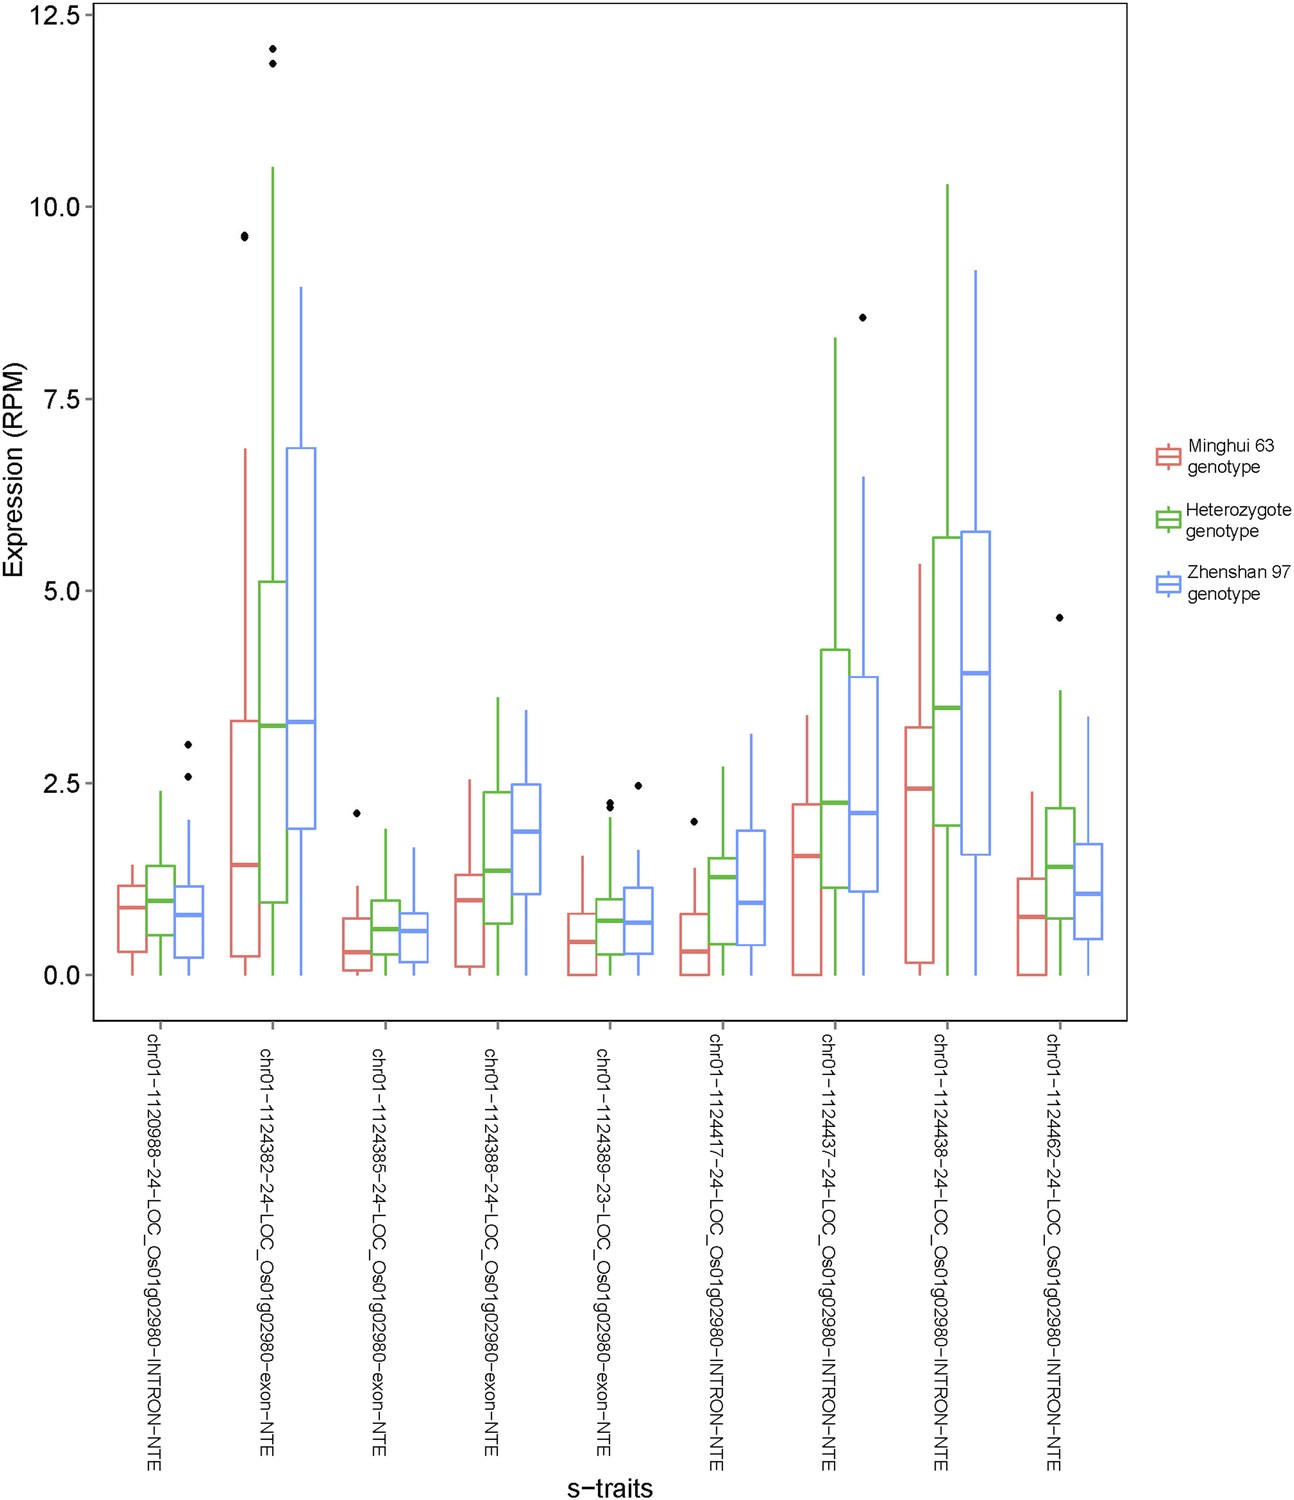
Examples of s-traits expressed in only one of the two parents (Zhenshan 97).
The expression value (reads per millions [RPM]) of each s-trait in the IMF2 population is shown as box plot. IMF2s with different genotypes as determined by the genotype of the bin harboring these s-traits are indicated by different colors.
Figure 5 with 2 supplements
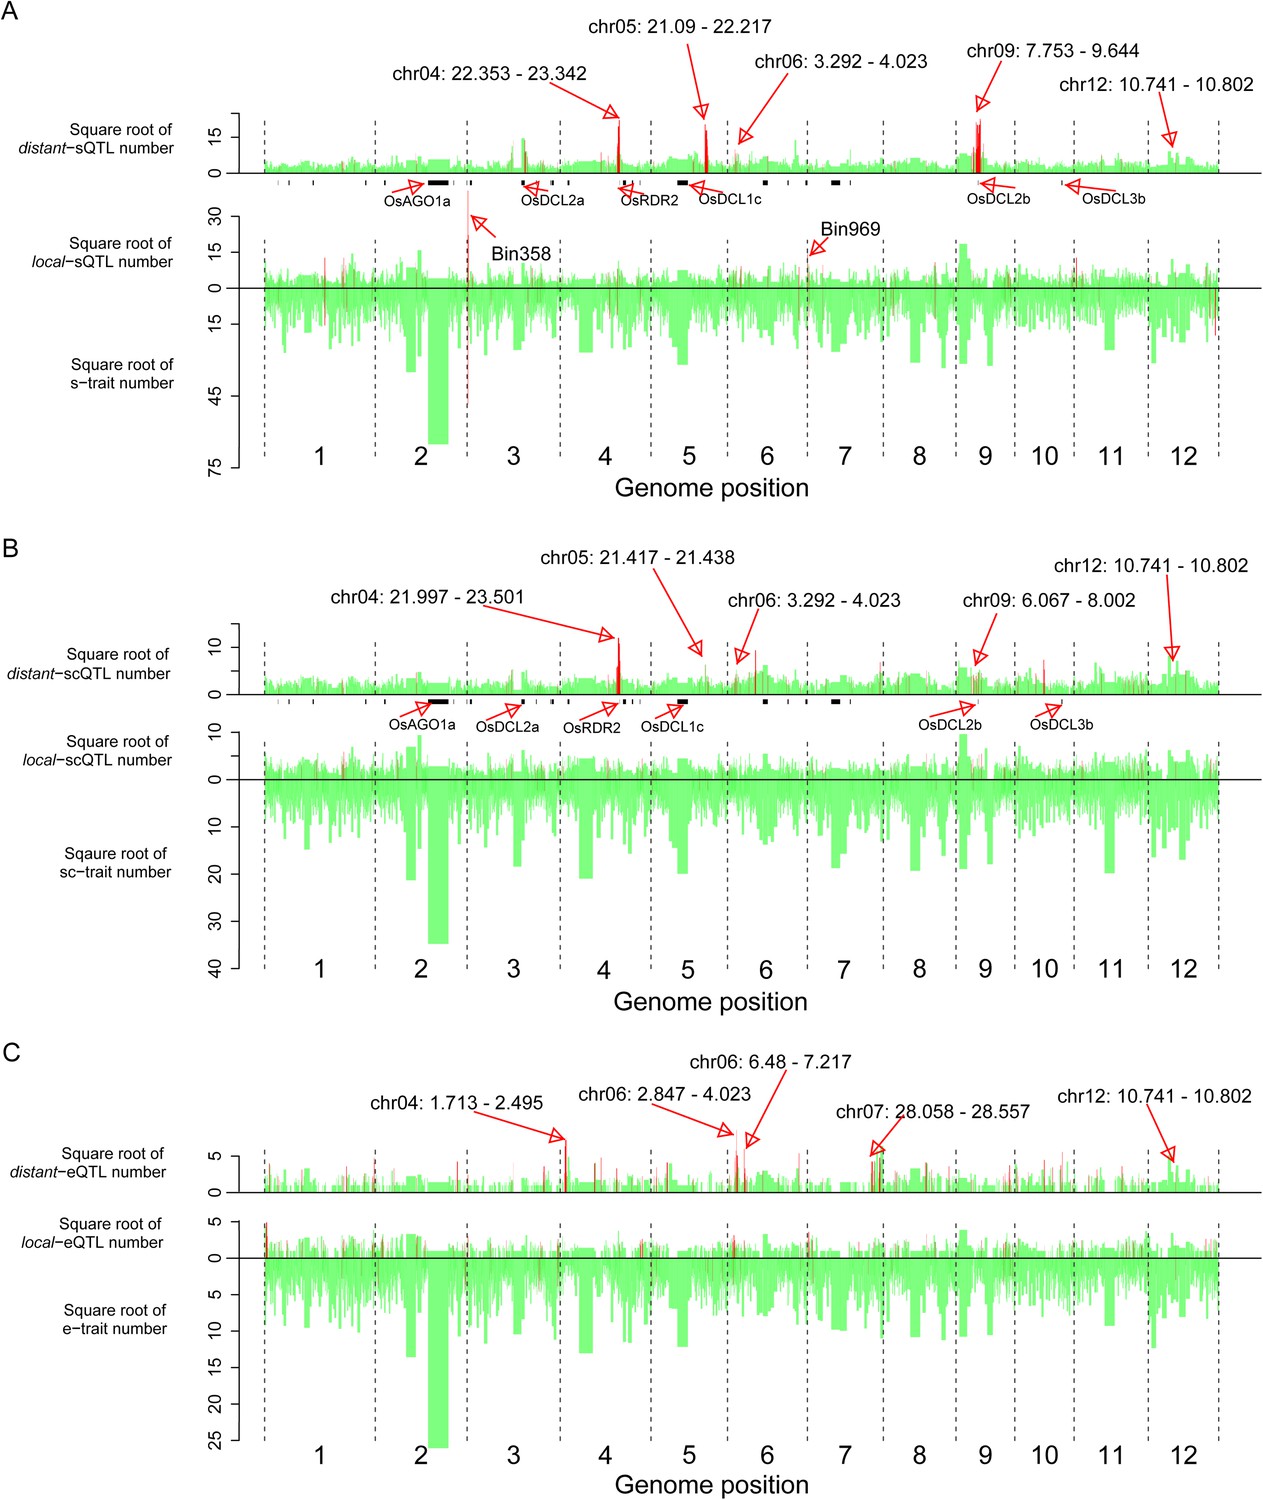
The distribution of traits and QTLs in the 1568 bins.
(A) s-traits and sQTLs. (B) sc-traits and scQTLs. (C) e-traits and e-QTLs. The 1568 bins are arranged from left to right according to their genomic position. The width of bar represents the size of the bin. The chromosome identifiers are labeled below each plot. Bins in red color were trait or QTL hotspots. Locations for a number of interesting regions like sRNA biogenesis genes, Bin358 (LOC_Os03g01360) and Bin 969 (LOC_Os07g01240), are also indicated, in addition to the hotspots.
Figure 5—figure supplement 1
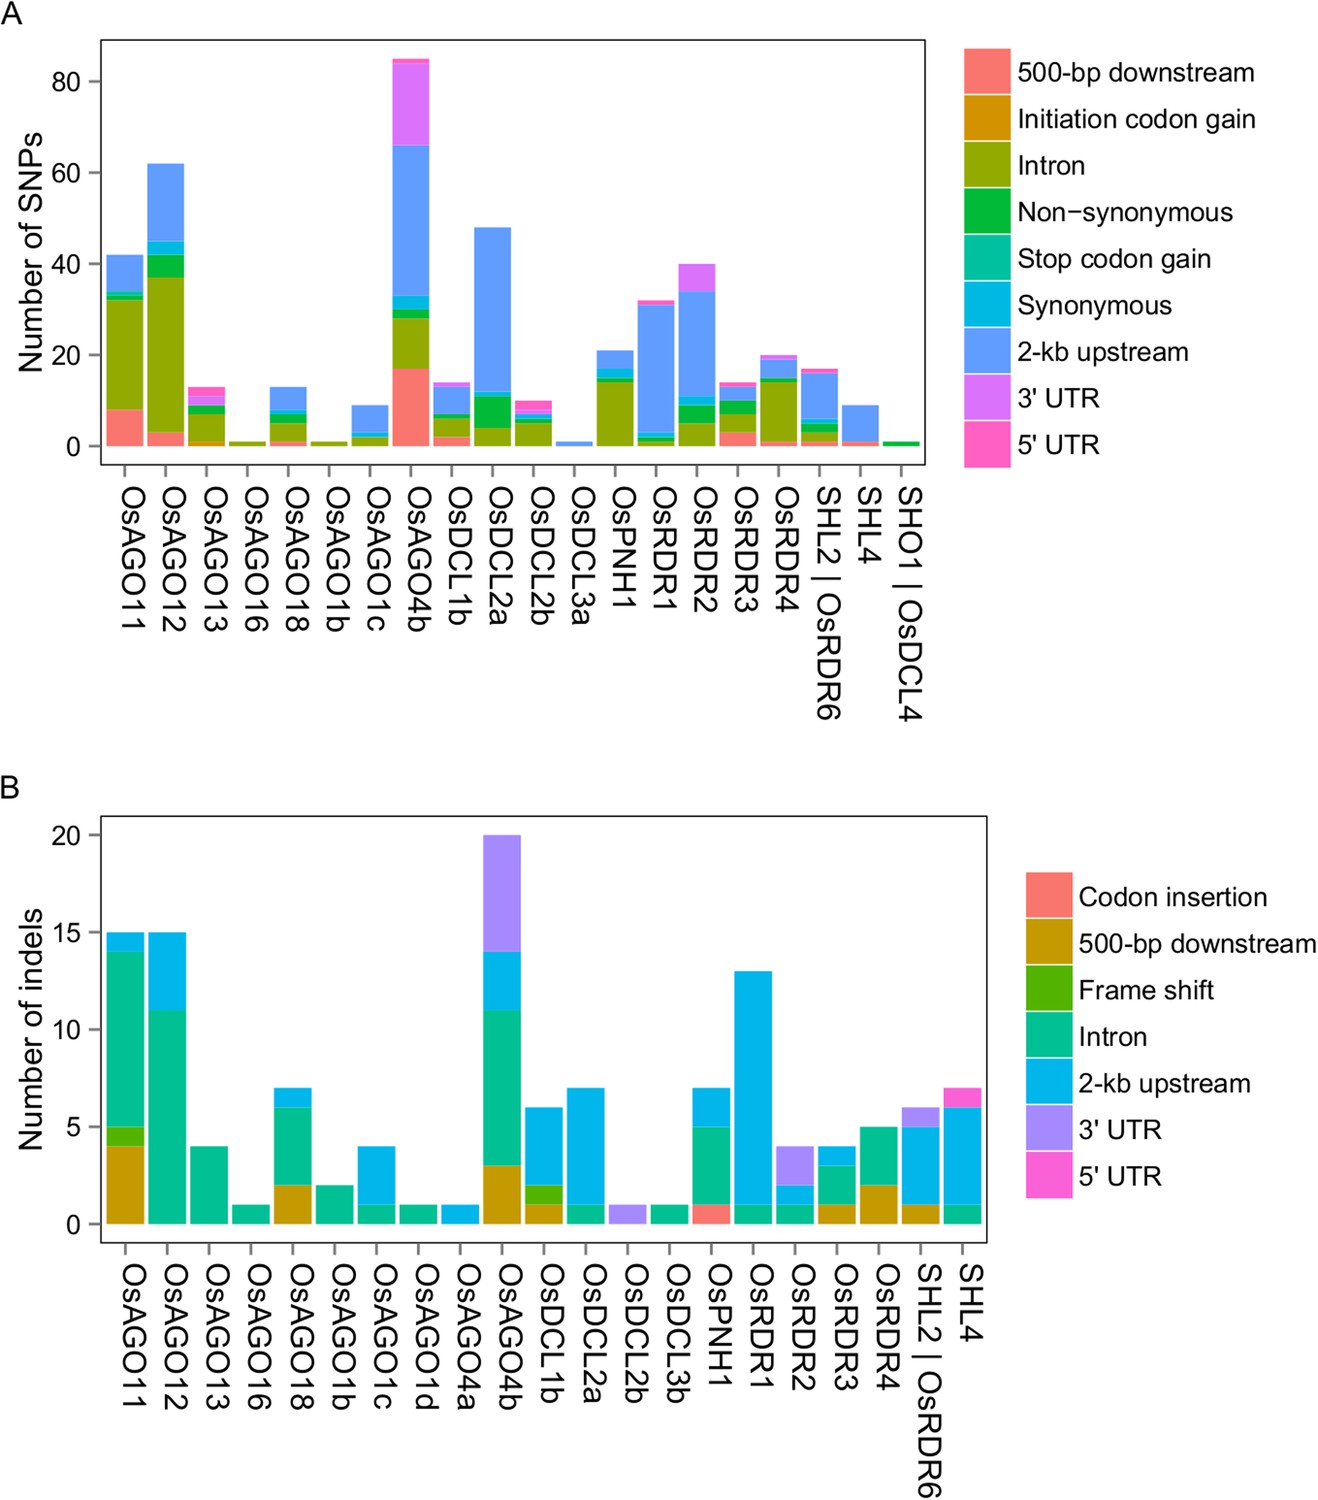
DNA sequence polymorphisms of sRNA biogenesis genes between Zhenshan 97 and Minghui 63.
(A) SNPs in sRNA biogenesis genes between Zhenshan 97 and Minghui 63. (B) Indels in sRNA biogenesis genes between Zhenshan 97 and Minghui 63.
Figure 5—figure supplement 2
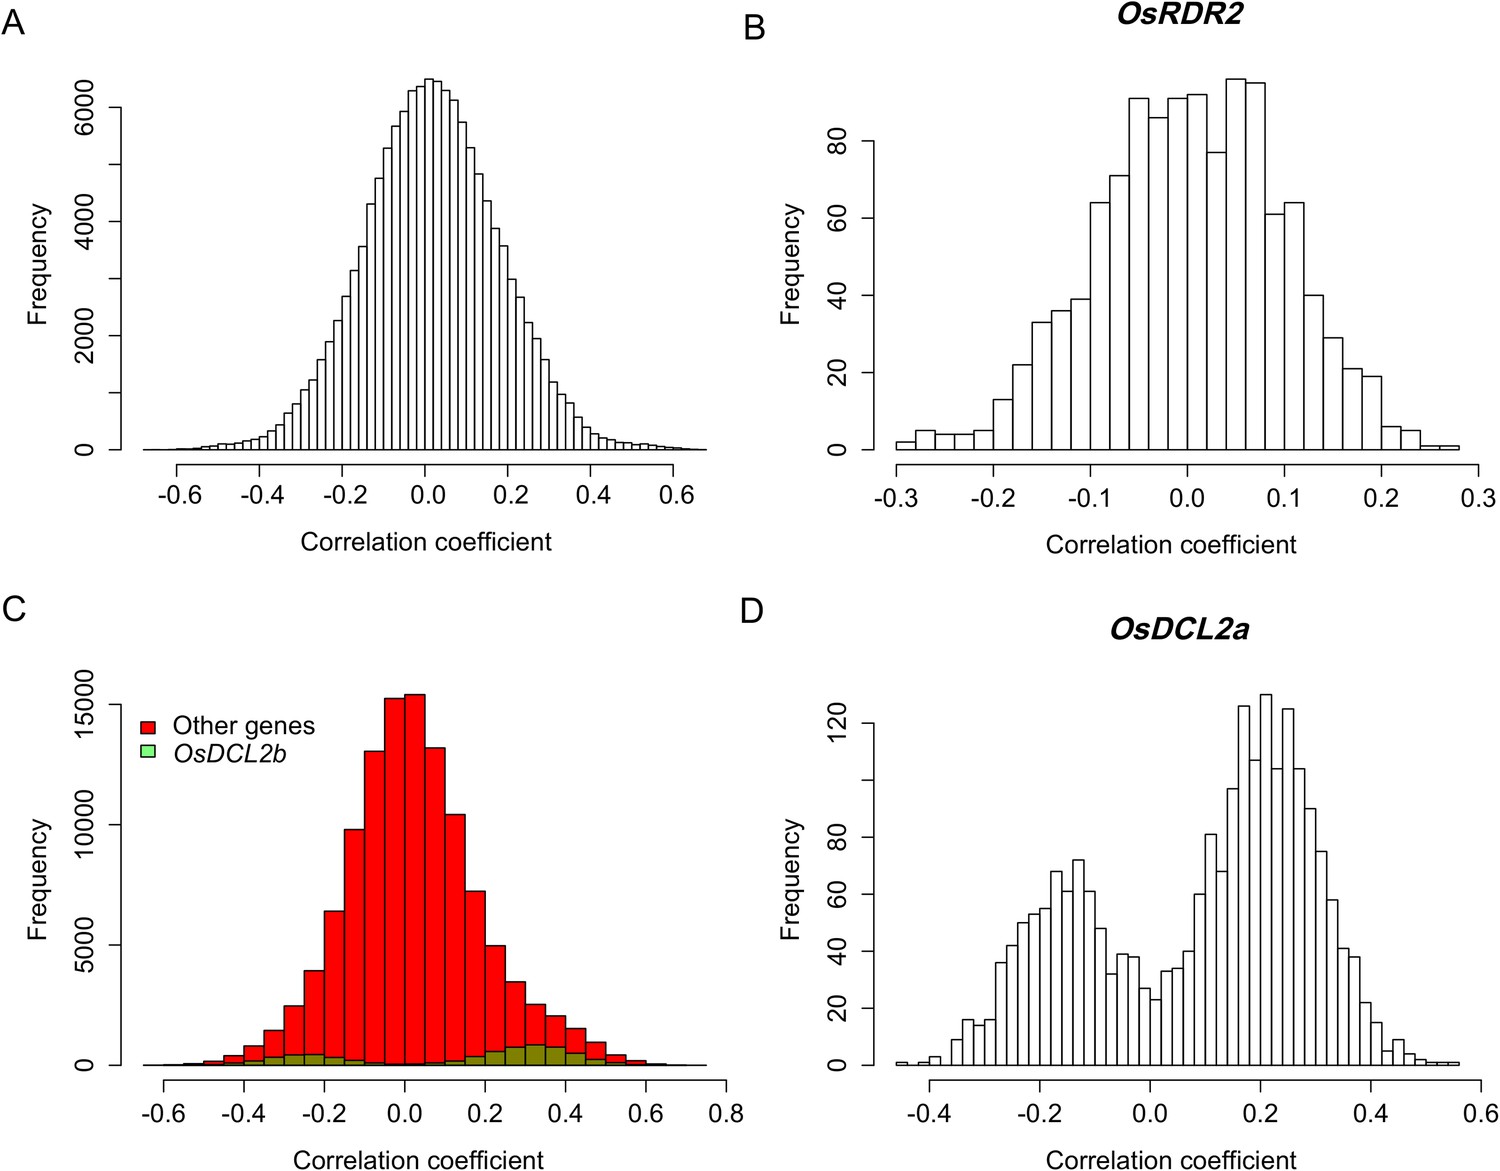
Expression correlations between sRNA biogenesis genes in distant-sQTL hotspots and s-traits regulated by these distant-sQTLs.
(A) Expression correlations between s-traits regulated by Bin632–Bin637 and the e-traits in these bins. (B) Expression correlations between s-traits regulated by Bin632–Bin637 and the e-traits of OsRDR2. (C) Expression correlations between s-traits regulated by Bin1199–Bin1210 and the e-traits in these bins. The e-traits of OsDCL2b and others e-traits are represented by different colors. (D) Expression correlations between s-traits regulated by Bin632–Bin637 and the e-traits of OsDCL2a.
Figure 6
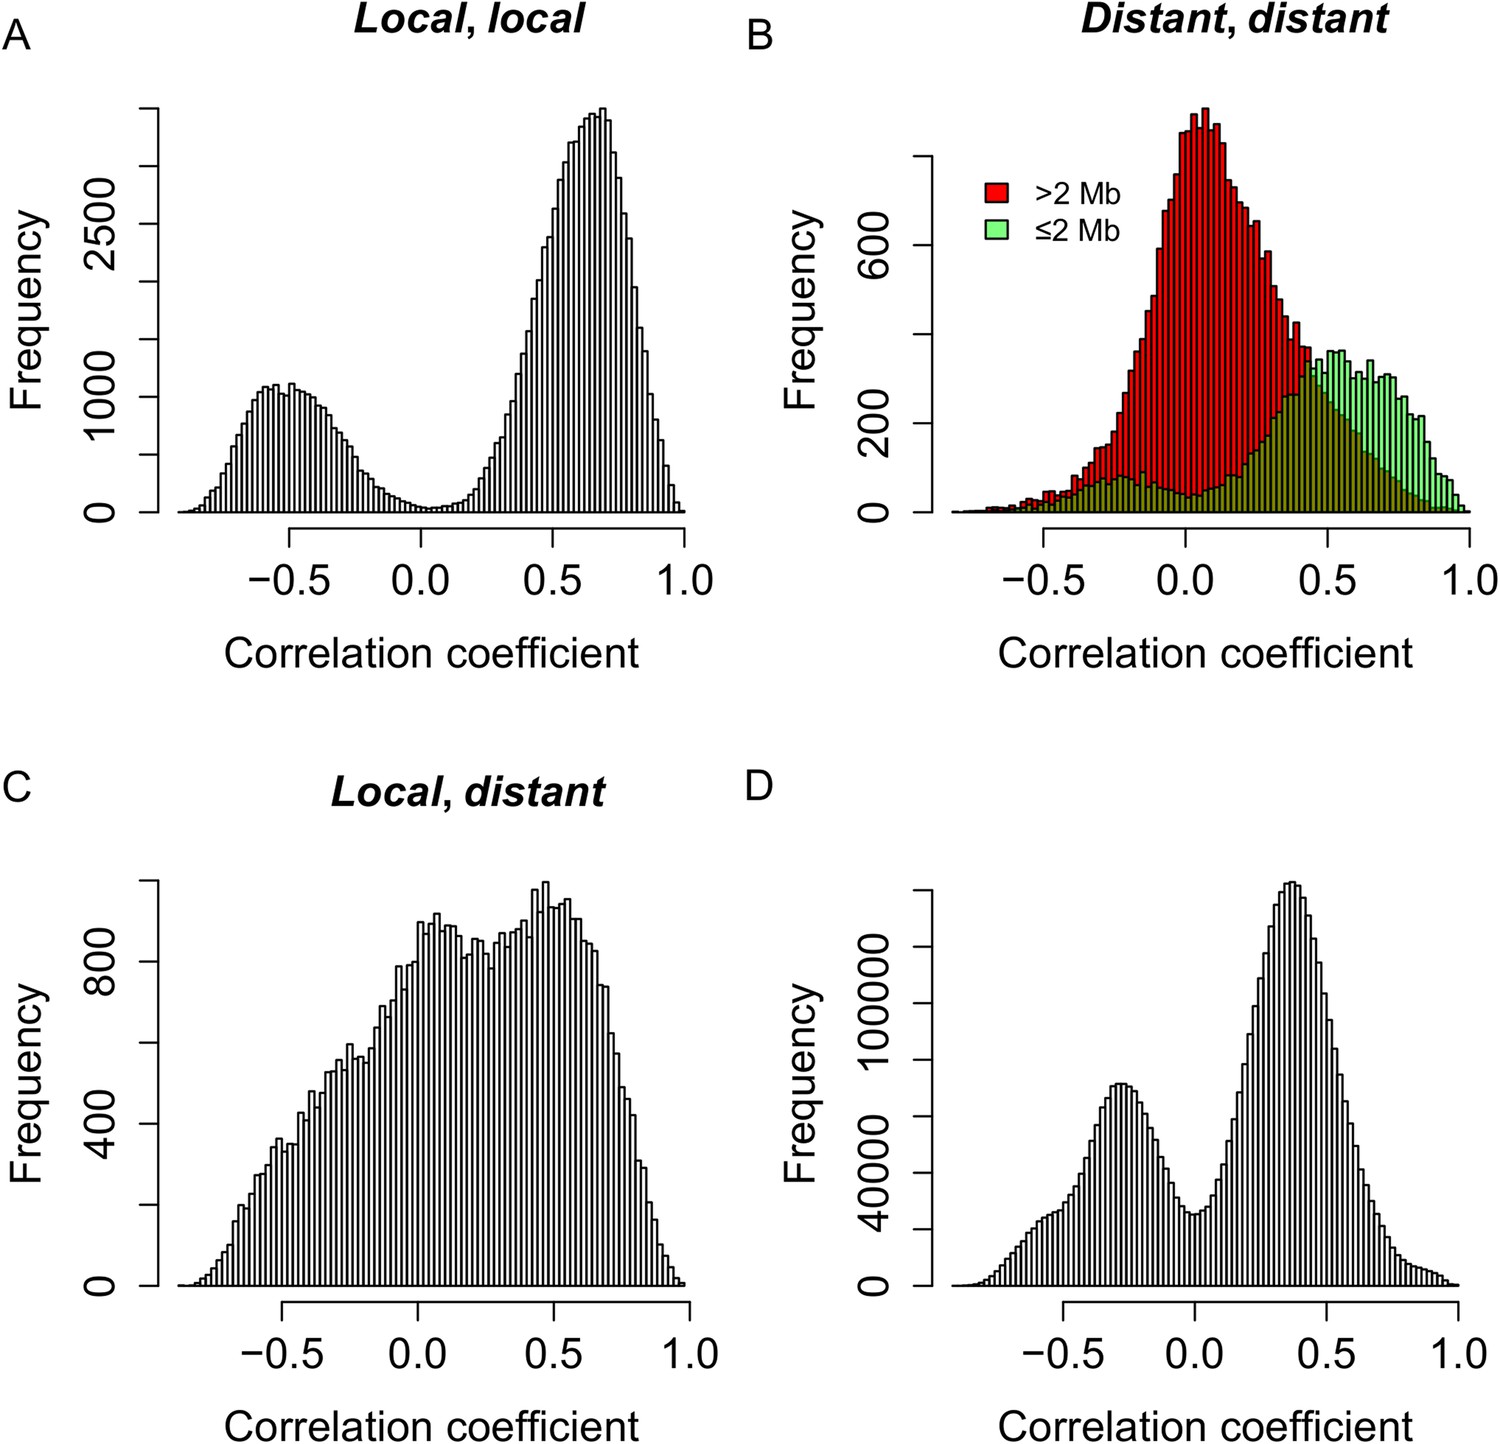
Genetic co-regulation between s-traits originating from the same mother genes.
(A) Expression correlations between pairs of s-traits originating from the same mother genes and both regulated by local-sQTLs. (B) Expression correlations between pairs of s-traits originating from the same mother genes and both regulated by distant-sQTLs. Green: distance between the two distant-sQTLs was within two 2 Mb; red: distance between the distant-sQTLs was larger than 2 Mb. (C) Expression correlations between pairs of s-traits from the same mother genes with one regulated by distant-sQTL and another one regulated by local-sQTL. (D) Expression correlations between pairs of s-traits from the whole genome regulated by distant-QTLs located in ≤2 Mb regions.
Figure 7

Genetic co-regulation between s-traits and their mother genes.
(A) Expression correlations between s-traits and their mother genes that were both controlled by local-QTLs. (B) Expression correlations between s-traits regulated by distant-sQTLs and their mother genes also controlled by distant-eQTLs. Green, the distance between distant-QTLs for s-traits and the mother genes is within 2 Mb. Red, the distance between distant-QTLs is larger than 2 Mb. (C) Expression correlations between s-traits regulated by local-sQTLs and their mother genes controlled by distant-eQTLs. (D) Expression correlations between s-traits regulated by distant-sQTLs and their mother genes controlled by local-eQTLs. (E) Expression correlations between s-traits and e-traits from the whole genome regulated by distant-QTLs located in ≤2 Mb.
Figure 8 with 1 supplement
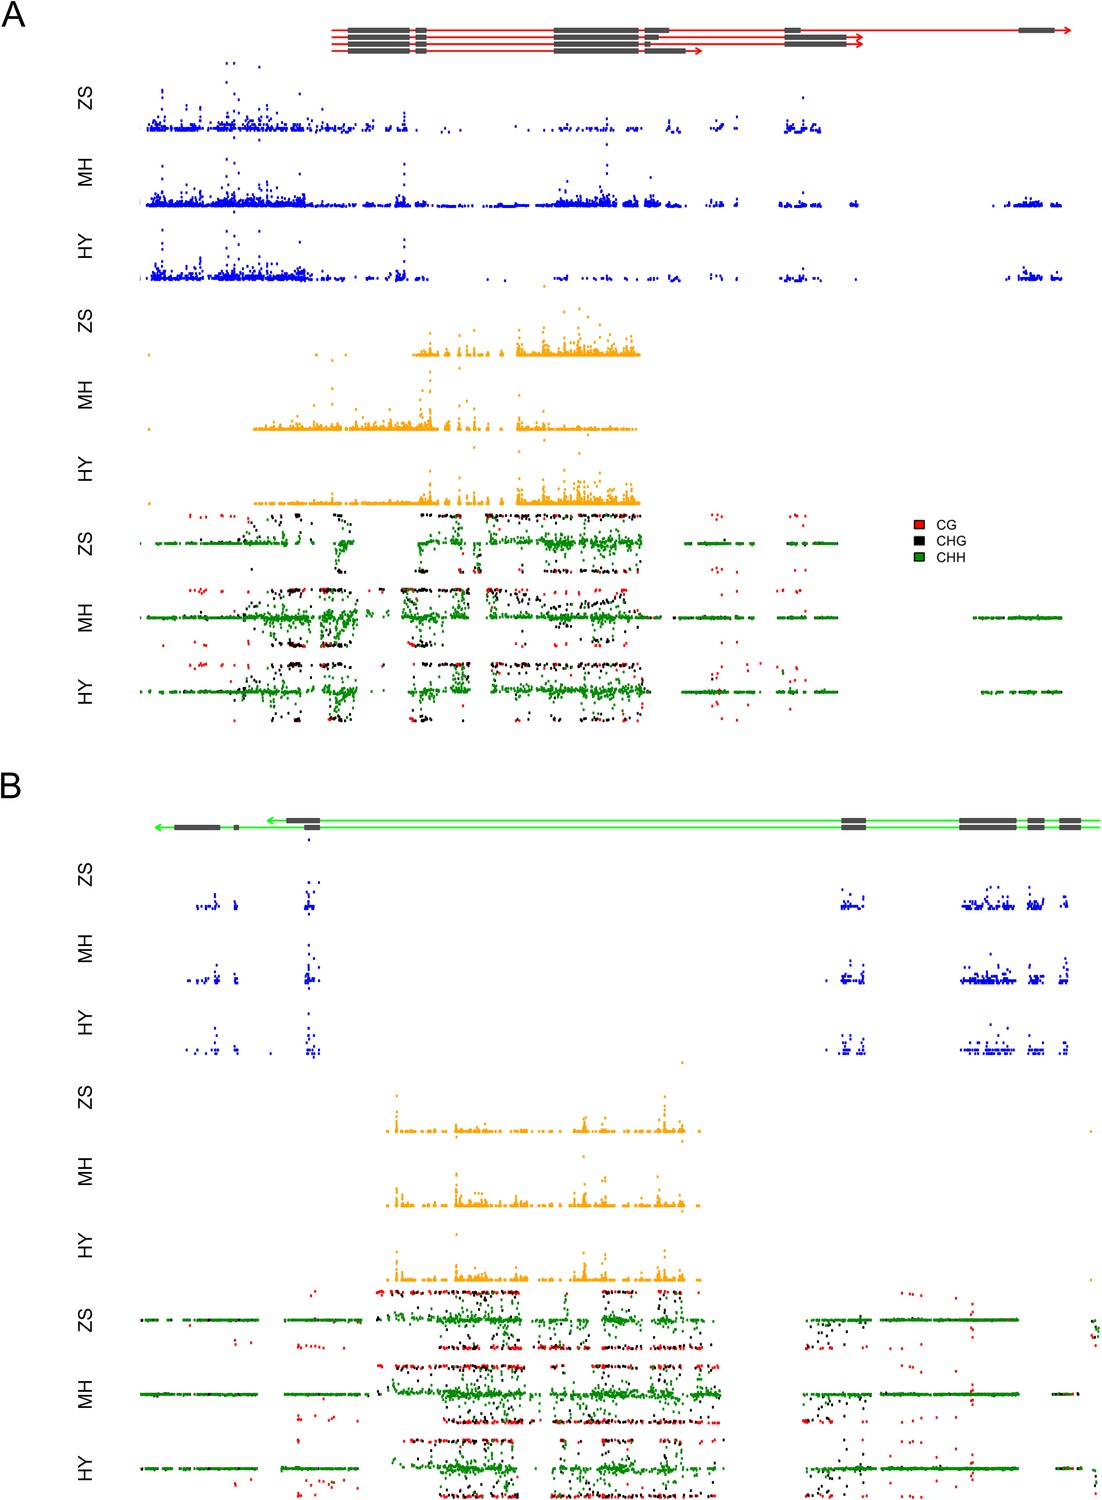
The expression levels of sRNA, mRNA, and the DNA methylation levels of the hybrid and its parents in the region of LOC_Os03g01360 and LOC_Os07g01240.
(A) The structure of LOC_Os03g01360 is shown in the top panel, with black color representing exons and red color indicating introns and UTRs. The number of mRNA reads is shown in blue color. The sRNAs expression level is shown in orange. The DNA methylation level is displayed in the bottom three panels. ZS, Zhenshan 97; MH, Minghui 63; HY, Hybrid. (B) The structure of LOC_Os07g01240 is shown in the top panel, with black color representing exons and green color indicating introns and UTRs. The meaning of different colors in the other panels is the same as in (A).
Figure 8—figure supplement 1
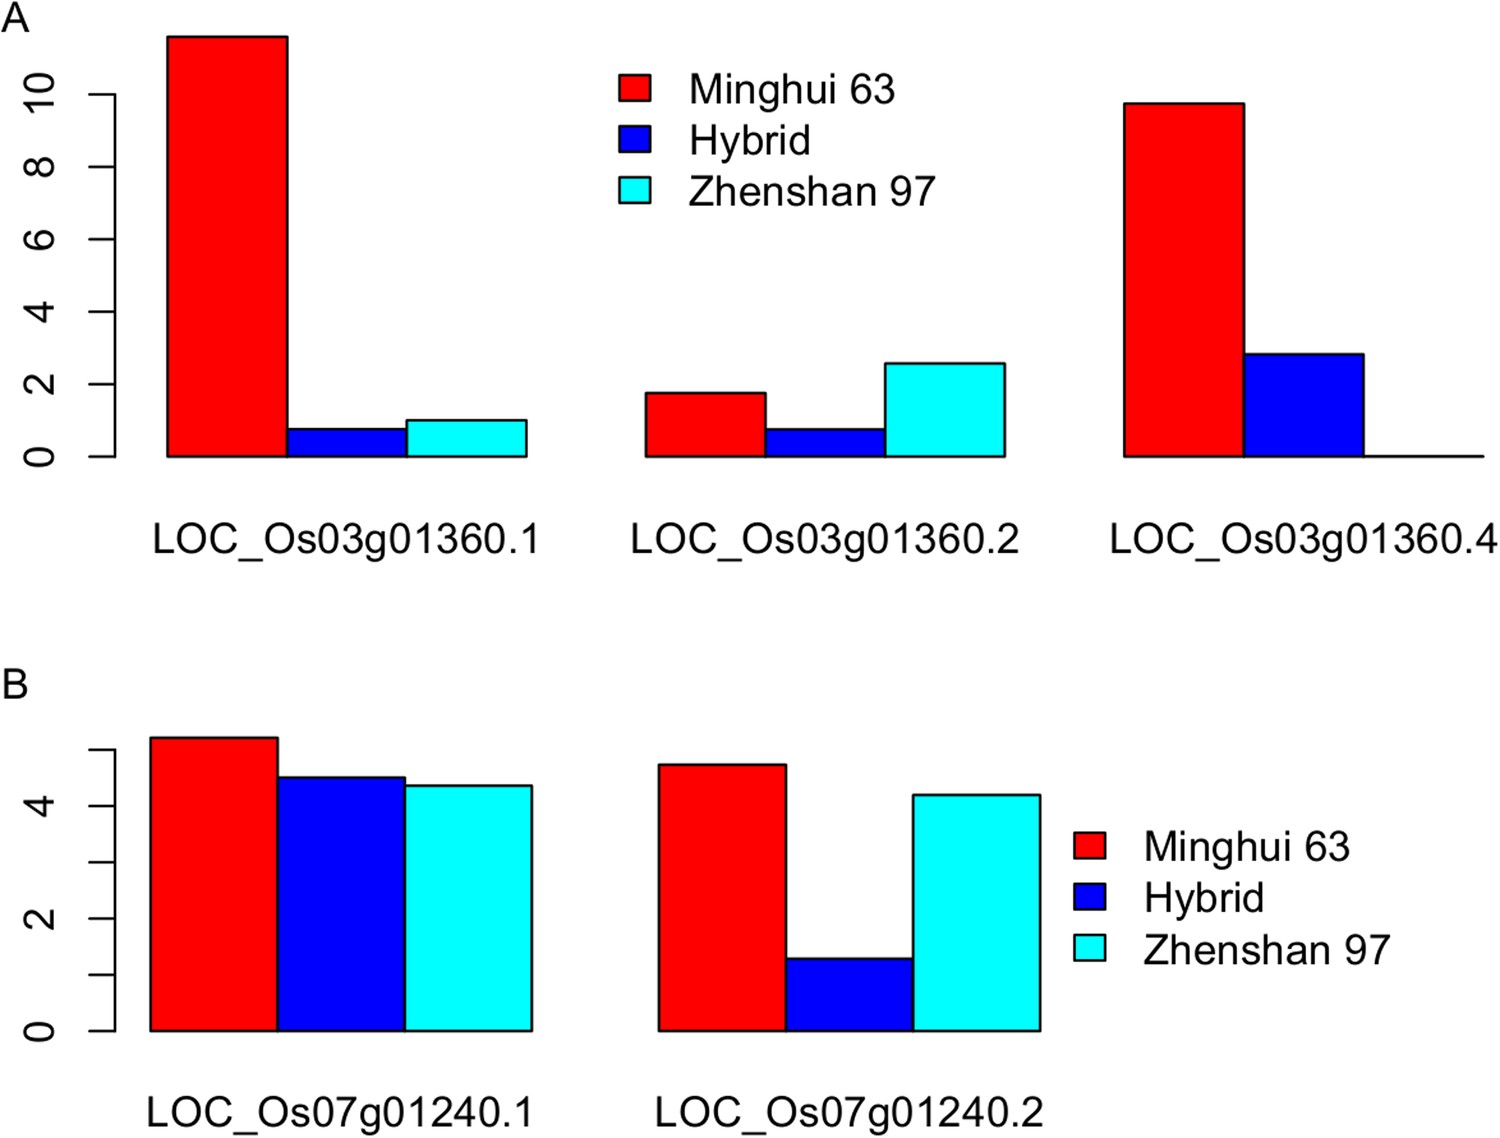
The expression level (fragments per kb per million [FPKM]) of the three transcripts of LOC_Os03g01360 (A) and the two transcripts of LOC_Os07g01240 (B) in Zhenshan 97, Minghui 63, and the hybrid.
https://doi.org/10.7554/eLife.03913.034Tables
Table 1
Average number of reads obtained for the 104 libraries from flag leaves of the IMF2 population and the parental lines
| Quality filtering* | Size filtering† | NcRNA filtering‡ | Genome mapping§ | Total# | |
|---|---|---|---|---|---|
| Redundant reads | 22,864,067 | 22,318,928 | 19,968,566 | 9,816,933 | 1,020,961,021 |
| Distinct reads | 5,106,654 | 5,035,073 | 4,986,184 | 2,499,233 | 53,613,739 |
-
*
Reads after filtering out low-quality reads.
-
†
Reads of 18–26 nt in length.
-
‡
Reads after eliminating ones matching tRNAs, rRNAs, snRNAs, and snoRNAs.
-
§
Reads mapped to the SNP-replaced reference genomes of the parents with unique locations allowing no mismatch.
-
#
The total reads of 104 libraries used to identify s-traits.
Download links
A two-part list of links to download the article, or parts of the article, in various formats.
Downloads (link to download the article as PDF)
Open citations (links to open the citations from this article in various online reference manager services)
Cite this article (links to download the citations from this article in formats compatible with various reference manager tools)
Genetic basis of sRNA quantitative variation analyzed using an experimental population derived from an elite rice hybrid
eLife 4:e03913.
https://doi.org/10.7554/eLife.03913


