Foxc1 dependent mesenchymal signalling drives embryonic cerebellar growth
- Seattle Children's Research Institute, United States
- University of Tennessee Health Sciences Center, United States
- Northwestern University, United States
- University of Washington, United States
Figures
Figure 1 with 2 supplements
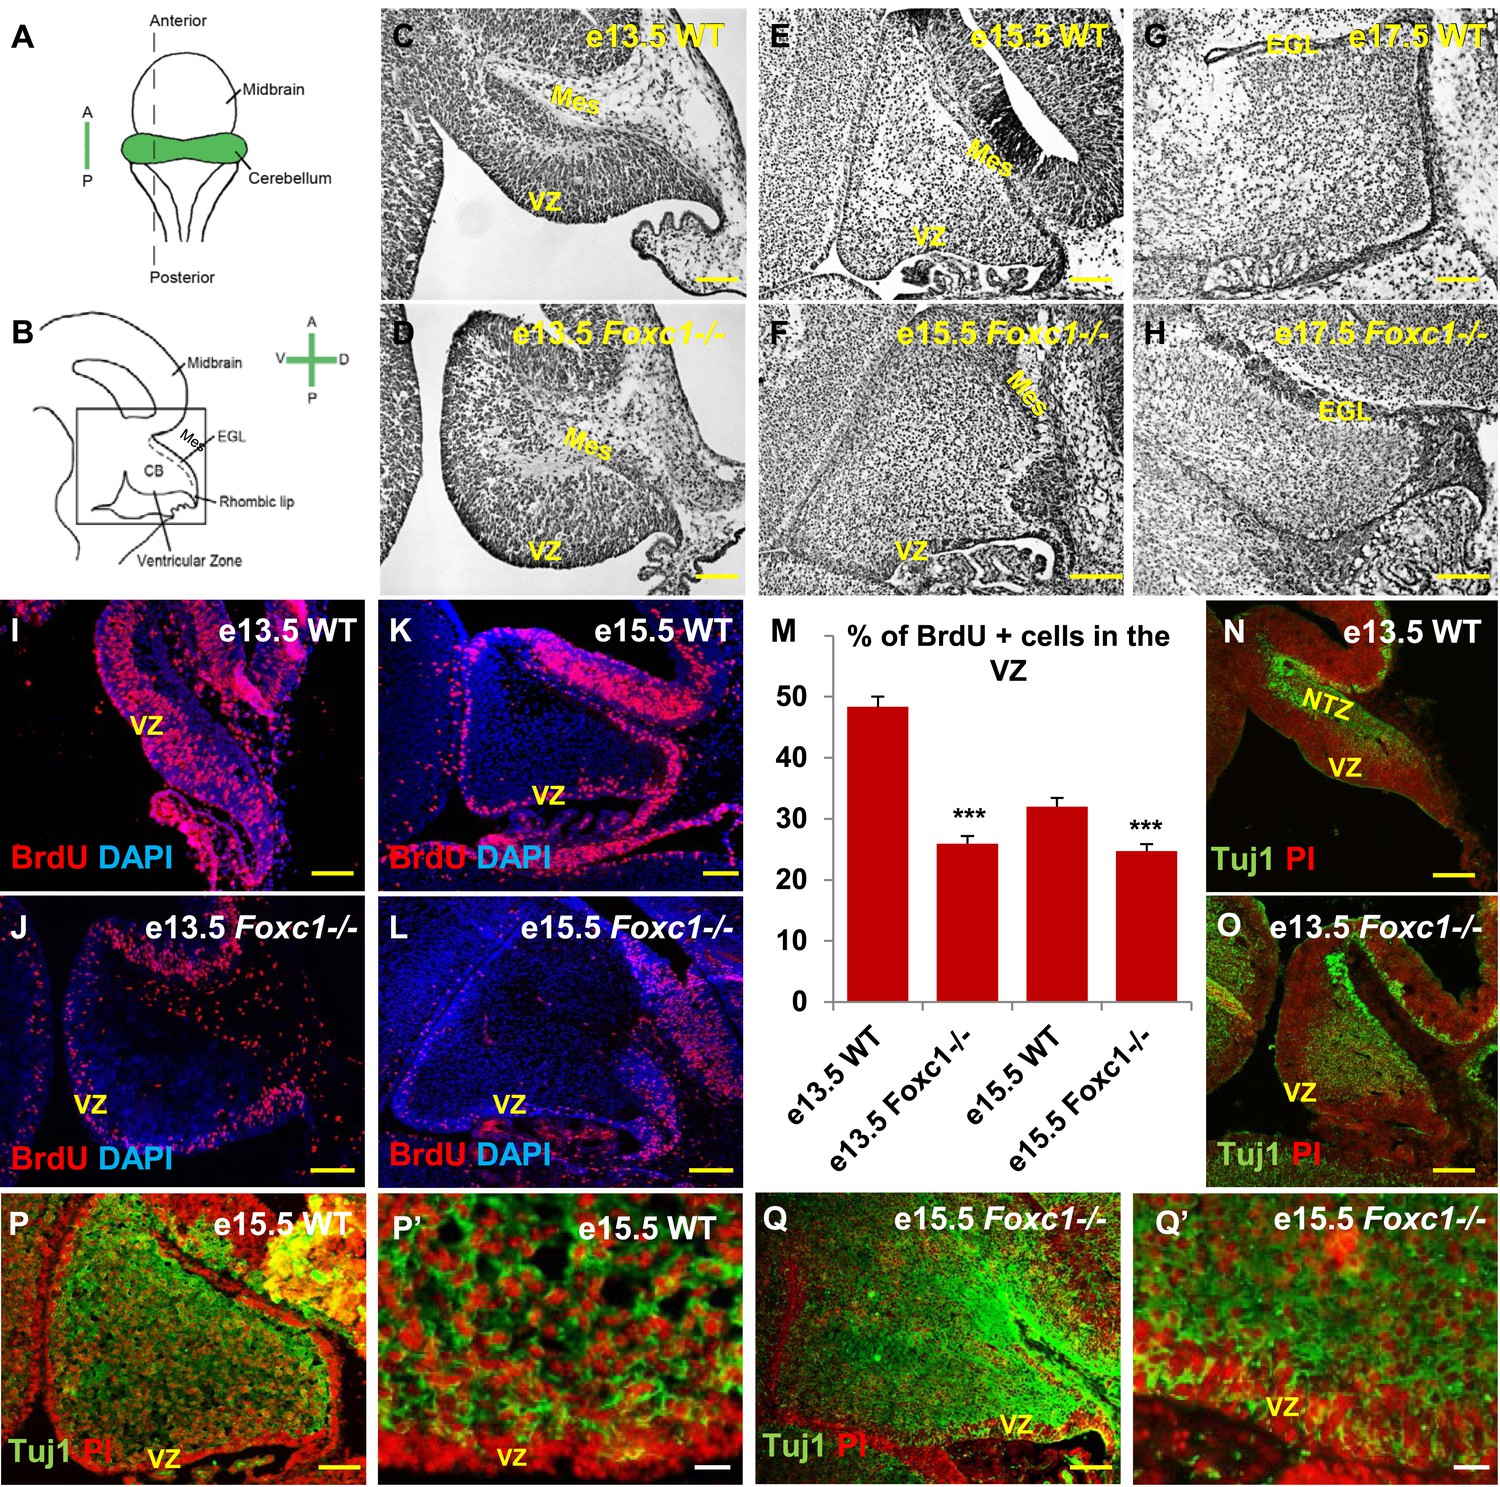
Foxc1 deletion leads to reduced proliferation and increased differentiation in the cerebellar ventricular zone.
(A) Schematic of a dorsal whole mount view of the embryonic mouse brain and (B) Sagittal section of the mid-hindbrain region. Abbreviations include the four axes; A—Anterior, P—Posterior, D—Dorsal, and V—Ventral; CB—Cerebellum and EGL—External Granule Layer. (C–H) Sagittal sections of e13.5 (C, D), e15.5 (E, F) and e17.5 (G, H) cerebellum from WT (C, E, G) and Foxc1−/− (D, F, H) mice. (I–L) Foxc1−/− mice showed a reduction in proliferation at e13.5 (J) and e15.5 (L), compared to WT (I, K). (M) Graph showing the percentage of BrdU positive cells in the cerebellar ventricular zone. The percentage of BrdU positive cells in the ventricular zone of the Foxc1−/− cerebellum was significantly lower than WT at e13.5 and e15.5. Data represented as mean percentage of BrdU positive cells ± s.e.m. *** indicates significance with respect to the corresponding WT Control (p < 0.05). (N–Q′) β-III Tubulin staining of the e13.5 (N–O) and e15.5 (P–Q′) cerebellum showed by increased differentiation in the ventricular zone of Foxc1 mutants at both e13.5 (O) and e15.5 (Q, Q′) compared to WT (N, P–P′). Abbreviations used; Mes—Mesenchyme, VZ—Ventricular Zone. Scale bar = 100 µm for all images, except P′ and Q′ where the scale bar = 20 µm.
Figure 1—figure supplement 1
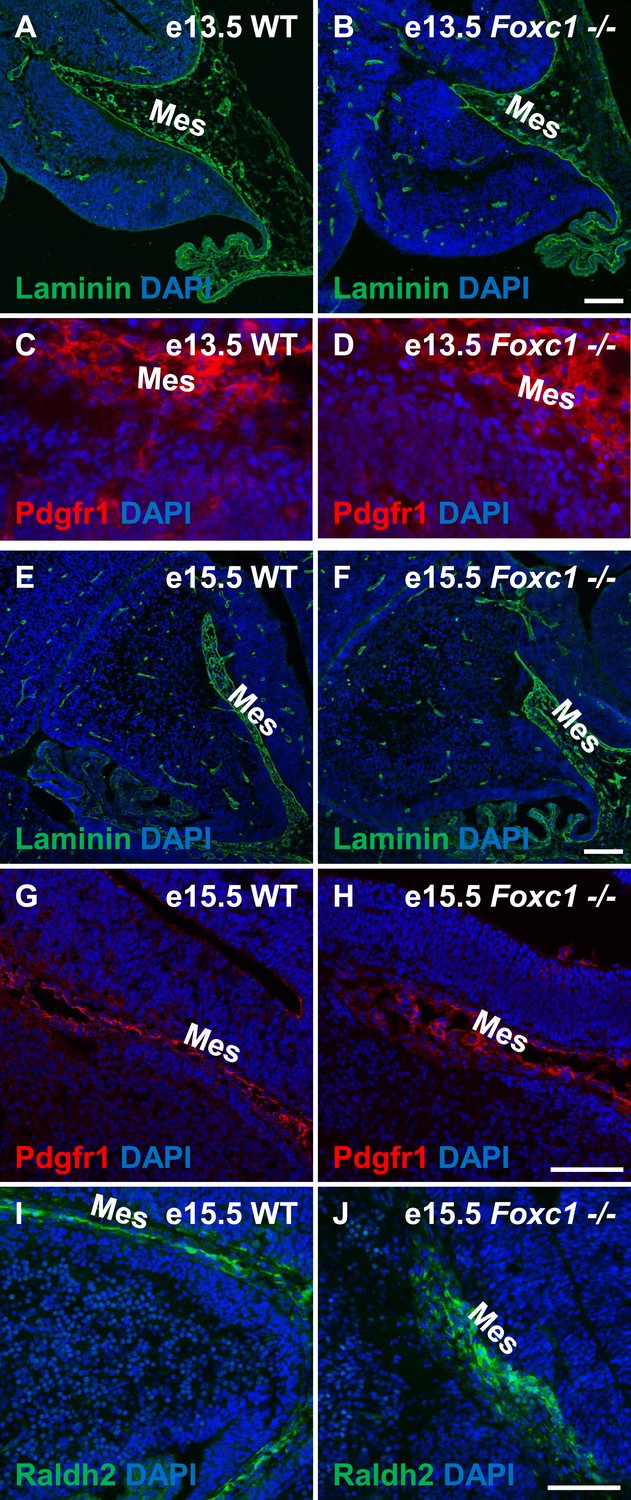
Posterior fossa meningeal formation is not compromised in the Foxc1−/− mutants.
(A–F) Sagittal sections of e13.5 (A–D), e15.5 (E–J) cerebellum from WT (A, C, E, G, I) and Foxc1−/− (B, D, F, H, J) mice stained for Laminin (A–B; E–F), Pdgfr1 (C–D; G–H), and Raldh2 (E–F; I–J), clearly indicate that posterior fossa mesenchymal formation in Foxc1−/− mutants is not compromised. Abbreviations used include Mes—Mesenchyme. Scale bar = 100 µm for all images.
Figure 1—figure supplement 2
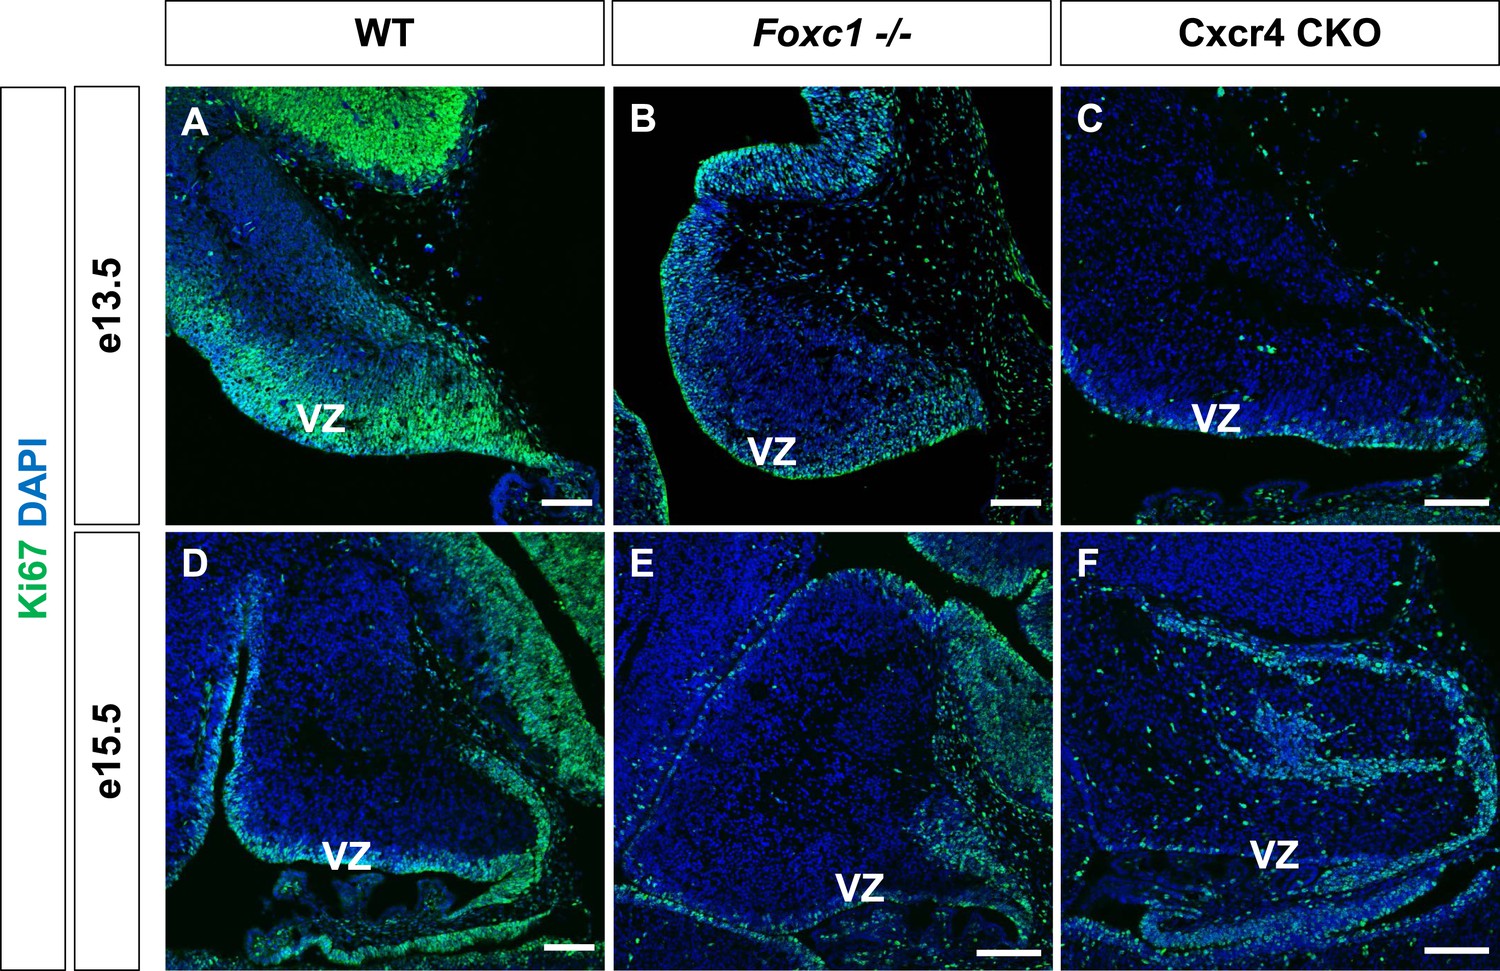
Ki67 expression in the Foxc1−/− and Cxcr4 conditional knockout cerebellum.
(A–F) Sagittal sections of e13.5 (A–C), e15.5 (D–F) cerebellum from WT (A, D), Foxc1−/− (B, E) and Cxcr4 CKO (C, F) mice. Foxc1−/− and Cxcr4 CKO mice showed a reduction in VZ proliferation as evinced by Ki67 staining. Abbreviations used include VZ—Ventricular Zone. Scale bar = 100 µm for all images.
Figure 2
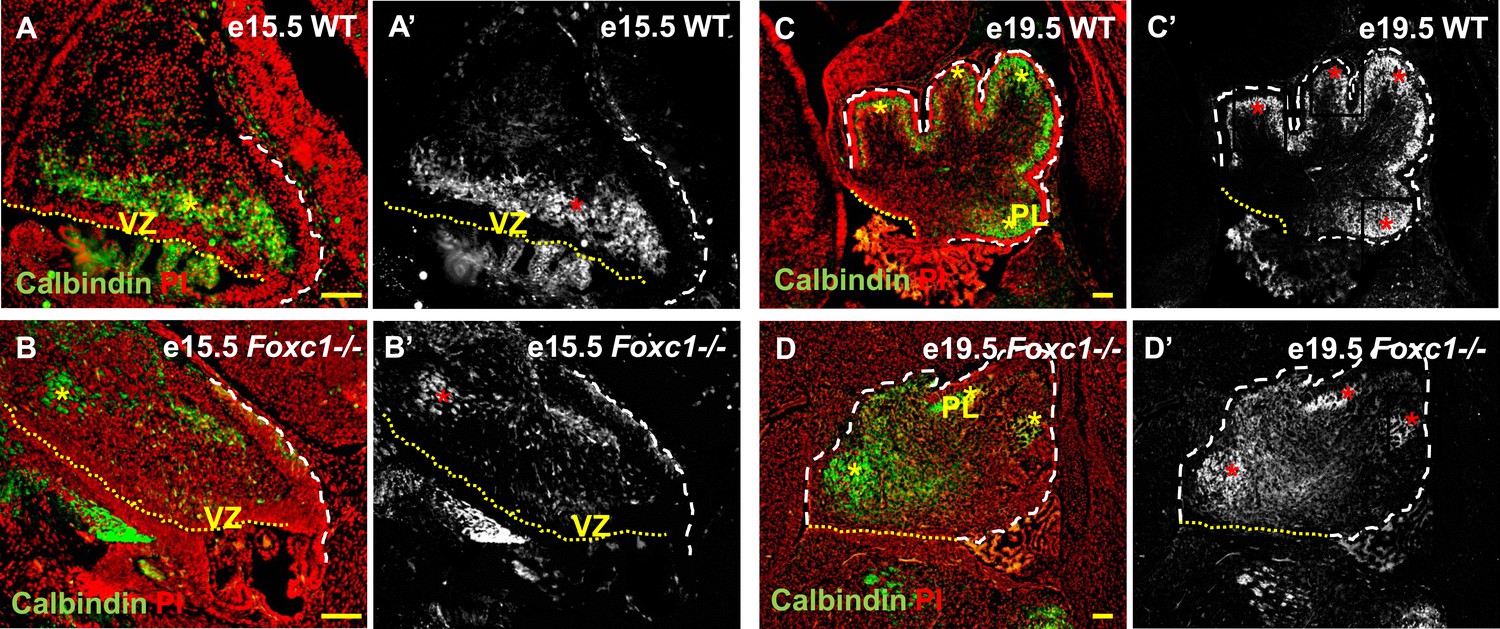
Abnormally positioned Purkinje cells are present in the cerebellum of Foxc1−/− mice.
(A–D) Sagittal sections of the WT (A, A′; C, C′) and Foxc1−/− cerebellum (B, B′, D, D′) stained for Calbindin. In the e15.5 WT cerebellum (A–A′, asterisk), Purkinje cells were present in a band overlying the ventricular zone. However, in the Foxc1 null mutant, (B–B′, asterisk) fewer ectopically located PCs were present. By e19.5, PCs in the WT (C–C′) formed a layer of cells directly underneath the ML in the cerebellar cortex (C′, asterisk). However, in the Foxc1 null mutant (D, D′), the PCs were arranged as clusters within the anlage (D′, asterisk). Abbreviations used; PL—Purkinje Layer and VZ—Ventricular Zone. The white dashed line indicates the outer boundary of the EGL and the mesenchyme, while the yellow dotted line represents the cerebellar ventricular surface. The red and yellow asterisks represent the PL. A′–D′ are grey scale images of A-D respectively. Scale bar = 100 µm.
Figure 3
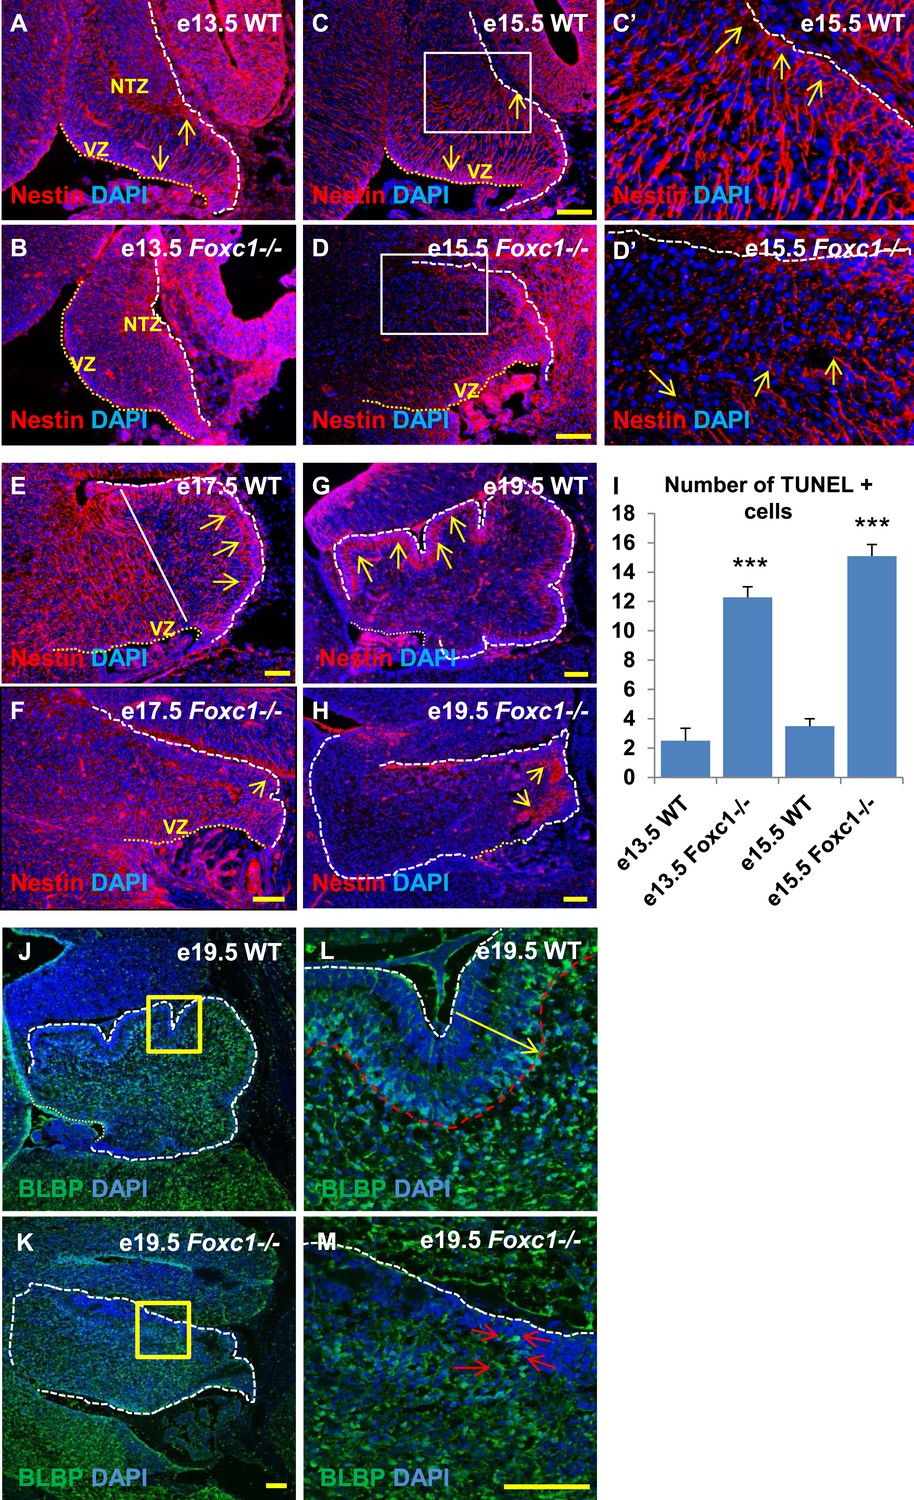
Radial glial and Bergmann glial morphology is severely disrupted in Foxc1−/− mice.
(A–H) Sagittal sections of the embryonic mouse cerebellum in WT (A, C, C′, E, G) and Foxc1 null mutants (B, D, D′, F, H) at e13.5 (A, B), e15.5 (C–D′), e17.5 (E, F) and 19.5 (G, H) stained for Nestin. While radial glial fibers extended from the ventricular zone to the pial surface in the WT cerebellum (C, C′, arrows), in the Foxc1 null mutant, fibers were discontinuous and did not extend all the way to the pial surface (D, D′, arrows). In the WT cerebellum, Bergmann glial fibers extended from the EGL to the PL at e17.5 (E) and e19.5 (G, L; arrows). The white straight line in (E) demarcates the anlage into two regions—an anterior (left) region where fibers extend from the VZ to the pia, and the other (right) where Bergmann glial fibers extend from the EGL to the IGL. In the Foxc1 null mutant, these two zones were not apparent and fiber morphology was severely disrupted (F, H; arrows). (I) Graph showing the number of TUNEL positive cells that span the length of the cerebellar ventricular zone. The number of TUNEL positive cells in the ventricular zone of the Foxc1−/− cerebellum was significantly higher than WT at e13.5 and e15.5. Data represented as average number of TUNEL positive cells per section analysed ± s.e.m. *** indicates significance with respect to corresponding WT Control (p < 0.05). (J–M) Sagittal sections of the WT (J, L) and Foxc1−/− cerebellum (K, M) stained for BLBP. In the e19.5 WT cerebellum (J, box; L, arrow), BG were present as a layer overlapping with the PL. However, in the Foxc1 null mutant, (K, box; M, arrow) BG were ectopically located in the EGL. Abbreviations used; NTZ—Nuclear Transitory Zone and VZ—Ventricular Zone. The white dashed line indicates the outer boundary of the EGL and the mesenchyme, while the yellow dotted line represents the cerebellar ventricular surface. The white straight line in Image E represents the boundary between two zones—one where fibers extend from the VZ to the pia, and the other where BG fibers extend from the EGL to the IGL. C′–D′ are high magnification images of C–D respectively. Scale bar = 100 µm.
Figure 4
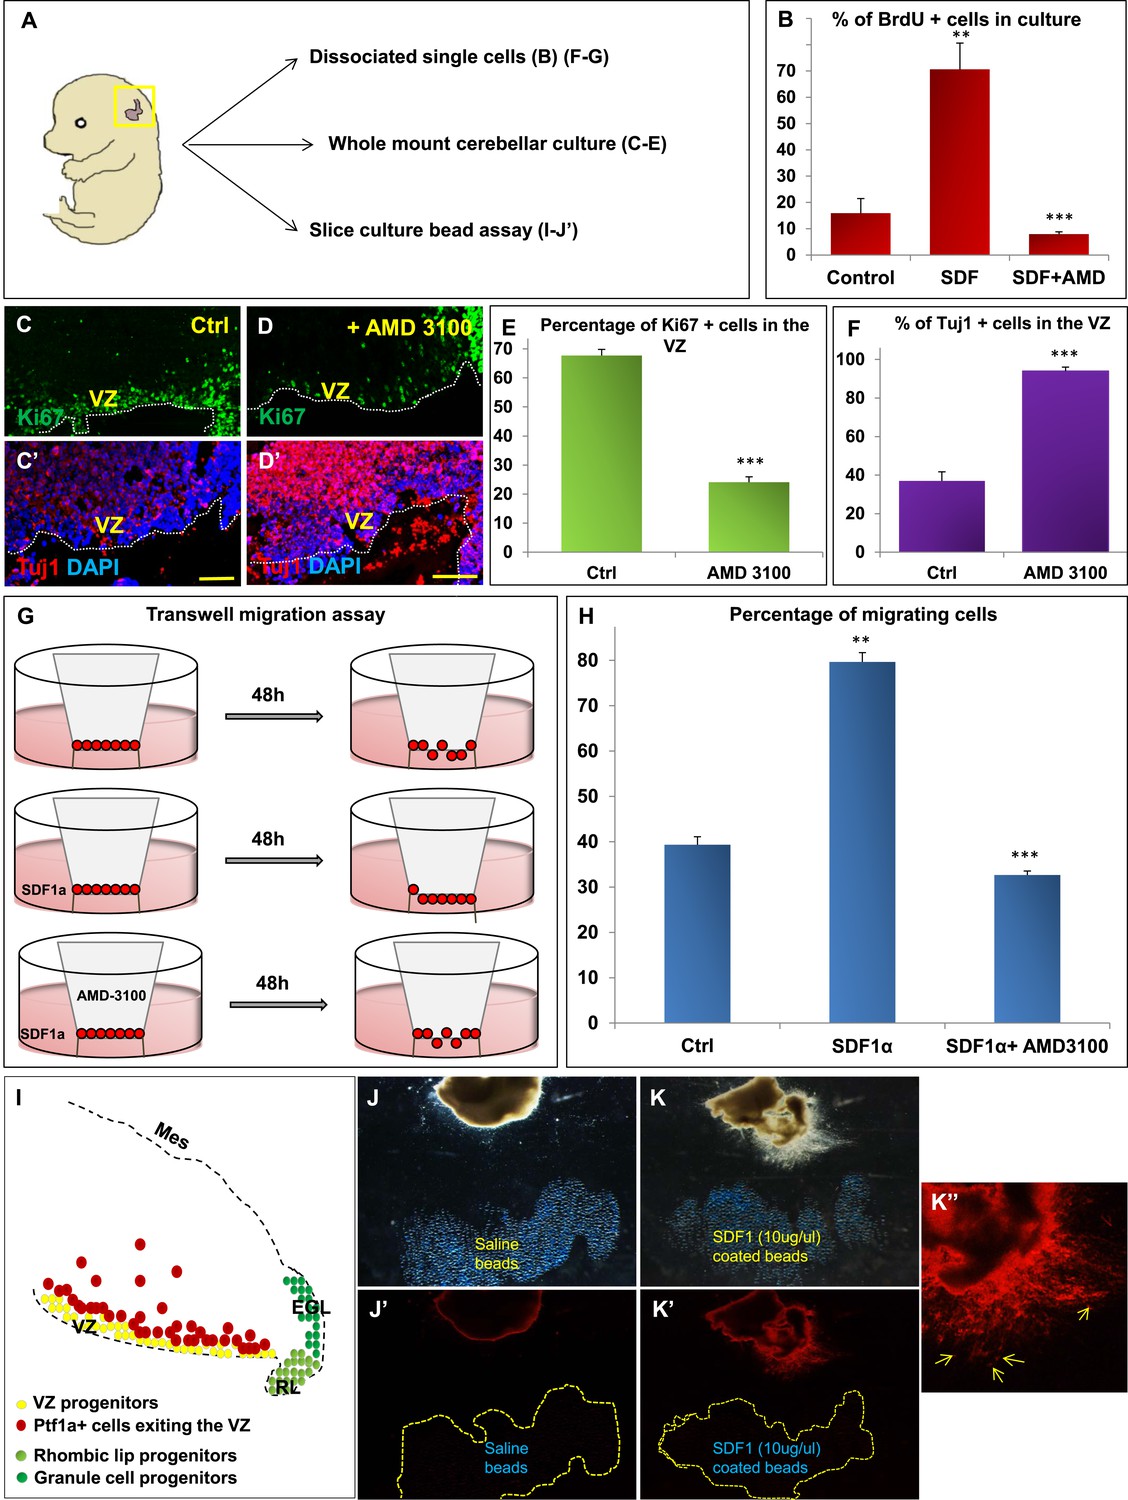
SDF1α induces cell division in cerebellar ventricular zone progenitors and also functions as a chemoattractant.
(A) Schematic of dorsal whole mount view of the embryonic mouse head and a brief description of experiments included in the figure. (B) Graph showing the percentage of BrdU+ cells in primary dissociated cerebellar culture. Addition of SDF1α significantly increased BrdU uptake by cells. Addition of AMD3100, an antagonist of SDF1α significantly reduced BrdU incorporation. (C, D; C′, D′) Sagittal sections of e13.5 cerebellum cultured whole mount for 1 day and stained for Ki67 (inset) and β-III Tubulin. Addition of AMD3100 to the culture significantly reduced cell proliferation and increased differentiation in the ventricular zone (D). (E) Graph showing the percentage of Ki67 and (F) β-III Tubulin+ cells in the cerebellar ventricular zone. (G) Schematic describing the transwell migration assay. Addition of SDF1α significantly increased the number of cells migrating through the membrane of the insert. Addition of AMD3100 to the upper well significantly lowered the number of migrating cells (H). (H) Graph quantifying the results of the experiment described in (G) (I) Schematic of a sagittal section of the e13.5 cerebellum. Ventricular zone progenitors are labelled in yellow, while Ptf1a positive cells that exit the ventricular zone are marked red. RL progenitors are labelled light green while granule cell progenitors exiting the RL are labelled dark green. (J–K′′) Matrigel assay to study the effect of SDF1α on the neuronal migration. Ptf1a positive cells from an e13.5 cerebellar slice, when incubated with SDF1α coated acrylic beads were seen to move towards the source of the chemokine (K–K′′). Saline coated beads had no effect on migration (J, J′). Abbreviations used; VZ—Ventricular Zone, RL—Rhombic Lip, EGL—External Granular Layer and Mes—Mesenchyme. The white dotted line in (C–D′) represents the cerebellar ventricular surface. Scale bar = 100 µm. In Graphs (B), (E, F) and (H), data is represented as mean percentage of BrdU or β-III Tubulin positive cells or migrating cells ± s.e.m. In (B) and (H) ** indicates significance with respect to Control, while *** indicates significance with respect to SDF1α treatment. In (E, F) *** indicates significance with respect to Control. (p < 0.05), for all data.
Figure 5
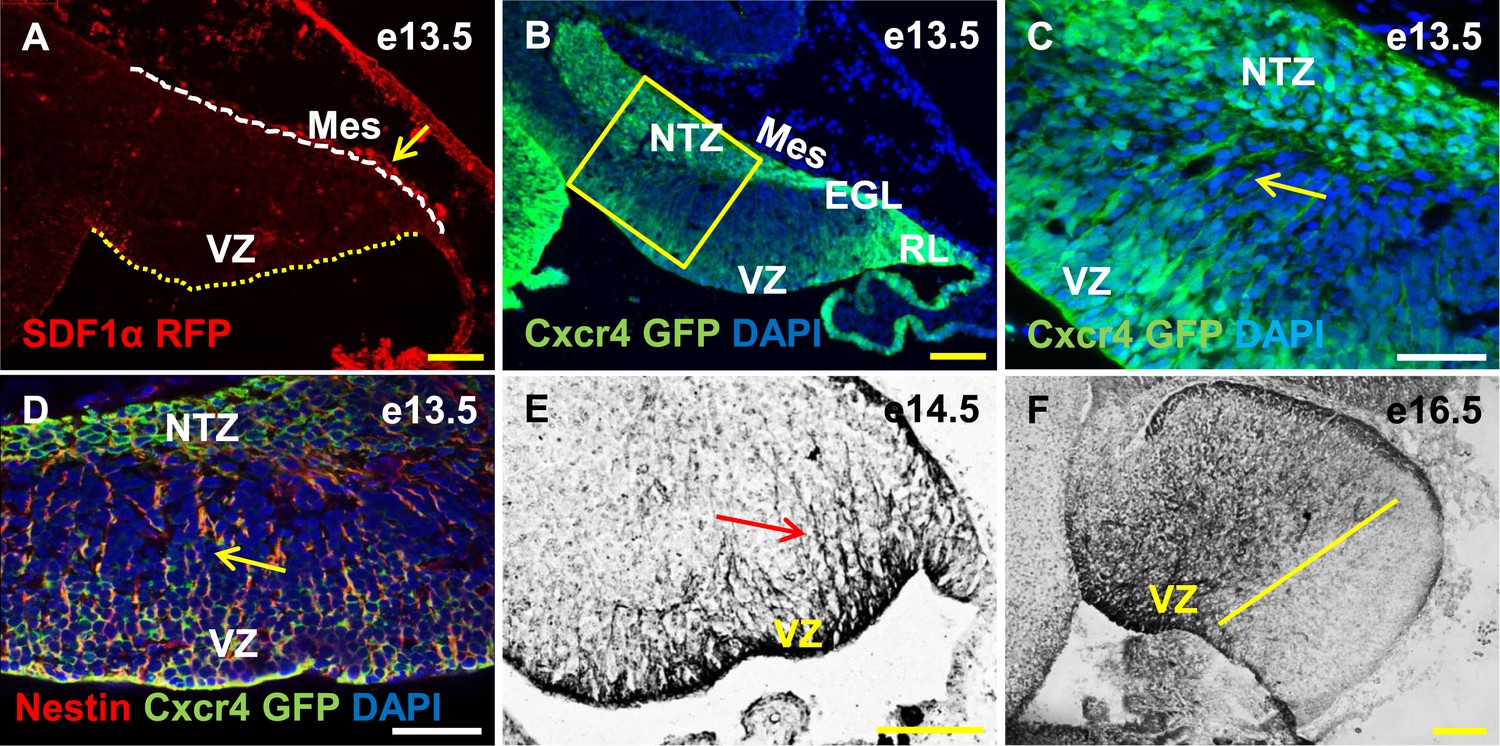
Cxcr4, a receptor of SDF1α, is strongly expressed in the soma and fibers of cerebellar radial glia.
(A–F) Sagittal sections of the developing mouse cerebellum at e13.5 (A, B, C, D), e14.5 (E) and e17.5 (F). RFP-tagged SDF1α is secreted by the mesenchyme (A, arrow). In contract, the receptor of SDF1α, GFP-tagged Cxcr4 is strongly expressed in the ventricular zone, NTZ, EGL and RL at e13.5 (B–C). Cxcr4 expression was also seen in the fibers that extended out of the ventricular zone (C, D, E arrow). These fibers colabelled with Nestin (D, arrow) indicating they were radial glial fibers. Cxcr4 expression persisted in radial glial fibers at e17.5, but only confined to the anterior region containing radial glial fibers (F, left of the yellow line). Abbreviations used; VZ—Ventricular Zone, NTZ—Nuclear Transitory Zone, RL—Rhombic Lip, EGL—External Granule Layer and Mes—Mesenchyme. The white dashed line in (A) indicates the outer boundary of the EGL and the mesenchyme, while the yellow dotted line represents the cerebellar ventricular surface. Scale bar = 100 µm for all images except C, D, where the scale bar = 50 µm.
Figure 6
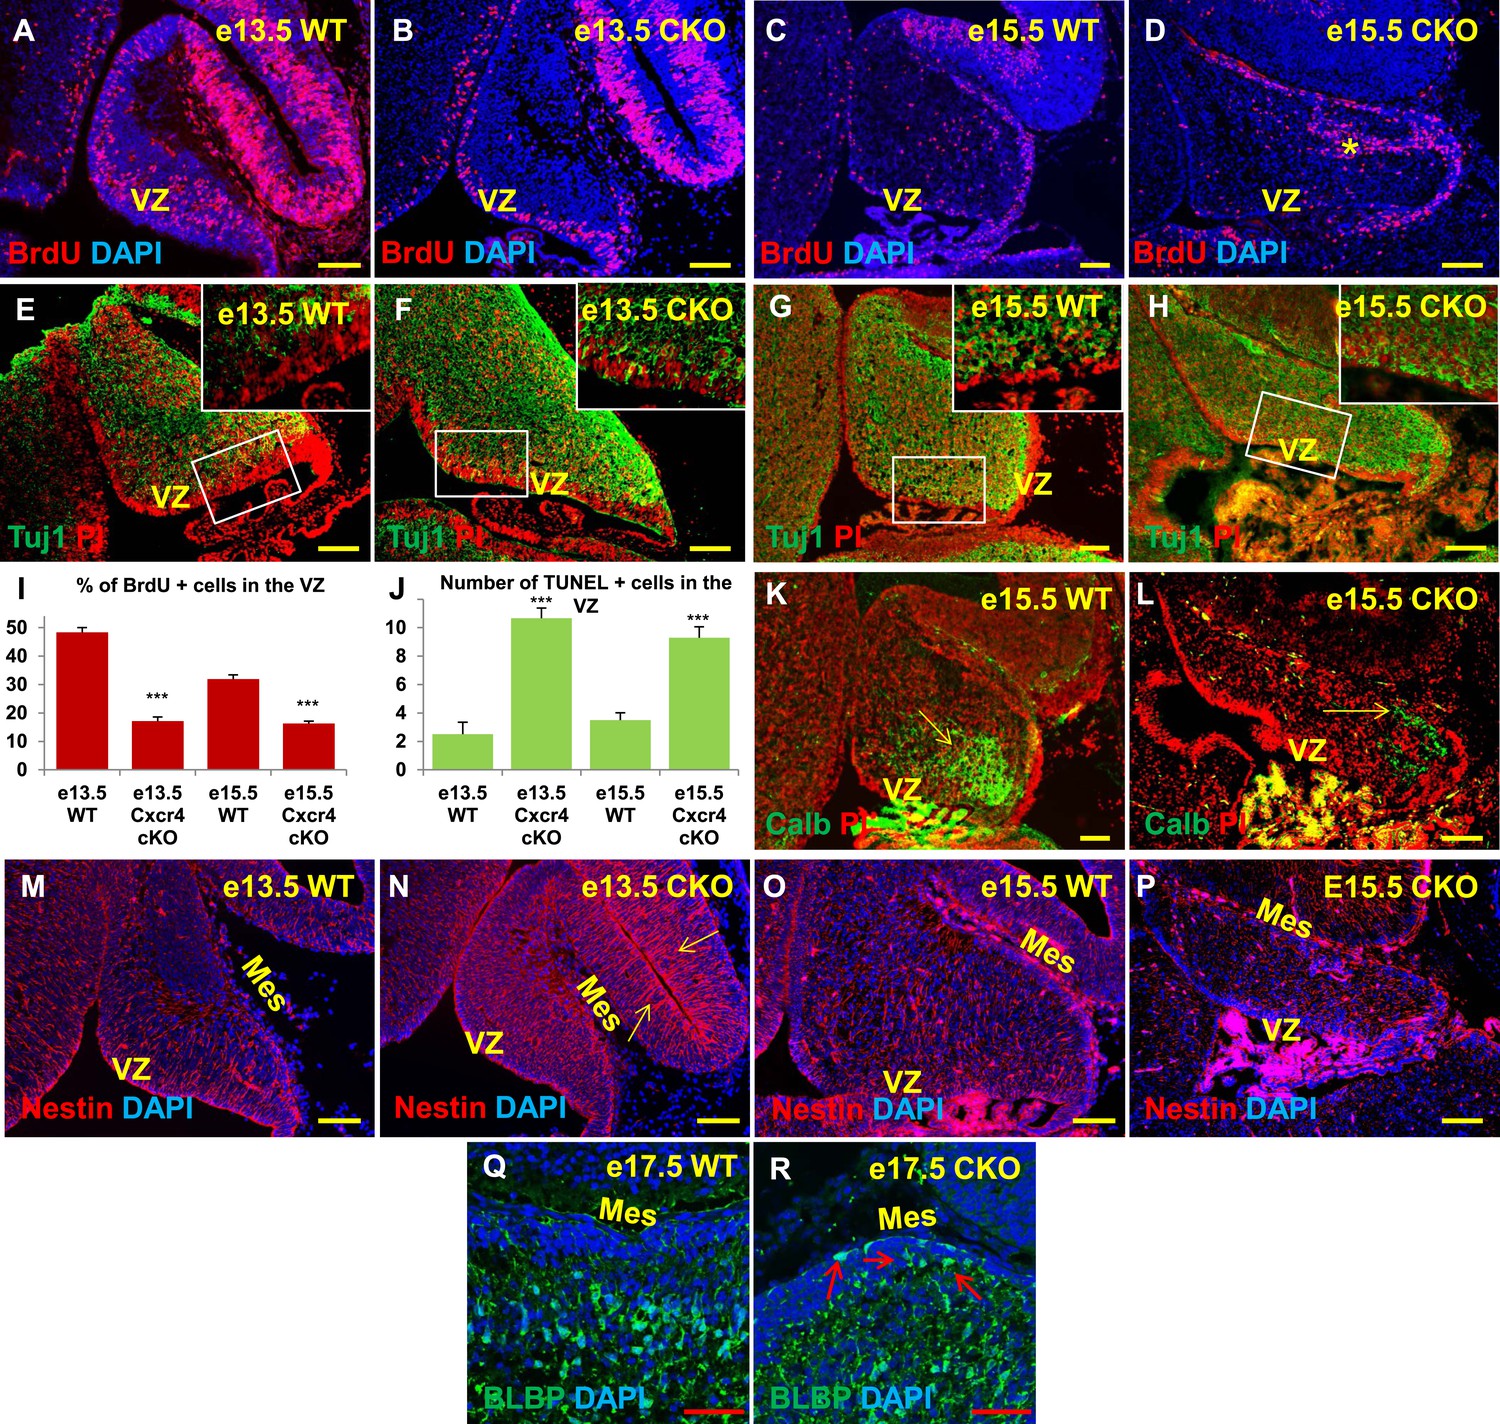
Aberrations in cell division, differentiation and migration in Cxcr4 radial glial conditional knockout mice are similar to those in Foxc1 null mutants.
(A–H) Sagittal sections of e13.5 (A, B, E, F) and e15.5 (C, D, G, H) cerebellum from WT (A, C, E, G) and Cxcr4 Conditional Knockout (B, D, F, H) mice. (A–D) Cxcr4 conditional knockout mice showed a reduction in proliferation at e13.5 (B) and e15.5 (D), compared to WT (A, C). Reduced proliferation was accompanied by increased differentiation in the cerebellar ventricular zone of Cxcr4 CKO mice at both e13.5 (F) and e15.5 (H). The ventricular zone in WT cerebellum at both e13.5 (E) and e15.5 (H) largely consisted of β-III Tubulin negative cells. The insets in images (E–H) represent the magnified image of boxed regions within the cerebellar ventricular zone. (I) Graph showing a significant reduction in the percentage of BrdU positive cells in the cerebellar ventricular zone of Cxcr4 CKO compared to WT cerebellar ventricular zone. Data are represented as mean percentage of BrdU positive cells ± s.e.m. *** indicates significance with respect to corresponding WT Control. (p < 0.05). (J) Graph showing a significant increase in the number of TUNEL positive cells in the cerebellar ventricular zone of Cxcr4 CKO compared to WT animals. Data are represented as mean number of TUNEL positive cells ± s.e.m. *** indicates significance with respect to corresponding WT Control. (p < 0.05). (K–L) Sagittal sections of e15.5 cerebellum from WT (K) and Cxcr4 CKO (L) mice stained for Calbindin showing aberrant number and position of PCs in the CKO. (K–L) Sagittal sections of e13.5 cerebellum (M, N) and e15.5 (O, P) from WT (M, O) and Cxcr4 CKO (N, P) mice stained for Nestin. The morphology of radial glial fibers in the Cxcr4 CKO greatly resembled that in the Foxc1 mutant. (Q–R) Sagittal sections of e17.5 cerebellum from WT (Q) and Cxcr4 CKO (R) mice stained for BLBP. The morphology and positioning of BG fibers in the Cxcr4 CKO (R, arrows) is similar to the Foxc1 mutant. Abbreviations used include VZ—Ventricular Zone, and Mes—Mesenchyme. Scale bar = 100 µm for all images, except for Q–R where the scale bar = 50 µm.
Figure 7
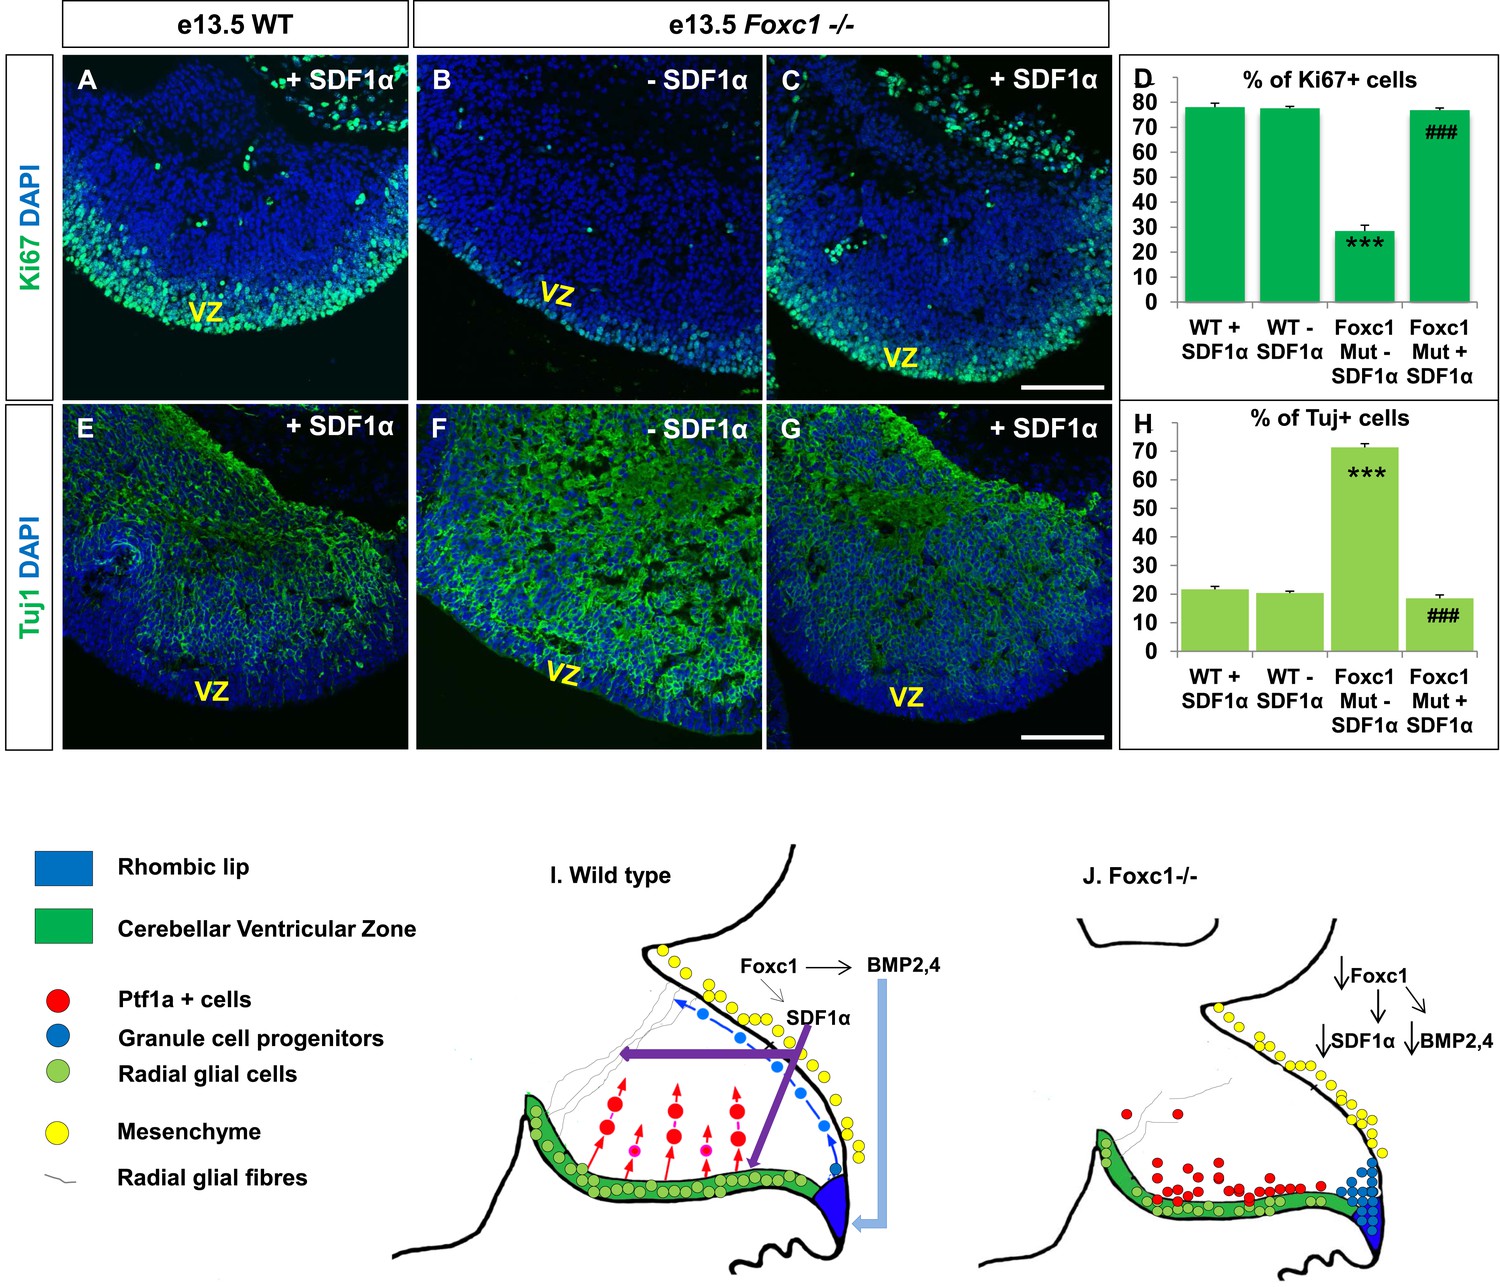
Exogenously applied SDF1α rescues the Foxc1−/− mutant phenotype.
(A–C) Sagittal sections of the e13.5 whole cerebellar tissue from WT (A) and Foxc1−/− (B–C) embryos, stained for Ki67. Addition of SDF1α to the culture significantly increased proliferation in the Foxc1−/− cerebellar VZ (C) as compared to its mutant negative control not treated with SDF1α (B). Addition of SDF1α did not significantly increase proliferation in the WT ventricular zone (A, D). (D) Graph showing the percentage of Ki67 cells in the cerebellar ventricular zone. (E-–G) Sagittal sections of the e13.5 whole cerebellar tissue from WT (E) and Foxc1−/− (F–G) embryos stained for β-III Tubulin. SDF1α significantly reduced the number of Tuj1+ cells in the VZ of the Foxc1−/− mutant (G) as compared to its mutant negative control (F). Addition of SDF1α did not significantly alter differentiation levels in WT embryos (E, H). (H) Graph showing the percentage of β-III Tubulin+ cells in the cerebellar ventricular zone. Data for both graphs (D) and (H) are represented as mean number of Ki67 or Tuj1 positive cells ± s.e.m. *** indicates significance with respect to corresponding WT Controls; ### indicates significance with respect to the corresponding Foxc1−/− mutant—SDF1α negative control. (I) Schematic of a sagittal section of the embryonic mouse cerebellum. In the WT cerebellum, mesenchymal Foxc1 controls the expression of several secreted factors such as SDF1α and Bmp2,4. SDF1α binds to its receptor Cxcr4 which is widely expressed in the RL, ventricular zone and EGL. SDF1α induces proliferation in the cerebellar ventricular zone. Not only is it required to maintain radial glia and their processes, it also functions as a chemoattractant to neurons migrating away from the ventricular zone. In the RL, Bmps maintain the progenitor pool, and SDF1α acts to attract the GC progenitors from the RL to form the EGL, thereby maintaining these progenitors at the pial surface. (J) In the Foxc1−/− cerebellum, deletion of Foxc1 leads to a significant downregulation of SDF1α and Bmps. A reduction in SDF1α expression causes reduced ventricular zone proliferation, increased differentiation and abnormal migration. Increased cell death and dysmorphic radial glial fibers are also observed. GCs migrating out of the RL into the EGL follow abnormal paths away from the pial surface into the interior of the cerebellar anlage. Absence of this chemoattractant leads to a buildup of cells along the ventricular zone and RL.
Download links
A two-part list of links to download the article, or parts of the article, in various formats.
Downloads (link to download the article as PDF)
Open citations (links to open the citations from this article in various online reference manager services)
Cite this article (links to download the citations from this article in formats compatible with various reference manager tools)
Foxc1 dependent mesenchymal signalling drives embryonic cerebellar growth
eLife 3:e03962.
https://doi.org/10.7554/eLife.03962


