Translation of 5′ leaders is pervasive in genes resistant to eIF2 repression
- Lomonosov Moscow State University, Russia
- University College Cork, Ireland
- Trinity College Dublin, Ireland
Figures
Figure 1 with 2 supplements
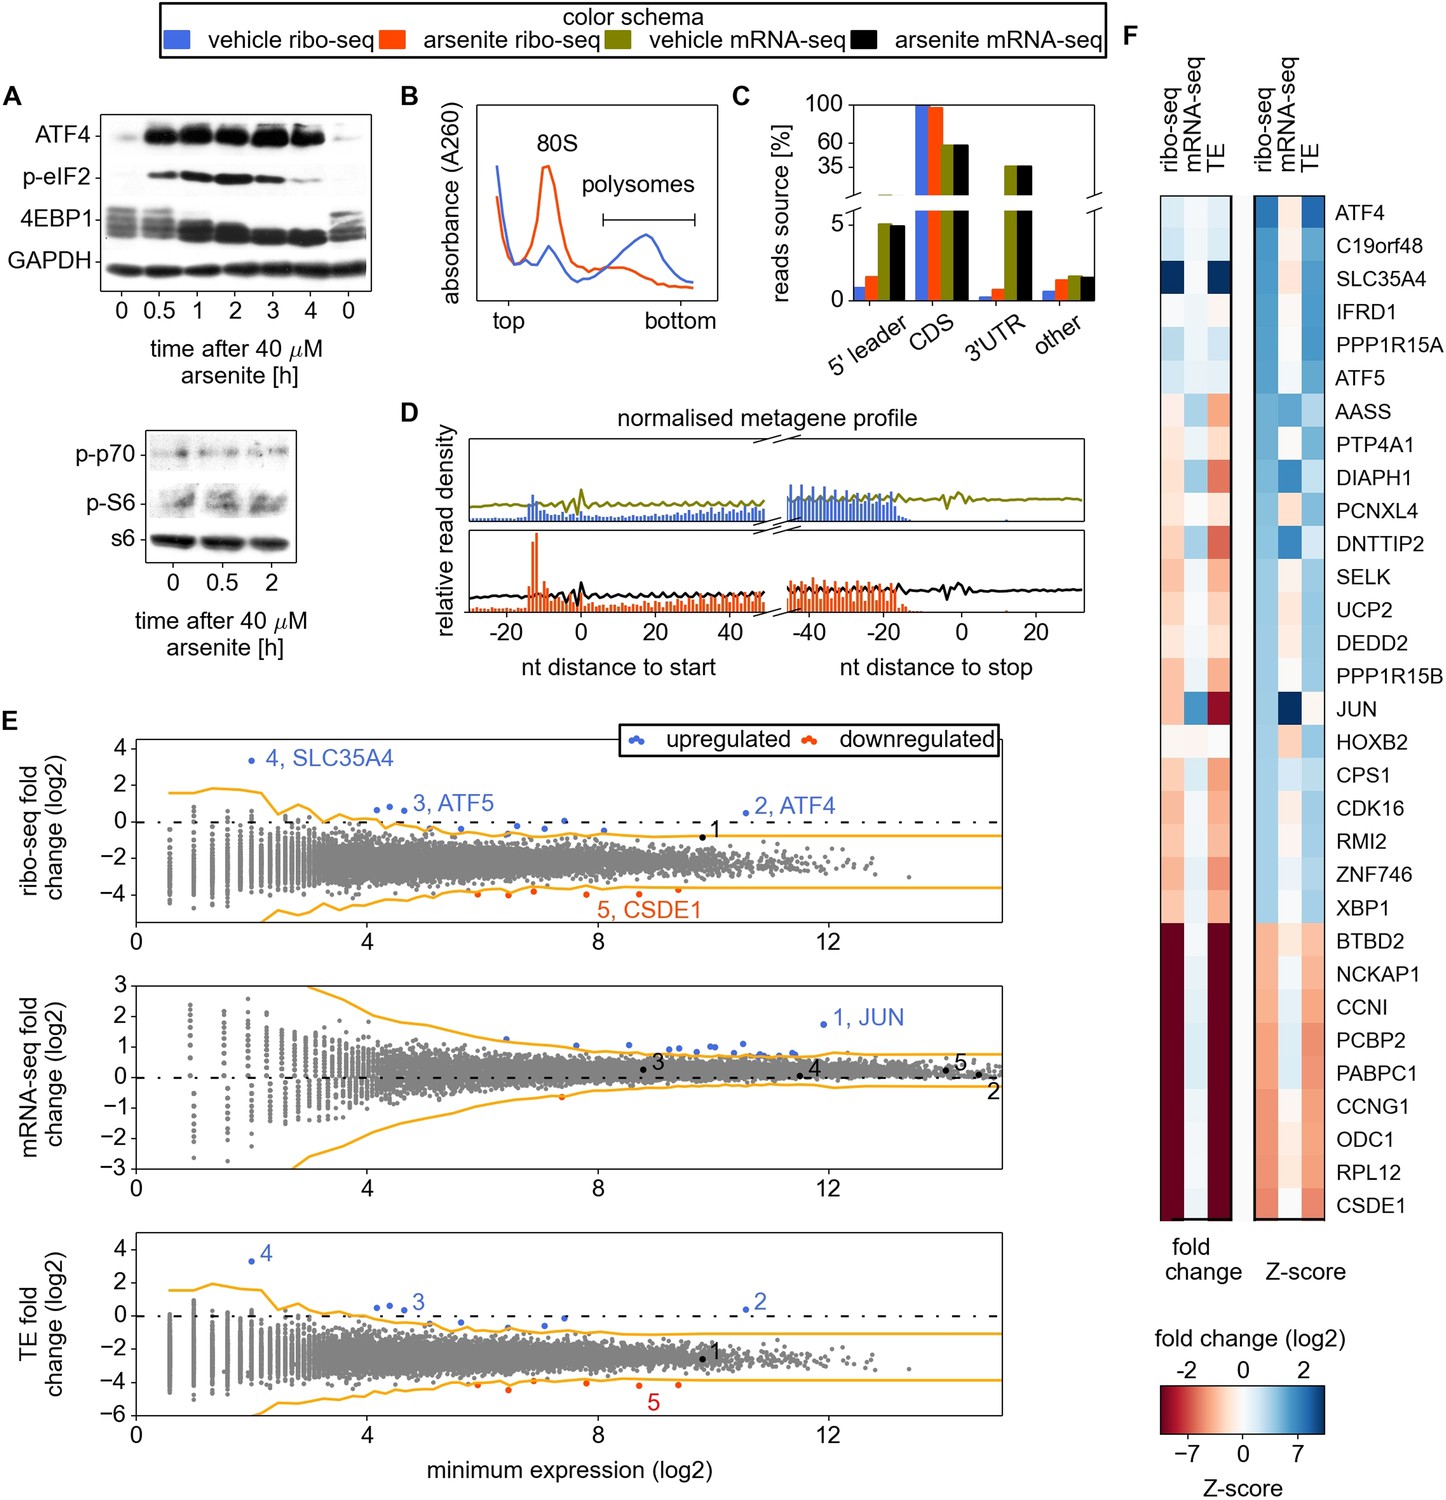
Analysis of differential gene expression under conditions of oxidative stress induced with sodium arsenite treatment.
(A) Western blotting time series analysis of several protein components of HEK293T lysates after treatment with 40 µM sodium arsenite. (B) Sucrose density gradient profiles of HEK293T cells untreated and treated for 30 min with sodium arsenite at 40 µM. (C) Distribution of raw read counts over mRNA functional regions. (D) Metagene analysis: short reads from all mRNAs are aligned around 5′ and 3′ ends of CDS, transcript read density (RNA) is shown using curves, ribosome density (number of footprint reads) is shown using columns corresponding to the alignment locations of the read 5′ ends. (E) Differential gene expression analysis. Scatter plots compare ribosome occupancy (top), transcript levels (middle), and translation efficiency (TE) (bottom) between treated and untreated conditions. To avoid error due to uORF translation the number of ribo-seq reads aligning to the CDS only was used to determine the ribosome occupancy and TE. The x axis represents the normalized number of reads corresponding to the experiment/condition of minimal expression (see ‘Materials and methods’). The threshold used to denote differentially expressed genes (Z-score of 4) is indicated in orange. Certain genes of interest are indicated with numbers, followed by their gene symbols. (F) Two heat maps displaying the fold change and Z-score for the top 22 most stress resistant and bottom 9 most stress sensitive genes, as estimated based on statistical significance of the change of their ribosome occupancy (ribo-seq Z-score).
-
Figure 1—source data 1
Read counts and statistics of gene expression response for RNA-seq and ribo-seq experiments for control and stress conditions for each individual transcript.
- https://doi.org/10.7554/eLife.03971.004
Figure 1—figure supplement 1
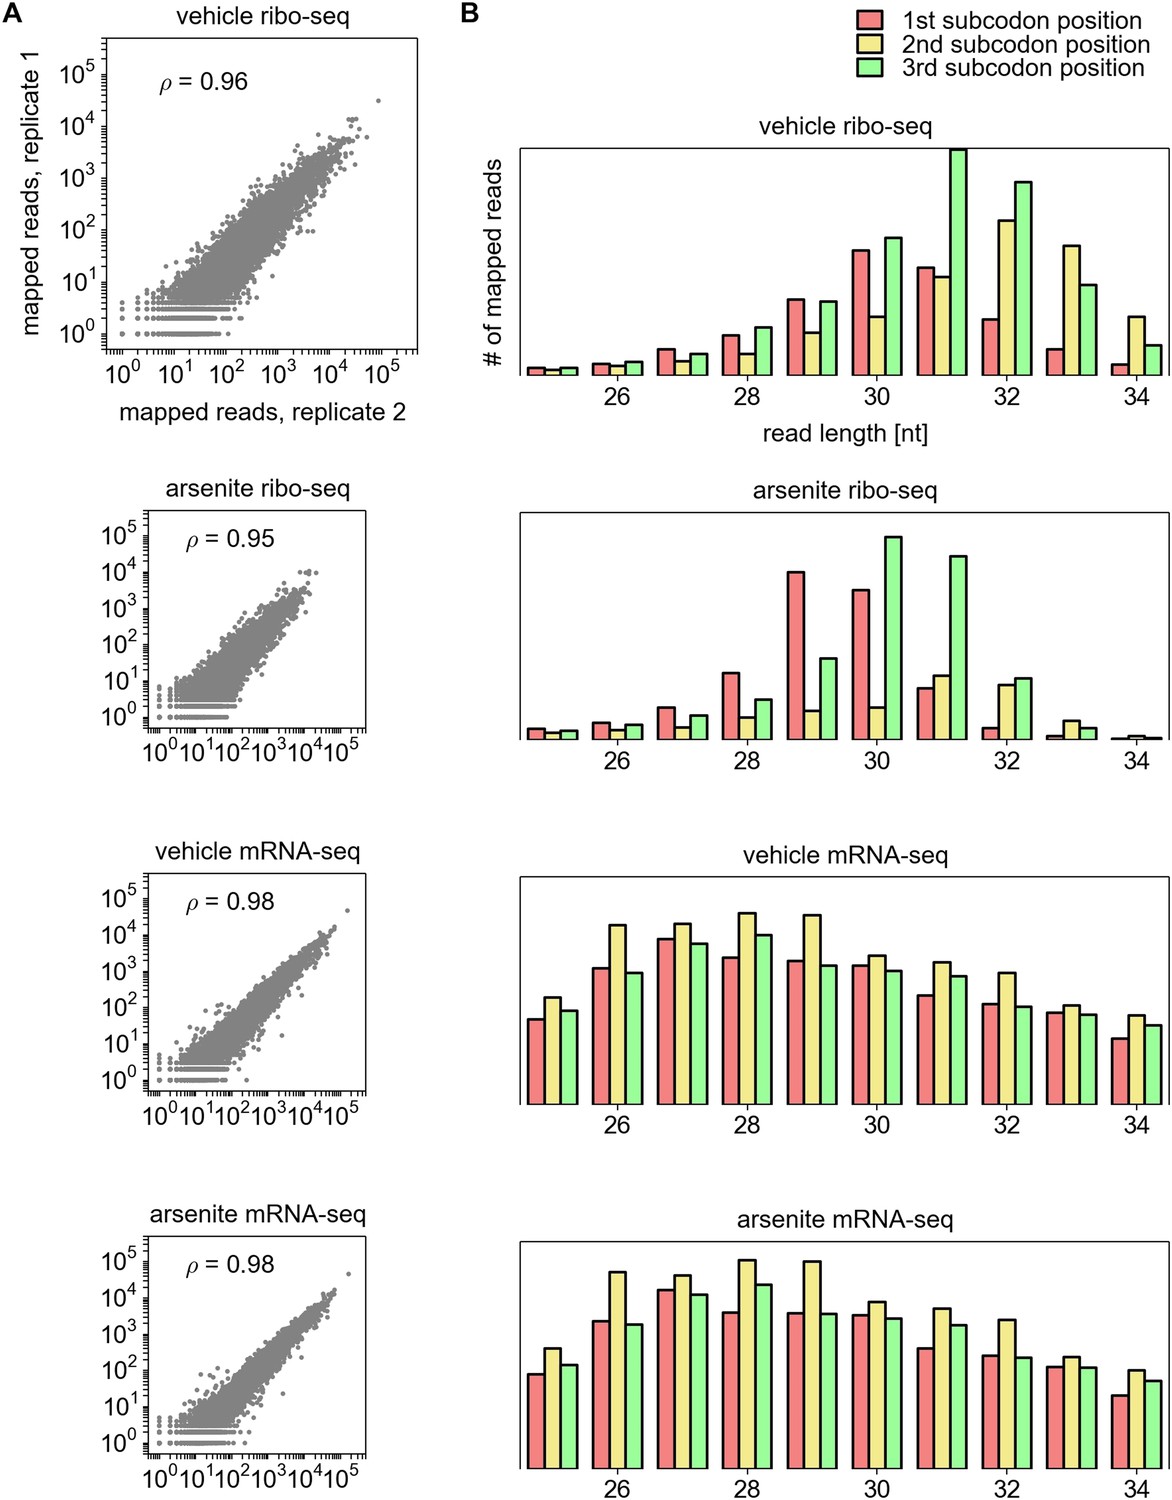
Additional characteristics of ribosome profiling data.
(A) Reproducibility between biological replicas, from top to bottom: ribosome profiling under control conditions; ribosome profiling under arsenite induced stress; mRNA-seq fragments, non-treated; mRNA-seq fragments under stress. (B) Distribution of ribosome protected fragments and fragmented RNA relative to the annotated CDS depending on their length (x axis).
Figure 1—figure supplement 2
Analysis of differential gene expression.
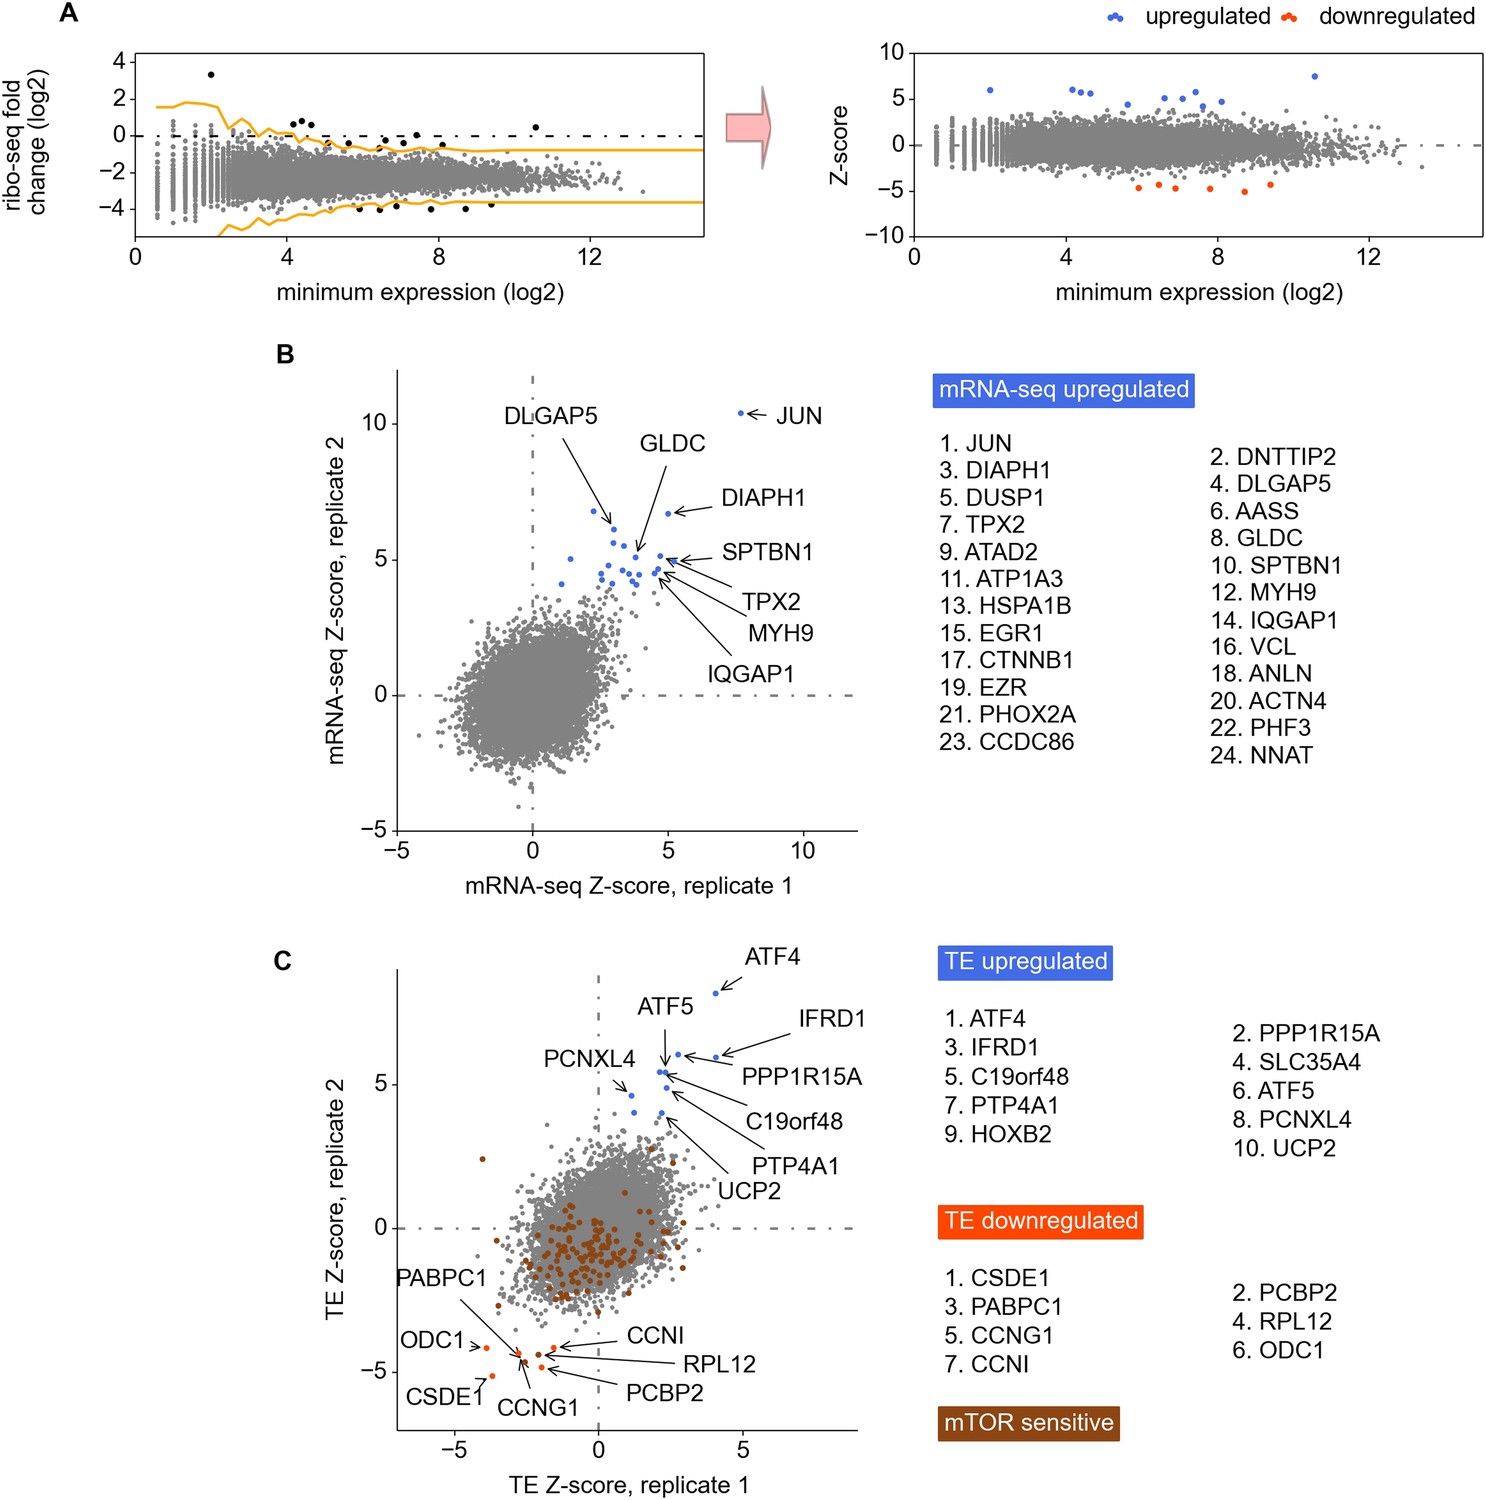
(A) The Z-score based normalization approach for the identification of differentially expressed genes. Z-score is used to mitigate expression variance for the genes expressed at different levels. (B) and (C) Left panels: correlation of Z-scores between replicas calculated for the changes in RNA levels (B) and translation efficiencies (C). Right panels: the most significantly regulated genes.
Figure 2 with 3 supplements
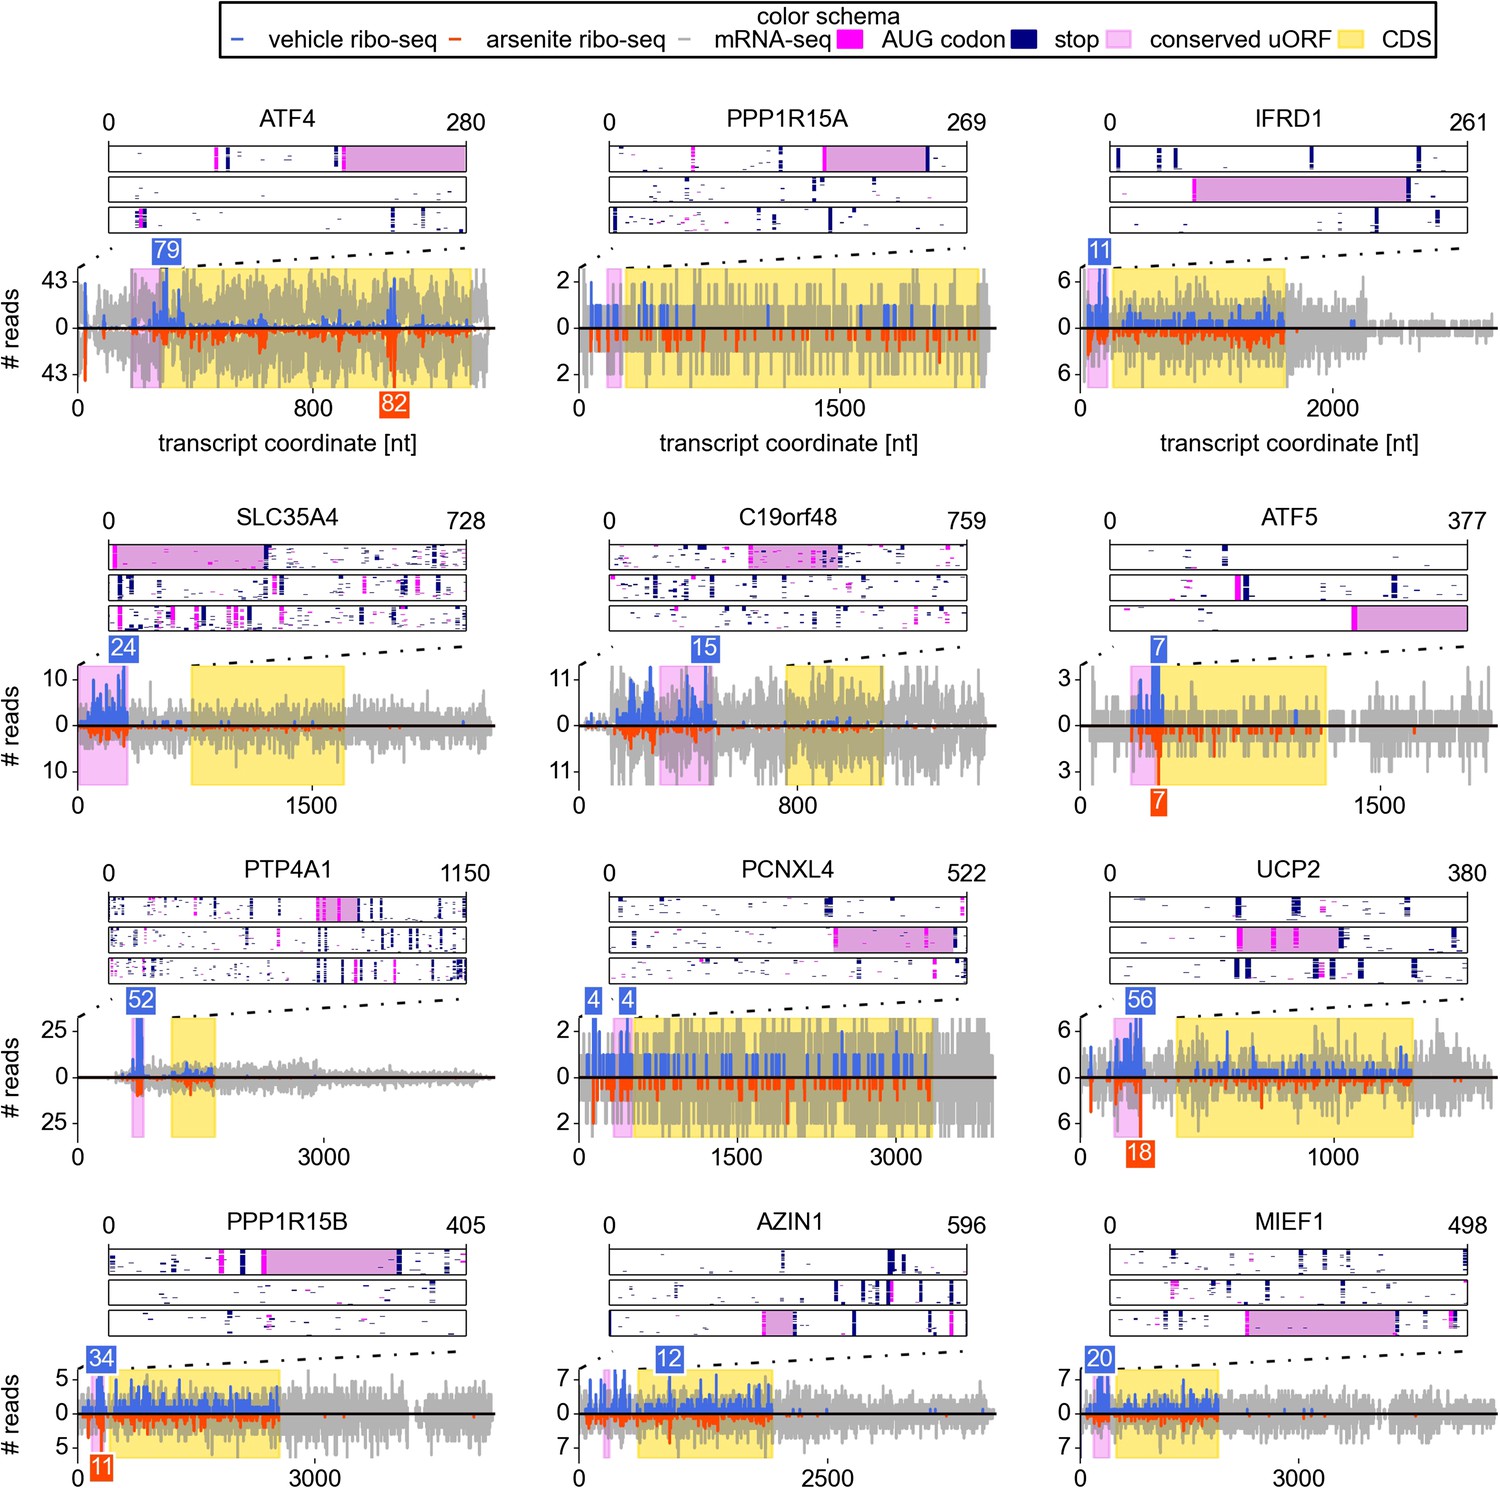
Upstream open reading frame (uORF) conservation and ribosome density for the eight top most stress resistant mRNAs in terms of their translation efficiency and also for mRNAs of UCP2, PPP1R15B, AZIN1, and MIEF1.
Bottom plots for each mRNA show counts of mRNA-seq reads (grey) and ribosome reads (blue and red) as columns (control: positive values; arsenite treatment: negative values). The annotated CDS region is highlighted in yellow. Translated conserved ORFs in the 5′ leaders are highlighted in violet. Read counts above the cut-off are shown with numbers above corresponding columns. Top plots represent conservation of uORF features within the leaders of the orthologous mRNAs (upstream of annotated CDS) obtained from the analysis of genomic alignments of the 46 vertebrates using the human sequence as a reference. Each box corresponds to one of the three reading frames where AUG codons are shown as pink dots and stop codons as navy dots in each of the genomic sequences used in the alignments. Regions of multiple sequence alignment corresponding to translated conserved uORFs are highlighted in violet. Introns and gaps were removed from the alignments.
Figure 2—figure supplement 1
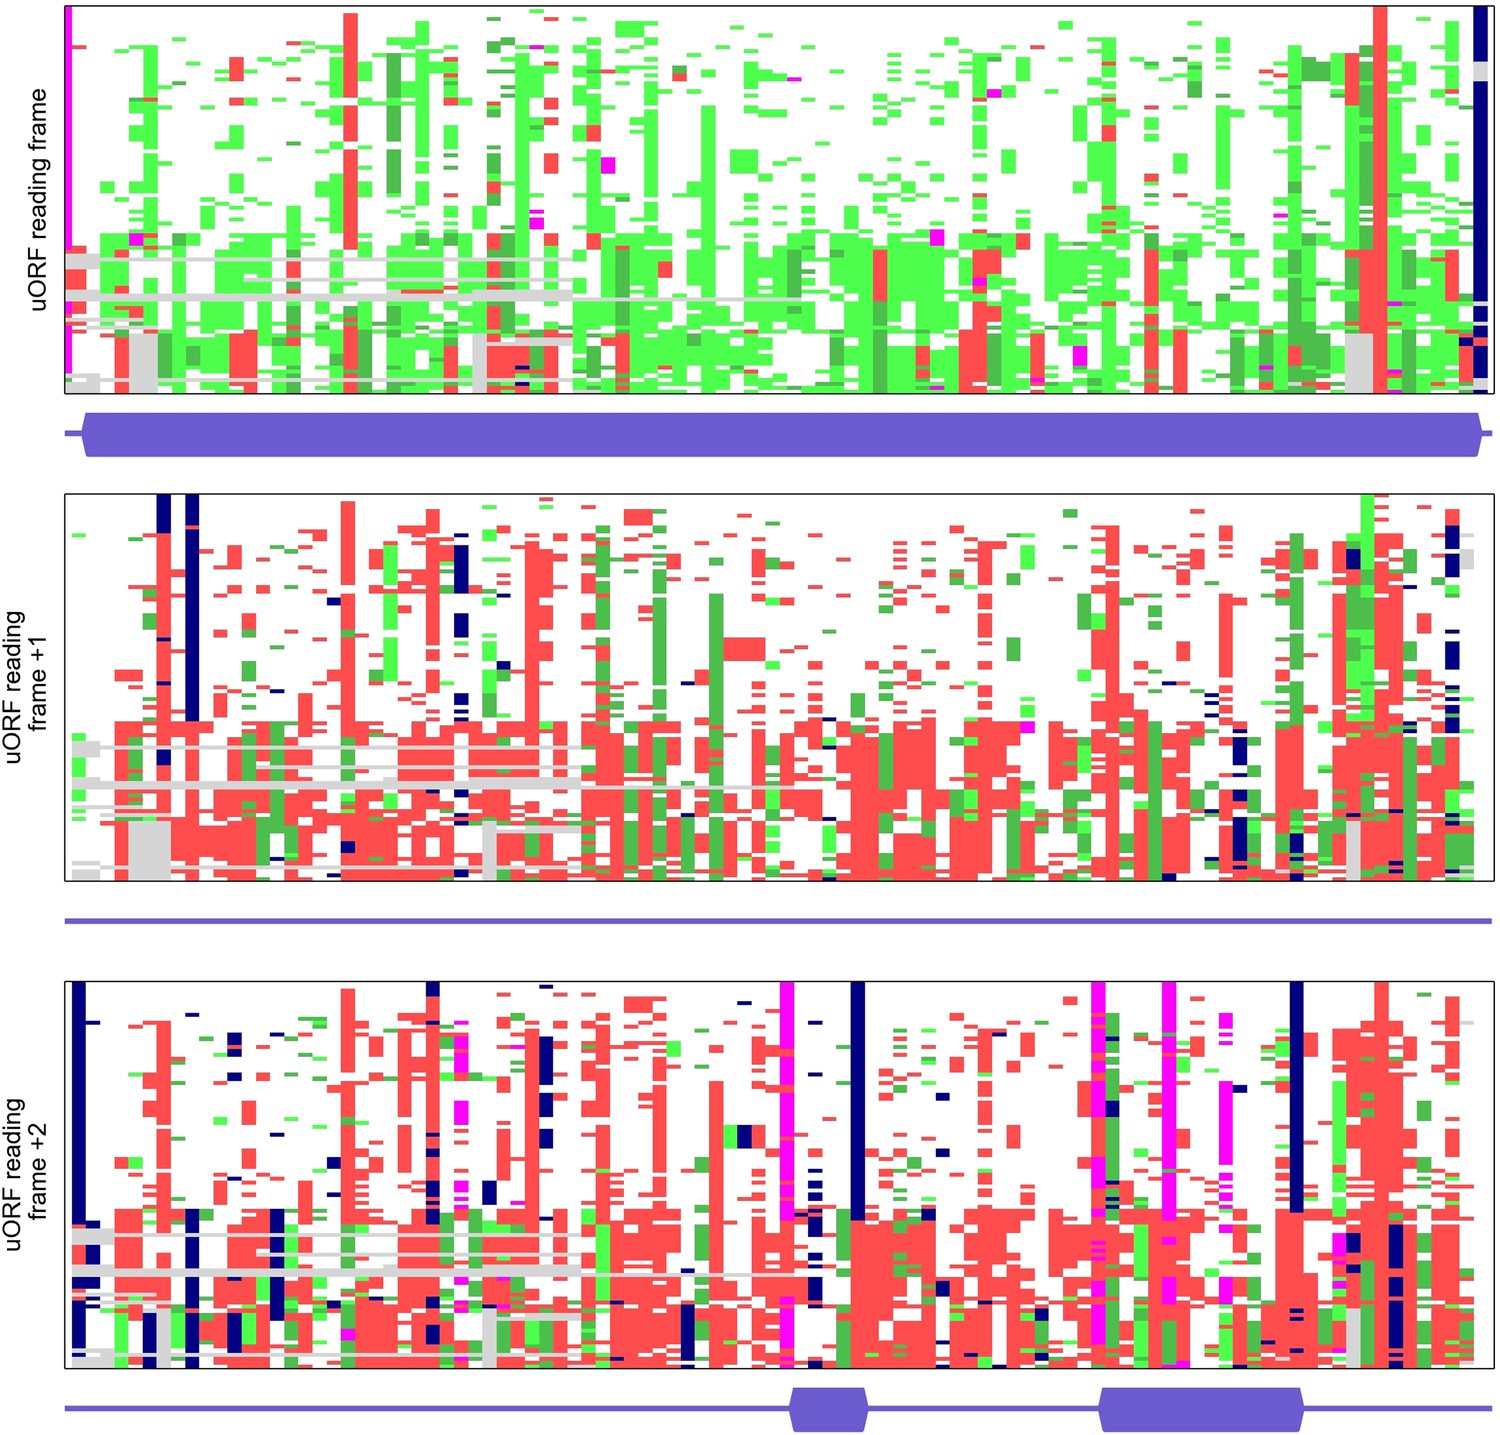
Multiple alignments of codon sequences from 100 vertebrate genomes aligned to the region of the conserved SLC35A4 upstream open reading frame (uORF) in three different frames.
Codons are represented as coloured bricks according to the following scheme: pink (ATG), navy (stop codons: TAA, TAG or TGA). The rest are coloured depending on the nature of substitution relative to the human sequence as follows: white: no substitution; light green: synonymous; green: positive (BLOSUM62 > 0); red: negative (BLOSUM62 ≤ 0); deletions: grey. Locations of ORFs (from ATG to a stop) present in humans are shown under each alignment as a thicker dark blue bar. Regions of alignment with a high number of light green or green bricks (synonymous and positive substitutions) indicate protein coding evolution. The codon substitution analysis was carried out using CodAlignView (Jungreis I, Lin M, Kellis M. CodAlignView: a tool for visualizing protein-coding constraint) and processed with a python script to remove sequences of codons.
Figure 2—figure supplement 2
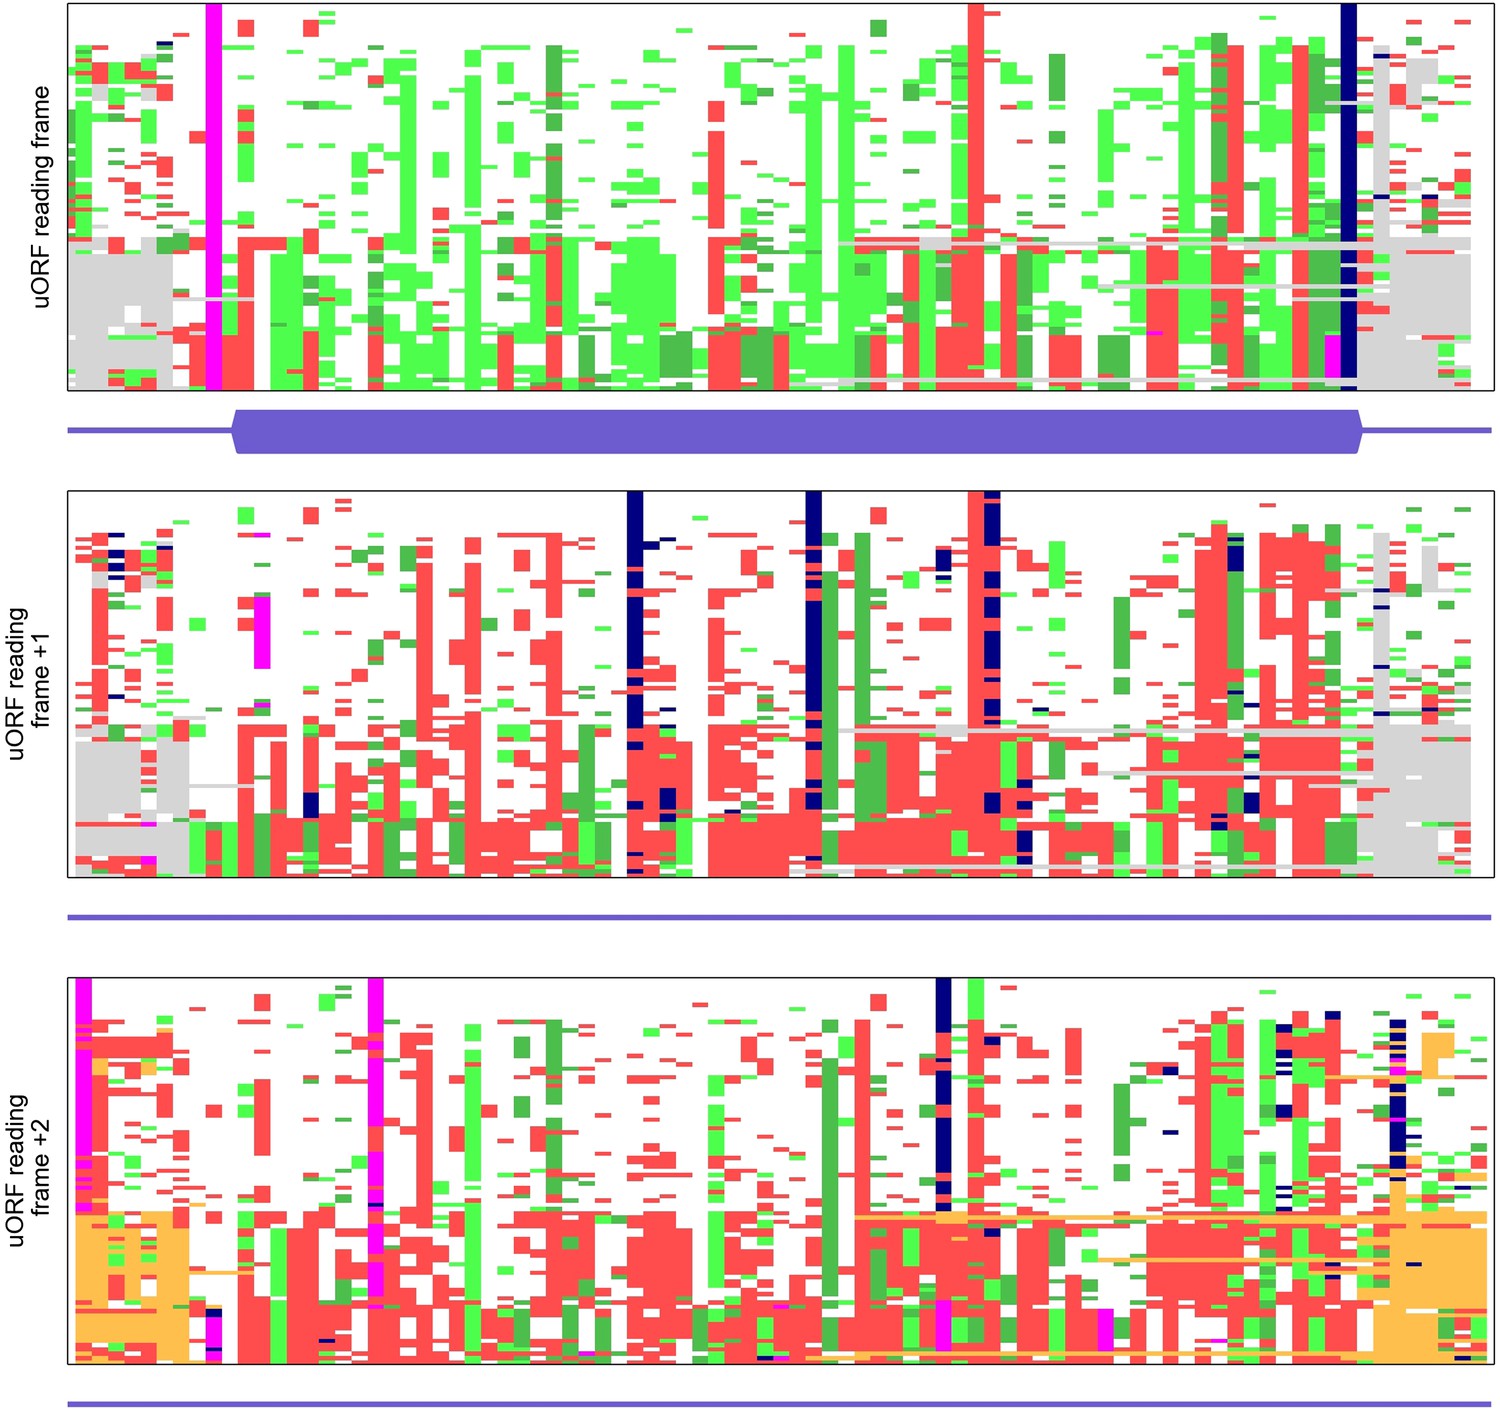
Multiple alignments of codon sequences from 100 vertebrate genomes aligned to the region of conserved MIEF1 upstream open reading frame (uORF) in three different frames.
See Figure 2—figure supplement 1 for the explanation of the colour scheme used for the alignment visualization.
Figure 2—figure supplement 3
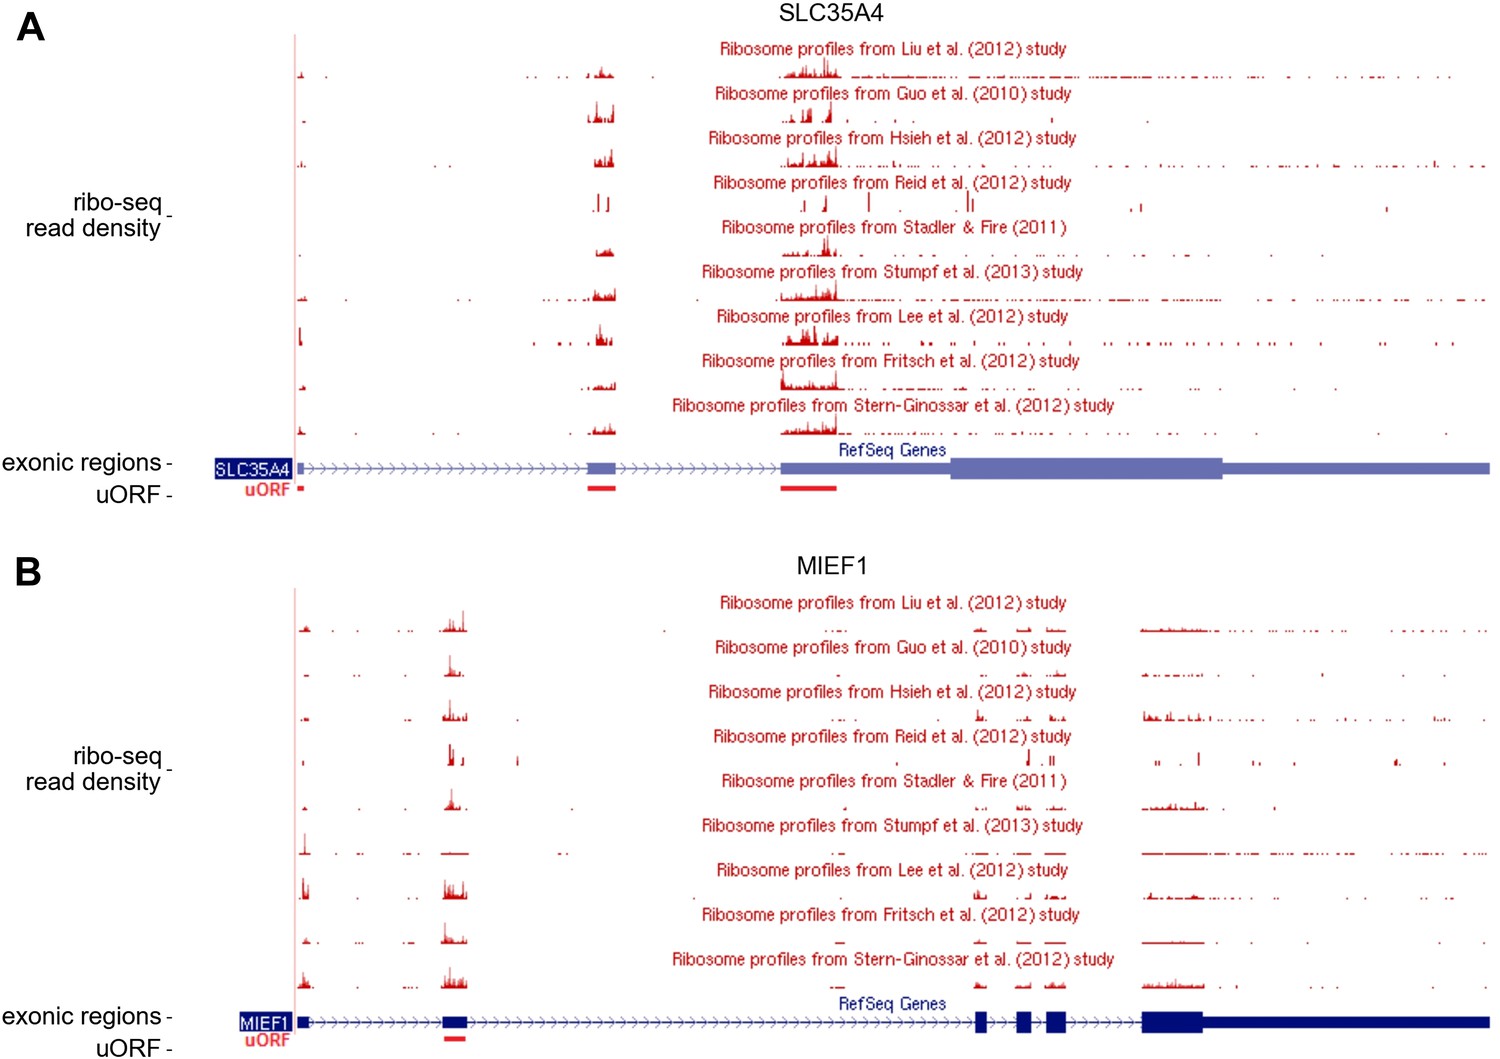
Publicly available ribosome profiling data in GWIPS-viz for SLC35A4 and MIEF1.
Ribosome profiling data aligned to the SLC35A4 (A) and MIEF1 (B) loci of the human genome from nine studies available in the GWIPS-viz Browser. The positions of the conserved upstream open reading frames (uORFs) are shown with a red bar below the blue bars representing corresponding RefSeq transcripts.
Figure 3 with 1 supplement
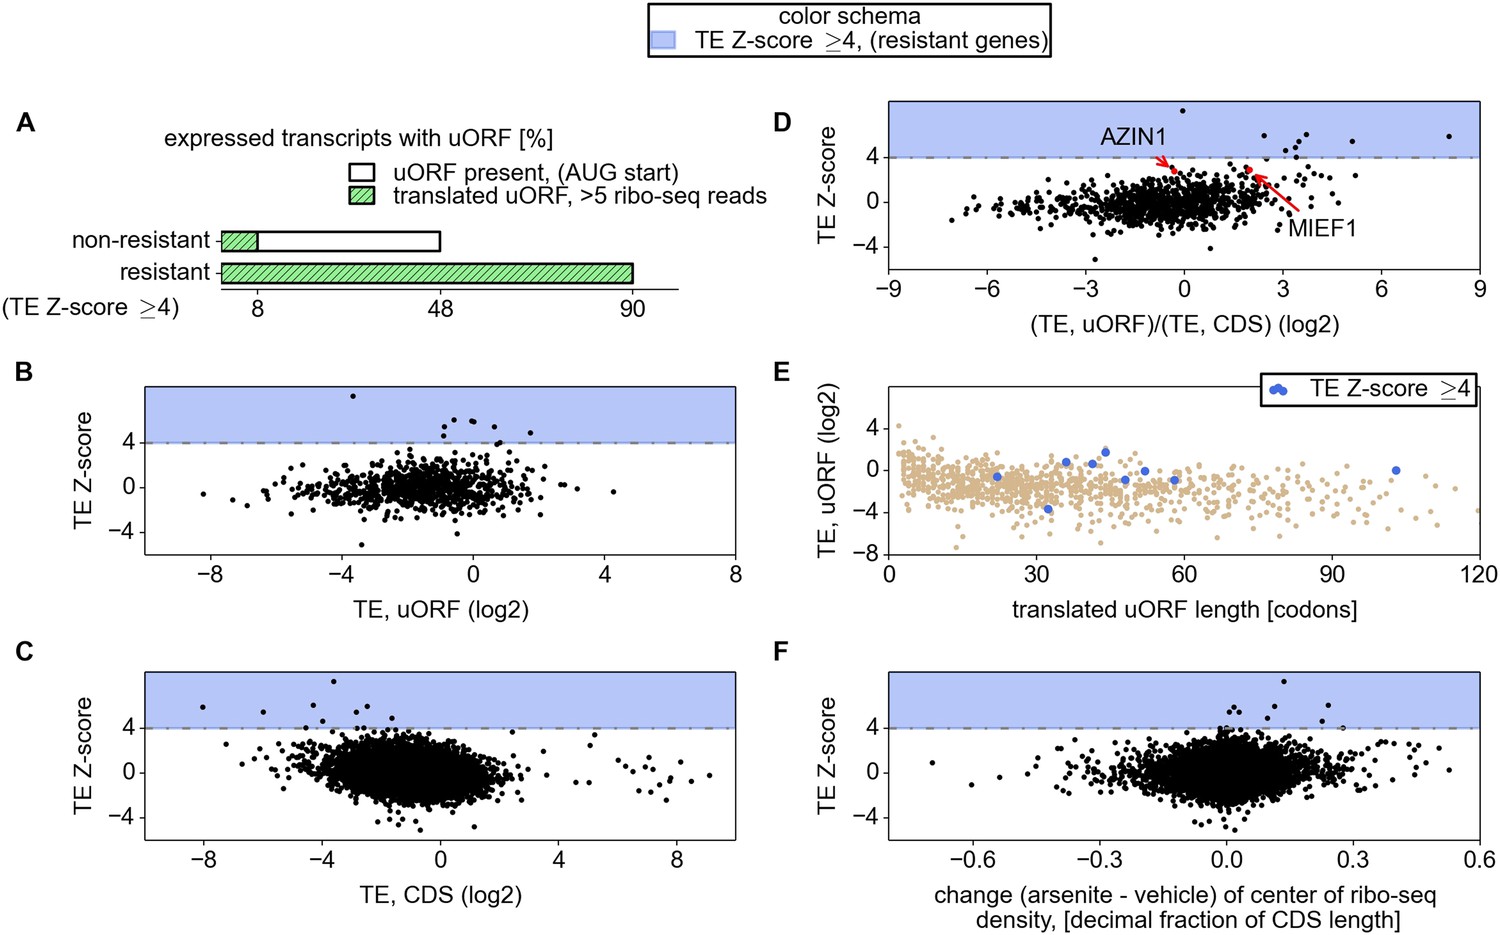
Relationship between mRNA stress resistance and upstream open reading frames (uORFs).
(A) Frequency of AUG initiating uORF occurrence and their translation in stress resistant and other mRNAs. Relationship between stress resistance (y axis) and translation efficiency of uORFs (B), CDS (C), and uORF/CDS ratio (D). Translationally resistant genes (shaded in blue) have a high uORF translational efficiency (TE) and a low CDS TE. (E) Relationship between uORF length (x axis), their TE (y axis), and the level of stress resistance (differential colouring). (F) Relationship between stress resistance (y axis) and shift of ribosome density in the 3′ direction. These plots indicate that, under normal conditions, resistant mRNAs tend to display a high uORF TE and a low CDS TE while, under stress conditions, resistant mRNAs are associated with a shift of ribosome density in the 3′ direction owing to a reduced ratio of ribosome density between uORFs and CDS.
Figure 3—figure supplement 1
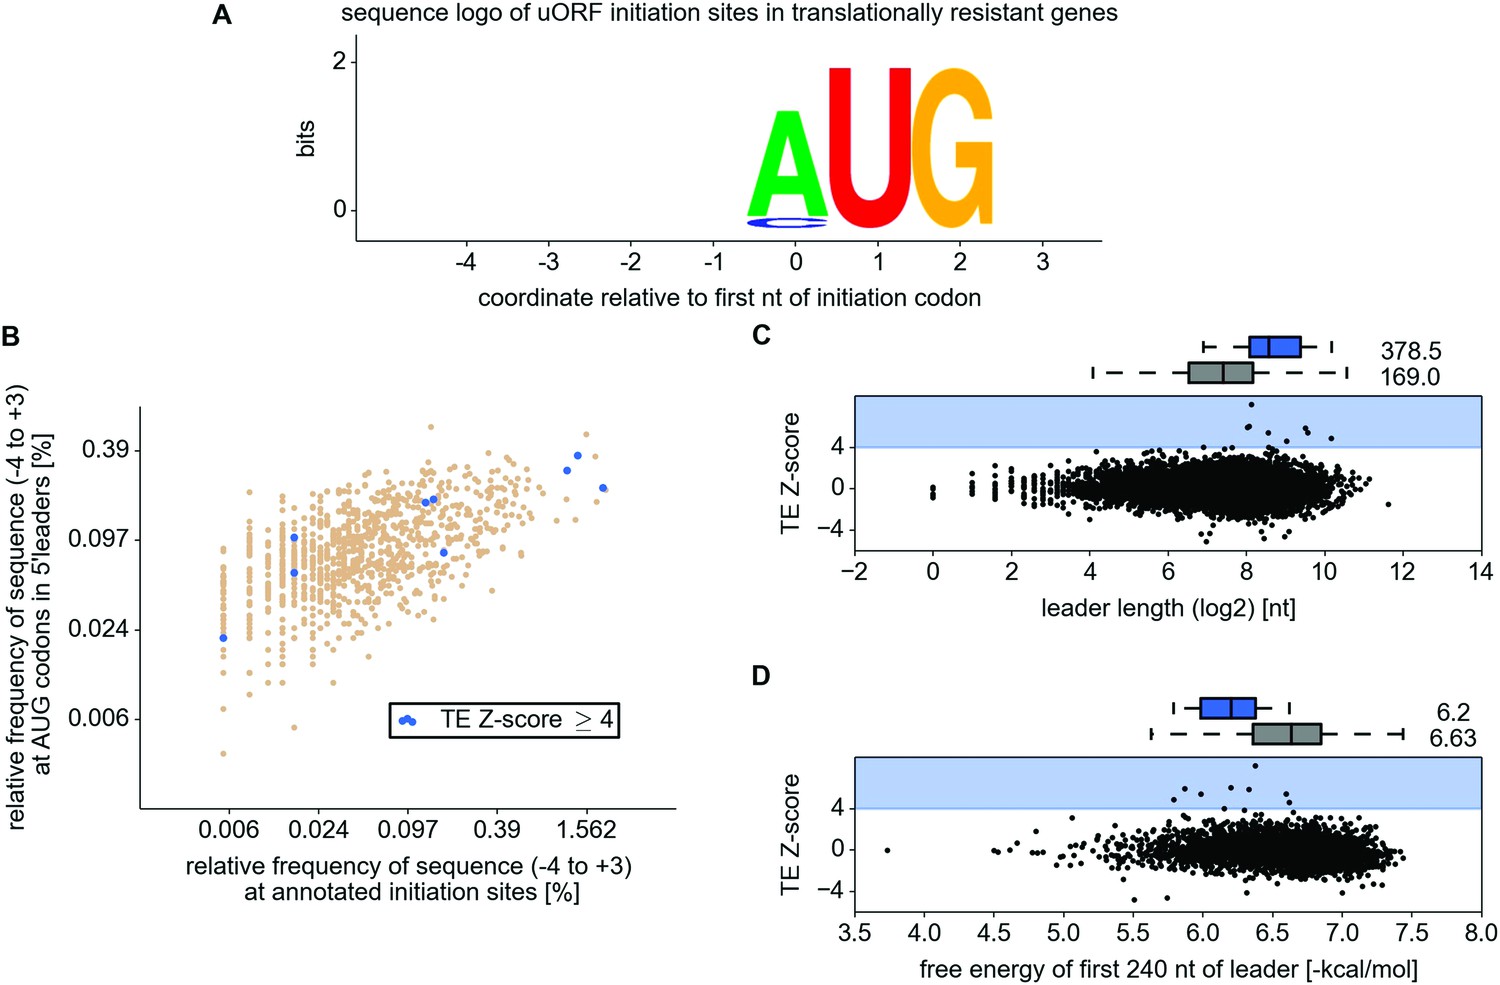
Analysis of 5’ leader and upstream open reading frame (uORF) features in the resistant mRNAs.
(A) WebLogo representation of information content within translation initiation sequences (from position −4 to position +3) for uORF starts in the resistant mRNAs. (B) Comparison of frequencies of various translation initiation sequences (−4 to +3) for annotated ORFs (x axis) and AUG present in 5' leaders (y axis). Translation initiation sequences of uORFs in the resistant mRNAs are shown in blue. (C) Scatter plot representing relationship between translation response (y axis) and the length of 5′ leaders (x axis). (D) Relationship between translational response (y axis) and free energy of potential RNA secondary structures within the first 240 nt of 5′ leaders (x axis).
Figure 4 with 4 supplements
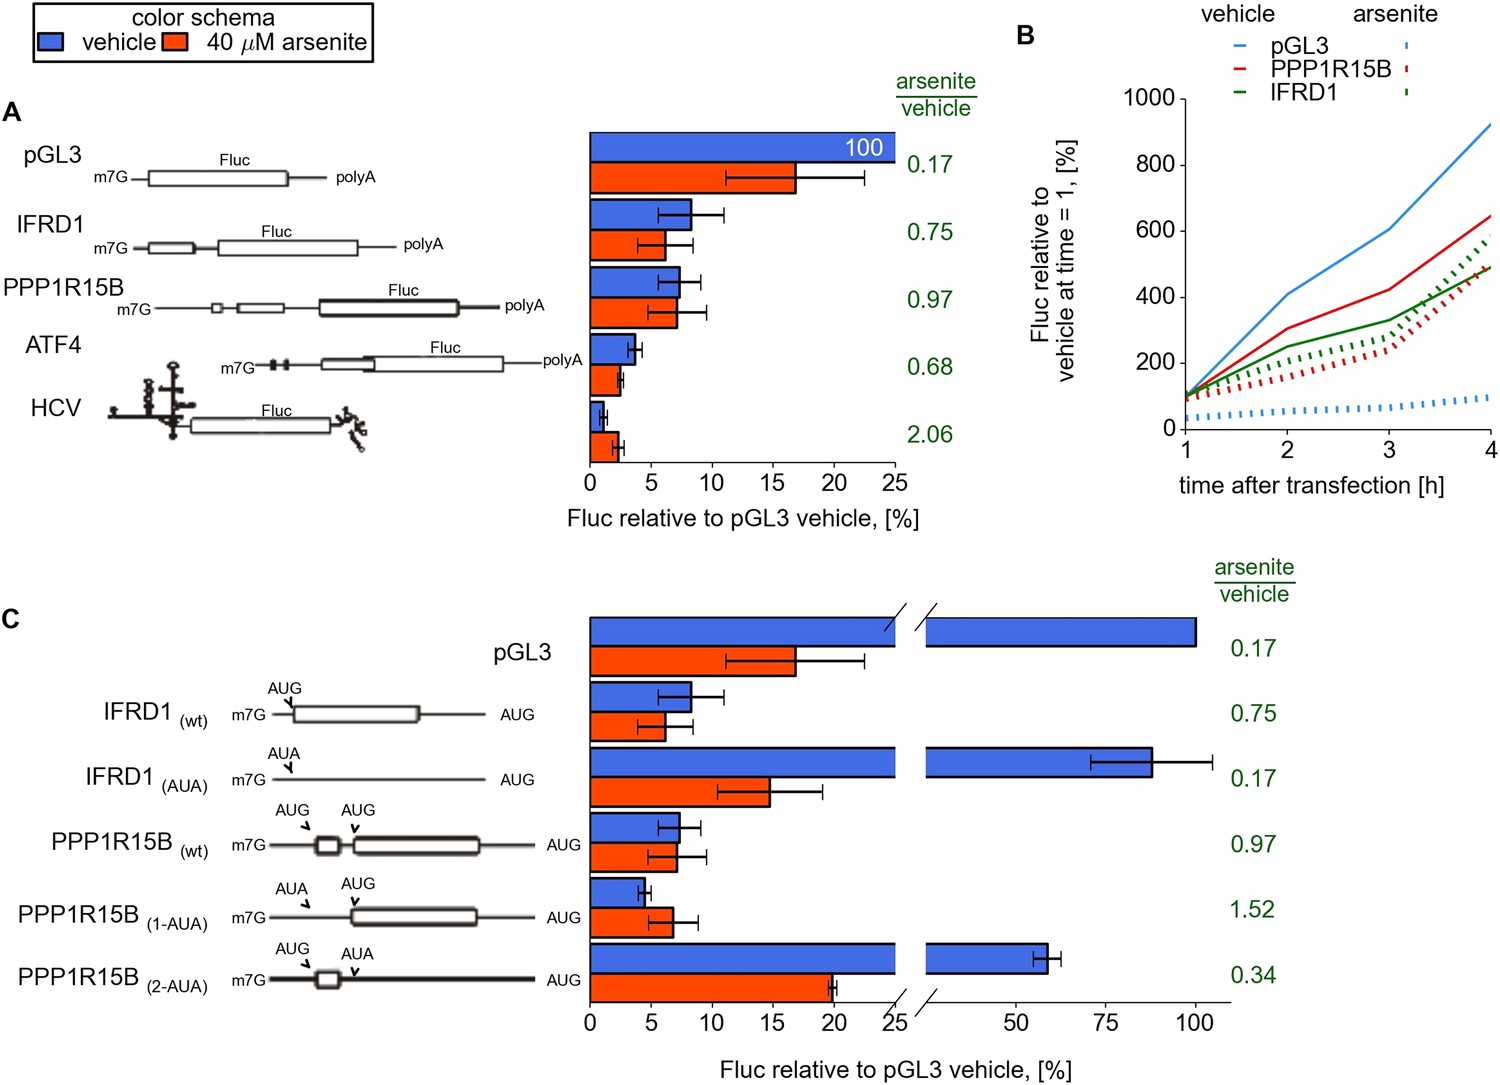
Upstream open reading frame (uORF) involvement in modulation of IFRD1 and PPP1R15B mRNAs stress resistance.
(A) Firefly luciferase (Fluc) activity produced by expression of mRNA containing different 5′ leaders 2 hr after arsenite treatment (red bars) and in untreated cells (blue bars). Relative units correspond to Fluc activity normalized to the median Renilla luciferase (Rluc) activity derived from a co-transfected Rluc mRNA. The green text represents fold change calculated from the same data. The ORF organization of examined mRNAs is outlined on the left. Bars represent standard deviations. (B) Time series analysis of Fluc expression in cells treated at the time of transfection with sodium arsenite to a concentration of 40 µM (dotted lines) or vehicle (solid lines). Fluc activity of vehicle at 1 hr was taken as 100% for each mRNA and experimental condition. (C) Effect of start codon identity in IFRD1 and PPP1R15B 5′ leaders on Fluc activity.
Figure 4—figure supplement 1
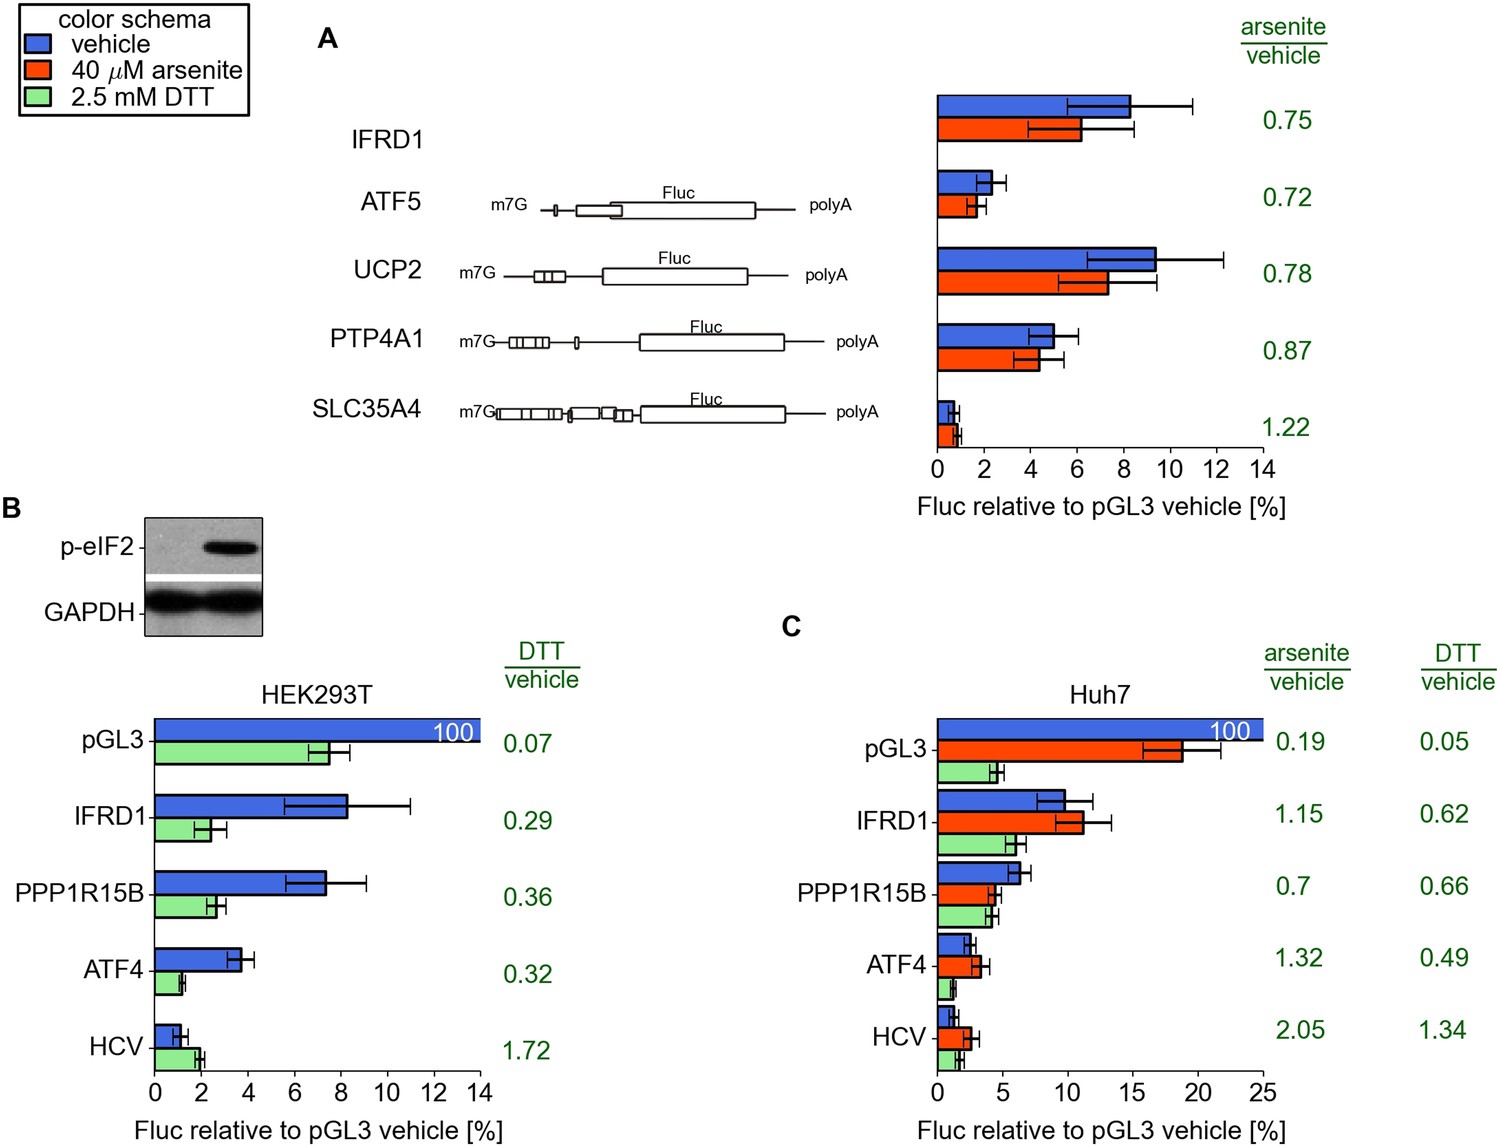
(A) Resistance of additional reporters with 5′ leaders of ATF5, UCP2, PTP4A1, and SLC35A4 to arsenite treatment.
(B and C) Resistance of different 5′ leaders to arsenite treatment in HEK293T cells (B) and to arsenite or dithiothreitol (DTT) treatment in Huh7 cells (C). Western blot on panel B demonstrates ubiquitous phosphorylation of eukaryotic initiation factor 2 (eIF2) upon DTT treatment.
Figure 4—figure supplement 2
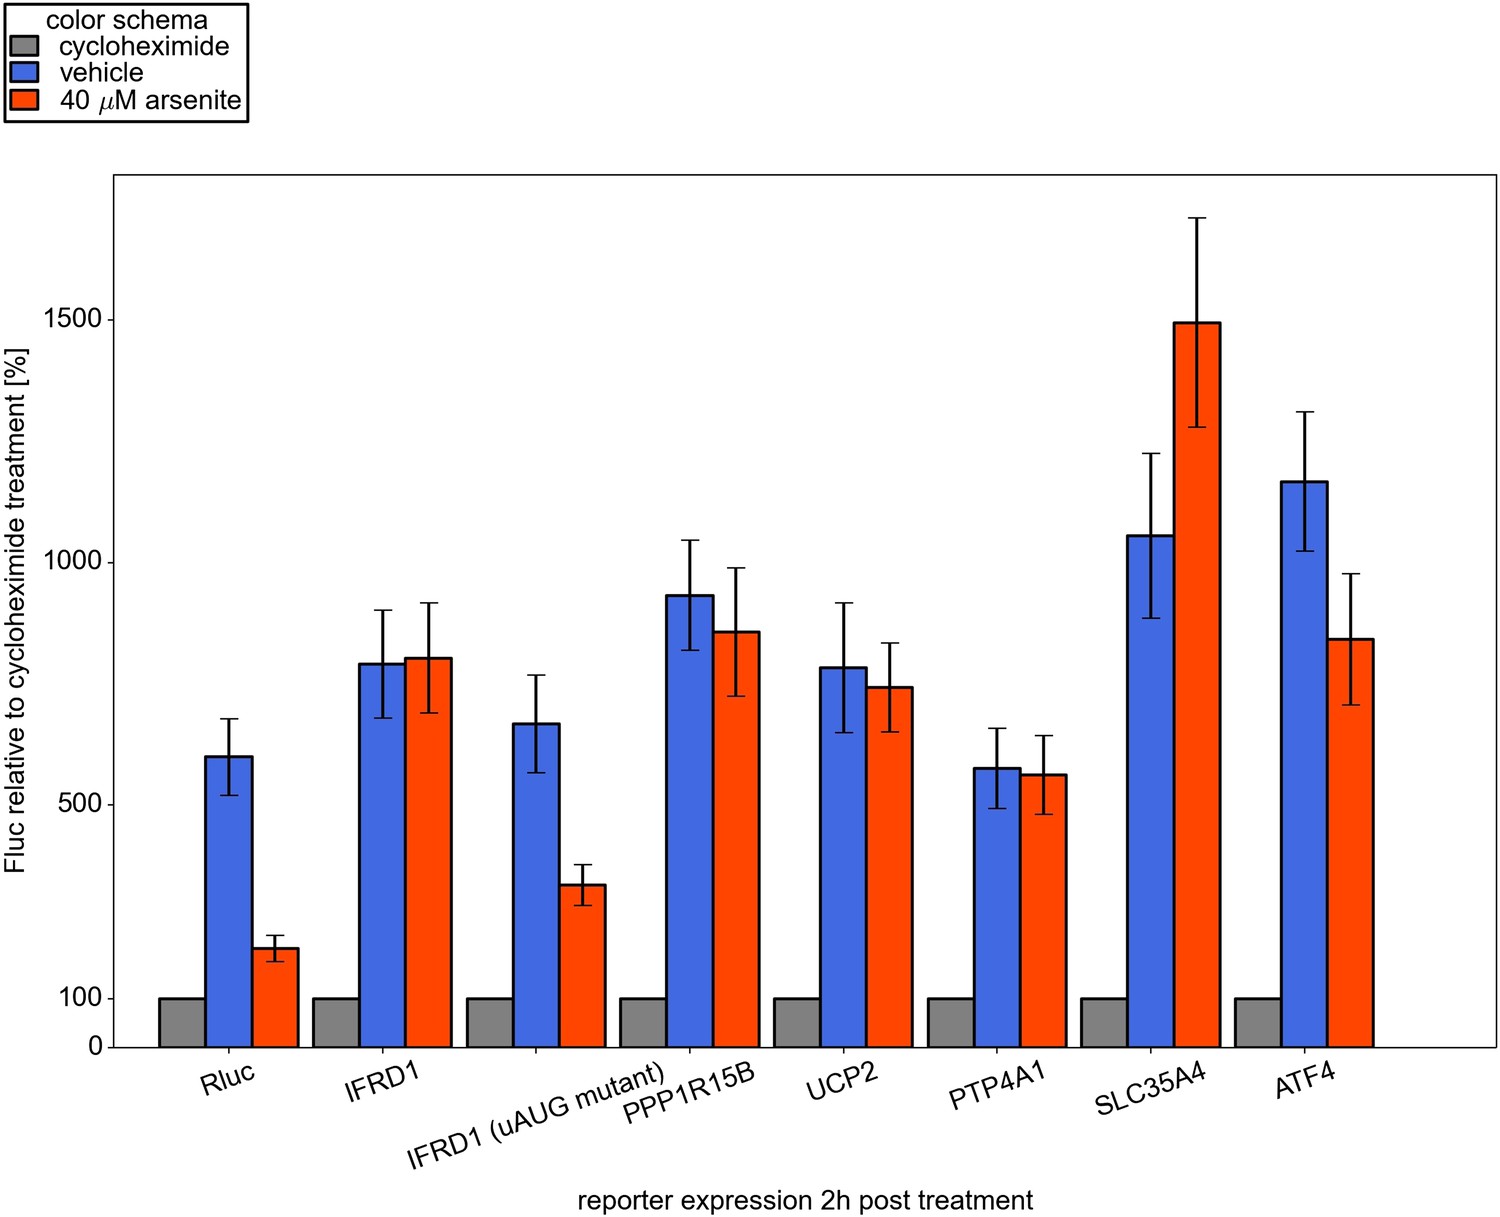
Effect of arsenite treatment on ongoing reporter translation.
Reporter firefly luciferase (Fluc) mRNAs along with control Renilla luciferase (Rluc) mRNA were co-transfected into HEK293T and 1 hr later cells were treated either with vehicle or with 100 µg/ml cycloheximide or 40 µM arsenite. Two hours after treatment the cells were harvested and luciferase activities were measured. Normalized luciferase values for each sample treated with cycloheximide were set as 100%.
Figure 4—figure supplement 3
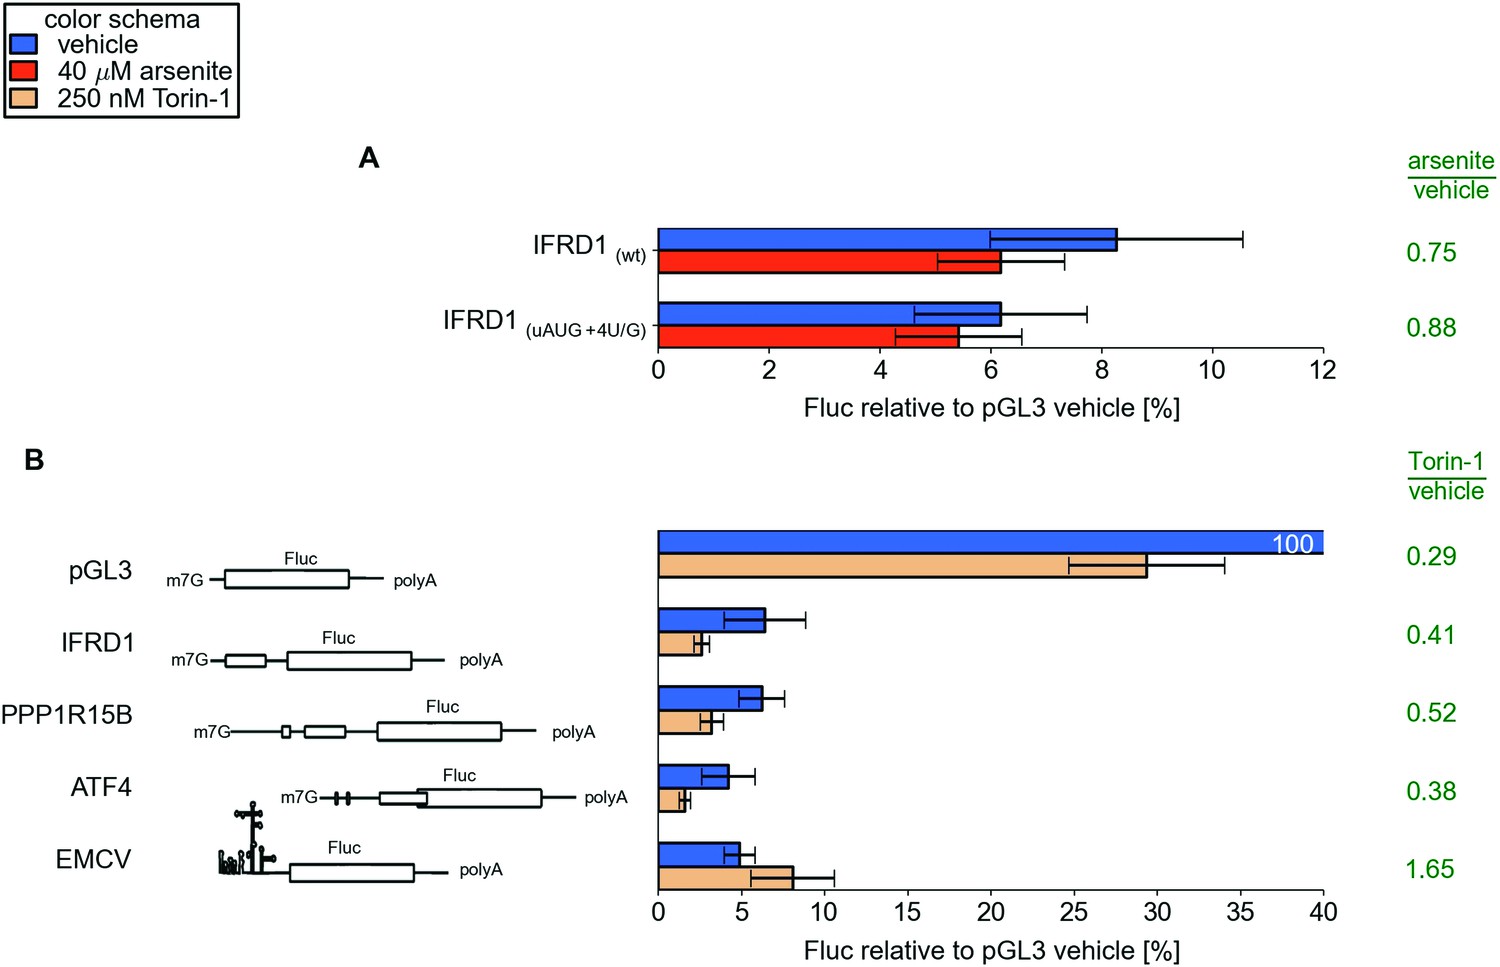
(A) Effect mutations that improve initiation Kozak context for uAUG in the IFRD1 leader during arsenite treatment.
(B) Effect of Torin-1 treatment on translation of different reporter mRNAs in HEK293T.
Figure 4—figure supplement 4
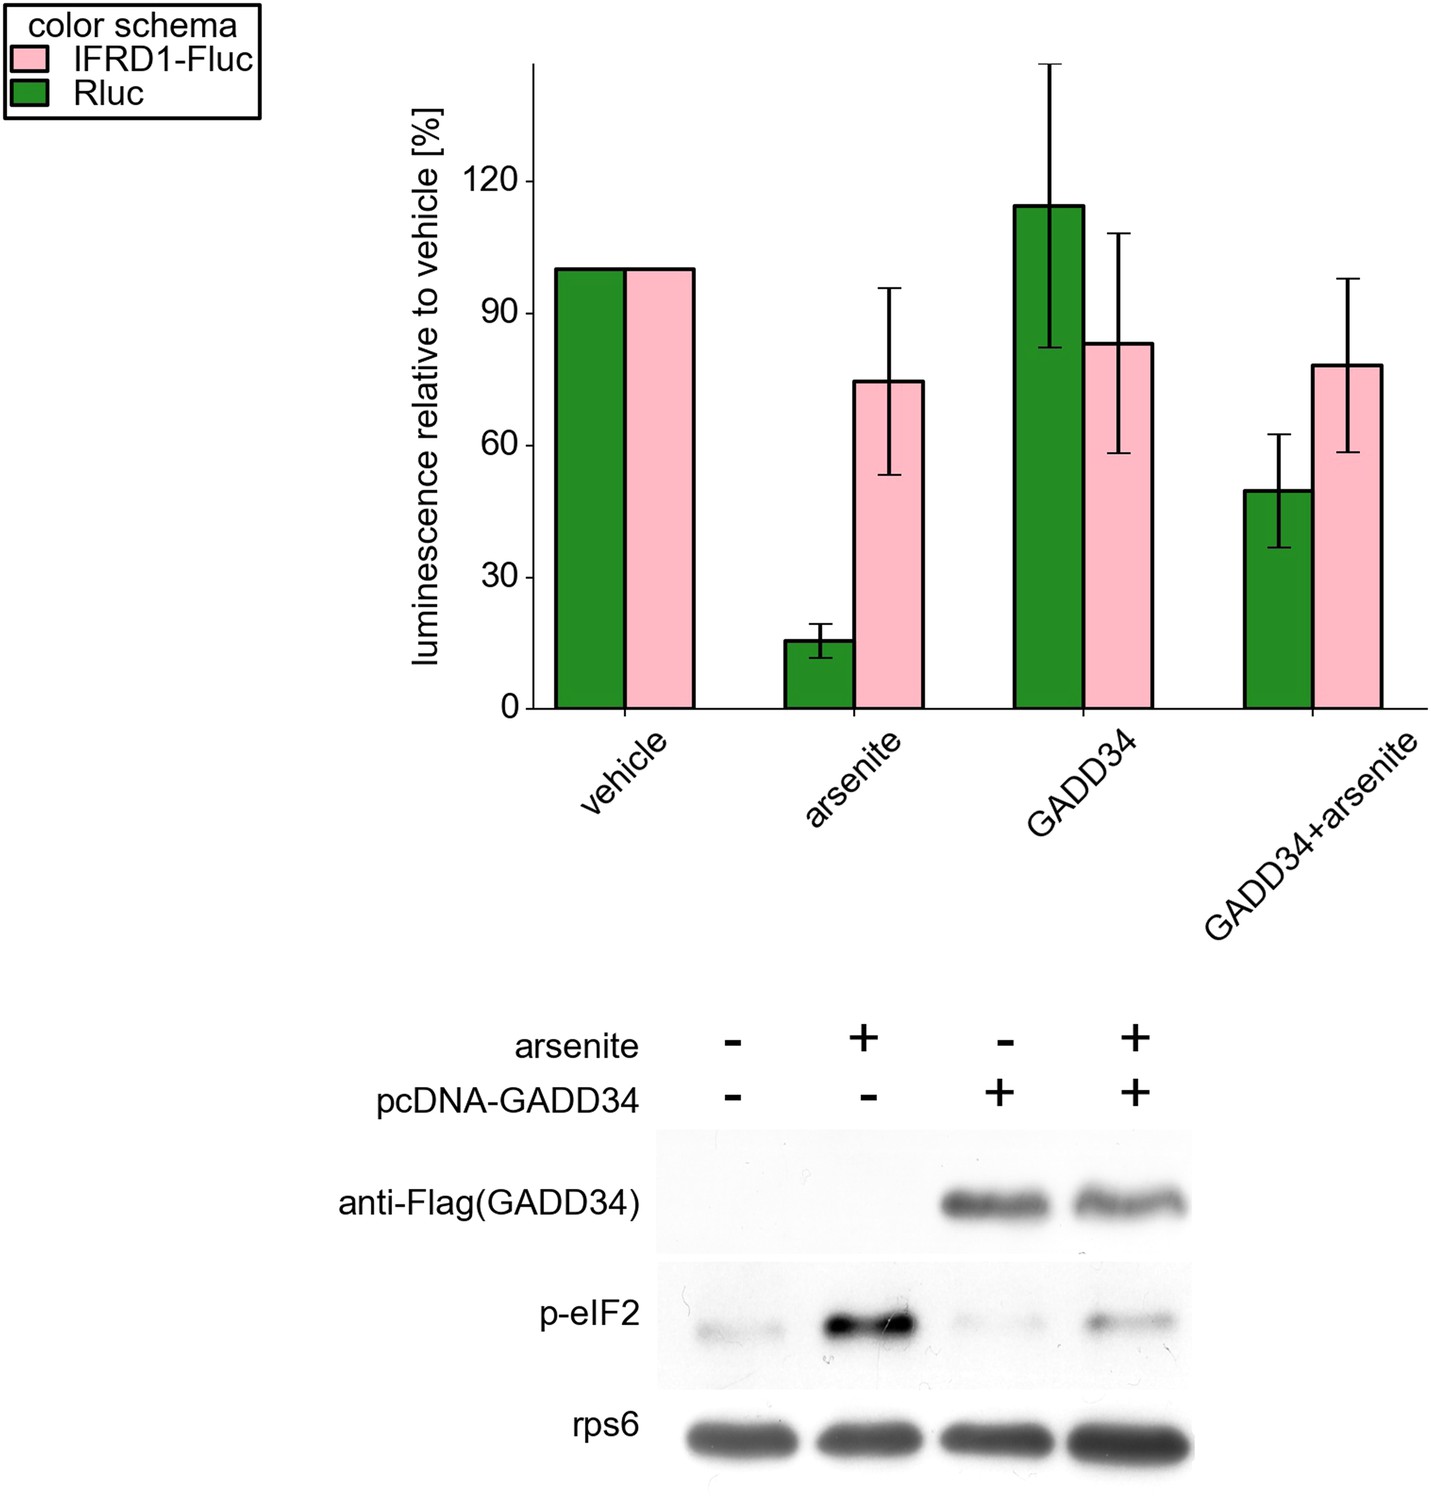
Top: Effect of GADD34-Flag (PPP1R15A) overexpression on activity of firefly luciferase under control of the IFRD1 mRNA leader (Fluc, green bars) and on mRNA encoding Renilla luciferase (Rluc, light pink bars).
Bottom: Western blots showing the presence of the GADD34-Flag protein product and the phosphorylation level of eukaryotic initiation factor 2 (eIF2).
Figure 5
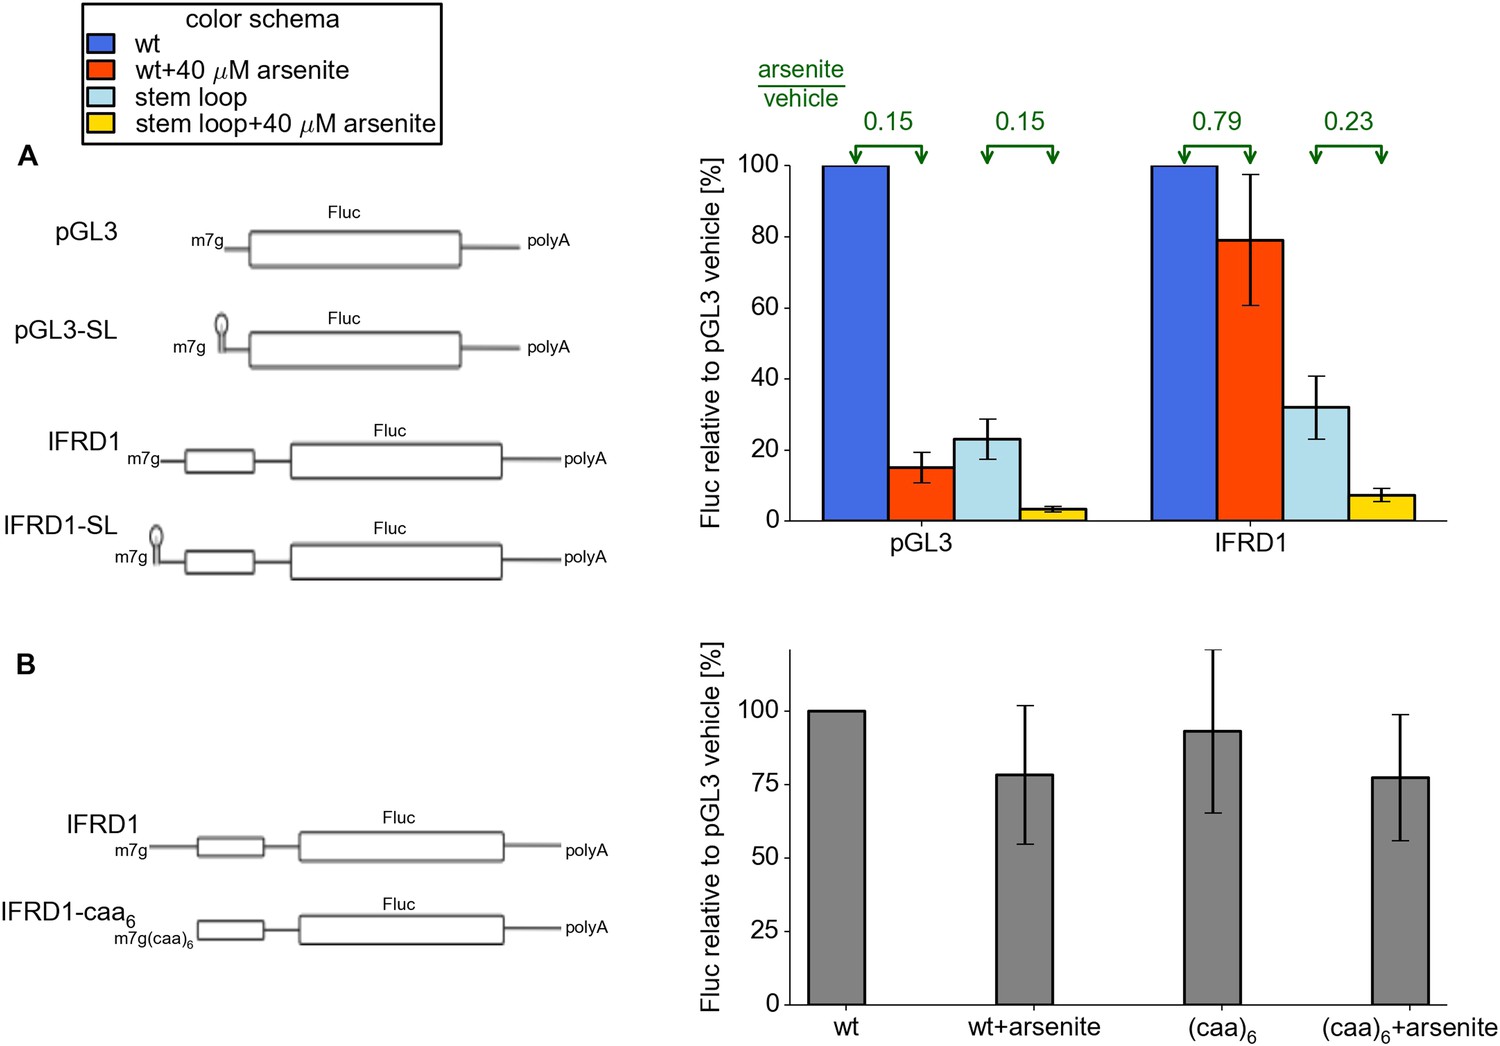
Features of the IFRD1 5′ leader required for resistance.
(A) Firefly luciferase (Fluc) activity produced by expression of mRNA containing pGL3 and IRFD1 leaders (outlined on the left) with and without an additional stem loop at the 5′ end under different conditions. Blue (normal conditions) and red (stress conditions) bars correspond to leaders lacking the stem loop while light blue (normal) and yellow (stress) correspond to leaders with the stem loop. The fold change of Fluc activity in response to stress is indicated above by green arrows. (B) Effect of (CAA)6 addition to the 5′ leader of IFRD1 on Fluc activity in response to stress.
Tables
Table 1
Translation response of mRNAs with reported IRES from IRESite
| Gene_name | IRES name | ORF# | Minimal expression | TE fold change | TE Z-score |
|---|---|---|---|---|---|
| AGTR1 | AT1R_var1 | 1 | 4 | 0.46 | 1.12 |
| AGTR1 | AT1R_var2 | 1 | 4 | 0.46 | 1.12 |
| AGTR1 | AT1R_var3 | 1 | 4 | 0.46 | 1.12 |
| AGTR1 | AT1R_var4 | 1 | 4 | 0.46 | 1.12 |
| APAF1 | Apaf-1 | 1 | 102.9 | 0.29 | 1.8 |
| AQP4 | AQP4 | 1 | 1.5 | 0.98 | 2.47 |
| ATAD5 | ELG1 | 1 | 1083.4 | 0.22 | 0.75 |
| BAG1 | BAG1_p36delta236 nt BAG1_p36 | 4 | 1376.5 | 0.1 | −1.31 |
| BCL2 | BCL2 | 1 | 10 | 0.18 | −0.22 |
| BIRC2 | c-IAP1_285-1399 c-IAP1_1313-1462 | 1 | 147 | 0.13 | −0.94 |
| CCND1 | CCND1 | 1 | 213 | 0.17 | −0.15 |
| CDK11A | PITSLRE_p58 | 1 | 0 | NA | NA |
| CDKN1B | p27kip1 | 1 | 1252 | 0.17 | −0.3 |
| CSDE1 | UNR | 1 | 16,657.5 | 0.05 | −5.12 |
| DCLRE1A | hSNM1 | 1 | 1065.2 | 0.17 | −0.24 |
| EIF4G1 | eIF4G | 1 | 12,937 | 0.21 | 0.65 |
| EIF4G1 | eIF4GI-ext | 1 | 12,937 | 0.21 | 0.65 |
| EIF4G2 | DAP5 | 1 | 21,727.6 | 0.26 | 1.56 |
| EIF4G3 | eiF4GII | 1 | 1305.6 | 0.13 | −1.46 |
| EIF4G3 | eIF4GII-long | 1 | 1305.6 | 0.13 | −1.46 |
| FGF1 | FGF1A | 1 | 0 | NA | NA |
| FMR1 | FMR1 | 1 | 137.8 | 0.13 | −1.35 |
| HSPA1A | hsp70 | 1 | 0 | NA | NA |
| HSPA5 | BiP_-222_-3 | 1 | 1819.3 | 0.23 | 1 |
| IGF2 | IGF2_leader2 | 1 | 0 | NA | NA |
| LAMB1 | LamB1_-335_-1 | 1 | 1141 | 0.13 | −1.52 |
| LEF1 | LEF1 | 1 | 248 | 0.15 | −0.8 |
| MNT | MNT_75-267 MNT_36-160 | 1 | 144 | 0.28 | 1.32 |
| MYB | MYB | 1 | 154.2 | 0.09 | −1.47 |
| MYC | c-myc | 2 | 1946 | 0.14 | −1.2 |
| MYCL1 | L-myc | 1 | 0.5 | NA | NA |
| MYCN | n-MYC | 1 | 0 | NA | NA |
| NKRF | NRF_-653_-17 | 1 | 1064 | 0.18 | −0.01 |
| PDGFB | PDGF2/c-sis | 1 | 0 | NA | NA |
| PIM1 | Pim-1 | 1 | 113 | 0.12 | −1.1 |
| RUNX1 | AML1/RUNX1 | 1 | 10 | 0.16 | −0.38 |
| RUNX1T1 | MTG8a | 1 | 163 | 0.13 | −1.08 |
| XIAP | xIAP_5-464 XIAP_305-466 | 1 | 2169.6 | 0.12 | −1.67 |
Download links
A two-part list of links to download the article, or parts of the article, in various formats.
Downloads (link to download the article as PDF)
Open citations (links to open the citations from this article in various online reference manager services)
Cite this article (links to download the citations from this article in formats compatible with various reference manager tools)
Translation of 5′ leaders is pervasive in genes resistant to eIF2 repression
eLife 4:e03971.
https://doi.org/10.7554/eLife.03971


