Defective apical extrusion signaling contributes to aggressive tumor hallmarks
- University of Utah, United States
- Roswell Park Cancer Institute, United States
Figures
Figure 1
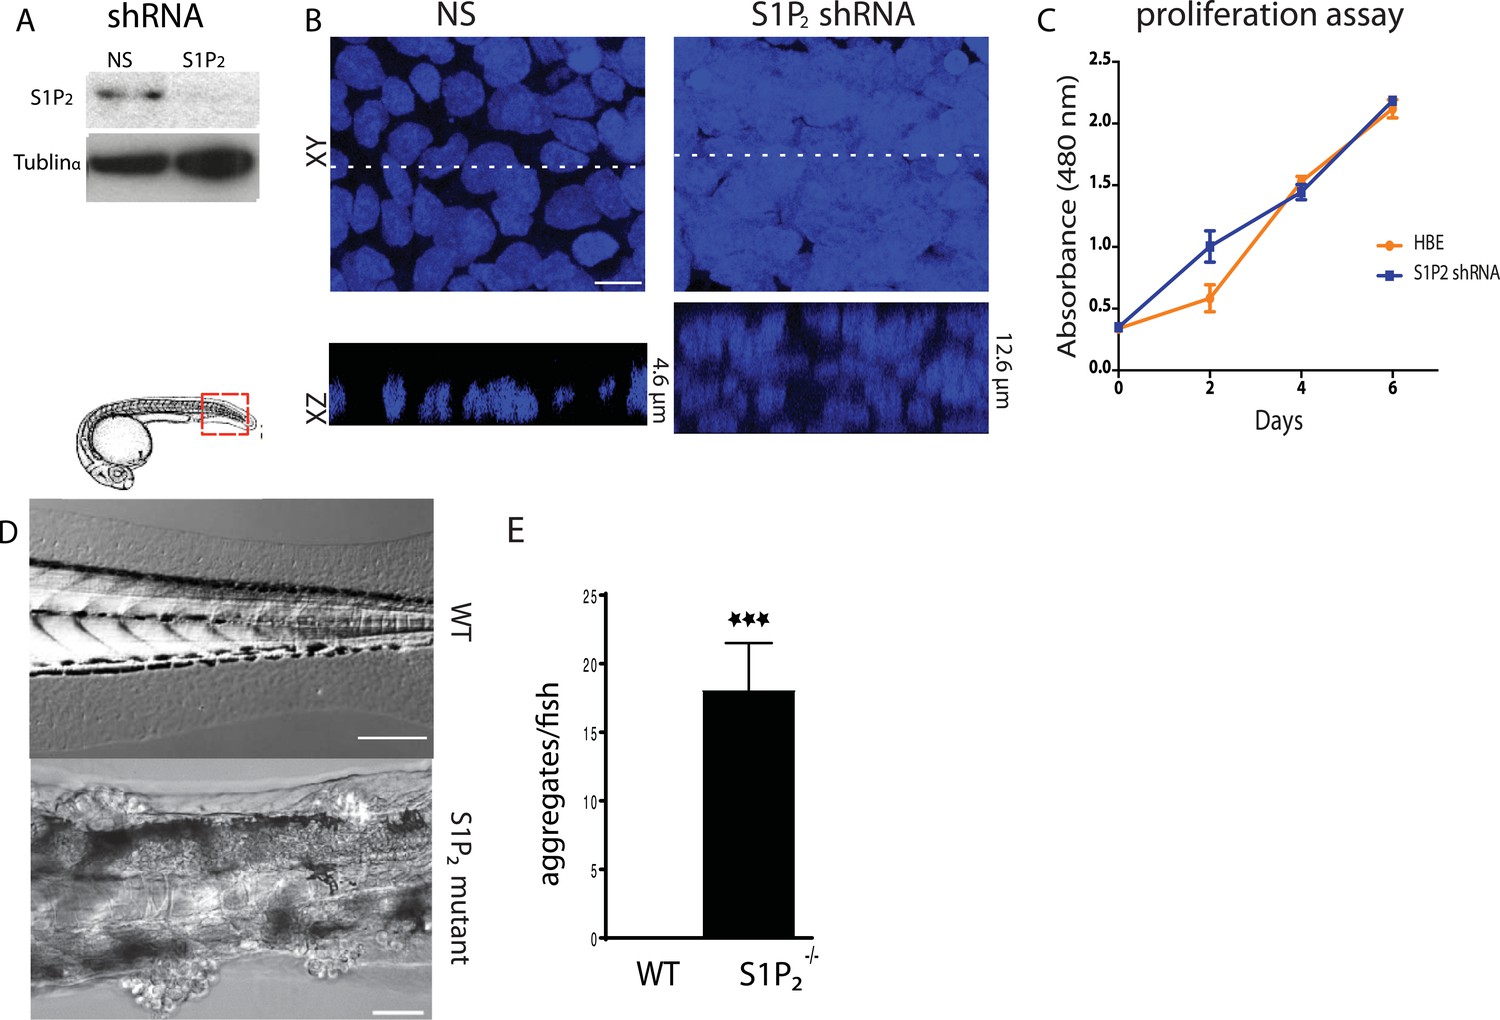
Loss of S1P2 and extrusion leads to accumulation of epithelial cell masses.
(A) S1P2 immunoblot of HBE cells expressing control (left) or S1P2-specific shRNA (right) with α-tubulin as loading control. (B) Representative images of HBE cells (DNA only) expressing control (left) or S1P2-specific shRNA (right) grown for 3 weeks. Scale bar, 10 µm. (C) Proliferation assay indicates that S1P2-knockdown cells proliferate at the same rate as wild type controls cells. (D) Representative DIC micrographs of 5-dpf WT (top) and Mil (S1P2 mutant) (bottom) zebrafish larvae, where cartoon shows region where fish was imaged. Scale bars, 100 µm where red box indicates region imaged. (E) Quantification of epidermal clumps of 22 zebrafish larvae.
Figure 2
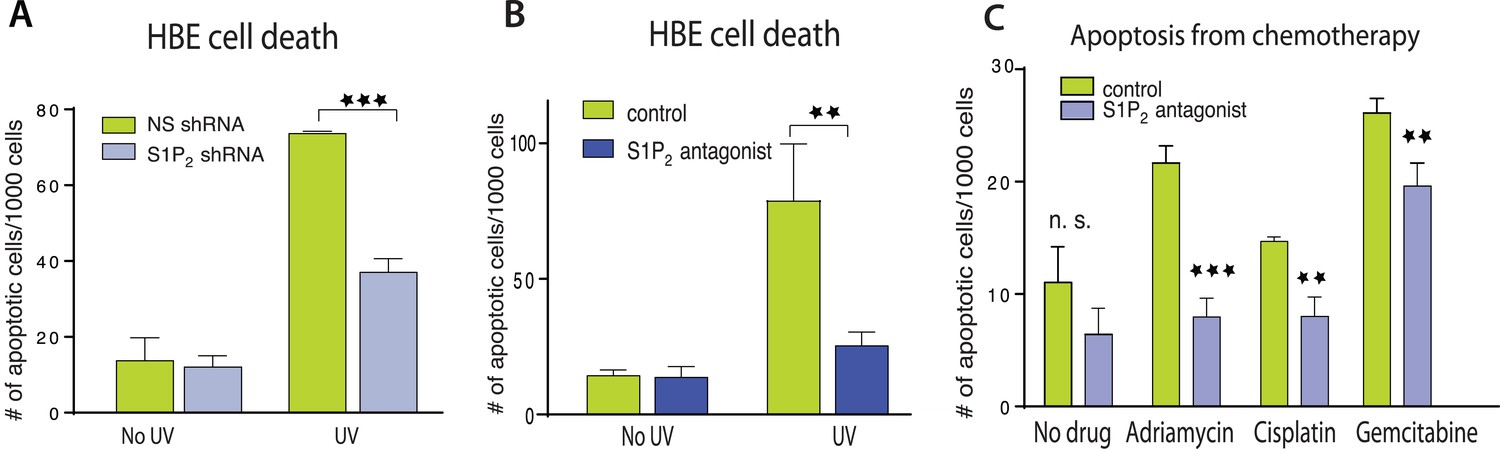
Disruption of S1P2-extrusion signaling reduces apoptotic response.
(A) Quantification of UV-induced apoptotic cells in HBE monolayers expressing control or S1P2-specific shRNA. (B) Quantification of UV-induced apoptosis of HBE monolayers in the presence or absence of the S1P2 antagonist JTE-013. (C) Quantification of indicated chemotherapy-induced apoptotic MDCK cells in the presence or absence of JTE-013, where all error bars are STD (**p < 0.01, and ***p < 0.001).
Figure 3

Decreased apoptosis is due to blocked extrusion rather than S1P signaling.
(A) Rates of MDCK cell death (left Y-axis, blue) correspond with cell extrusion rates (right Y-axis, yellow) in response to UV-C when treated with extrusion inhibitors. (B) Representative images of apoptotic cells with and without compounds that block extrusion. When extrusion occurs, the dying cell DNA lies above (out of plane from) the neighboring cells with a contracted actin ring but when it fails, it lies in the same plane as surrounding cells with an uncontracted actin ring. Only the S1P2 antagonist JTE013 causes significant S1P accumulation in the dying cell (second column), whereas blocking extrusion with the other compounds does not impact S1P levels, where p values of each drug treatment compared to control are listed on each S1P panel as asterisks (n = 4). Bar = 10 µm. (C) Ratio of reduction of extrusion to reduction of apoptosis shows nearly a 1:1 correlation throughout, where p-values compared to S1P2 are not significant. (D) Compounds used to block extrusion do not affect apoptosis rates in single MDCK cells treated with EGTA in response to UV. (E) Quantification of UV-induced apoptotic NIH 3T3 cells in the presence of vehicle or JTE-013; All results are expressed as mean values ± STD of three separate experiments (*p < 0.01, **p < 0.005, ***p < 0.005, and ****p < 0.0001), and NS in graphs B, D, and E indicate that p values of a unpaired T-test are not significant.
Figure 4
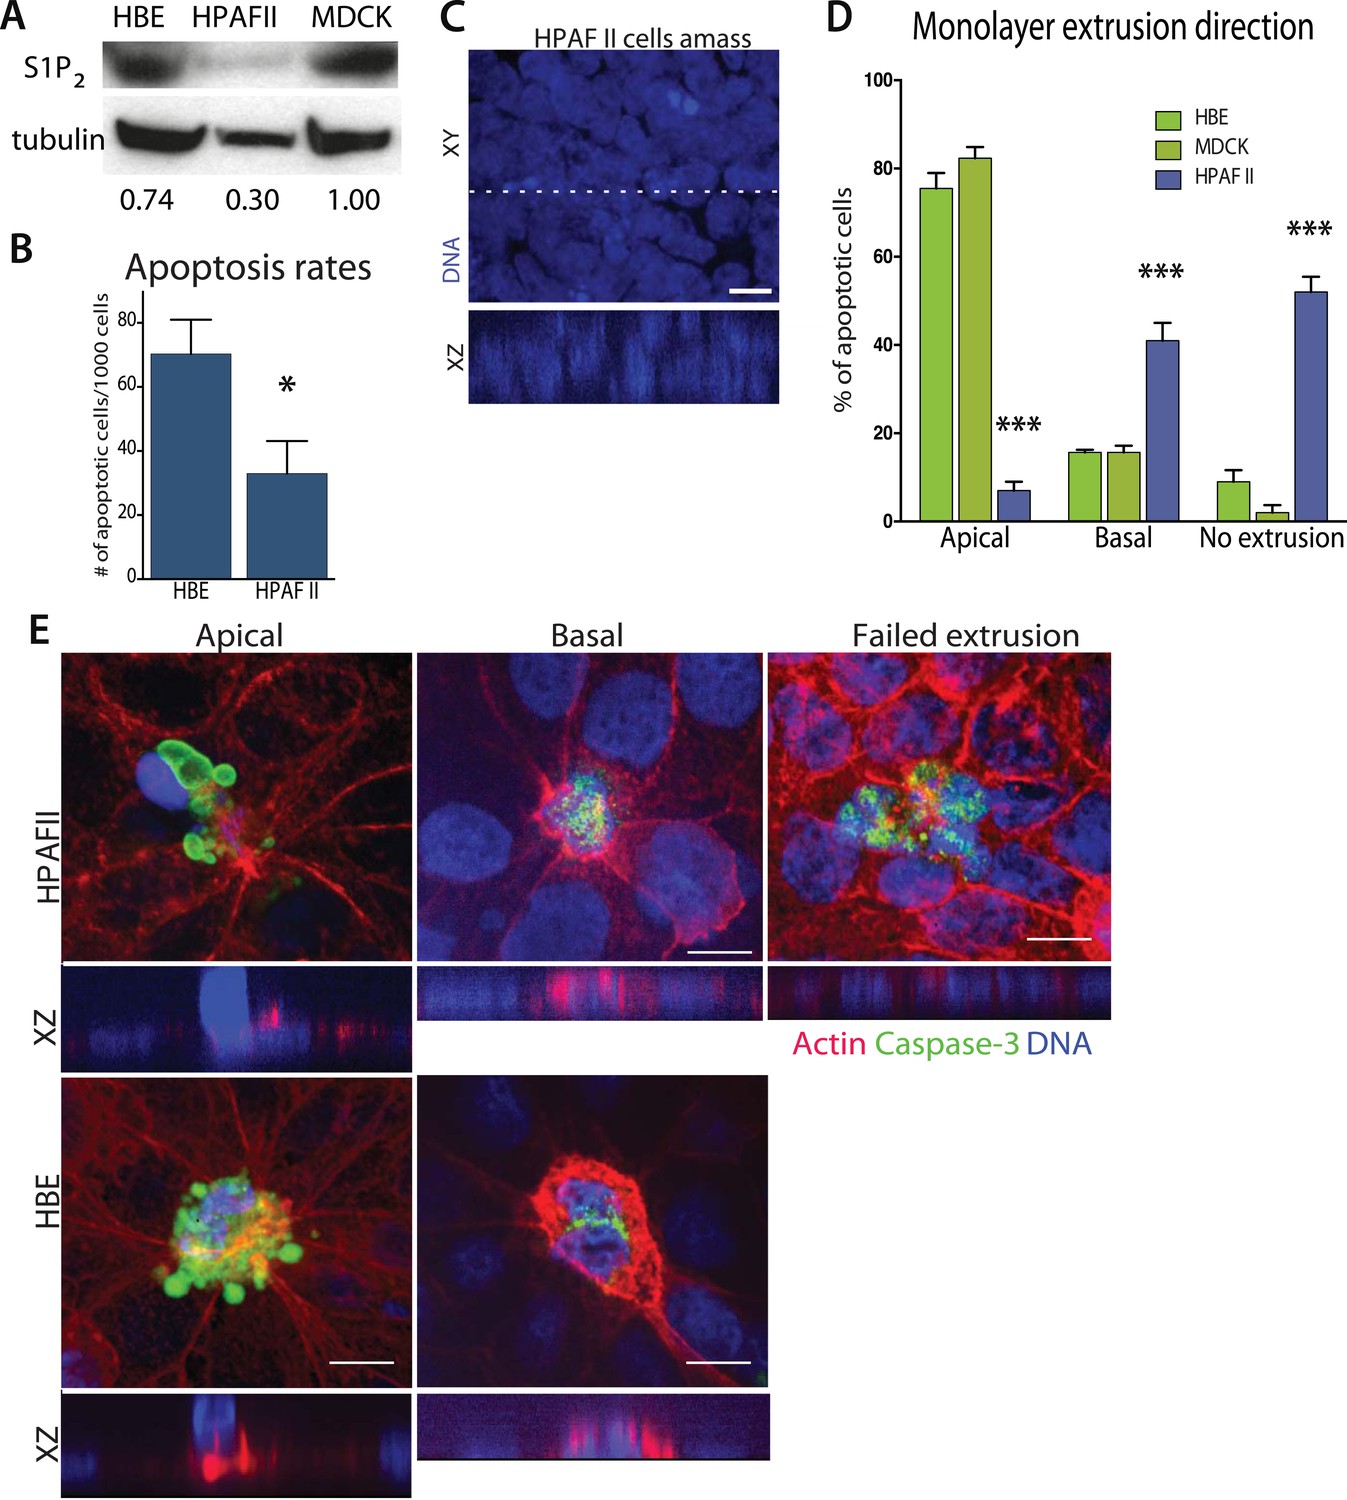
Pancreatic cancer cell line HPAF II accumulates into masses and extrudes basally.
(A) S1P2 immunoblot of HBE (left), HPAF II (middle), and MDCK (left) cells with α-tubulin as loading control. (B) Cell death rates in response to UV-C. (C) Quantification of cell extrusion events from three independent experiments; n = 300 apoptotic cells per cell line, error bars are STD where *<0.01 and ***<0.0001. (D) Representative confocal projection and XZ cross-section (from region in dashed line above) of HPAF II cells that grew into masses rather than monolayers. (E) Representative confocal projections of HPAF II (upper panel) and HBE (lower panel) cells undergoing apical (left) or basal (middle) extrusion, with XZ sections below. Basal extrusion was scored when an actin ring contracted above the dying cell (marked by DNA and caspase-3 staining) and the DNA of the dying cell lies in the same plane as the neighboring cells. Scale bars, 10 µm.
Figure 5
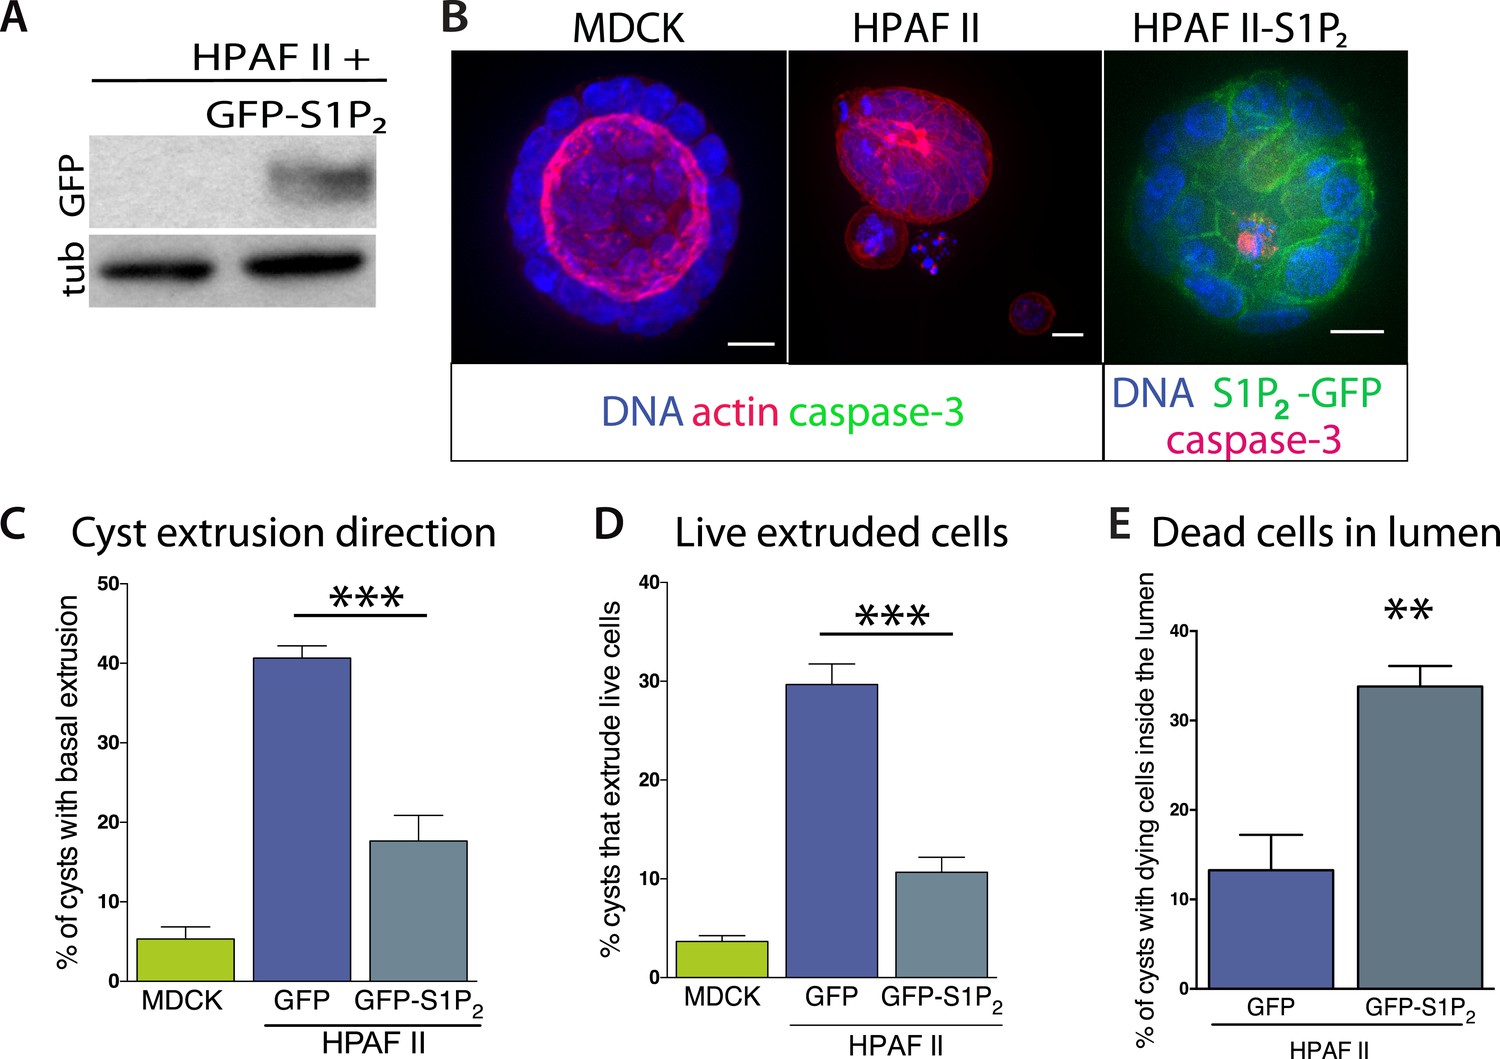
Exogenous expression of S1P2 rescues apical extrusion and cell death.
(A) GFP immunoblot of HPAF II cells expressing S1P2 GFP. (B) Representative confocal projections of MDCK, HPAF II, and HPAF II-S1P2 cysts, where scale bar = 10 µm. (C) Percentages of MDCK, HPAF II GFP, and HPAF II S1P2 cysts with basal extrusion; n = 300 cysts per cell line. (D) Quantification of MDCK, HPAF II GFP, and HPAF II S1P2 cysts extruding live cells basally; n = 300 cysts per cell line. (E) Frequency of HPAF II GFP and HPAF II S1P2 cysts with dying cells inside the lumen; n = 300 cysts per cell line. All results are expressed as mean values ± STD of three separate experiments (**p < 0.01, and ***p < 0.001).
Figure 6
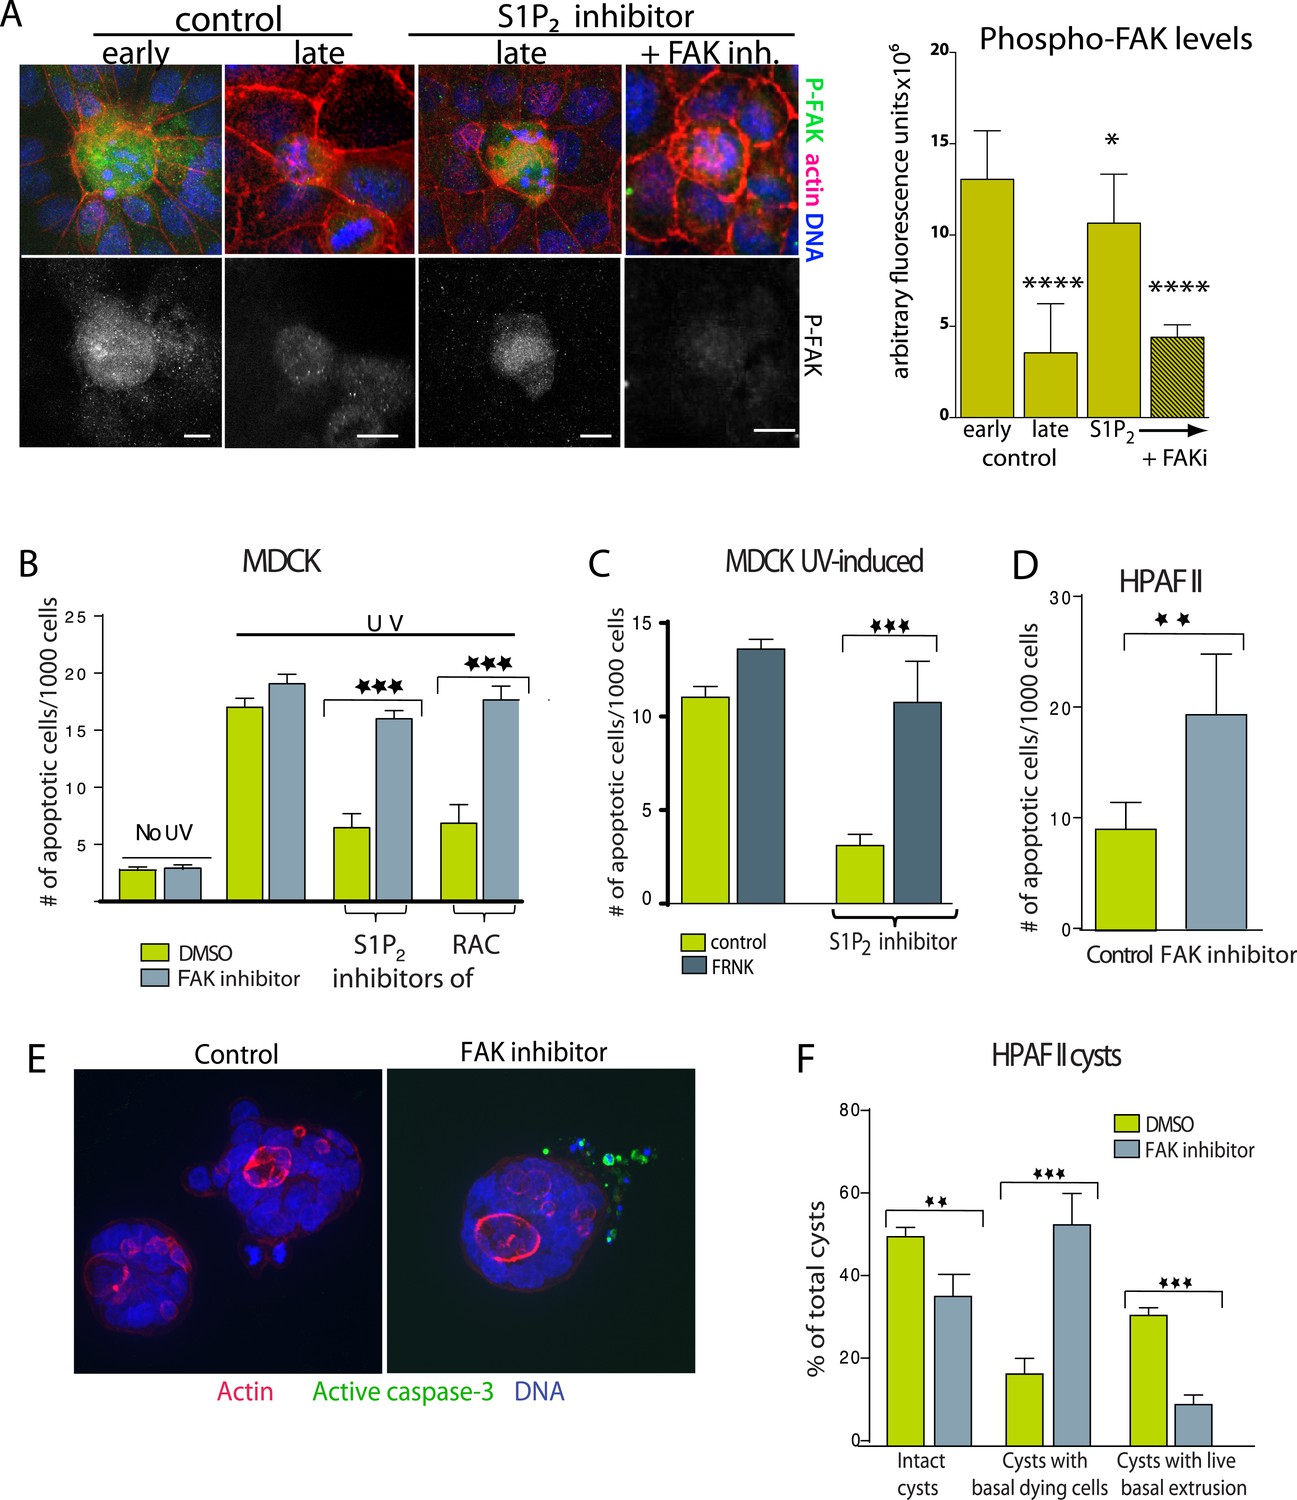
Inhibition of FAK activity specifically increases cell death in epithelial cells lacking S1P2.
(A) Immunostaining of active phospho-FAK in early and late control extrusions and in a JTE-013 (S1P2 antagonist)-inhibited extrusion with late apoptotic cell or one with the FAK inhibitor PF573228, with averaged arbitrary fluorescence units and their p-values compared to early extruding cells in graph on right (n = 10 measurements each over three separate experiments). (B) Quantification of UV-induced MDCK apoptosis in the presence of control, JTE-013, or EHT1864 with or without treatment of the FAK inhibitor PF573228, where n = 3000. (C) Quantification of UV-induced apoptosis of MDCK cells and those expressing FRNK, where n = 3000. (D) Quantification of PF573228-induced apoptosis of HPAF II cells, where n = 3000. (E) Representative confocal projections of HPAF II cysts treated with control or PF573228. Scale bars = 10 µm. (F) Frequencies of HPAF II cysts with dying cells, live extruding cells, or neither, where n = 300. All quantification results are expressed as mean values ± STD of three separate experiments (*p < 0.05, **p < 0.01, ***p < 0.001, and ****p < 0.0001).
Figure 7
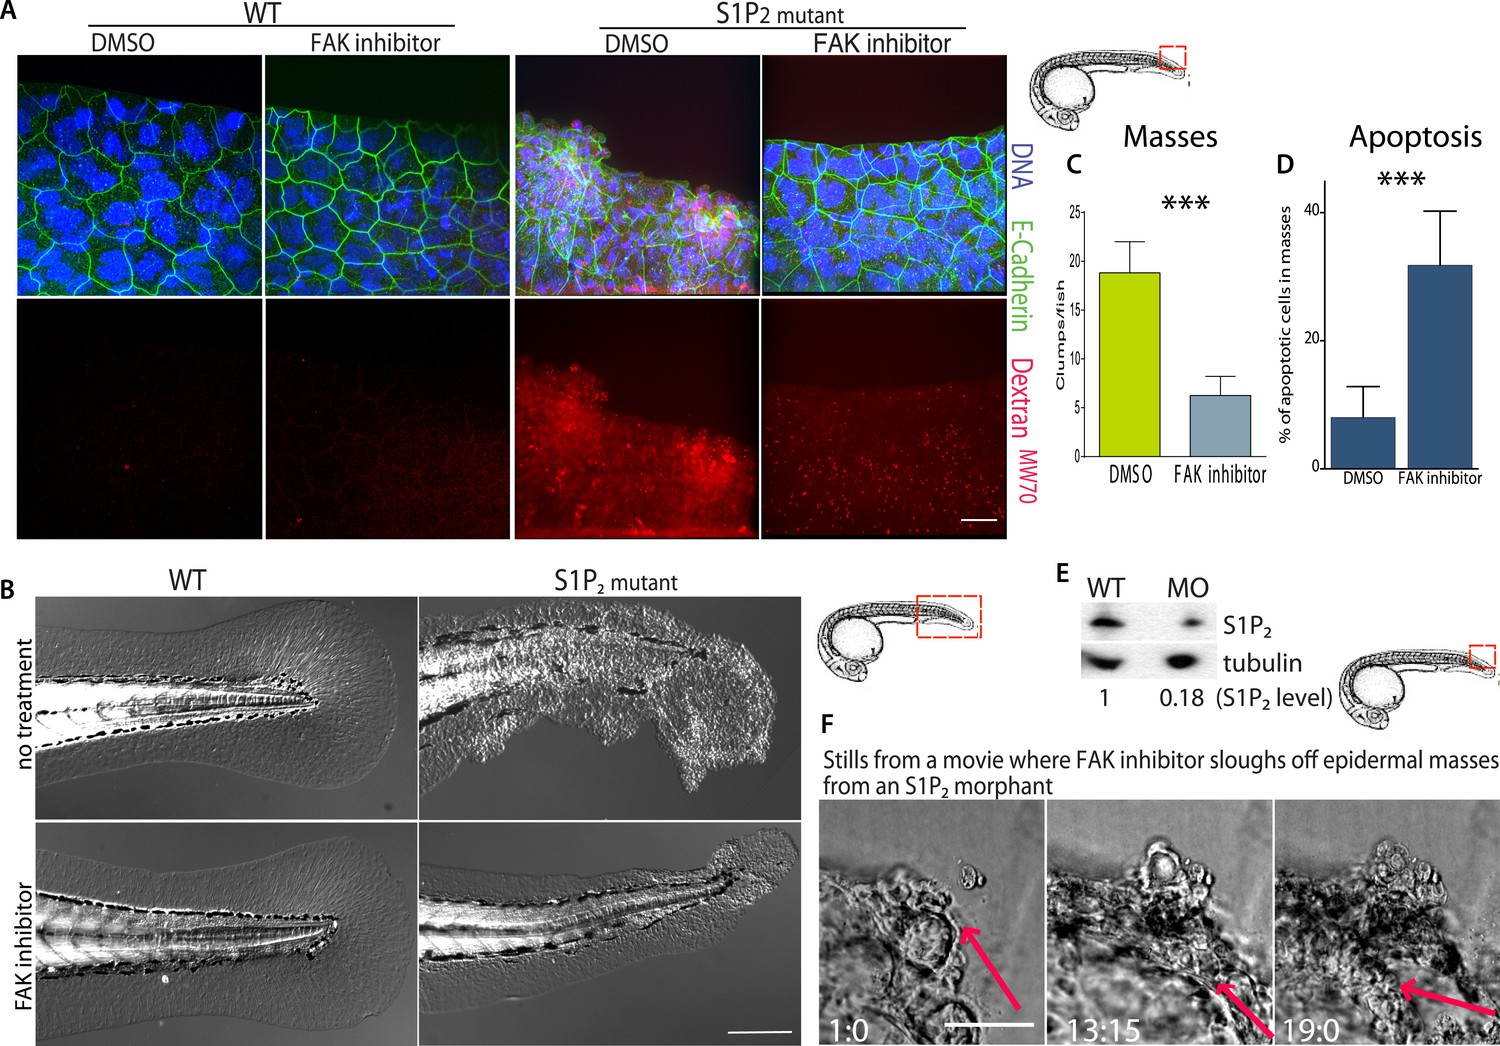
FAK inhibitors eliminate epidermal cell masses in S1P2 zebrafish mutants and improve epidermal barrier function without affecting wild type zebrafish.
(A) Representative confocal projections of 5-dpf WT (left) and Mil (S1P2 mutant) (right) zebrafish larvae treated with DMSO or FAK inhibitor PF573228, where high Texas-Red Dextran indicates poor permeability in Mil but is greatly reduced when barrier function is improved with FAK inhibitor treatment. Scale bar = 10 µm and red box indicates region of fish imaged. (B) 5 dpf Mil and wild type zebrafish treated with and without FAK inhibitor. Note that while FAK inhibitor-treated Mil have other developmental defects (heart and circulation), there are no obvious clumps as seen in the untreated fish. Scale bar = 100 µm and red box indicates region of fish imaged. Note FAK inhibitor does not affect WT zebrafish. (C) Quantification of epidermal masses in 5 dpf Mil zebrafish larvae with and without PF573228. (D) Quantification of apoptotic cells within epidermal masses with and without PF573228. For both, error bars are SD and p values are ***<0.0001. (E) Immunoblot showing knockdown of S1P2 by photo-activatable morpholinos. (F) Stills from a video where PF573228 was added to S1P2 morphant at 5 dpf, where red arrows show the edge of the epidermis over time, scale bar = 50 µm and red box indicates region of fish imaged. Time is hours:minutes following FAK inhibitor addition. Note: epidermal cells that are sloughed off become embedded in the agarose where fish is mounted.
Figure 8
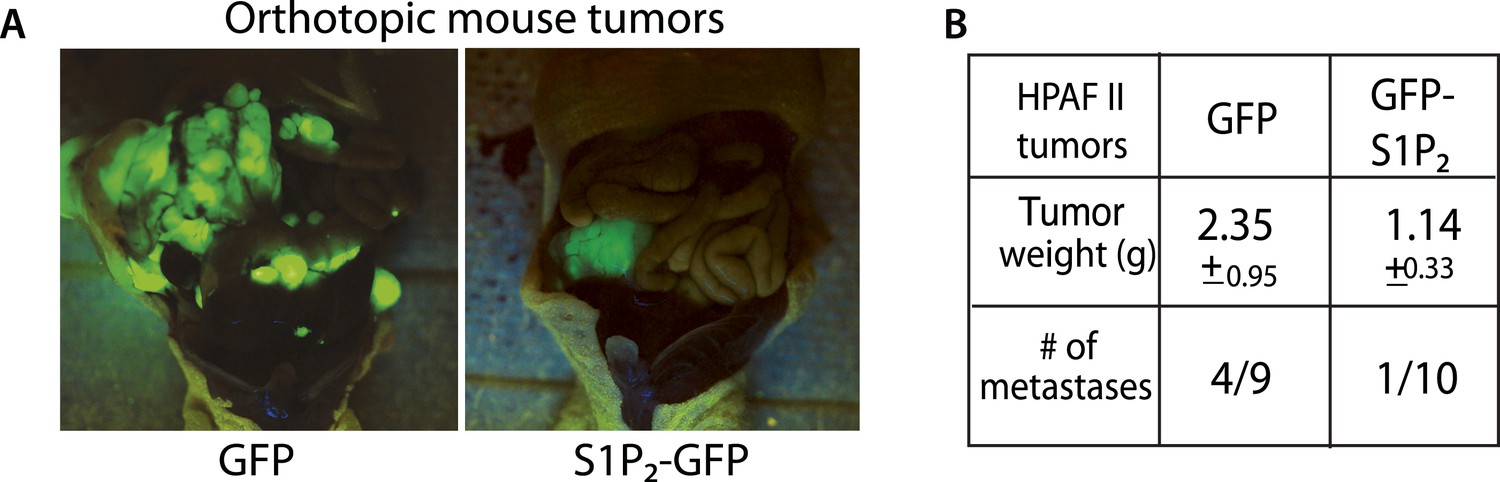
Exogenous S1P2 expression reduces orthotopic pancreatic tumors and rates of metastasis in mice.
(A) Representative images of HPAF II GFP and HPAF II S1P2 orthotopic xenograft tumors in nude mice. (B) Summary of tumor weights and metastatic frequency.
Figure 9

Human pancreatic tumors have reduced S1P2 expression.
(A) H&E (top panel) and confocal fluorescence images (middle and bottom panel) of normal acinar cells from uninvolved neck margin, PanIN, and invasive cancer cells. Scale bars, 100 and 10 µm, respectively. (B) Quantification of S1P2 fluorescence intensity in acinar cells, PanIN, and invasive cancer cells from five individual patients. p values were calculated with a paired t test. (C) Changes of S1P2 fluorescence intensity from normal acinar cells to invasive cancer cells in each individual patient.
Figure 10
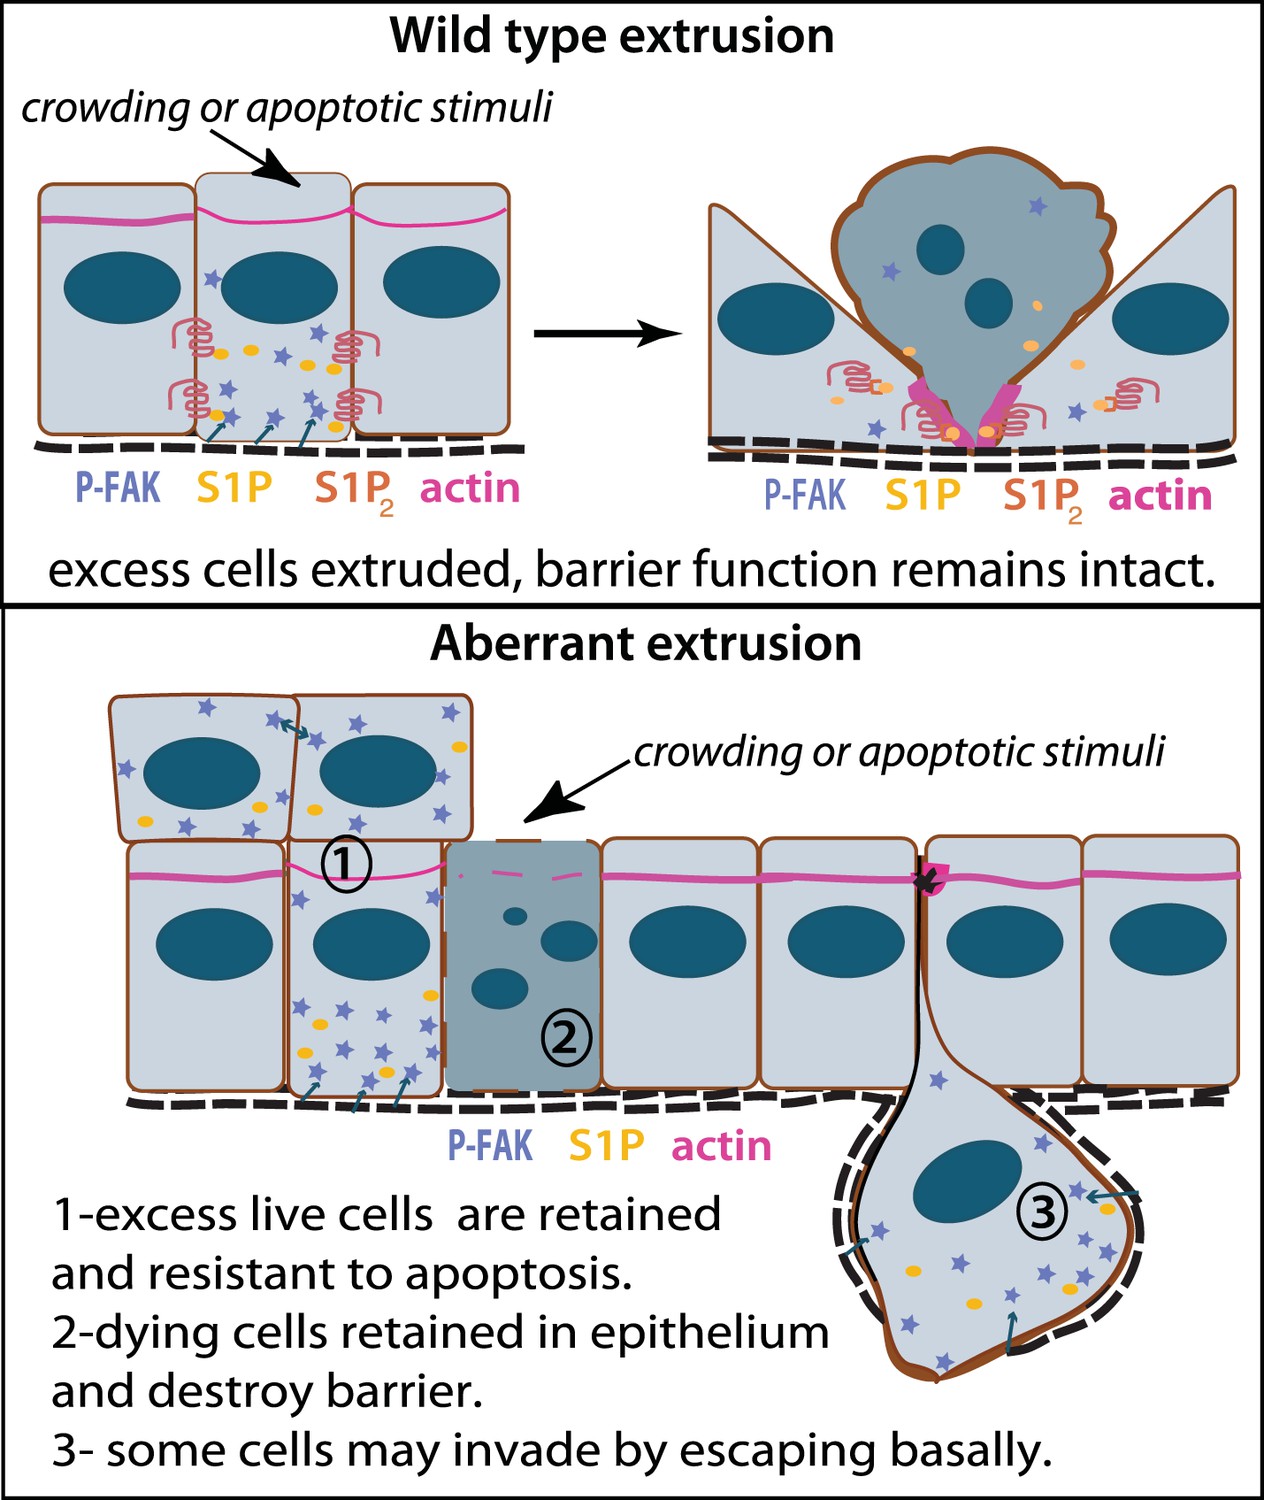
Model for how extrusion can promote cell death and suppress tumor formation.
Apical extrusion promotes death of grey-blue cell (top panel). Here, pro-survival signals phospho-FAK and S1P (which also promotes extrusion) increase in an early extruding cell but decrease once a cell is extruded and targeted to die (right, cell with piknotic nucleus). However, when apical extrusion is blocked due to lack of S1P2 receptor (bottom panel), epithelial cells do not die and can accumulate (left cell and those accumulating above) from increased matrix-derived survival signaling (arrows from matrix neighboring cells signaling to P-FAK). Additionally, cells can still basally extrude, which could potentially enable their invasion beneath the layer (right cell). Basally extruded cells may also have high P-FAK, since they are sensitive to FAK inhibitor when extruded into matrix in vitro, yet this point will be critical to test in vivo in disseminating tumors. Other cells may still die but not extrude (grey-blue cell with piknotic nucleus), leading to poor barrier function and inflammation, which could also promote tumor progression.
Videos
Video 1
An HPAF II cyst growing without apoptotic stimuli extrudes live cells basally.
Note that some cells extrude and die while others survive and/or migrate away.
Download links
A two-part list of links to download the article, or parts of the article, in various formats.
Downloads (link to download the article as PDF)
Open citations (links to open the citations from this article in various online reference manager services)
Cite this article (links to download the citations from this article in formats compatible with various reference manager tools)
Defective apical extrusion signaling contributes to aggressive tumor hallmarks
eLife 4:e04069.
https://doi.org/10.7554/eLife.04069


