High-throughput engineering of a mammalian genome reveals building principles of methylation states at CG rich regions
- Friedrich Miescher Institute for Biomedical Research, Switzerland
- Swiss Institute of Bioinformatics, Switzerland
- University of Basel, Switzerland
Figures
Figure 1 with 1 supplement
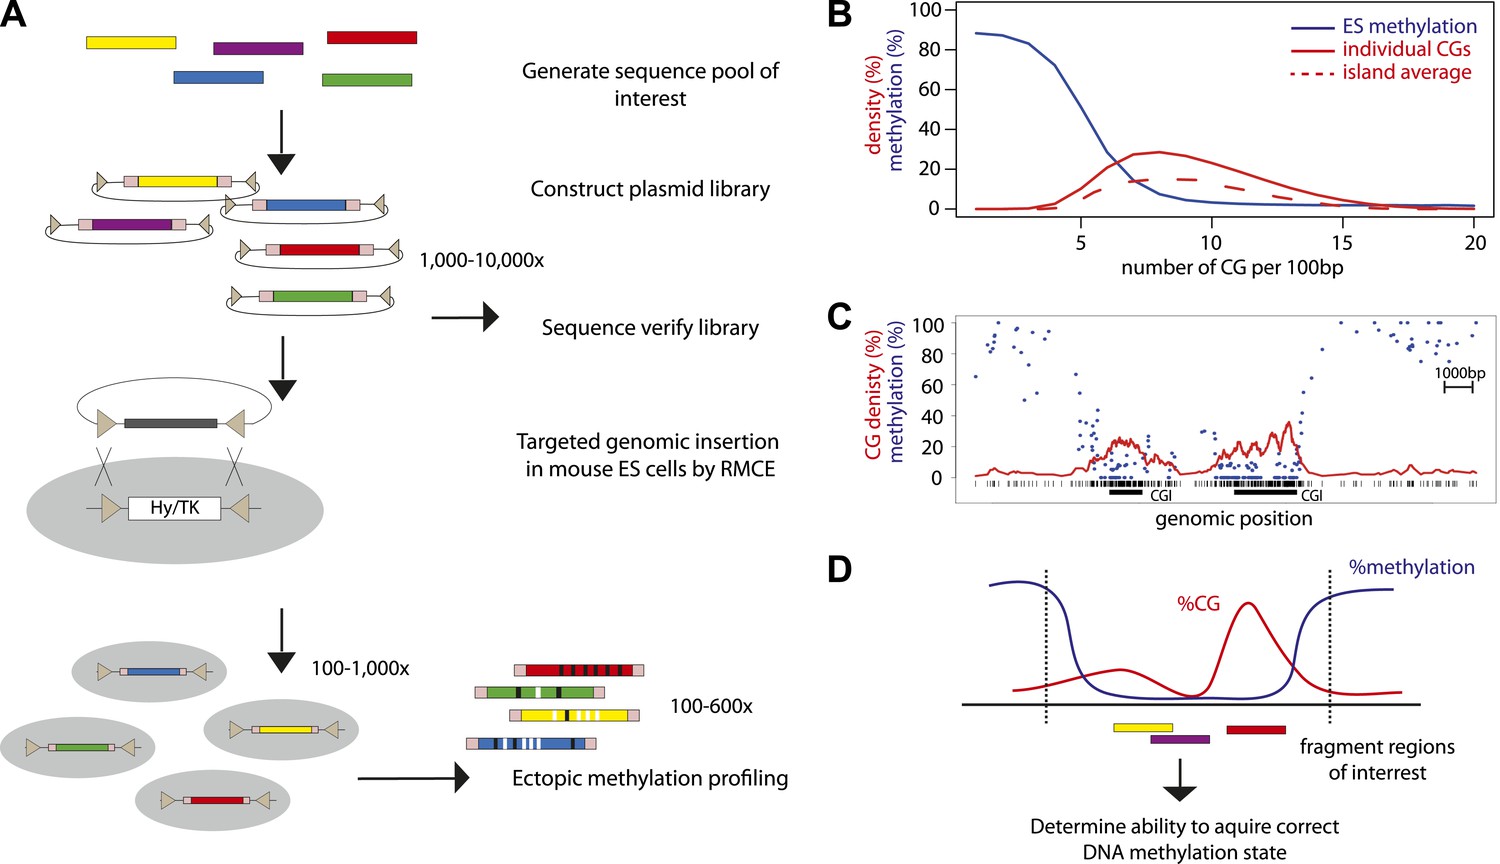
High throughput genome engineering methodology.
(A) A pool of diverse DNA fragments is ligated into a plasmid that contains a set of inverted lox-P sites (triangles) and universal priming sequences (pink boxes) flanking the cloning site. After transformation in E. coli the library composition is determined by paired-end sequencing of the fragment boundaries. The plasmid library is inserted at the β-globin locus by Recombination Mediated Cassette Exchange (RMCE). Methylation of the fragments is determined by high throughput sequencing of the bisulphite PCR product produced using the universal primer sites. (B) Comparative distribution of methylation and densities of CG dinucleotides in the mouse genome. CGs of the mouse genome were classified based on local CG density and the average of their methylation status in mESC was plotted (blue line). The proportion of single CGs within UCSC CGIs having a certain CG density are plotted as filled red line, revealing the spread of densities observed in umethylated islands. The average CG density of islands is also plotted (dashed red line), revealing the heterogeneity between islands. (C) Single locus example of unmethylated CG rich regions with heterogeneous CG density. (D) Application of the genome engineering methodology to test the sequence contribution to methylation states. Sequences of CG rich regions are fragmented into smaller entities and the ability of theses sub-fragments to acquire methylation is assayed.
Figure 1—figure supplement 1
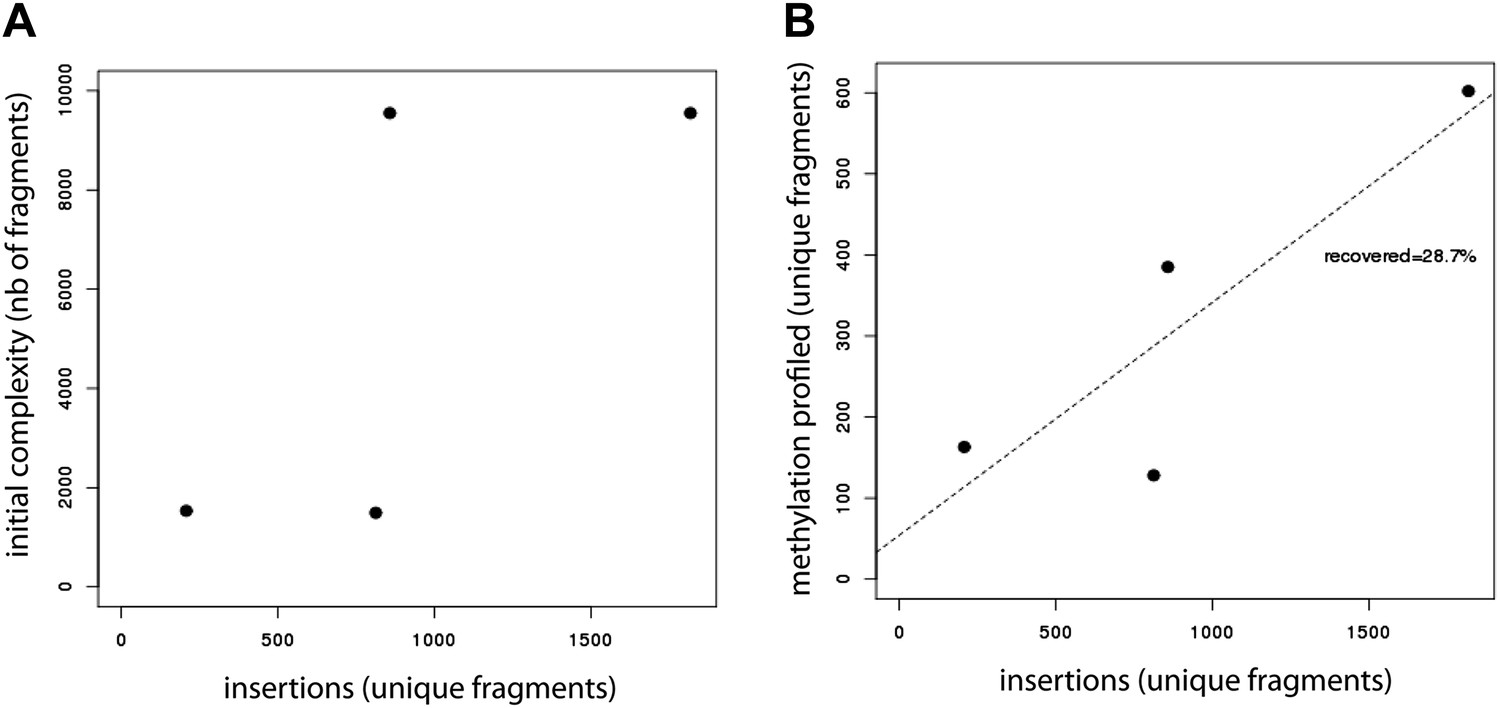
Evaluation of the efficiency of the developed method.
(A) Evaluation of the library insertion efficiency for four of the tested libraries shows up to 1,800 insertions per experiment. Compared are the numbers of unique fragments in the initially cloned pool as determined by sequencing of the native PCR performed on the library containing plasmid and the number of unique fragments inserted in the mESC genome as detected by sequencing of the native PCR performed using the universal primers flanking the fragments. The number of uniquely detected fragments depends on the initial library complexity. (B) Evaluation of the proportion of inserted fragments recovered during the methylation profiling as measured by sequencing of the PCR performed on the bisulfite converted gDNA. This reveals that around 30% of the initially inserted fragments are efficiently covered suggesting that bisulphite PCR is the limiting step of the experiment.
Figure 2 with 2 supplements
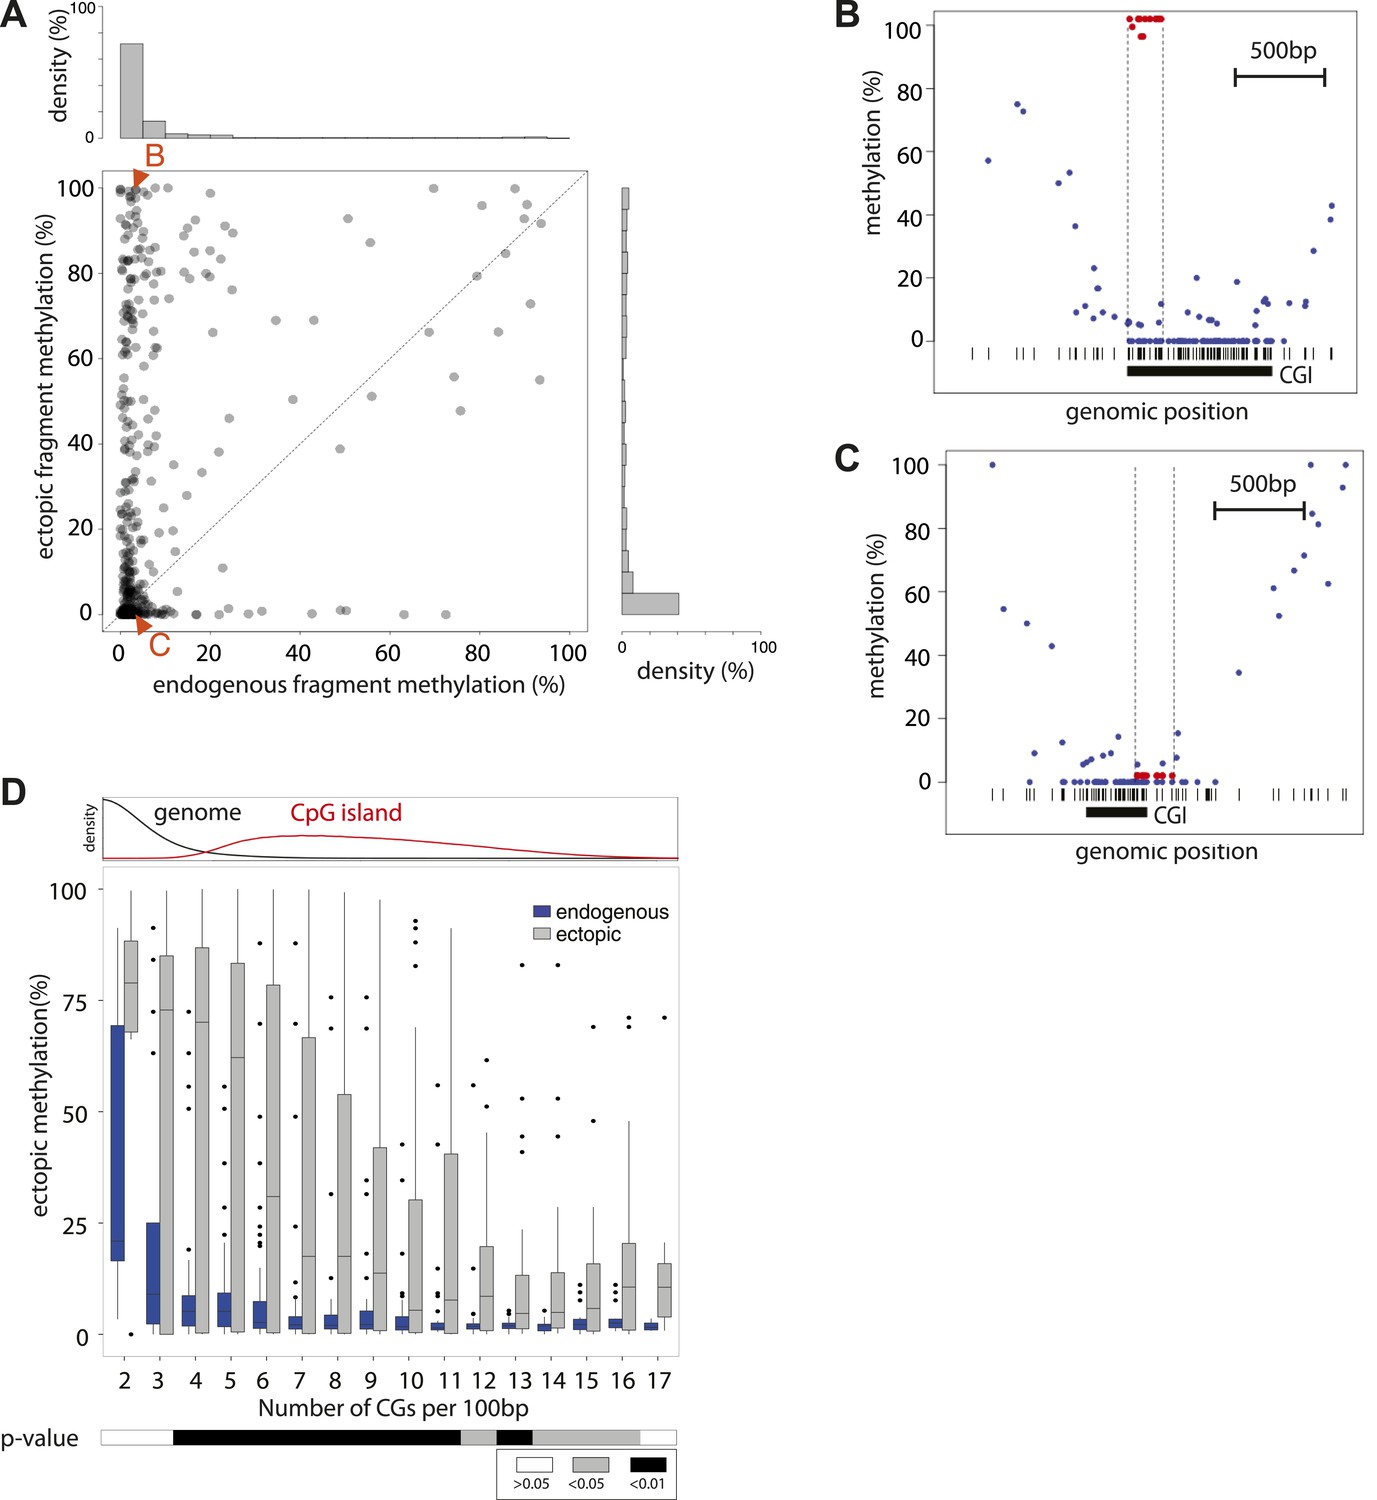
Systematic determination of the autonomy of DNA sequences to acquire DNA methylation patterns.
(A) Comparison of methylation levels of inserted fragments with their methylation at endogenous locus (n = 394; grey transparent dots). Histograms depict the proportion of fragments in each area of the plot illustrating the prevalence of unmethylated regions within the library. A majority of these fragments maintain their state when inserted. Orange arrows indicate fragments displayed as single locus examples. (B–C) Examples of regions that loose or maintain their unmethyated status when inserted at the ectopic site. Single CG methylation levels for the same sequence are compared between endogenous (blue dots) and ectopic (red dots) context. Vertical lines show the boundaries of each fragment. Black box indicates UCSC CpG island definition. Black vertical bars depict the positions of CGs. (D) Comparison of methylation levels of DNA fragments between endogenous and ectopic context plotted against CG content. Center panel: data were binned according to the CG density of fragments and the distribution of endogenous (blue) and ectopic (grey) methylation within each bin is depicted in boxplots. Upper panel: Comparative distribution of the CG density in a 300 bp surrounding all CGs within (red) and outside (black) CpG islands throughout the genome illustrating that the vast majority of tested fragments have a CG density within the range observed at CGIs. Lower panel: statistical significance of the differences between endogenous and ectopic methylation for each CG density bin. p-values derived from a t test are displayed using the indicated color code for each bin.
Figure 2—figure supplement 1
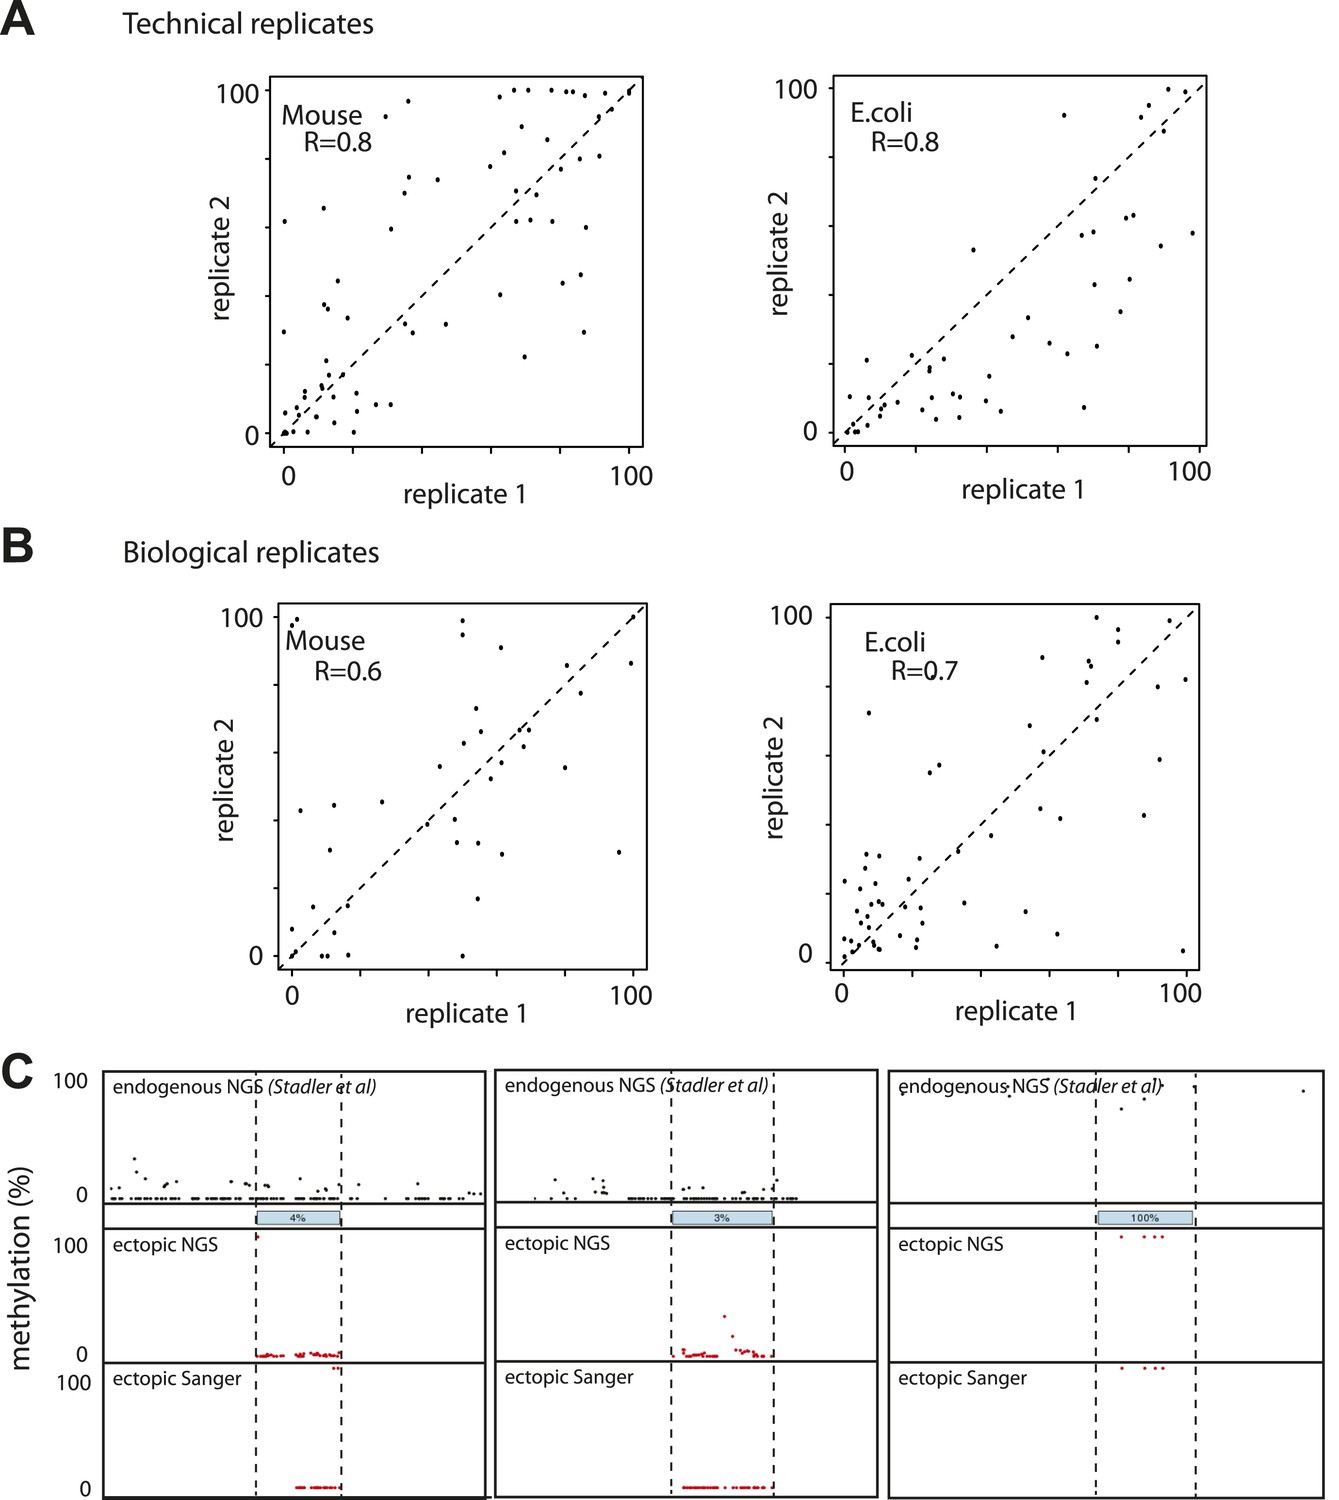
Evaluation of the reproducibility of the developed method.
(A) Estimation of the measurement error in methylation levels determination for the Mouse and the E.coli samples. Technical replicates represent the same library insertion profiled twice using the same starting gDNA as a template for PCR. (B) Estimation of the biological variation in methylation acquisition for the mouse and E.coli based libraries. Biological replicates represent separate library insertion events. Pearson correlation coefficients R are depicted. (C) Validation of single fragments methylation levels by standard bisulphite sequencing. Black dots represent the single CG endogenous methylation levels as measured by shotgun bisulphite sequencing (Stadler et al, 2012). Blue boxes represent the endogenous location of the inserted fragment. Red dots represent the ectopic methylation levels of the inserted fragments as measured by next generation sequencing (upper track) or Sanger sequencing (lower track).
Figure 2—figure supplement 2
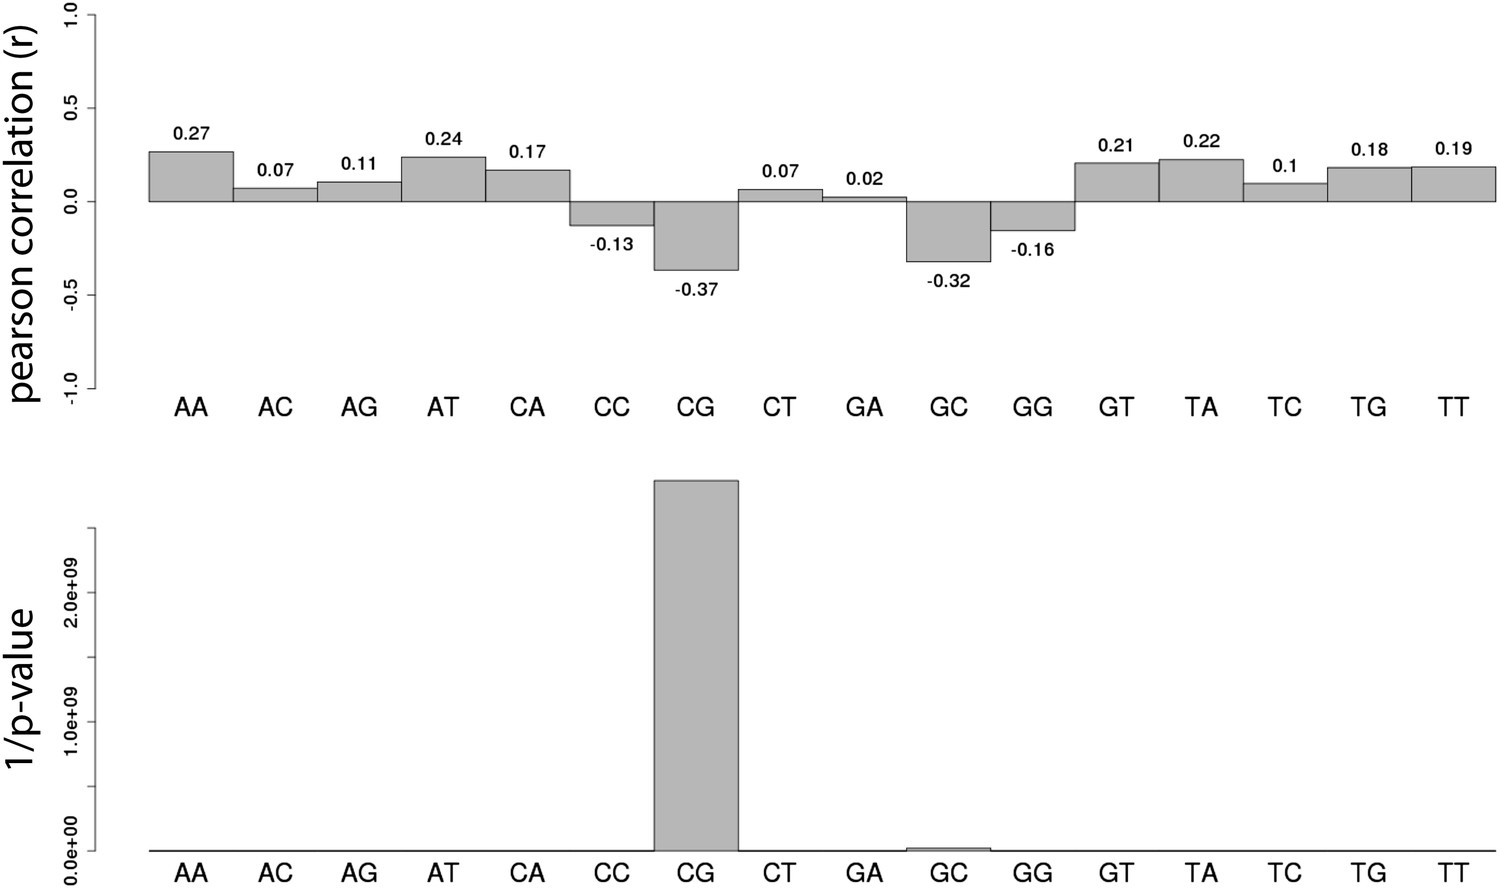
Systematic analysis of the relationship between all dinucleotide frequency and methylation of the mouse fragments.
Shown are the pearson correlations (R – upper panel) and the 1/p-value (upper panel) of individual linear regression between fragment methylation levels and each dinucleotide.
Figure 3 with 2 supplements
Quantification and modeling of the influence of CG content on methylation levels.
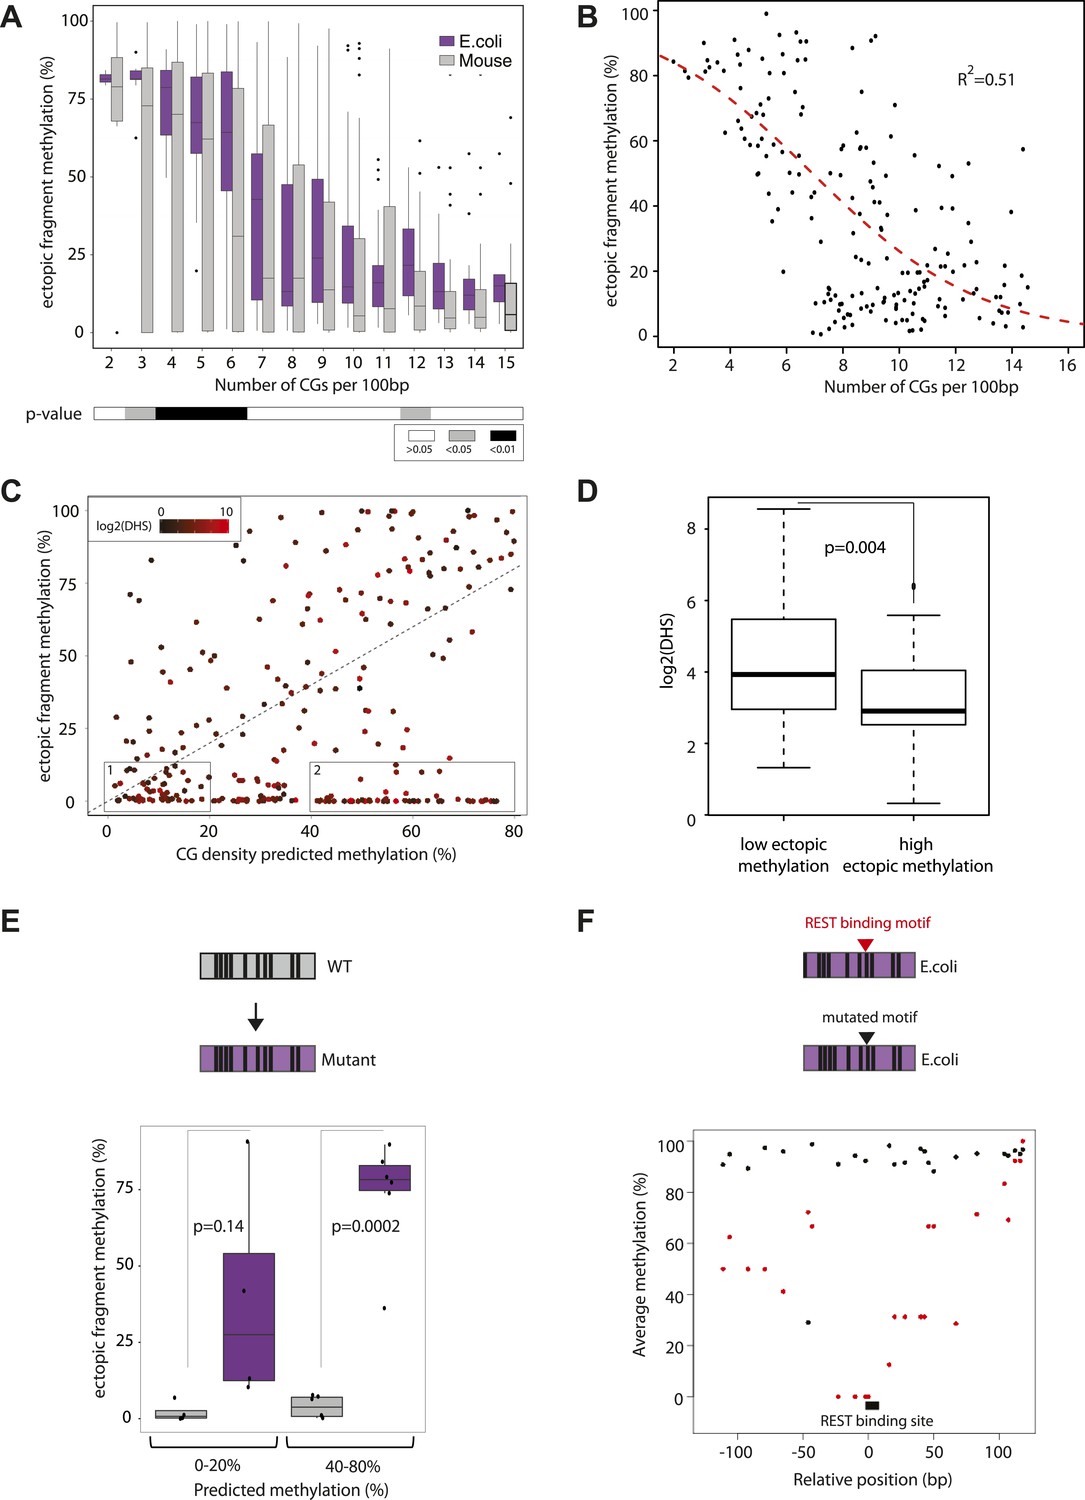
(A) Comparison of methylation level of inserted DNA fragments derived from mouse (grey) or prokaryotic (E. coli-purple) genomes plotted against their CG content. Data were binned according to the CG density of the fragments and the distribution of methylation within each bin is depicted in boxplots. Lower panel: statistical significance of the differences between E. coli and mouse methylation for each CG density bin. p-values derived from a t test are displayed using the indicated color code for each bin. (B) Average DNA methylation levels acquired by E. coli DNA fragments relative to their CG density (n = 183). The methylation state of E. coli derived fragments is anti-correlated to its CG density. The dashed red line represents the sigmoidal model fitted to the data (Coefficient of determination of the sigmoidal fit is displayed R2 = −0.51). (C) Comparison of the CG density based prediction and the observed methylation levels for the mouse fragments (Pearson correlation R = 0.38). The red color scale depicts the DHS signal within the fragments in their endogenous context. The two boxes show subsets used for selecting fragments to be mutated. (D) Boxplot comparing the endogenous DHS signal (log2 of the counts) for fragments predicted to be methylated by the CG based model and observed either unmethylated (left) or methylated (right) when inserted ectopically. The difference observed between the two groups is significant as indicated by the p-value derived from a t test. (E) Comparison of the methylation of mouse fragments to their mutated versions in which all non-CG positions were substituted by E. coli sequence. Boxplots for each predicted category were plotted separately for WT (grey) and mutated sequences (purple). Dots representing the methylation values for individual fragments were overlaid. Pearson correlation between the predicted value and the E. coli transformed is R = 0.64. p-value derived from a t test as a measure of statistical significance of the observed differences is displayed. (F) Evaluation of the effect of protein binding to methylation by insertion of a REST perfect motif (red dots), or the lowest score randomization motif (black dots) in the middle of one of the CG rich E. coli fragment previously found to be fully methylated.
Figure 3—figure supplement 1
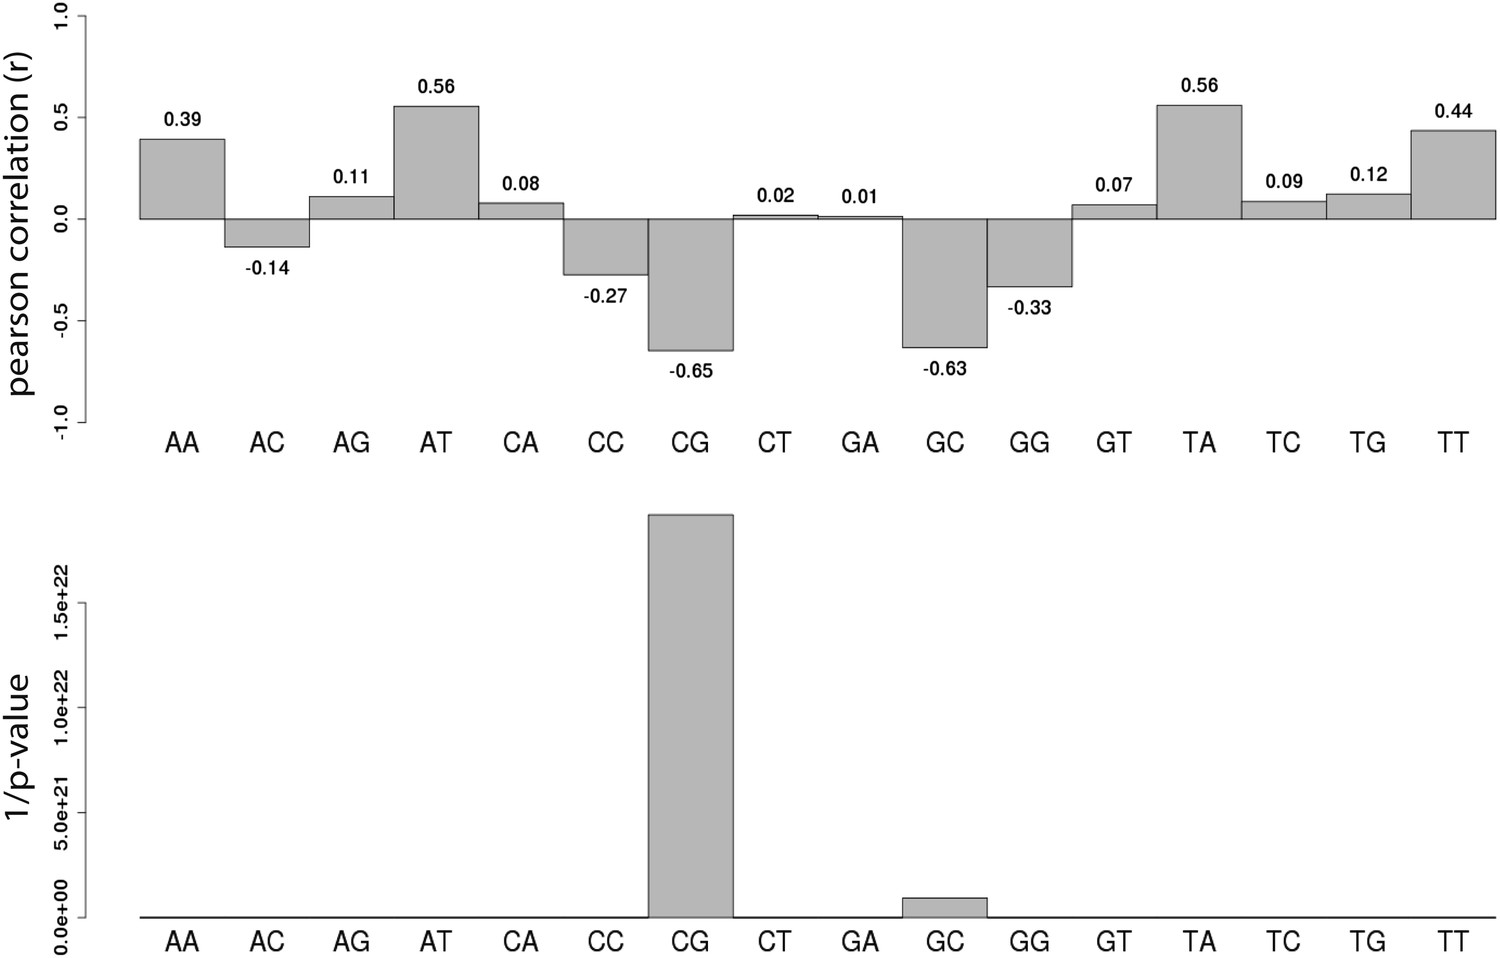
Systematic analysis of the relationship between all dinucleotide frequency and methylation of the E.coli fragments.
Shown are the pearson correlations (R – upper panel) and the 1/p-value (upper panel) of individual linear regression between fragment methylation levels and each dinucleotide.
Figure 3—figure supplement 2
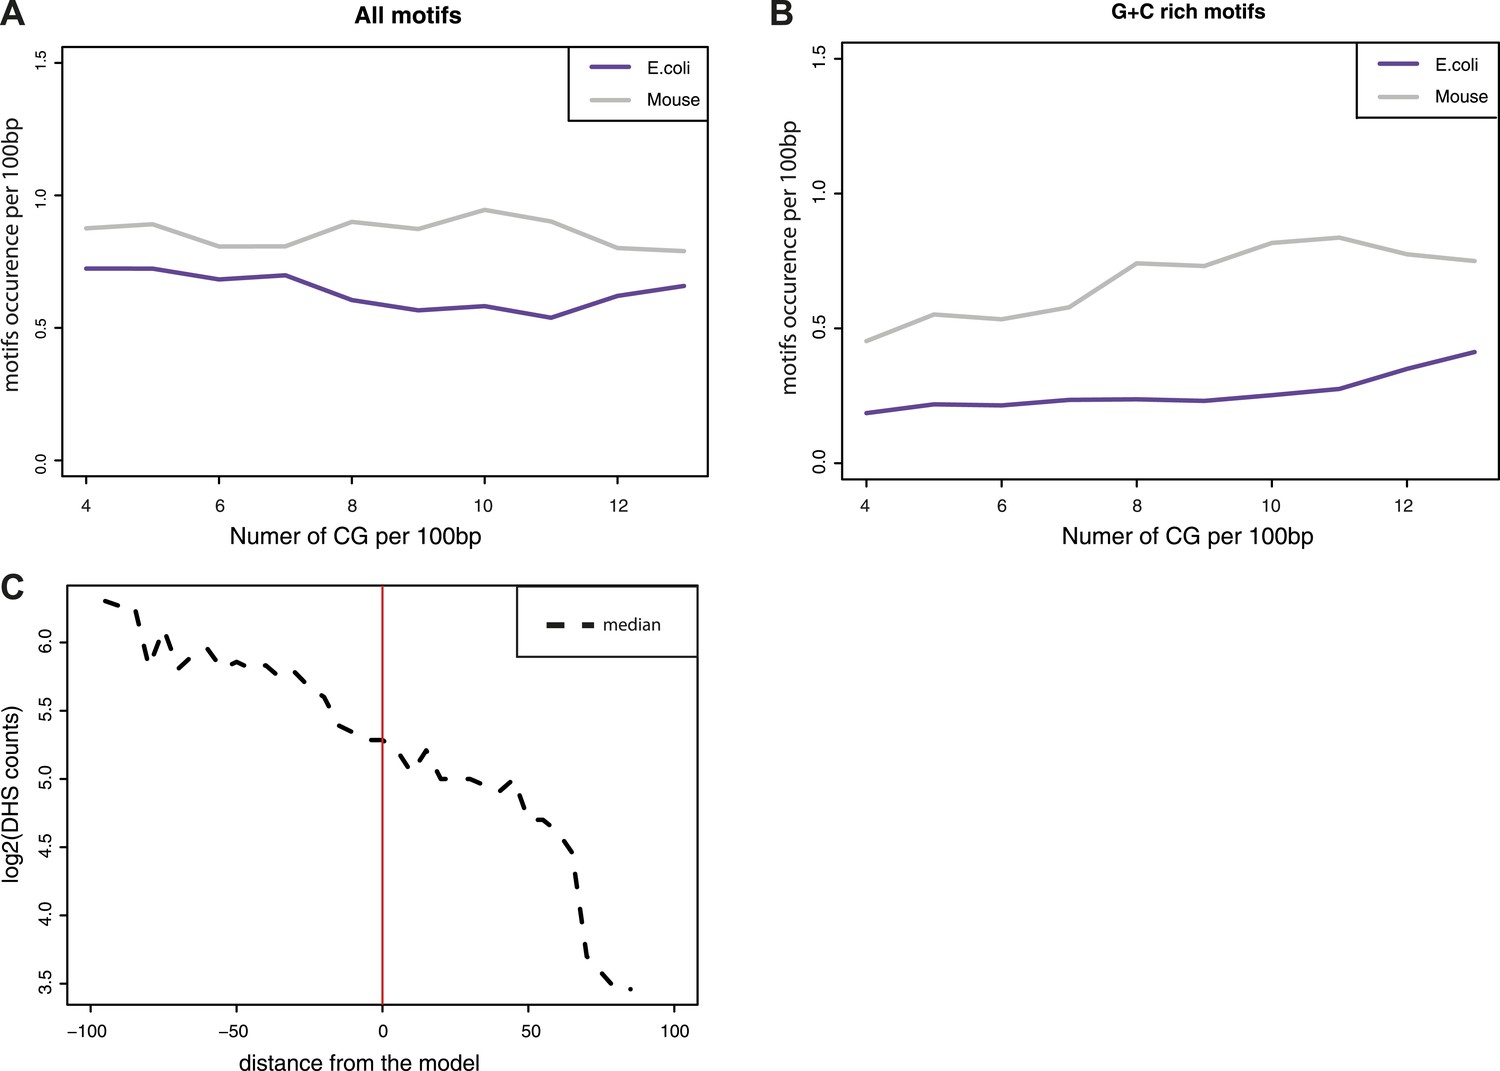
Estimation of the influence of transcription factor motifs within the tested sequences.
(A–B) Estimation of the abundance of transcription factor binding motifs in mouse (grey line) and E.coli (purple lines) sequences used in the comparisons. Depicted are the mean abundance per CG density bin of the total counts of motifs for the fragment of each origin. The motifs counts were calculated separately for all motifs (A) and for GC rich motifs only (B). (C) Comparison of the distance between predicted and observed values and the presence of DNase Hypersensitivity within fragments. The difference between the observed methylation levels and the CG density based prediction were calculated and used to bin fragments. The median of DHS signal for each bin was computed and plotted as a dotted line showing that fragments that negatively deviate from the prediction have DHS signal that could explain their unmethylated state.
Figure 4 with 1 supplement
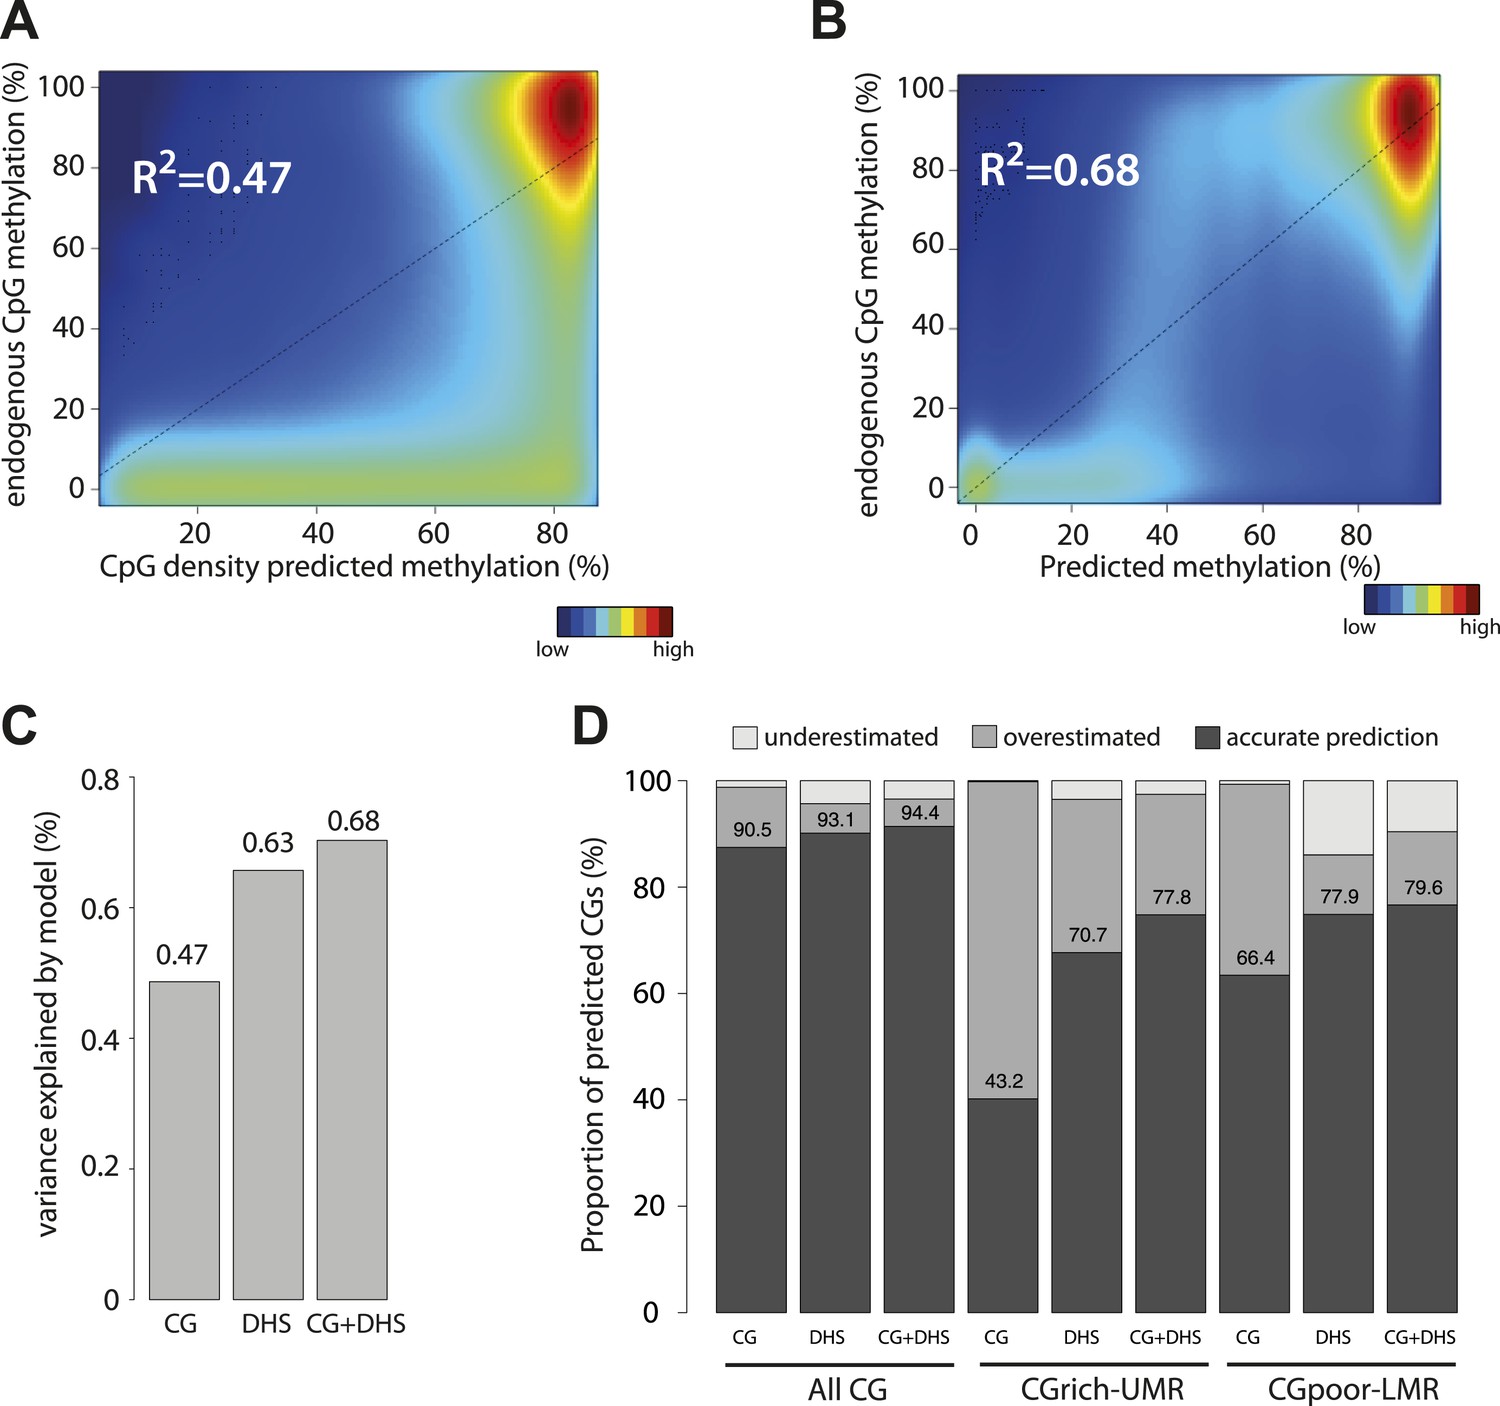
Genome wide modeling of the methylation levels combining CG density prediction and DNase hypersensitivity data.
(A) Comparison of CG density based prediction and observed methylation levels in mouse ESC throughout the genome. Methylation is predicted using the model derived from the E. coli fragments. CG density is calculated in a 300 bp window around each CG in the mouse genome. The predicted value is compared to measured methylation at the single CG level in mESC. The reference line is shown in black. (B) Similar comparison of measured methylation at the single CG level genome wide in mESC but using a prediction model combining CG density and DHS. (C) Barplot comparing the explained variance by the CG only based model (CG) and the model using DHS data either alone (DHS) or in combination with CG density prediction (CG + DHS). (D) Proportion of CGs predicted accurately for each model relative to their genomic context. The prediction of each model was compared to methylation as measured by bisulfite sequencing and prediction accuracy was quantified (with a precision of 20% methylation). The barplot illustrates the improvement gained by each variable used in the modeling. It shows that the combination of CG density and DHS is particularly important to accurately predict methylation at CG rich regions.
Figure 4—figure supplement 1
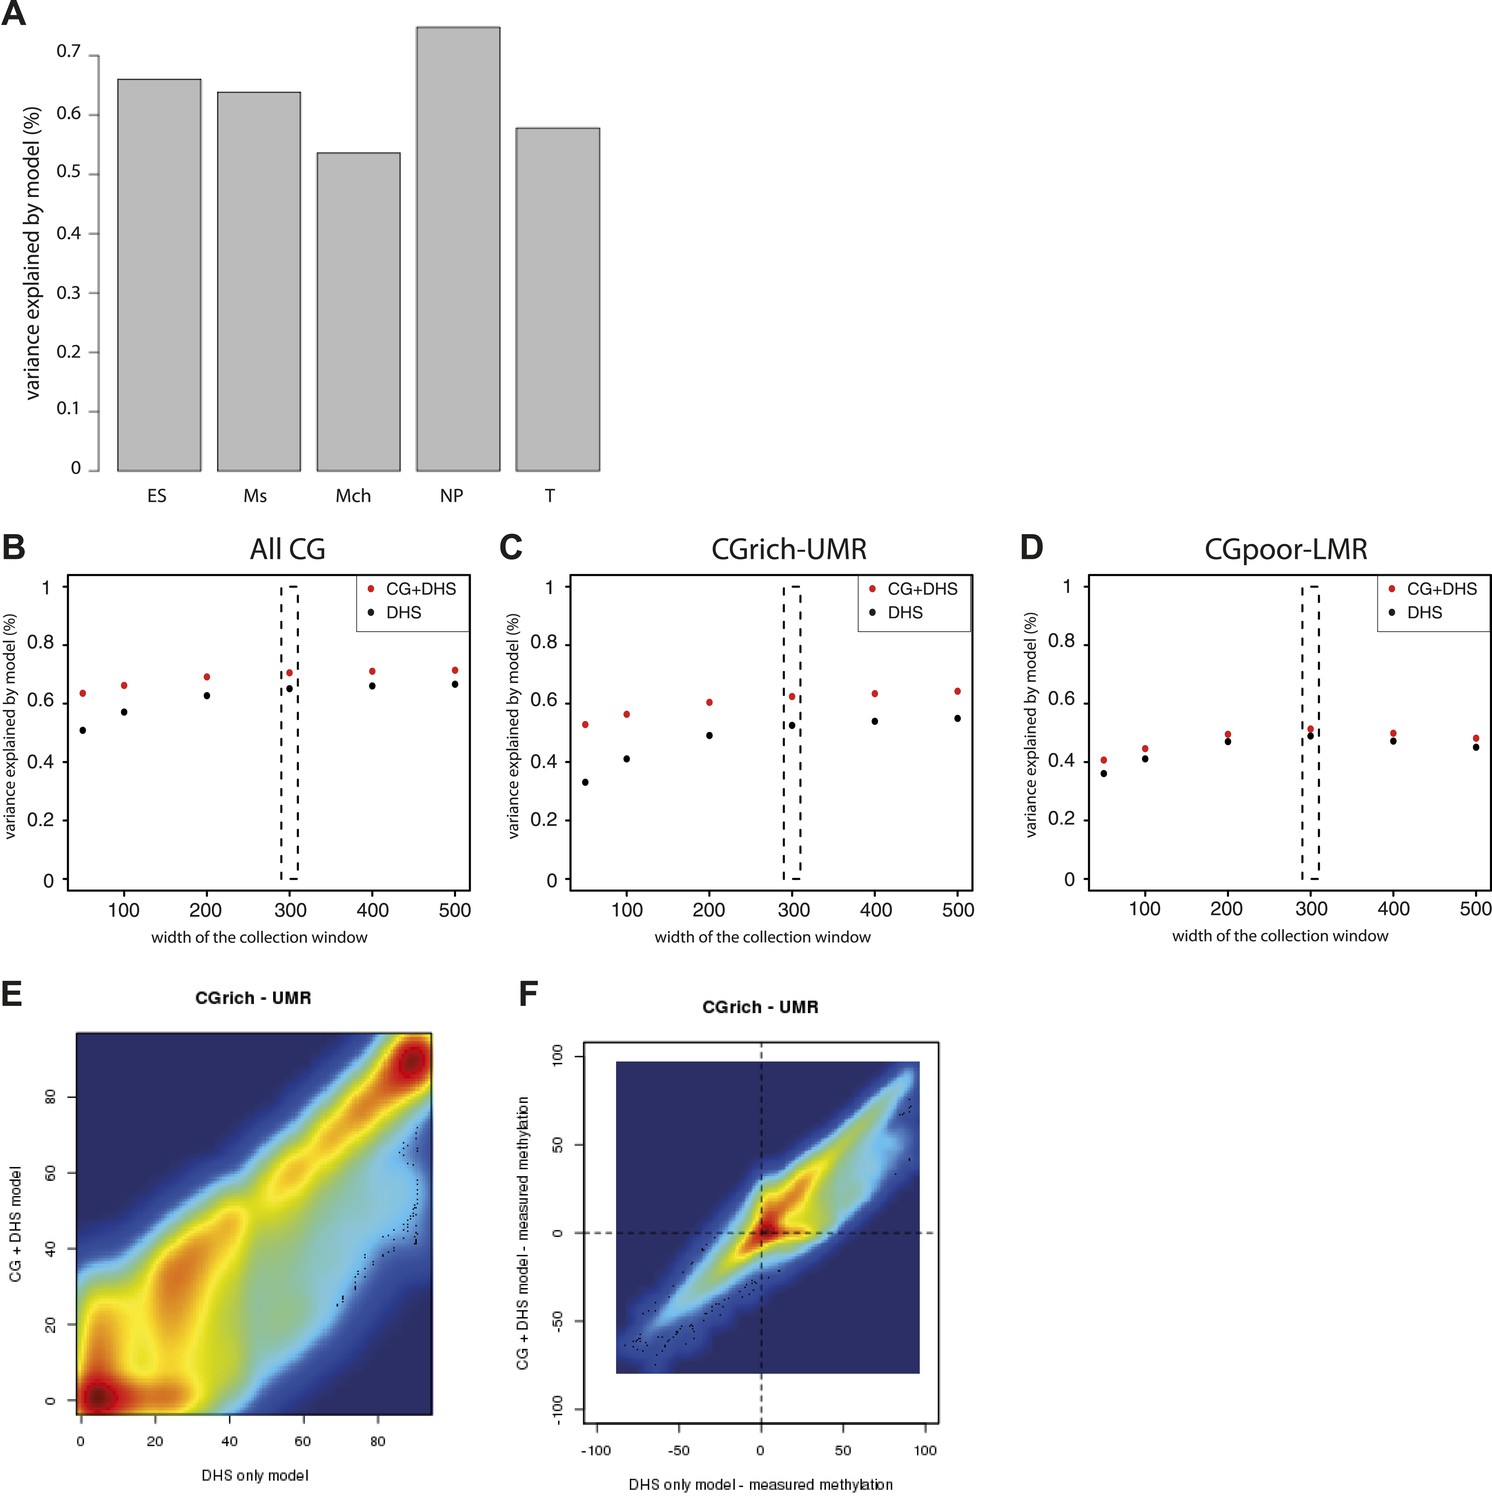
Performance evaluation of the derived models.
(A) Pearson correlation (R) between the complete model prediction and the measured methylation in human stem cells and four in vitro derived cell types (Mch-Mesenchymal; Ms-Mesoderm; NP-Neuronal Progenitor; T-Trophoblastic). (B) Quantification of the proportion of CGs predicted accurately for each model depending on their genomic context. The prediction of each model was compared to methylation as measured by bisulfite sequencing and prediction accuracy was quantified (with a precision of 20% methylation). The barplot illustrates the improvement gained by each variable used in the modeling. It shows that the combination of CG density and DHS is particularly important to accurately predict methylation at CG rich regions. (C–E) Influence of the size of collecting window for quantifying DHS signal on modeling performance. The coefficient of determination R2 for the DHS only (DHS) or the combined model (CG+DHS) was calculated as a function of the collection window in the DHS dataset. The analysis was performed for all CGs in the genome or for CGs within particular genomic regions. This shows that 300bp is the optimal collection window for DHS regardless of the type of region considered. (F) Comparison of the prediction by the DHS only (DHS) and the combined model (CG + DHS) within CG rich unmethylated regions (UMR). For a significant fraction of the CGs the predicted methylation is lower in for the complete model. (G) Comparison of the prediction accuracy for the two models. The delta between predicted and measured value is calculated for both model and plotted against each other. This reveals that the DHS only model overestimates DNA methylation for a significant part of the CGs within UMRs that are more accurately predicted by the combined model.
Figure 5 with 3 supplements
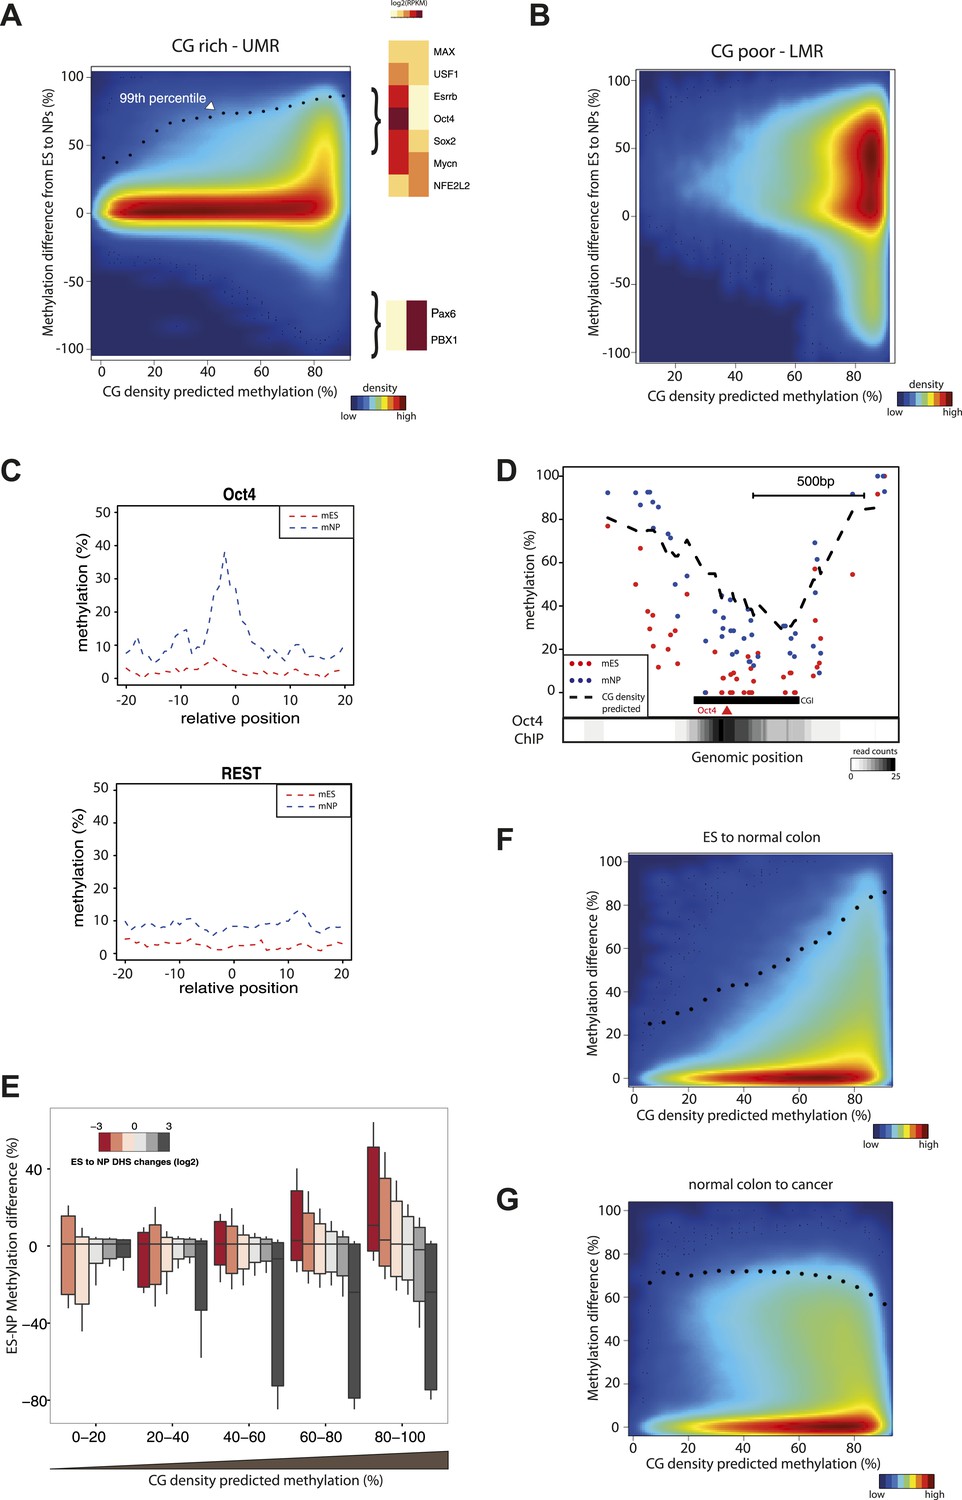
CG concentration restricts the amplitude of methylation changes during cellular differentiation.
(A–B) Methylation gain during differentiation reaches a maximum that can be predicted by the local CG density of the region. CG density based prediction is plotted against the methylation difference between stem cells (ES) and neuronal progenitors (NP) for CGs located within stem cells (A) CG rich unmethylated regions (UMRs) or (B) low methylated regions (LMRs). Black dots represent the 99th percentile of the changes observed, as a proxy of the maximal amplitude of changes observed at a given CG density. TF motif enrichments were calculated around the most changing CGs and heatmaps depicting the expression changes for the top enriched motifs were plotted. This reveals enrichment for pluripotency factor motifs next to the hypermethylated CGs and of neuronal specific factors in the surroundings of hypomethyayed CGs. (C) A gain of methylation is observed at Oct4 binding sites within CG rich regions during differentiation. Composite plot depicting the average DNA methylation around Oct4 (upper panel) and REST (lower panel) binding sites at CG rich-UMRs. The red doted line represent methylation averages in embryonic stem cells (ES). The blue doted line represent methylation averages in neuronal progenitors (NP), where Oct4 is not expressed, while REST is expressed in both cell types. (D) Single locus example of a CG rich region that changes methylation status during differentiation, and which contains a binding site for Oct4. Lower density track represent Oct4 binding as measured by ChIP-seq (E) Methylation changes coincide with changes in DHS but the amplitude of change is limited by CG density. CGs present at UMRs were classified based on the CG density of their surroundings (x-axis) and the amplitude of DHS changes from ES to NP (box plot color correspond to log2(delta DHS)). The distribution of methylation changes (y-axes) is depicted by a box plot for each category (methylation difference %). The figure illustrates that DHS changes correlate with methylation changes, this correlation is lost at very CG rich stretches. (F–G) Cancer related hypermethylation is not restricted by CG density. CG density based prediction is plotted against methylation differences between (F) hES cells and normal colon, (G) normal colon and cancer colon for CGs located within hES CG rich unmethylated regions. Black dots represent the 99th percentile of the changes observed.
Figure 5—figure supplement 1
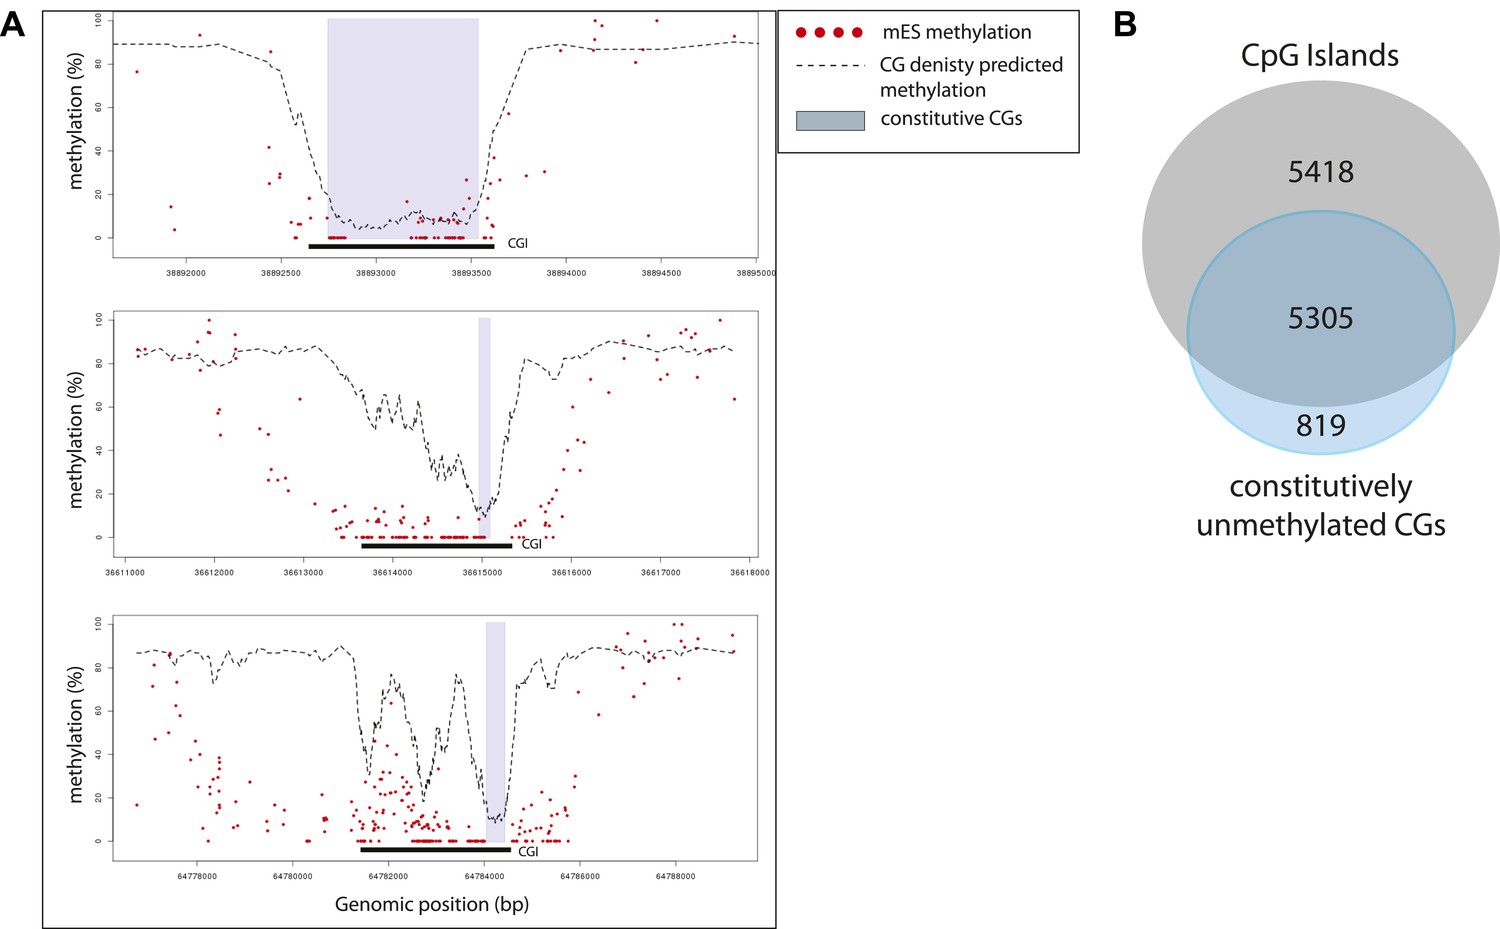
Characterization of the sub-regions within CpG islands that are independent from transcription factors for being unmethylated.
(A) Single locus examples of constitutively unmethylated regions (highlighted by blue boxes). Regions were defined as stretches of successive CGs with low predicted score based on their CG density (<20%). Shown are single CG methylation levels in mESC (red dots) and the predicted methylation based on CG density only (dotted line). The examples illustrate the diversity of distribution of those regions in the context of CGI definition, illustrating the heterogeneity of methylation regulation within islands. (B) Distribution of the constitutively unmethylated regions relative to CpG islands (CGI from UCSC). While the vast majority of the constitutively unmethylated regions are contained within islands, less than 50% of CGI contain such a constitutive CGs.
Figure 5—figure supplement 2
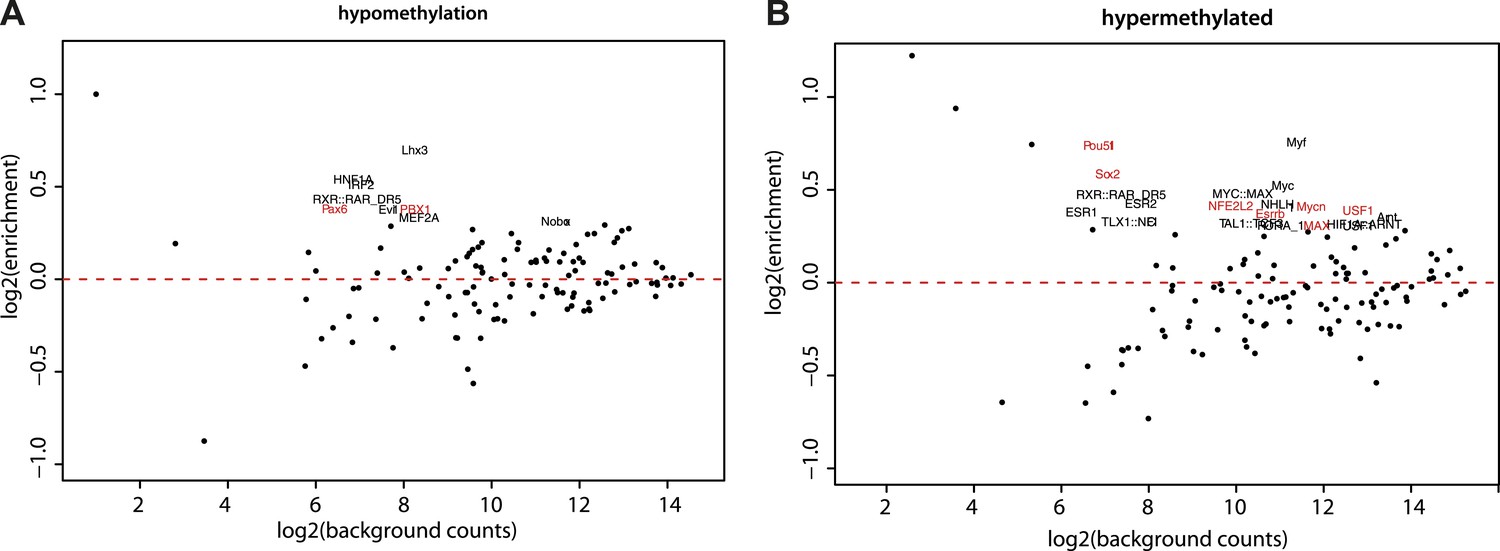
Motif enrichment analysis at differentially methylated regions within CpG islands.
(A–B) Motif MA plots representing the counts for known TF motifs in the surroundings (300bp) of hypomethylated (A) or hypermethylated (B) CGs versus counts in CGs not changing methylation. For each set, control sequences with similar CG density distribution were used. The name of enriched TF matrices were depicted and matrices for which expression data could be mapped were depicted in red and represented in Figure 5A.
Figure 5—figure supplement 3
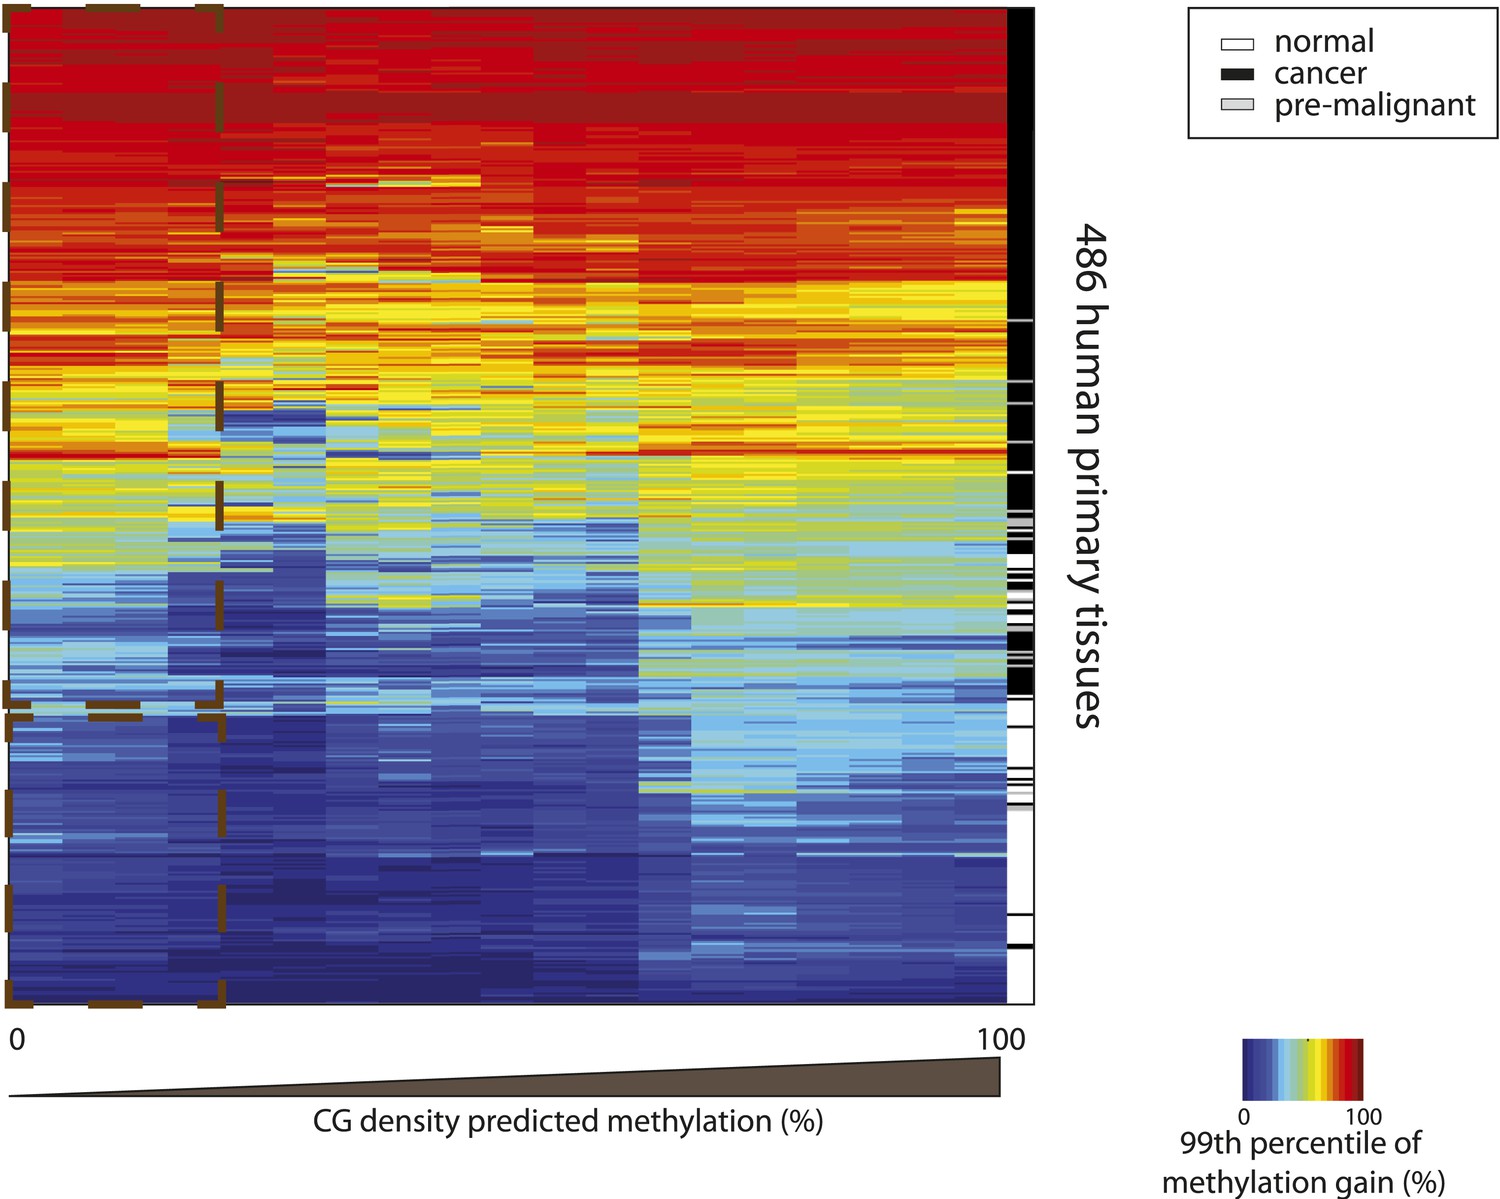
Hypermethylation at CGs with low predicted methylation is a widespread and specific mark of cancer.
Heatmap depicting the 99th percentile of methylation gain in each bin of CG density based predicted methylation for 486 human primary tissues (161 normal and 326 cancer samples) (Fernandez et al. 2012). The heatmap was subjected to hierarchical clustering, which accurately separates between normal (white) and cancer samples (black and grey) (side colorbar).
Additional files
-
Supplementary file 1
List of external datasets used in this study.
- https://doi.org/10.7554/eLife.04094.017
Download links
A two-part list of links to download the article, or parts of the article, in various formats.
Downloads (link to download the article as PDF)
Open citations (links to open the citations from this article in various online reference manager services)
Cite this article (links to download the citations from this article in formats compatible with various reference manager tools)
High-throughput engineering of a mammalian genome reveals building principles of methylation states at CG rich regions
eLife 3:e04094.
https://doi.org/10.7554/eLife.04094


