Evolved differences in larval social behavior mediated by novel pheromones
- Janelia Research Campus, Howard Hughes Medical Institute, United States
- ETH Zürich, Switzerland
- USDA-ARS, United States
Figures
Figure 1 with 3 supplements
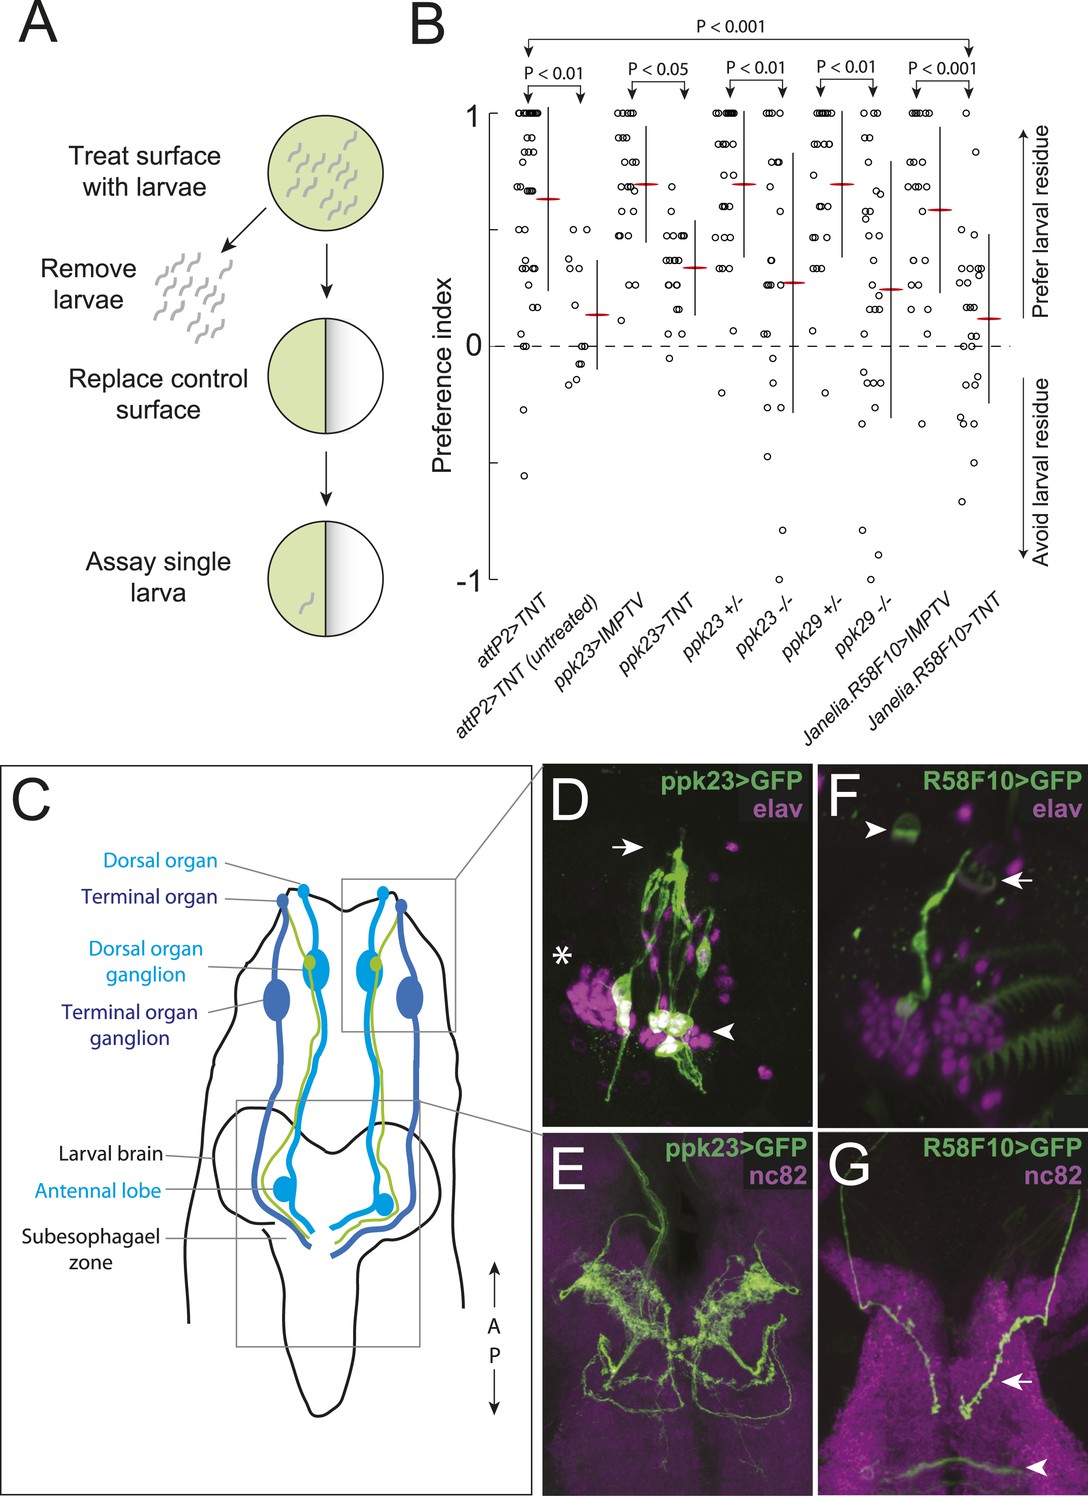
A single class of chemosensory receptors is required for larvae to respond to attractive larval-derived cues.
(A) An assay to quantify larval attraction to substrate-born attractive pheromone. A high density of wild-type early third instar larvae were allowed to crawl over the surface of an agarose plate for 20 min. The larvae and half of the treated agarose (green) were removed and replaced with fresh control agarose (white). The fraction of time spent on each surface by single larvae was used to calculate a preference index score (Preference Index = (time on test substrate—time on control substrate)/total time). (B) A behavioral neuronal-silencing screen to identify the receptor neurons required for response to larval attractive pheromones. Data points represent the preference index scores of individual larvae in response to the larval cue in this assay. In this and subsequent figures, horizontal small lines represent means and vertical lines represent ± one standard deviation. Genotypes displayed significant heterogeneity (ANOVA, F9,255 = 9.75, p < 0.0001). Control larvae carrying the empty attP2 landing site with no GAL4 insertion and a copy of UAS-tetanus toxin (UAS-TNT) were attracted to the larval cue, but not to untreated substrate. Silencing neurons expressing ppk23 with TNT blocked the response to the cue. Driving an inactive variant of tetanus toxin, IMPTV, with ppk23-GAL4 did not block attraction. Mutations affecting ppk23 or ppk29 also blocked attraction. Silencing neurons with Janelia enhancer fragment R58F10-GAL4 blocked the response to the cue. Driving IMPTV with R58F10-GAL4 did not block attraction. In this and subsequent figures, statistical comparisons between treatments were performed using the Tukey honest significant difference test and are reported for comparisons significant at p < 0.05 or below. (C) A schematic of neurons comprising the main external sensory organs in the larval chemosensory system. Receptor neurons in the terminal organ ganglion (TOG; dark blue) send sensory terminals into the terminal organ (TO), and synaptic terminals into the subesophagael zone (SEZ). Receptor neurons in the dorsal organ ganglion (DOG; light blue) send sensory terminals mainly into the dorsal organ (DO), and synaptic terminals into both the antennal lobe and the SEZ. Three neurons (green) in the DOG send sensory terminals into the dorsolateral papillum of the TO, and project to the SEZ. (D) ppk23 expressing neurons innervating the terminal organ (arrow), marked by membrane-targeted green fluorescent protein, mCD8:GFP (green, anti-GFP). Neuron cell bodies in the dorsal organ ganglion and terminal organ ganglion are labeled with anti-elaV (magenta). The TOG and DOG are marked by an arrowhead and asterisk, respectively. (E) The axon terminals of ppk23 expressing neurons in the larval brain (green, anti-GFP). Neuropil is marked by antibodies against the perisynaptic marker bruchpilot (nc82, magenta). (F) R58F10 sensory neurons innervate the terminal organ (arrow). R58F10 marked by membrane-targeted green fluorescent protein, mCD8:GFP (anti-GFP, green; elaV, magenta). The dorsal organ is indicated with an arrowhead. (G) R58F10 neuron synaptic terminals project into the suboesophageal zone (arrow). Secondary lineage neurons in the ventral nerve cord are also marked by R58F10 (arrowhead) (anti-GFP, green; nc82, magenta).
Figure 1—figure supplement 1
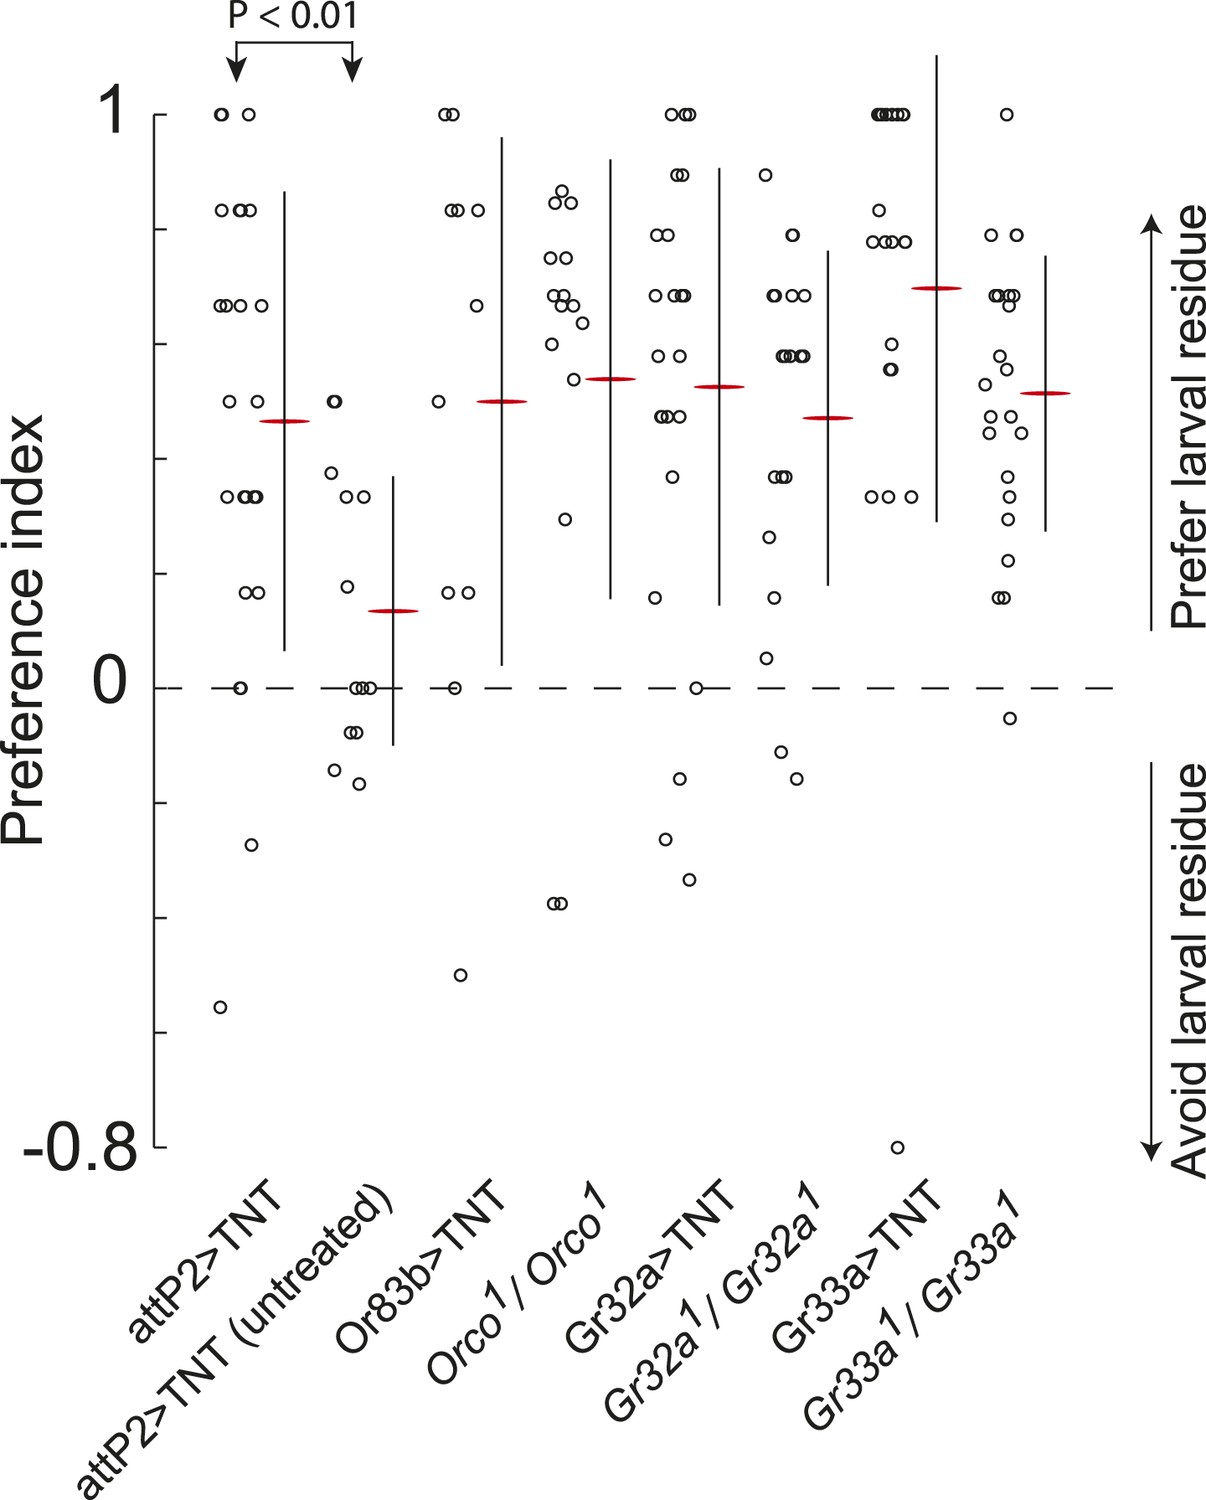
Sex-pheromone receptor genes with known larval expression are not required to respond to attractive larval pheromones.
Data points are the preference index scores of individual larvae in response to larval residue in the assay shown in Figure 1A. Lines represent means plus or minus one standard deviation for each dataset. Control larvae carrying the empty attP2 landing site with no GAL4 insertion and a copy of UAS-TNT were attracted to the larval cue, but not to untreated substrate. Blocking all olfactory neurons using Or83b-GAL4, or gustatory receptors implicated in pheromone responses with Gr32a-GAL4 and Gr33a-GAL4, or mutations affecting these genes, did not block larval attraction to the cue.
Figure 1—figure supplement 2
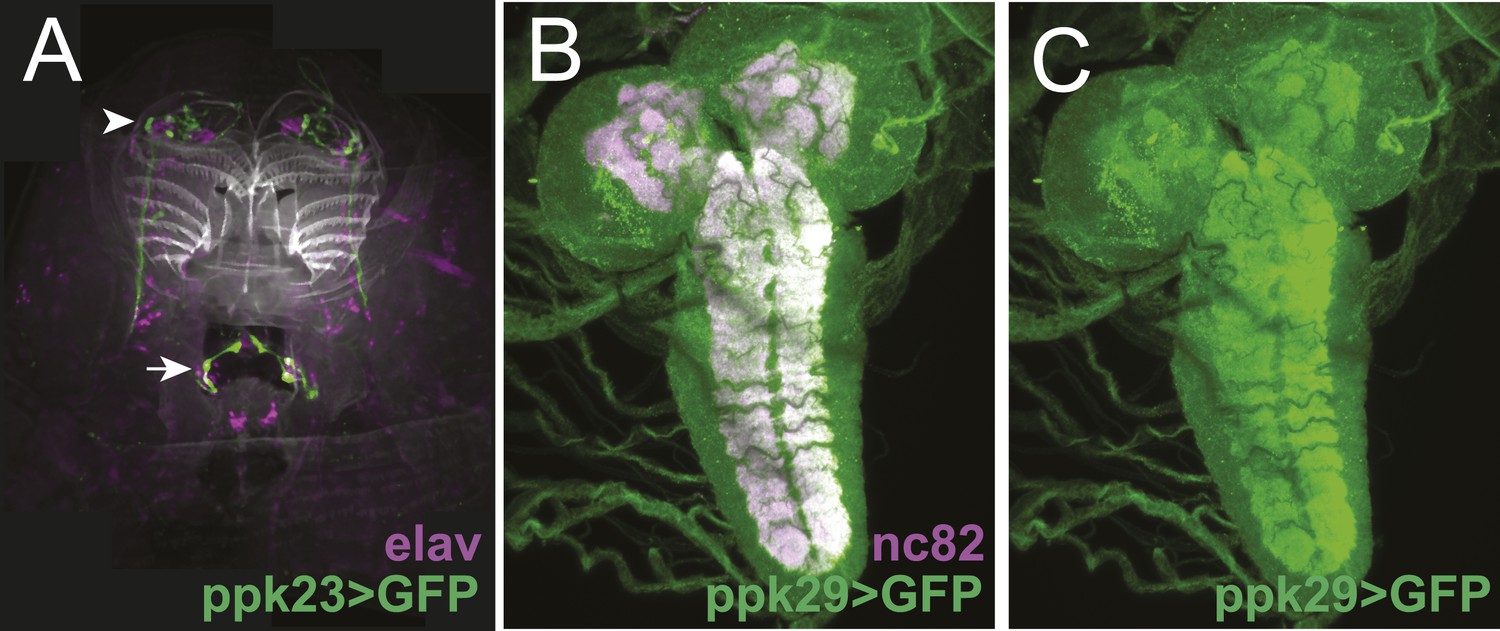
The expression patterns of ppk23-GAL4 and ppk29-GAL4 in larval sensory organs and the central nervous system.
(A) ppk23-GAL4 driving the expression of mCD8:GFP (green) in the anterior sensory organs of third instar larvae stained for neuronal nuclei (anti-elaV; magenta) and DAPI (white). ppk23-GAL4 is expressed in cells innervating the terminal organ (arrowhead), and an internal sensory neuron in the esophagus (arrow). (B and C) ppk29-GAL4 driving the expression of mCD8:GFP (green) in the third instar larval brain stained for neuropil (anti-nc82, magenta). ppk29-GAL4 is expressed widely throughout the brain (Liu et al., 2012; Thistle et al., 2012).
Figure 1—figure supplement 3
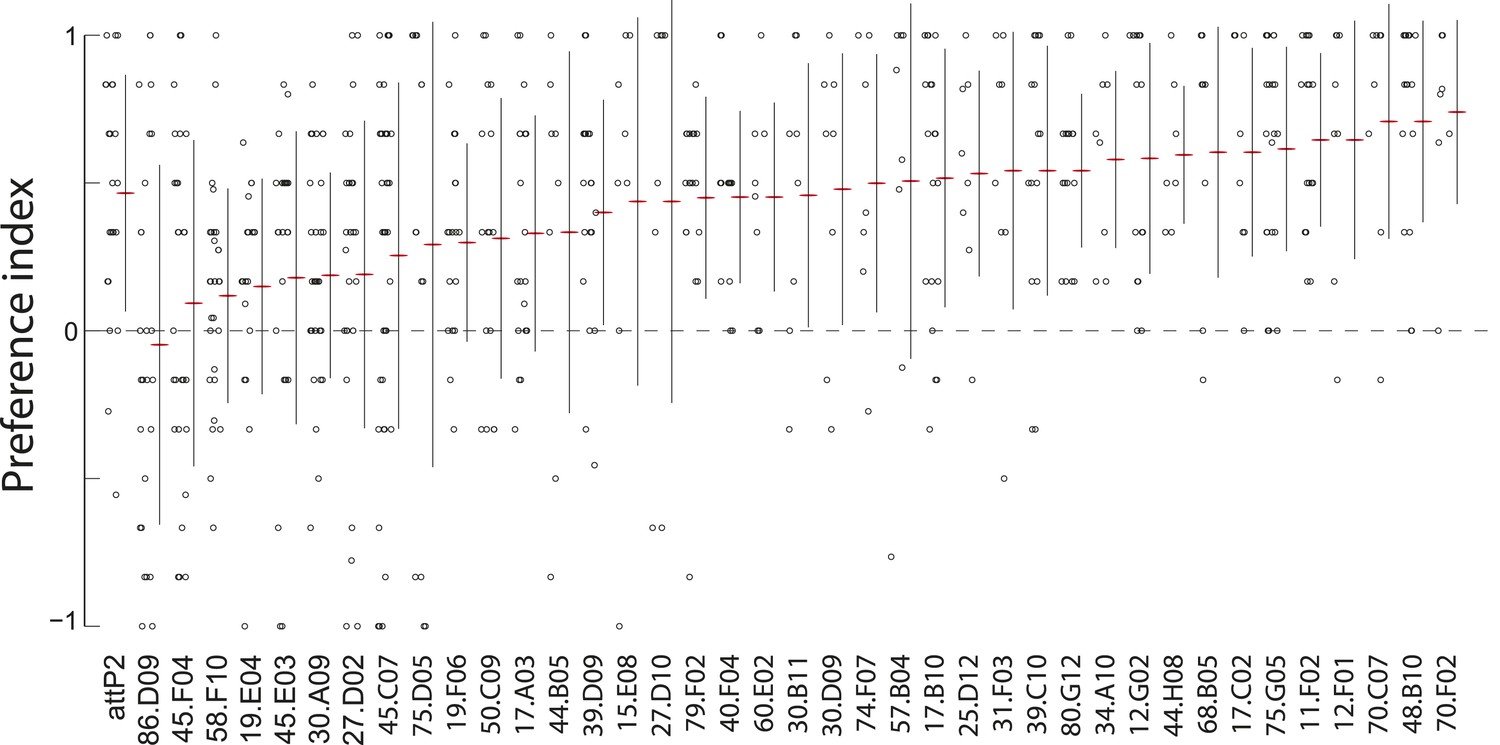
A synaptic silencing screen to identify sensory neurons required for attractive pheromone-driven behavior.
We silenced subsets of candidate sensory neurons with tetanus toxin, using a collection of driver lines from the Janelia enhancer GAL4 collection that drive expression in anterior sensory neurons. Data points represent the preference index scores of individual larvae for the larval cue in the assay shown in Figure 1A. Means (horizontal red lines) ± one standard deviation (vertical black lines) are plotted beside the data.
Figure 2 with 3 supplements
(Z)-5-tetradecenoic acid and (Z)-7-tetradecenoic acid are attractive larval pheromones.
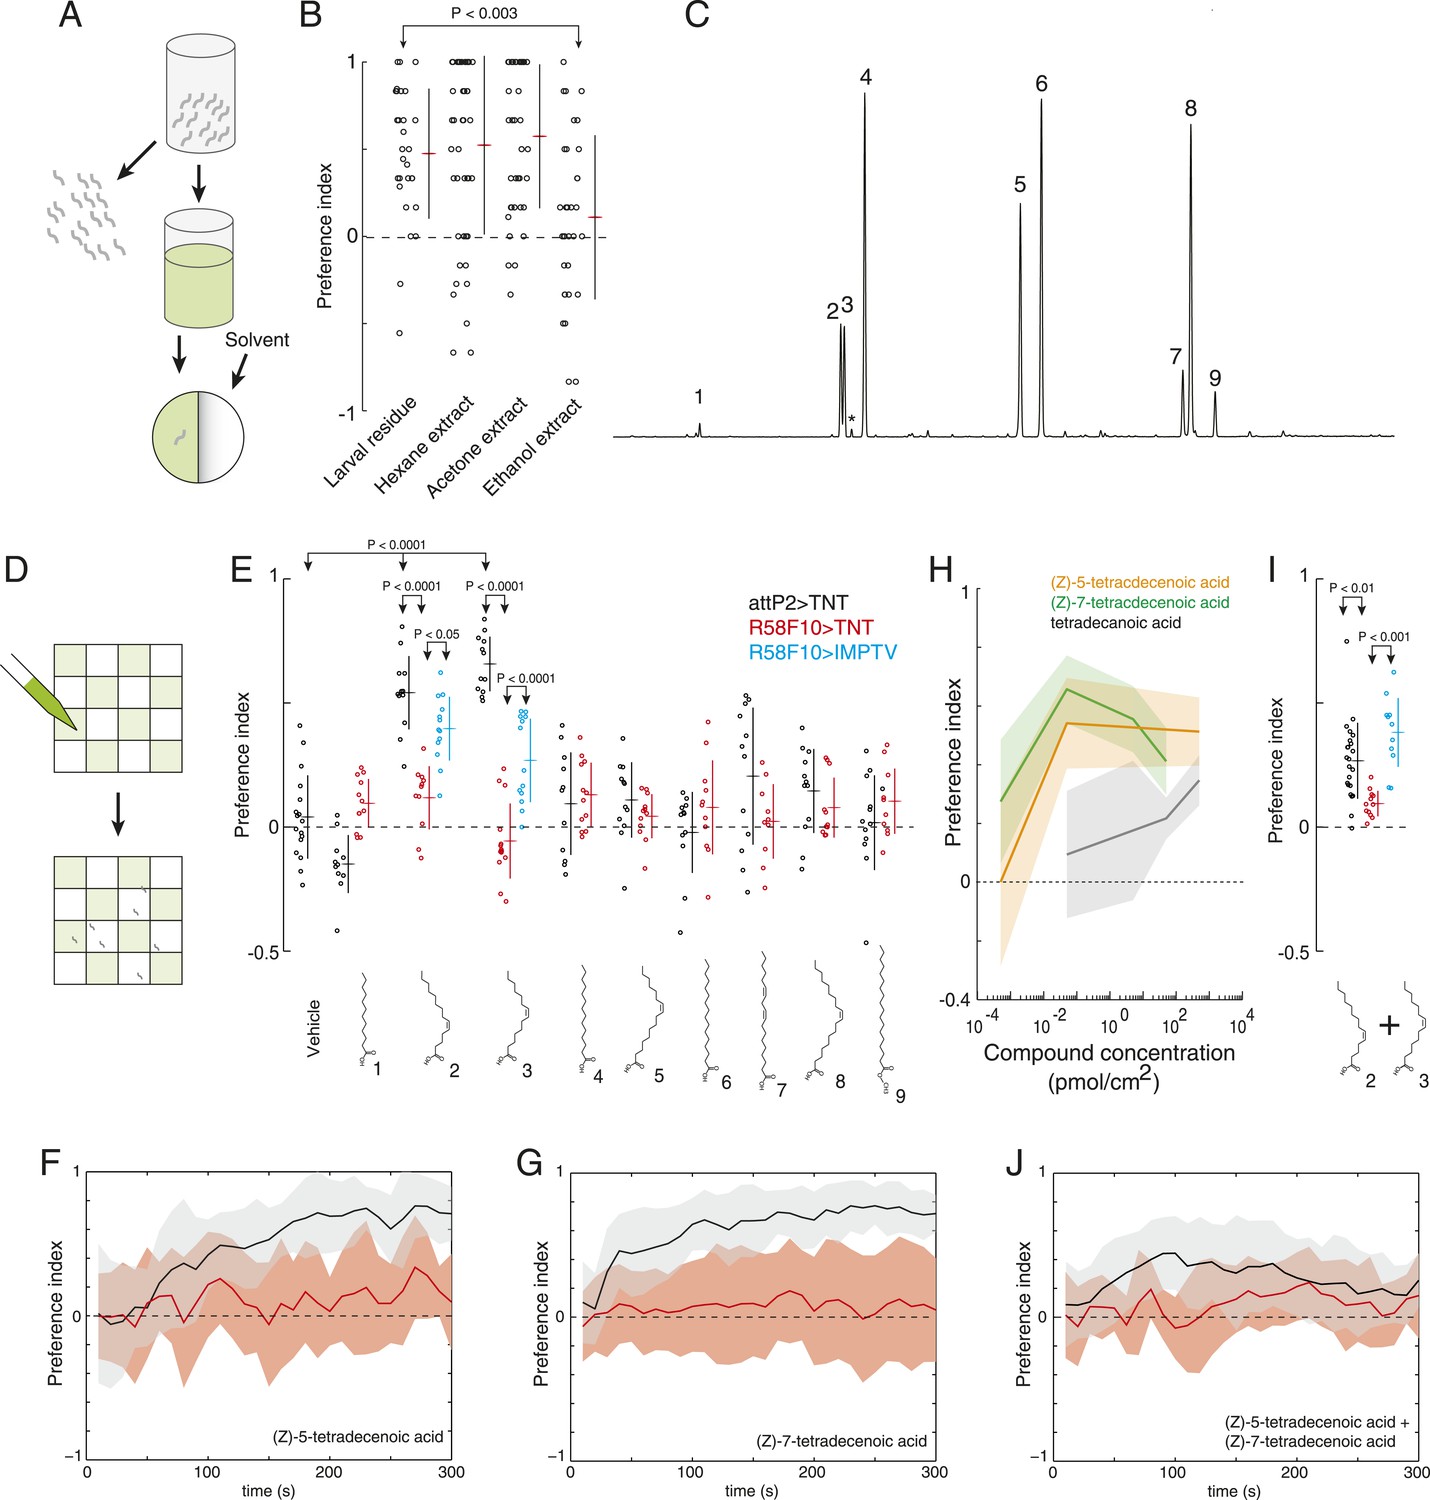
(A) A method for extracting the attractive cue deposited on substrate. Larvae were allowed to crawl over the inner surface of a glass vial for 30 min. Larvae were removed and replaced by solvent. Treated solvent was deposited on one side of an agarose plate, and untreated solvent on the other. (B) The attraction of wild-type D. melanogaster larvae to extracts from larval-treated glass using hexane, acetone, or ethanol as solvent compared to control solvent. Data points are the preference index scores of individual wild-type larvae. Hexane and acetone extracts elicited similar levels of attraction as plates treated directly with larvae. Ethanol extracts did not. (C) Chromatograph from GC analysis of D. melanogaster larval hexane extracts. The major components are saturated fatty acids, fatty acid monoenes and dienes. Each peak is labeled as follows: (1) dodecanoic acid, (2) (Z)-5-tetradecenoic acid, (3) (Z)-7-tetradecenoic acid, (4) tetradecanoic acid, (5) (Z)-9-hexadecenoic acid, (6) hexadecanoic acid, (7) (Z,Z)-9,12-octadecadienoic acid, (8) (Z)-9-octadecenoic acid, and (9) octadecanoic acid, methyl ester. Small amounts of (Z)-9-tetradecenoic acid (*) were also detected between peaks (3) and (4). (D) Schematic of a multiple-larva assay to measure the attractive activity of individual compounds identified from larval residue. Test surfaces were coated in a checkerboard pattern with candidate molecules (green) or vehicle solvent (white). (E) A behavioral screen measuring the attraction of control (attP2;UAS-TNT, black), R58F10-GAL4;UAS-TNT (red), and R58F10-GAL4; UAS-IMPTV (blue) larvae to individual compounds found in the D. melanogaster larval extracts. Data points are the preference index scores of small groups (10-15 individuals) of larvae in response to 50 fmol/cm2 of candidate molecule. Compound treatments (ANOVA; F9,113 = 22.3, p < 0.0001) and genotype by compound interactions (2-way ANOVA; F1,232 = 17.7, p < 0.0001) displayed significant heterogeneity. Larvae were attracted to (Z)-5-tetradecenoic acid and (Z)-7-tetradecenoic acid. Silencing the synaptic activity of the sensory neurons expressing R58F10-GAL4 strongly inhibited the response to these molecules. Attraction was partially restored when driving the inactive TNT gene product, IMPTV. (F) The response of attP2;UAS-TNT (black), and R58F10-GAL4;UAS-TNT (red) larvae to 50 fmol/cm2 (Z)-5-tetradecenoic acid over time. (G) The timecourse of response to 50 fmol/cm2 (Z)-7-tetradecenoic acid. Solid lines represent the mean preference index score at each timepoint. Shaded areas represent ± one standard deviation. (H) Dose response curves of larval preferences to (Z)-5-tetradecenoic acid (orange), (Z)-7-tetradecenoic acid (green), and saturated tetradecanoic acid (grey). Shaded areas represent ± one standard deviation. (I, J) The preference index scores (I) and preference time course (J) of attP2;UAS-TNT (black), R58F10-GAL4;UAS-TNT (red), and R58F10-GAL4; UAS-IMPTV (blue) larvae in response to an equimolar mixture ((25 fmol:25 fmol)/cm2) of (Z)-5-tetradecenoic and (Z)-7-tetradecenoic acids.
Figure 2—figure supplement 1
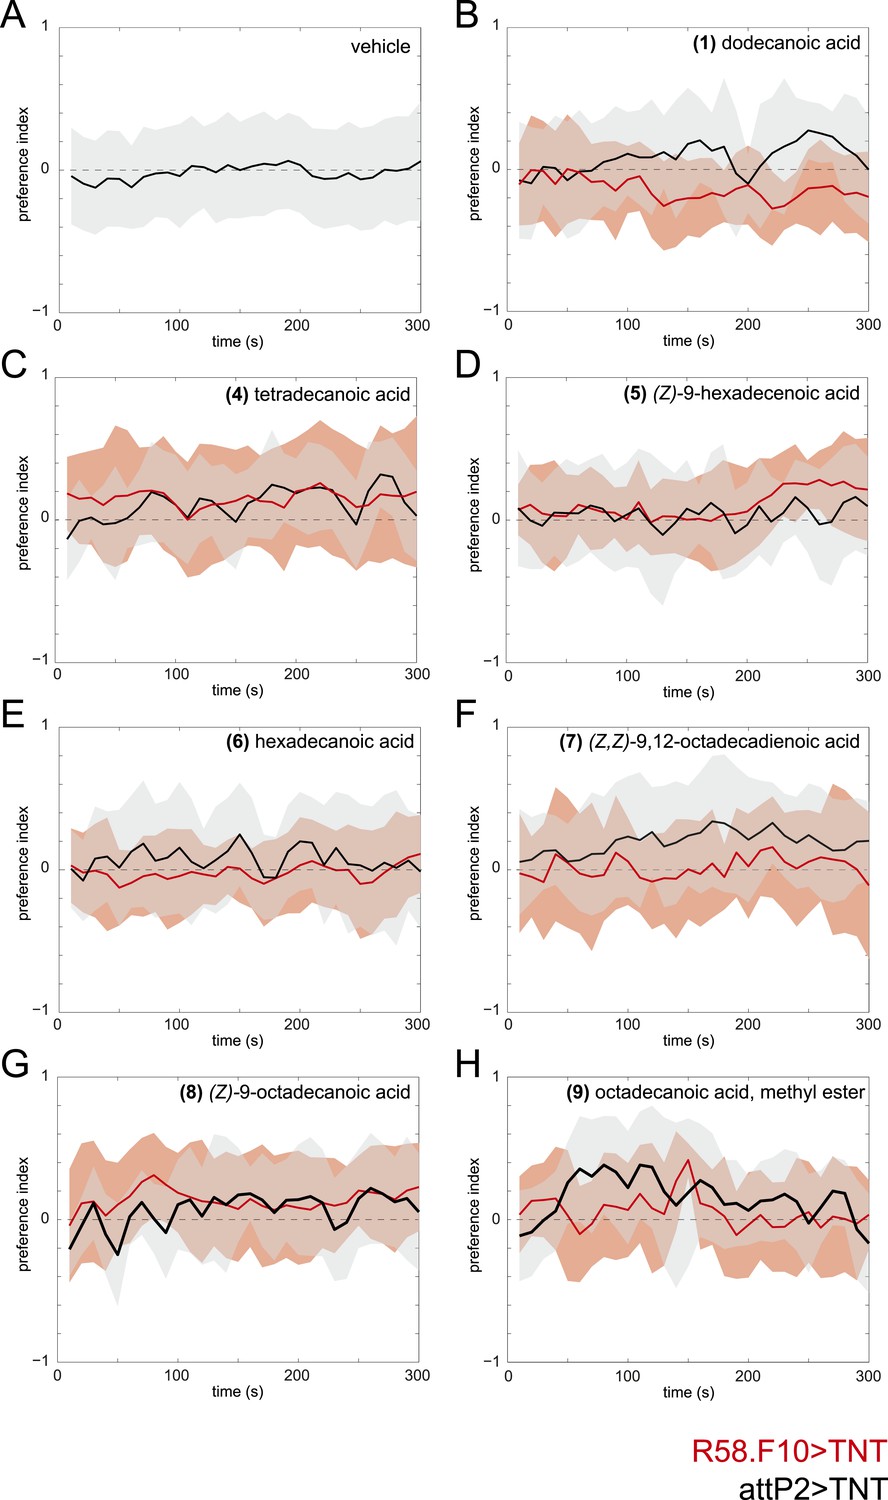
Time courses of the attraction of larvae to individual compounds identified from larval extracts at 50 fmol/cm2.
Time courses of larval preference to (A) vehicle, or to 50 fmol/cm2 (B) dodecanoic acid, (C) tetradecanoic acid, (D) (Z)-9-hexadecanoic acid, (E) hexadecanoic acid, (F) (Z,Z)-9,12-octadecadienoic acid, (G) (Z)-9-octadecanoic acid, (H) octadecanoic acid, methyl ester over a 300 s behavioral assay. Solid lines represent the mean preference index score and shaded areas represent one standard deviation at each time point of the assay period. Control larvae (attP2;UAS-TNT, black) were not attracted to any of the common compounds identified from in larval extracts at this concentration compared to vehicle controls. Silencing the synaptic activity of the sensory neurons expressing R58F10-GAL4 (red) did not reduce the response to these compounds.
Figure 2—figure supplement 2
Chemical analysis of synthetic and natural pheromones.
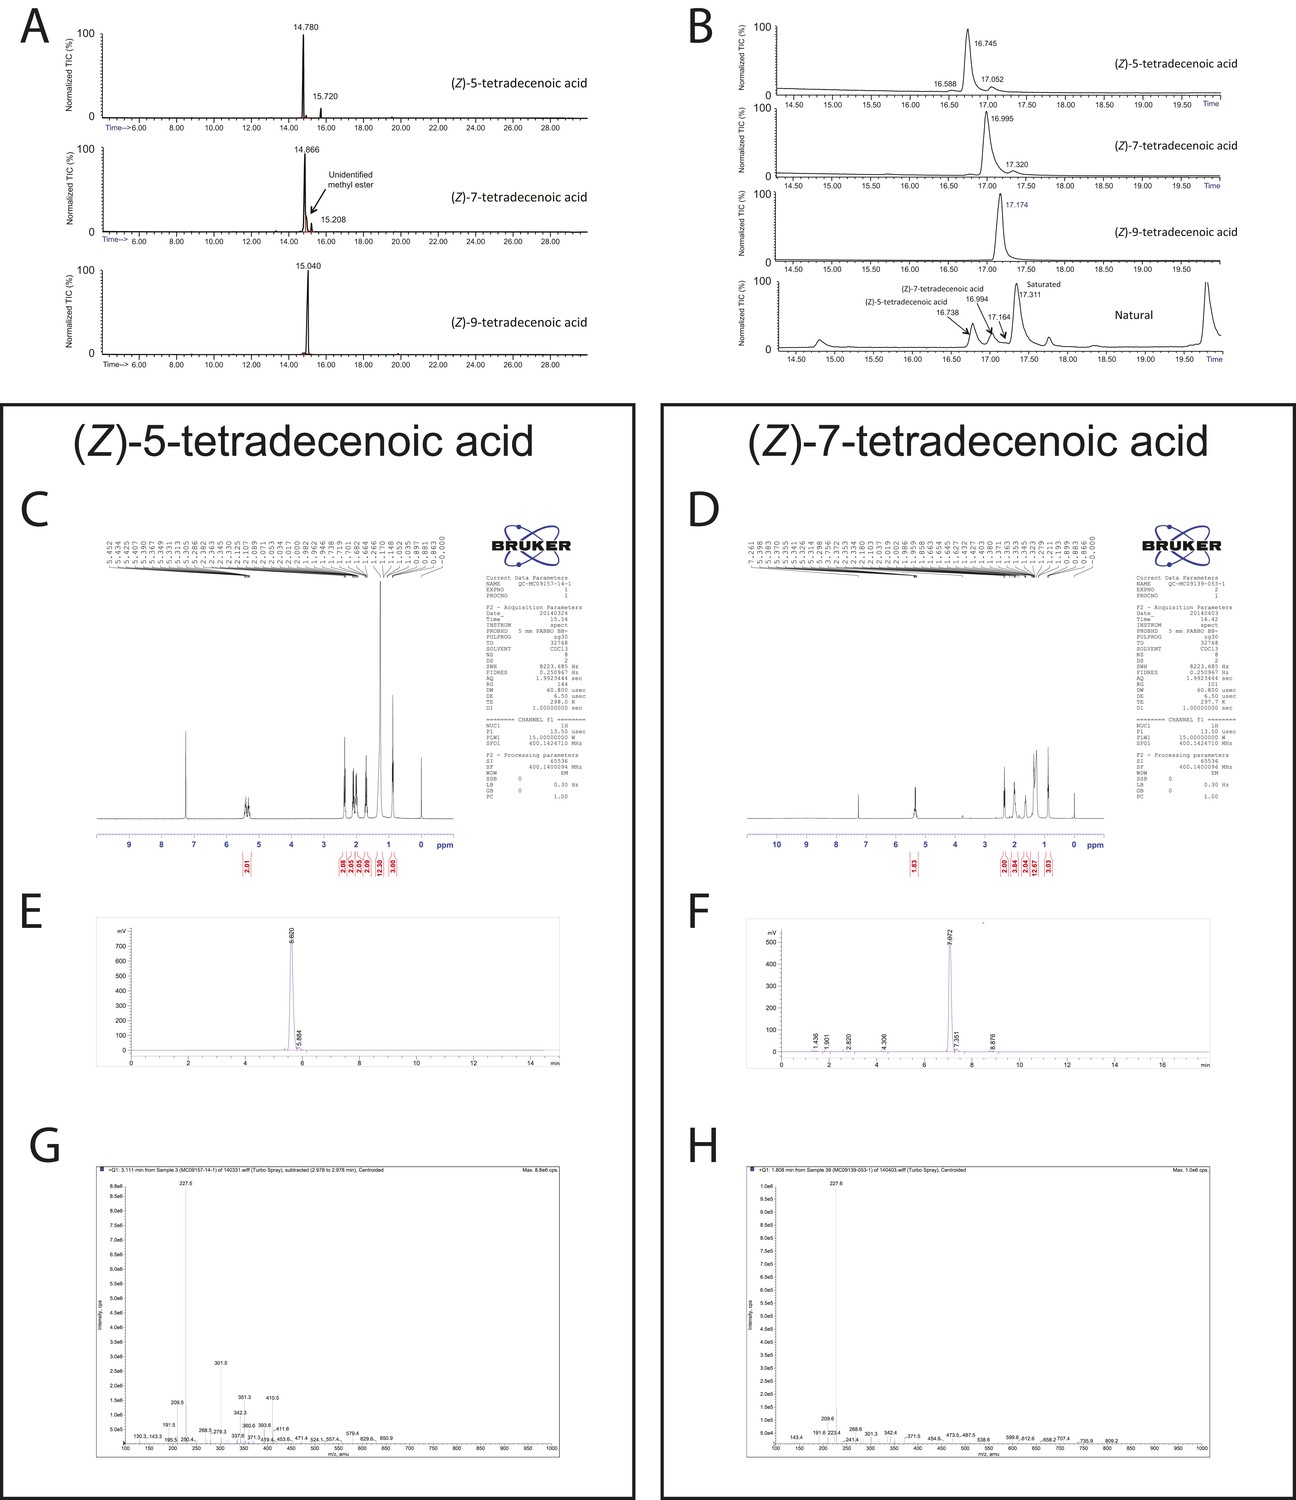
(A) Tandem gas chromatography–mass spectroscopy (GC–MS) traces for synthetic (Z)-5-tetradecenoic acid, (Z)-7-tetradecenoic acid, and (Z)-9-tetradecenoic acid after fatty acid methyl ester (FAME) preparation. (B) Traces from the same samples presented in panel A run under different conditions, along with FAME preparation of natural pheromone extract. The retention times of synthetic (Z)-5-tetradecenoic acid and (Z)-7-tetradecenoic acid match to peaks present in the natural extract. (C, D) 1H NMR spectra of (Z)-5-tetradecenoic acid and (Z)-7-tetradecenoic acid, respectively. (E, F) Tandem liquid chromatography–mass spectroscopy (LC-MS) of purified (Z)-5-tetradecenoic acid and (Z)-7-tetradecenoic acid, as detected by TIC (total ion current, mass spectrometry), respectively. (G, H) m/z composition of the dominant peak in chromatograms (E) and (F) respectively.
Figure 2—figure supplement 3
A behavioral screen measuring the attraction of larvae to individual compounds at 0.5 nmol/cm2.
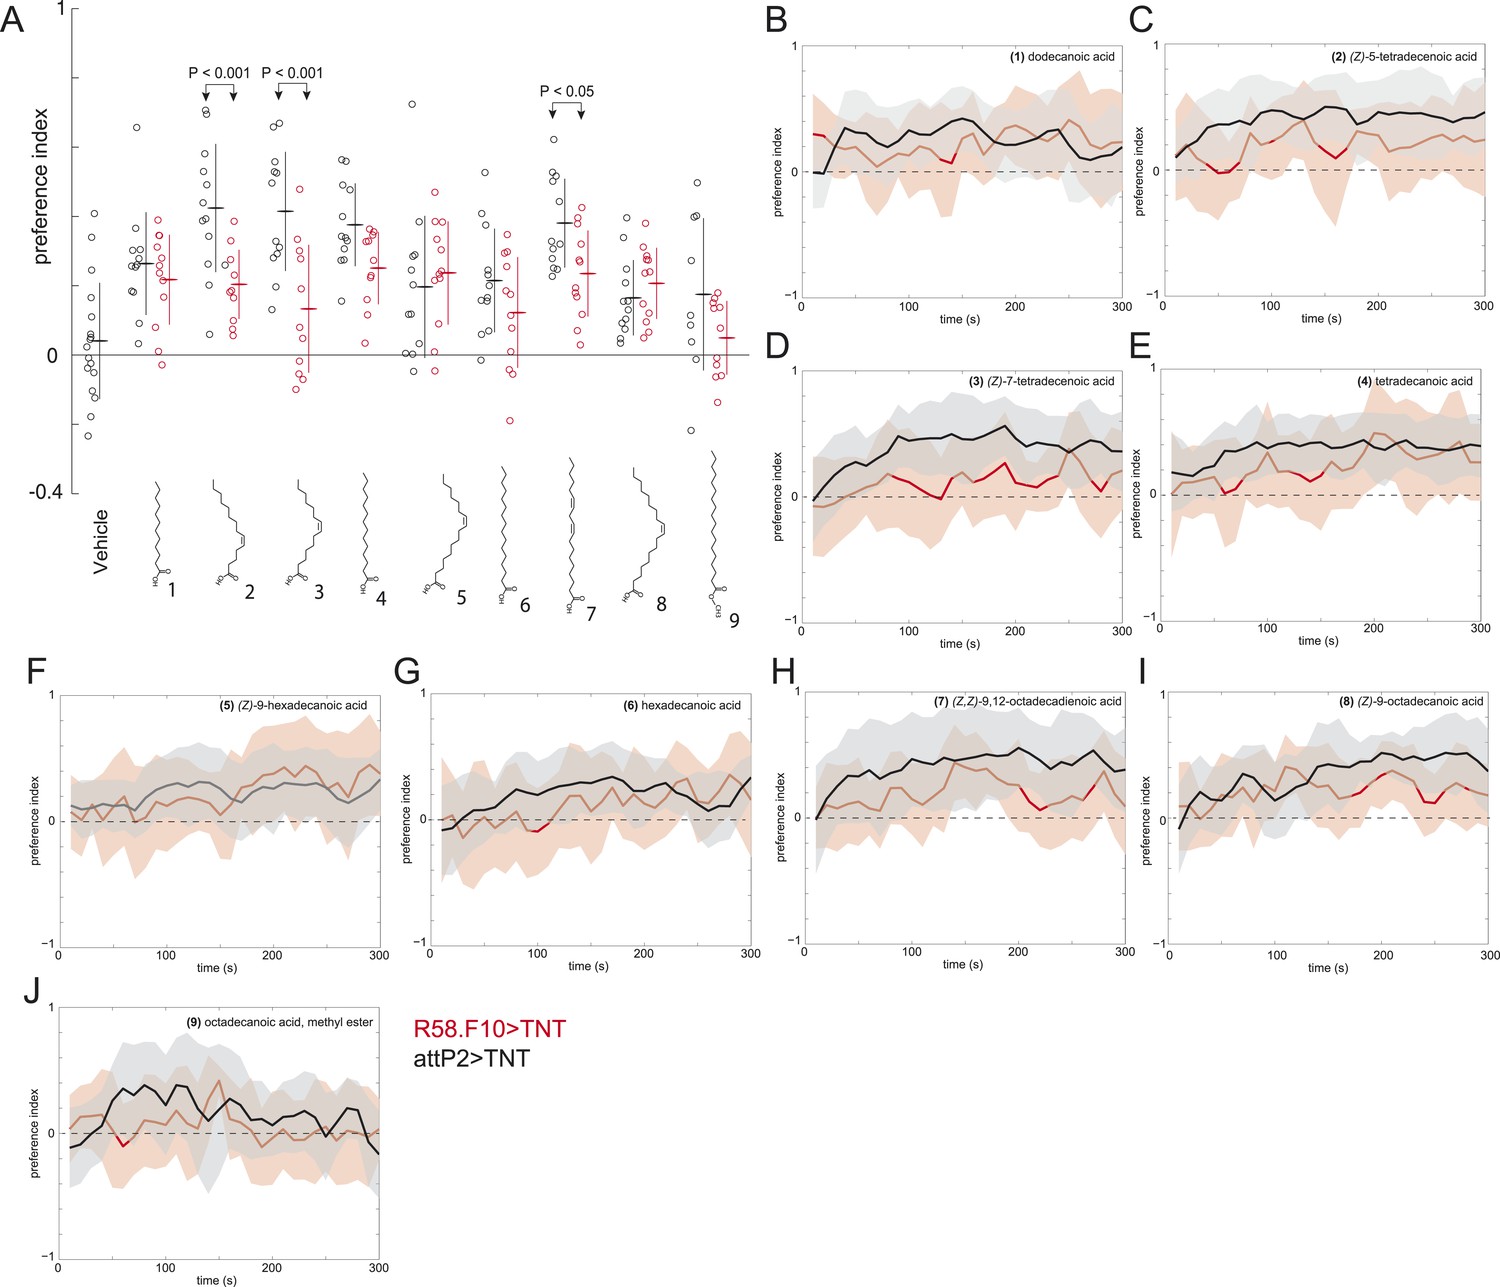
(A) Data points are the preference index scores of small groups (10–15 individuals) of larvae in response to 0.5 nmol/cm2 of candidate molecule. Lines represent means and one standard deviation for each dataset. Treatments displayed significant heterogeneity (ANOVA; F8,120 = 2.9, p < 0.0001). Control larvae (attP2;UAS-TNT, black) were attracted to all compounds at this concentration compared to vehicle controls (p < 0.05, post hoc Tukey test for multiple comparisons). Silencing the synaptic activity of the sensory neurons expressing R58F10-GAL4 (red) strongly inhibited the response to (Z)-5-tetradececnoic acid and (Z)-7-tetradecenoic acid and weakly inhibited the response to (Z,Z)-9,12-octadecadienoic acid. (B–J) Time courses for the experiments summarized in panel (A) Solid lines represent the mean preference index scores and shaded areas represent plus or minus one standard deviation at each time point of the assay period.
Figure 3
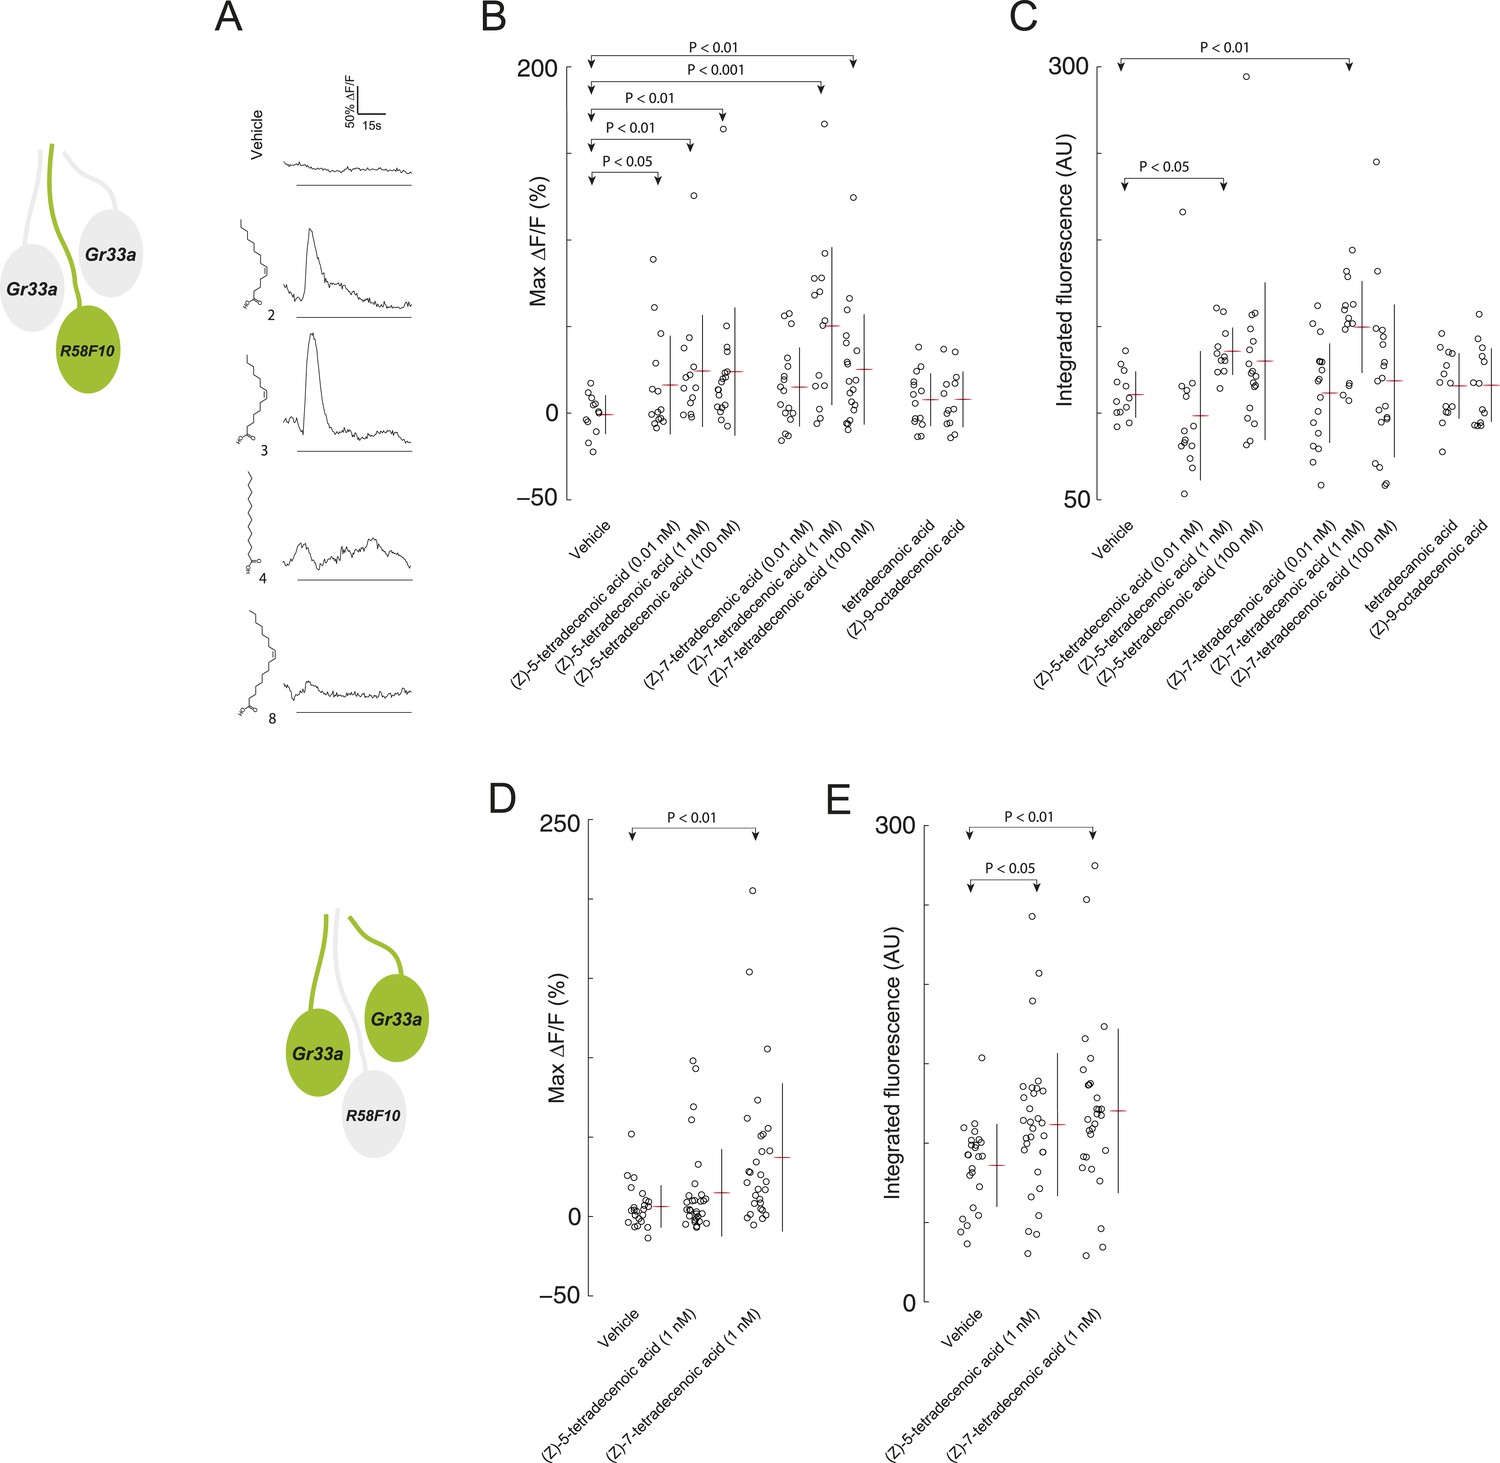
R58F10 sensory neurons are excited by (Z)-5-tetradecenoic acid and (Z)-7-tetradecenoic acid.
(A) Example traces of the excitation of R58F10 sensory neurons in response to control vehicle, 1 nM (Z)-5-tetradecenoic acid, (Z)-7-tetradecenoic acid, tetradecanoic acid, or (Z)-9-octadecanoic acid measured using the calcium–sensitive activity reporter, GCaMP6-S, over time. Excitation is reported as the percent change in GCaMP fluorescence over baseline (%ΔF/F). The solid black bar along the x-axis signifies the onset and duration of stimulus. (B and C) Stimulation with either (Z)-5-tetradecenoic acid or (Z)-7-tetradecenoic acid across a broad range of concentrations evoked a significant increase in the maximum percent change in GCaMP fluorescence (max %ΔF/F) (B) and in the integrated fluorescence (arbitrary units) (C) of individual trials over 150 s compared to control buffer. Compound treatments displayed significant heterogeneity (ANOVA; F8,125 = 3.26, p < 0.01; ANOVA; F8,123 = 3.02, p < 0.01). Data points represent recordings from individual cells. (D and E) The stimulation of two other ppk23-expressing sensory neurons innervating the dorsolateral terminal organ sensillum with R58F10, marked by Gr33a-GAL4 with 1 nM (Z)-5-tetradecenoic acid or (Z)-7-tetradecenoic acid evoked a significant increase in the maximum percent change in GCaMP fluorescence (max %ΔF/F) (D) and in the integrated fluorescence (arbitrary units) (E), compared to control. Compound treatments displayed significant heterogeneity (ANOVA; F2,80 = 6.15, p < 0.01; ANOVA; F2,80 = 4.23, p < 0.05). Data points represent recordings from individual cells. Data are pooled for both cells.
Figure 4
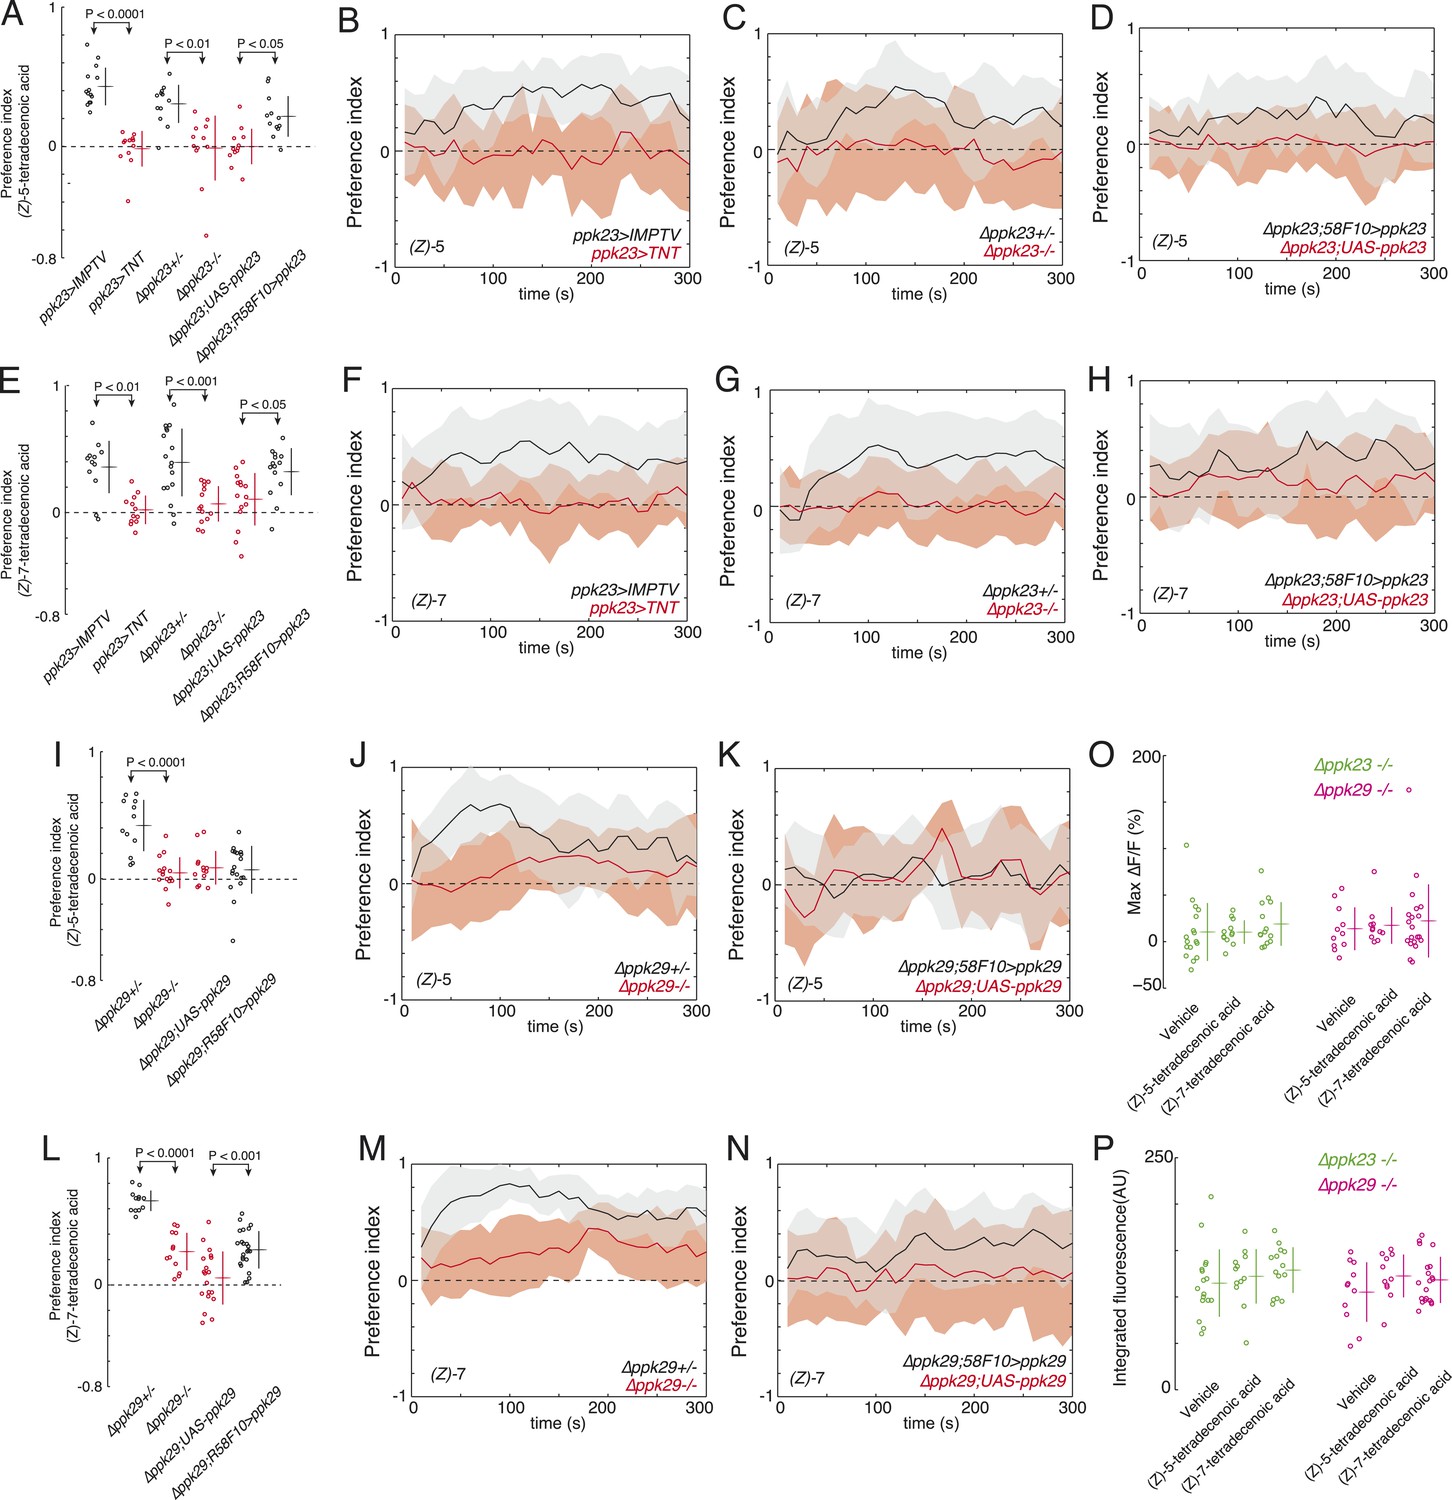
ppk23 and ppk29 are required for detecting larval pheromones.
(A and E) The mean index scores from preference assays measuring the attraction of control, ppk23 silenced, Δppk23 mutant, and Δppk23 mutant larvae rescued with ppk23 expression specifically in R58F10 neurons to synthetic (Z)-5-tetradecenoic acid (A) or (Z)-7-tetradecenoic acid (E). Data points are the mean preference index scores of small groups (10-15 individuals) of larvae in response to 50 fmol/cm2 of candidate molecule over the course of the 300 s assay. Genotypes displayed significant heterogeneity (ANOVA; F5,68 = 18.03, p < 0.0001, F5,78 = 9.03, p < 0.0001, respectively). The mean preference index over the time-course of the larval response to either (Z)-5-tetradecenoic acid (B–D) or (Z)-7-tetradecenoic acid (F–H). Silencing the synaptic activity of ppk23 expressing neurons, as well as a mutation deleting ppk23 blocked the attraction of larvae to (Z)-5-tetradecenoic acid and (Z)-7-tetradecenoic acid. The mean preference index scores (I, L) and timecourse (J, K, M, N) from preference assays measuring the attraction of control and Δppk29 mutant larvae to synthetic (Z)-5-tetradecenoic acid (I, J, K) or (Z)-7-tetradecenoic acid (L, M, N). A mutation deleting ppk29 blocked the attraction of larvae to both (Z)-5-tetradecenoic acid (p < 0.001) and (Z)-7-tetradecenoic acid (p < 0.001). Stimulation of R58F10 neurons mutant for ppk23 or ppk29 with either (Z)-5-tetradecenoic acid or (Z)-7-tetradecenoic acid evoked no significant increase in the maximum percent change in GCaMP fluorescence (max %ΔF/F) (ANOVA; F5,79 = 0.45, p < 0.83) (O) or in the integrated fluorescence (arbitrary units) (ANOVA; F5,79 = 0.90, p < 0.81) (P) of individual trials over 150 s compared to control buffer.
Figure 5 with 1 supplement
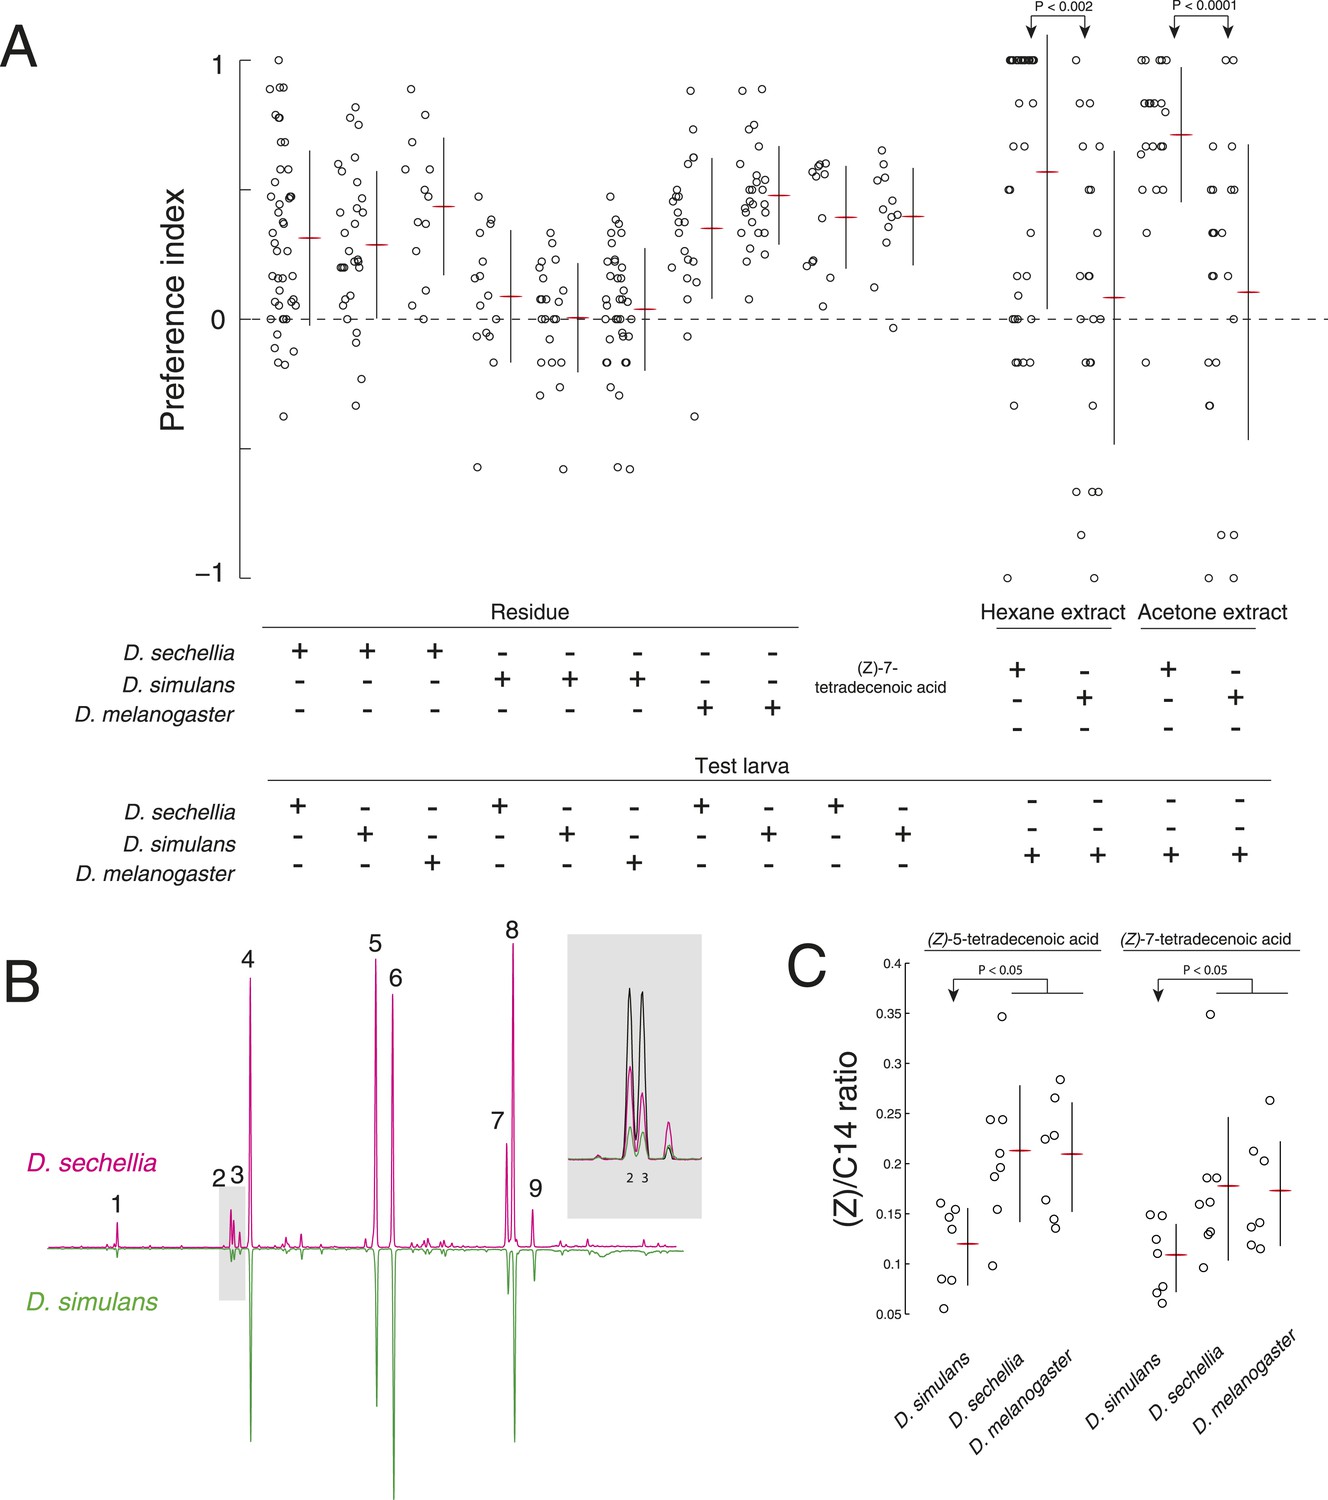
A reduction of (Z)-5-tetradecenoic acid and (Z)-7-tetradecenoic acid production underlies an evolved difference in attractive pheromone signaling.
(A) The attraction of D. sechellia, D. simulans, or D. melanogaster larvae to larval residue from each species, to synthetic (Z)-7-tetradecenoic acid, or to extracts of larval residue. Data points for residue and extract experiments represent preference index scores of individual larvae using the assays described in Figure 1A, and Figure 2A, respectively. Datapoints measuring the response to synthetic (Z)-5-tetradecenoic acid and (Z)-7-tetradecenoic acid represent the preference of 8–12 larvae using the checkerboard assay (Figure 3A). Two-way ANOVA of residue experiments reveals a significant effect of residue, but not of test larvae (2-way ANOVA; residue F3,199 = 40.0, p < 0.0001). The residue from D. simulans is not attractive to any of the three species. Both D. sechellia and D. simulans are attracted to synthetic (Z)-7-tetradecenoic acid. D. melanogaster larvae are attracted to hexane and acetone extracts from D. sechellia larval residue, but not D. simulans larval residue. (B) Chromatographs obtained from D. sechellia (magenta) and D. simulans (green, inverted) larval hexane extracts. (1) dodecanoic acid, (2) (Z)-5-tetradecenoic acid, (3) (Z)-7-tetradecenoic acid, (4) tetradecanoic acid, (5) (Z)-9-hexadecanoic acid, (6) hexadecanoic acid, (7) (Z,Z)-9,12-octadecadienoic acid, (8) (Z)-9-octadecanoic acid, (9) octadecanoic acid, methyl ester. Inset, a portion of the D. sechellia (magenta), D. simulans (green), and D.melanogaster (black) chromatograph traces showing the relative quantities of tetradecenoic acid isomers (Z)-5-tetradecenoic acid (2), (Z)-7-tetradecenoic acid (3), and (Z)-9-tetradecenoic acid. (C) Quantification of the amount of (Z)-5-tetradecenoic and (Z)-7-tetradecenoic acid relative to saturated tetradecanoic acid in D. simulans, D. sechellia, and D. melanogaster extracts. Both (Z)-5-tetradecenoic acid and (Z)-7-tetradecenoic acid are reduced in D. simulans relative to D. melanogaster and D. sechellia.
-
Figure 5—source data 1
Summary of gas chromatographs of extract from larval residue.
Compound ID, Retention times, and the area under each peak from D. melanogaster, D. sechellia, and D. simulans larval residue extracts.
- https://doi.org/10.7554/eLife.04205.014
Figure 5—figure supplement 1
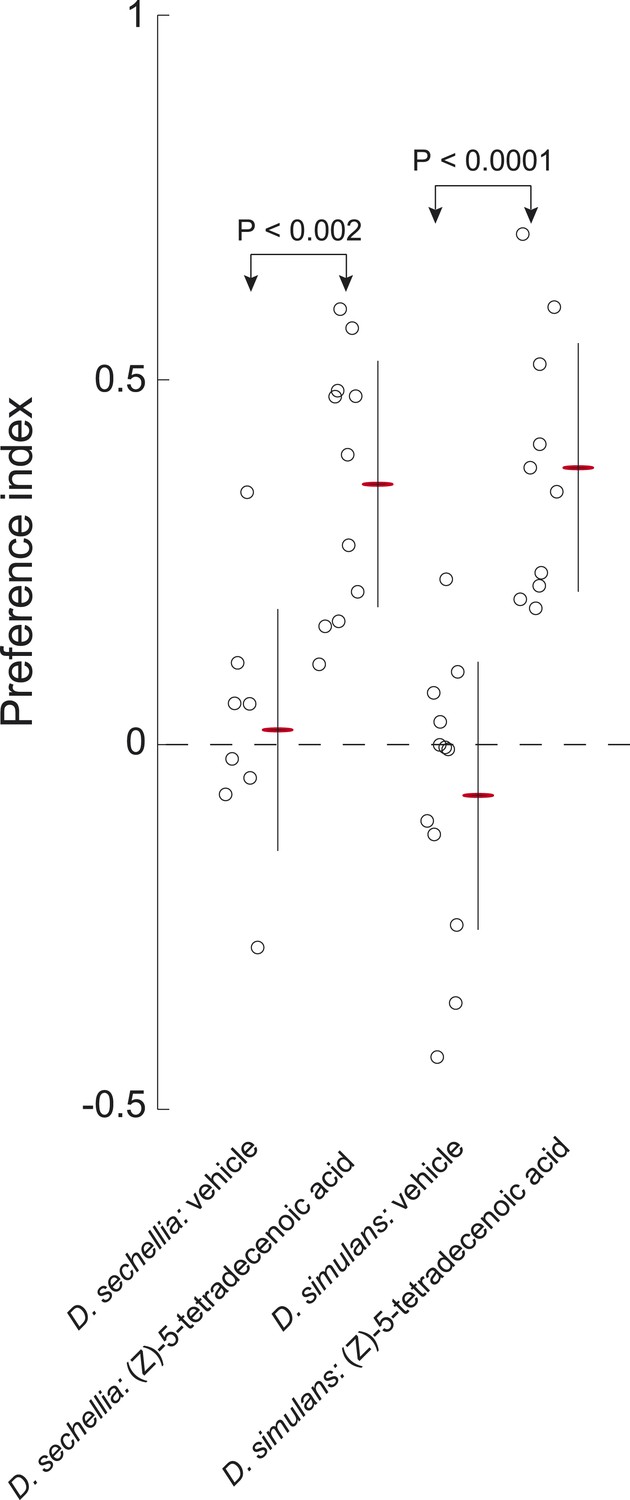
D. sechellia and D. simulans larvae are attracted to (Z)-5-tetradecenoic acid.
Both D. sechellia and D. simulans larvae are attracted to (Z)-5-tetradecenoic acid, but not to vehicle controls. Data points are the preference index scores of small groups (10–12 individuals) of larvae in response to 0.5 nmol/cm2 of candidate molecule. Bars represent means ± one standard deviation for each treatment.
Figure 6
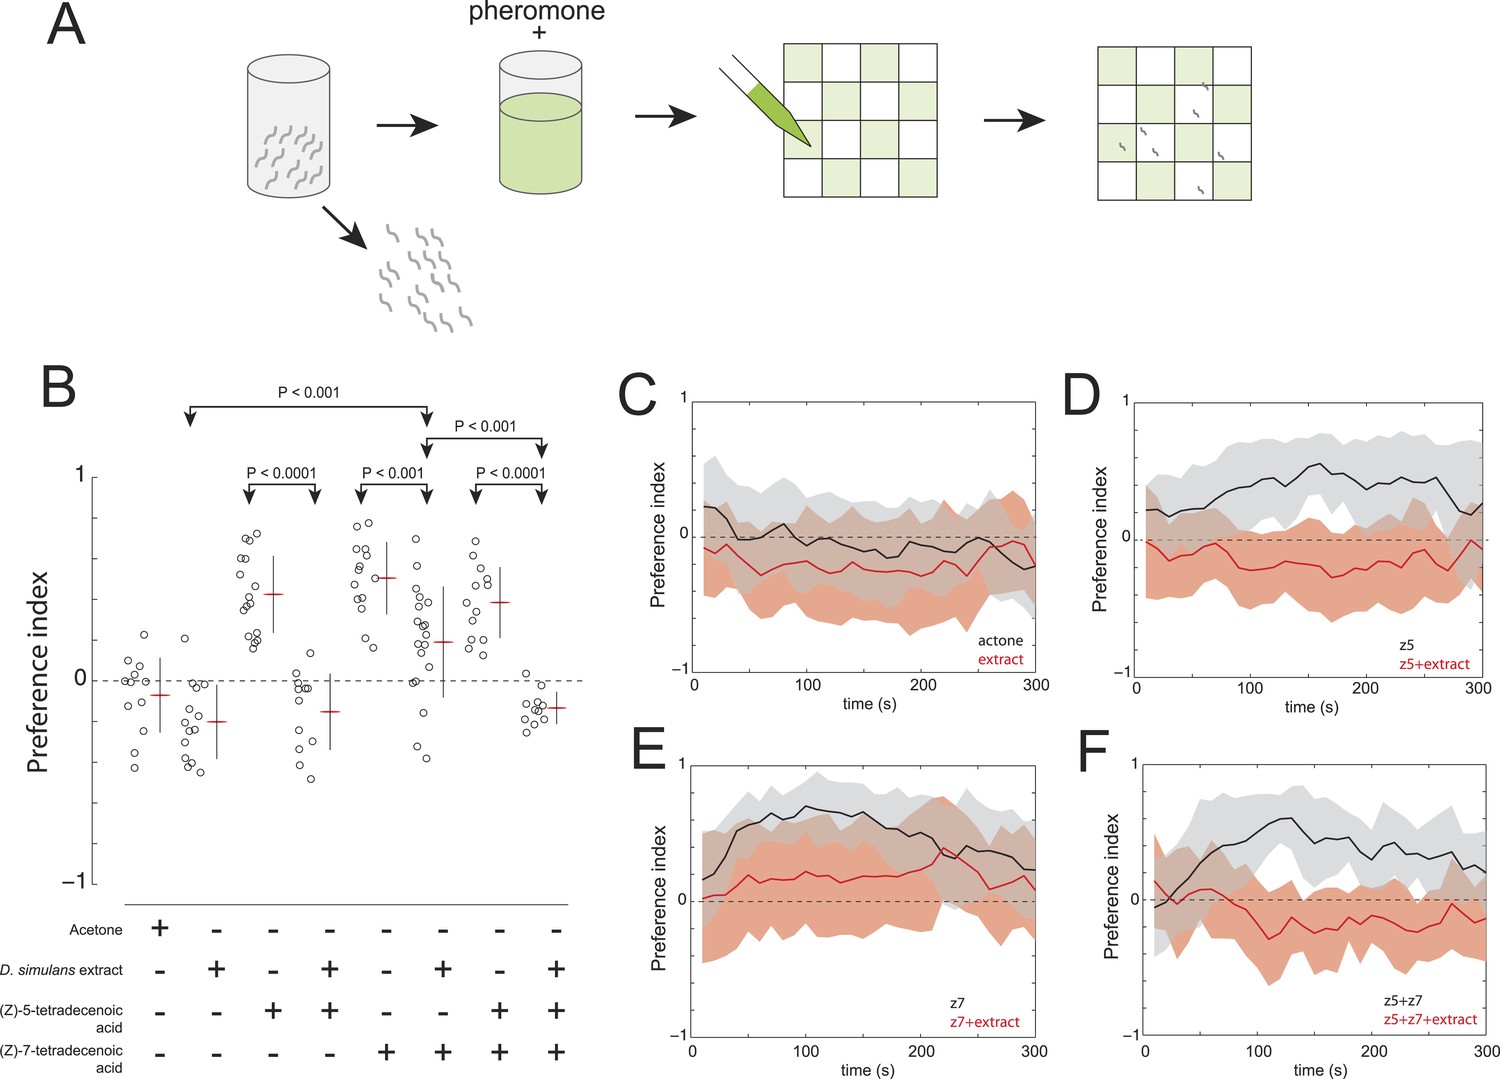
The evolved change in attractiveness of D. simulans is caused by the reduced production of (Z)-7-tetradecenoic acid and production of an unidentified repellent cue.
(A) A schematic of an assay to measure the effect of larval pheromones in the context of D. simulans extract. D. simulans cues were extracted off glass treated with larvae and then supplemented with (Z)-5-tetradecenoic acid, (Z)-7-tetradecenoic acids or an equimolar mixture of the two compounds, and then presented to larvae using a checkerboard assay. (B) The attraction of D. simulans larvae to acetone, D. simulans acetone extract, D. simulans acetone extract supplemented with 0.5 nmol/cm2 synthetic (Z)-5-tetradecenoic acid, 0.5 nmol/cm2 synthetic (Z)-7-tetradecenoic acid, D. simulans acetone extract supplemented with synthetic (Z)-7-tetradecenoic acid, a mixture of synthetic (Z)-5-tetradecenoic acid and (Z)-7-tetradecenoic acid, and D. simulans extract supplemented with the pheromone mixture. Treatments displayed significant heterogeneity (ANOVA, F7,103 = 28.1, p < 0.0001). Data points are the preference index scores of small groups (10-15 individuals) of larvae in response to each condition. (C–F) The mean preference index score over time for the experiments summarized in (B). Dark lines represent the mean preference index score for each timepoint. Shaded areas represent one standard deviation. (B, C) D. simulans larvae are weakly repulsed by D. simulans residue (one-sample t-test; p < 0.01). (B, D) D. simulans extract blocks the attractive effect of synthetic (Z)-5-tetradecenoic acid resulting in weak repulsion (one-sample t-test; p < 0.001) (B, E) The supplementation of synthetic (Z)-7-tetradecenoic acid partially rescues the activity of D. simulans extract. (B, F) D. simulans extract blocks the activity of a mixture of (Z)-5-tetradecenoic and (Z)-7-tetradecenoic acid resulting in weak repulsion (one-sample t-test; p < 0.001).
Additional files
-
Supplementary file 1
- https://doi.org/10.7554/eLife.04205.017
Download links
A two-part list of links to download the article, or parts of the article, in various formats.
Downloads (link to download the article as PDF)
Open citations (links to open the citations from this article in various online reference manager services)
Cite this article (links to download the citations from this article in formats compatible with various reference manager tools)
Evolved differences in larval social behavior mediated by novel pheromones
eLife 3:e04205.
https://doi.org/10.7554/eLife.04205


