Cytotoxic activities of CD8+ T cells collaborate with macrophages to protect against blood-stage murine malaria
- Gunma University Graduate School of Medicine, Japan
- Otsuka Pharmaceutical Co., Ltd, Japan
- Gunma University Faculty of Medicine, Japan
- RIKEN Center for Integrative Medical Science, Japan
Figures
Figure 1 with 2 supplements
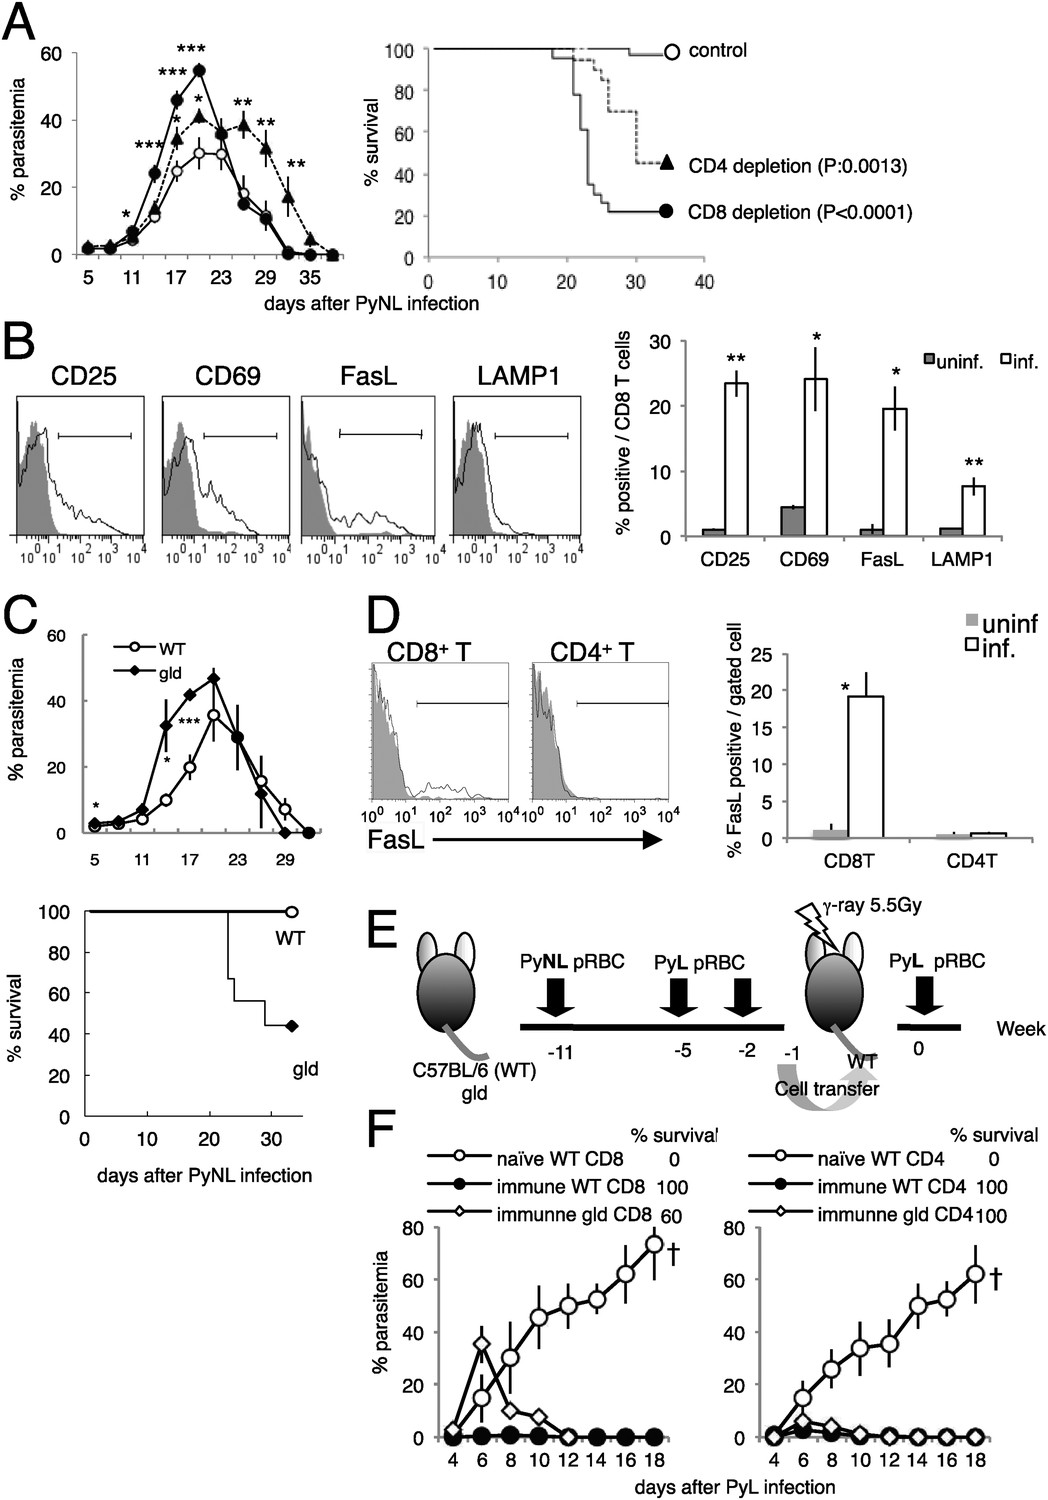
CD8+ T cells and FasL protect against infection with P. yoelii NL (PyNL).
(A) Daily parasitemia and survival rates of C57BL/6 mice depleted of CD8+ or CD4+ T cells after infection with PyNL. Parasitemia was estimated from microscopic observation of Giemsa-stained blood films. Parasitemia values are means ± SE of three pooled experiments (control: N = 20; CD4 depletion: N = 20; CD8 depletion: N = 23). *p < 0.05, **p < 0.01, and ***p < 0.001, Mann–Whitney U-test. Survival rate was calculated from three pooled individual experiments, as described above. p values for the Kaplan–Meier log rank test are shown. (B) Flow-cytometric analyses of splenic CD8+ T cells were performed 7 days after infection with PyNL. Single-cell suspensions from spleens were stained with fluorescence-labeled anti-CD8β antibody. CD8+ T cells were analyzed for the expression of the indicated molecules. Shaded areas and lines in the histograms represent their expression in uninfected and infected mice. Bar graph indicates percentages of CD8+ T cells expressing the molecules as means ± SD of five mice from one of three experiments. *p < 0.05, **p < 0.01, Mann–Whitney U-test. (C) Daily parasitemia (upper panel) and survival rates (bottom panel) of wild type mice (WT) or gld mice infected with PyNL, monitored as in Figure 1A. WT, N = 6; gld, N = 9. Parasitemia values are means ± SD from one of five experiments. *p < 0.05 and ***p < 0.001, Mann–Whitney U-test. Survival rates are from five pooled individual experiments (WT, N = 28; gld, N = 25). (D) Contribution of FasL expressed on CD8+ T cells to the protective effects against blood-stage malaria. Expression of FasL on splenic CD4+ T cells was evaluated. *p < 0.05, Mann–Whitney U-test. Data of FasL on CD8 are the same experiment as Figure 1B. (E) Experimental protocol for the adaptive transfer of cells after the prime–boost PyNL vaccine regime against lethal PyL infection. WT and gld mice were infected with PyNL, and then boosted twice with PyL. CD4+ and CD8+ T cells isolated from the vaccinated donors were transferred into irradiated recipients. Note that although some gld mice died from the PyNL infection, the survivors were as resistant to PyL infection as the WT mice. (F) Parasitemia was monitored in the recipients of the indicated cells. Each symbol indicates means ± SD. Each group contained five mice. The final survival rate of each group is also indicated. The results are from one experiment, representative of the two performed. Dagger indicates death.
Figure 1—figure supplement 1
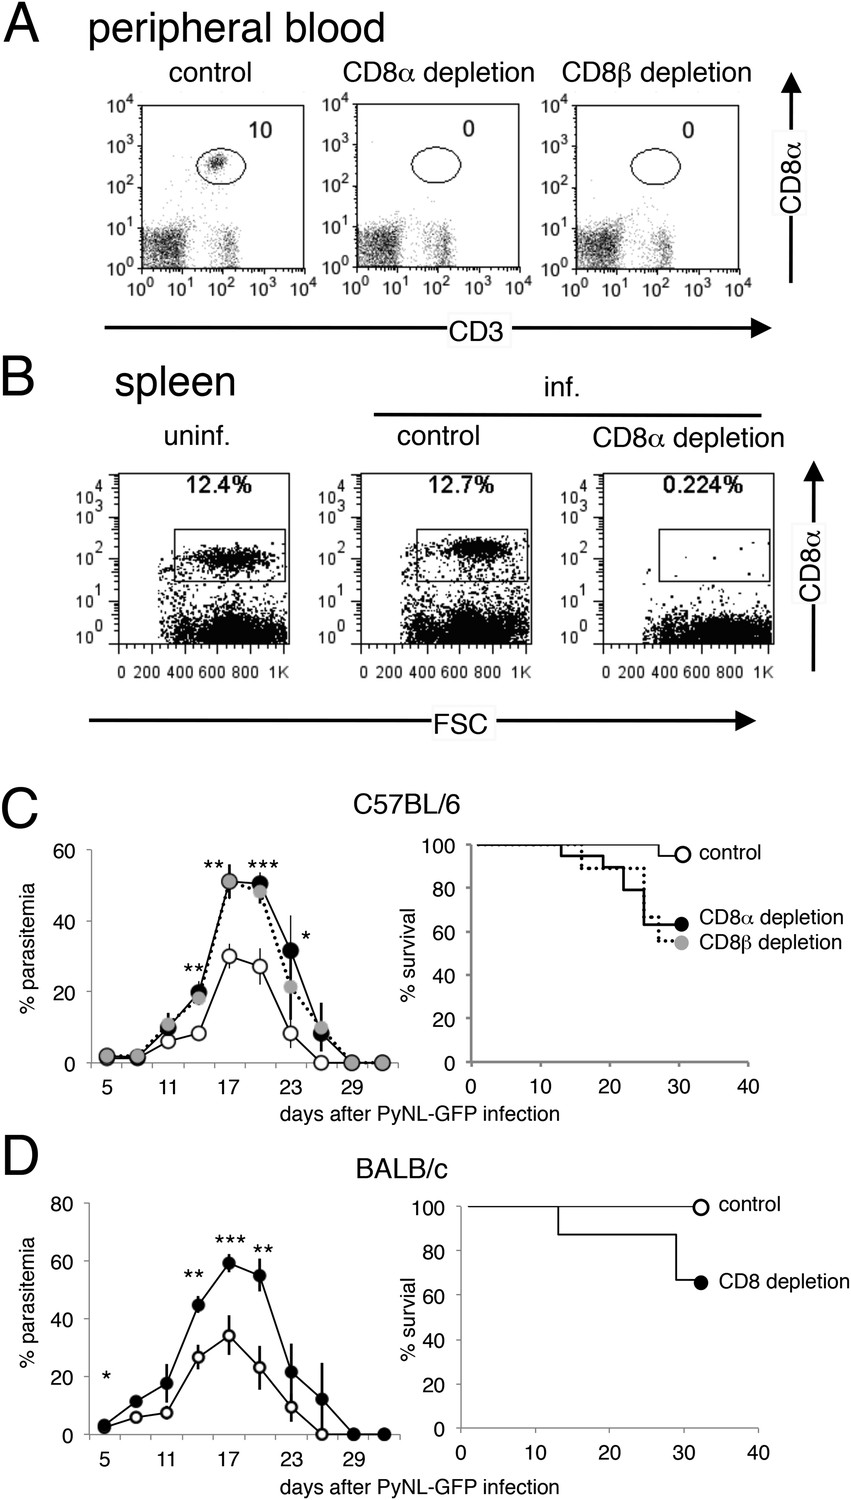
CD8+ T cells play protective roles in C57BL/6 mice and BALB/c mice infected with PyNL.
(A) Successful depletion of CD8 T cells in mice treated with anti-CD8α or anti-CD8β antibody was evaluated in peripheral blood 24 hr after inoculation. (B) Spleen cells isolated from the indicated mice 3 days after infection were stained with anti-CD8 antibody (clone: 53.6.7) with a different specificity from the depleting antibody. (C) Daily parasitemia and survival rates of C57BL/6 mice depleted of CD8α+ or CD8β+ cells after infection with PyNL-GFP. Parasitemia values are shown as the means ± SD (control, N = 18; CD8α depletion, N = 9; CD8β depletion, N = 18) from pooled two experiments. Survival rate was calculated from two pooled individual experiments as above. (D) Daily parasitemia and survival rates of BALB/c mice depleted of CD8+ T cells after infection with PyNL-GFP. Parasitemia values are shown as the means ± SD of eight mice in one experiment, which is representative of the two experiments performed. Survival rate was calculated from two pooled individual experiments. Control, N = 16; CD8 depleted, N = 16. It should be noted that 60% of C57BL/6 mice treated with anti-CD8α survived (C), contrasting to the results in Figure 1A where only 20% mice survived. This difference might be due to the environmental influences as these results were obtained from experiments conducted in different animal facilities (both are specific pathogen-free) using mice from different a supplier. For instance, alterations in microbiota due to environmental differences are known to affect immune responses (Furusawa et al., 2013).
Figure 1—figure supplement 2
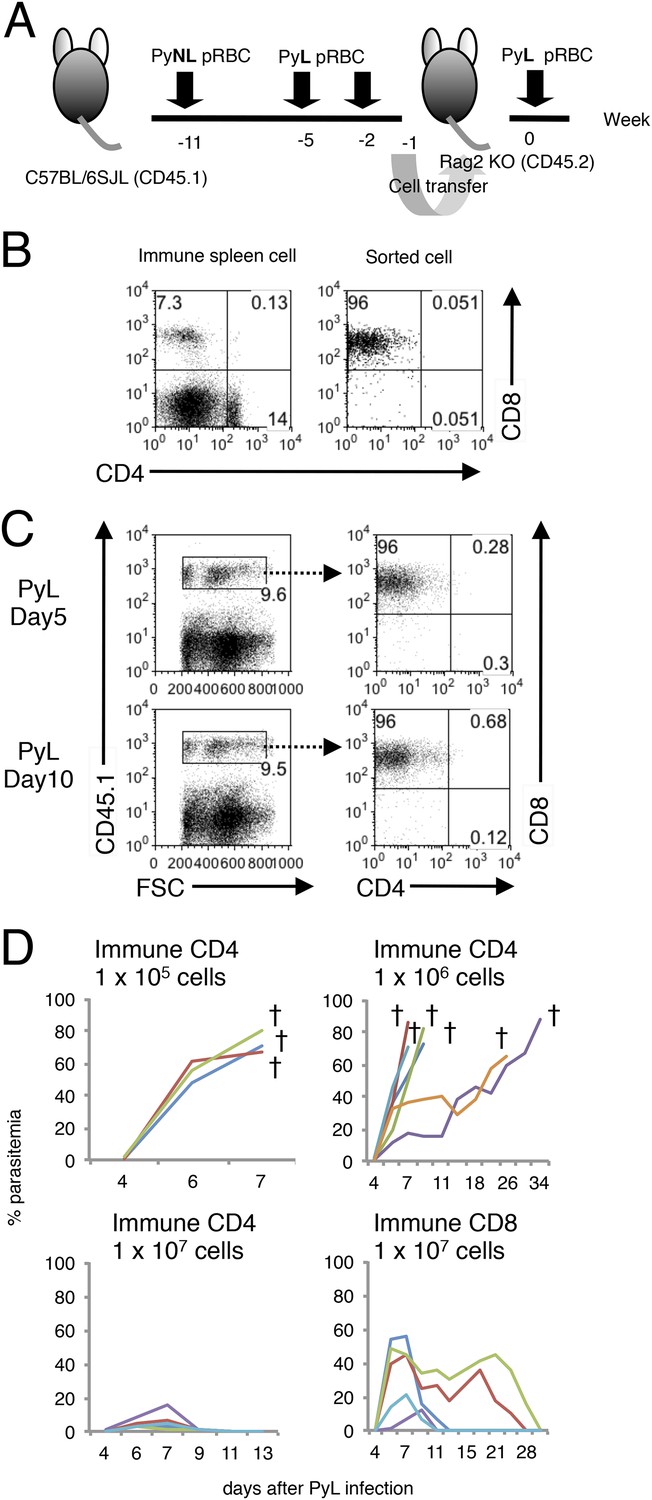
Confirmation that CD8+ T cells are responsible for transferring protection to Rag2−/− mice.
(A) The adaptive transfer experiments were performed as in Figure 1E except for using Rag2−/− mice (CD45.2) as recipients and B6SJL mice (CD45.1) as donors to discriminate the transferred cells. (B) Spleen cells from donors (left panel) and sorted CD8+ T cells used for transfer (right panel) were analyzed for CD4 and CD8. (C) The transferred cells expressing CD45.1 (left panels) were analyzed for contaminating CD4+ T cells (right panels) in spleens of Rag2−/− recipients 5 and 10 days after PyL challenge. (D) Parasitemia was monitored in the Rag2−/− recipients transferred with the indicated cells. Each line indicates an individual mouse. Daggers indicate death.
Figure 2
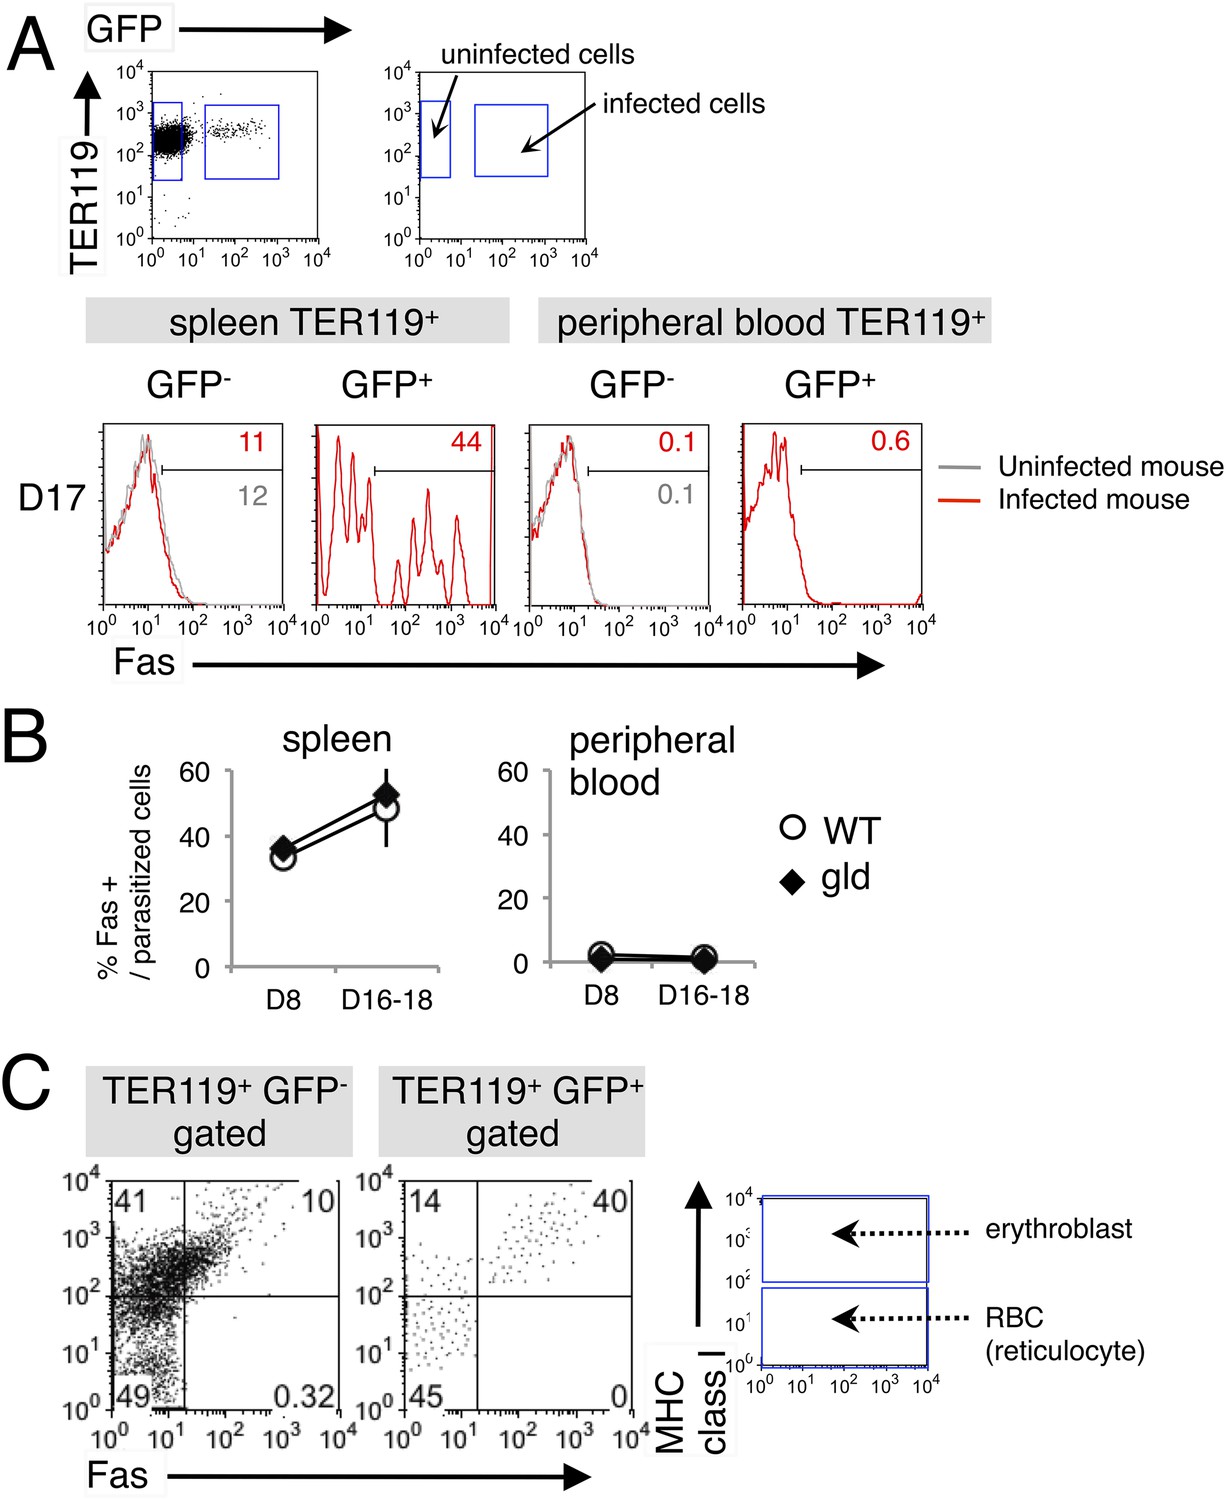
Fas is expressed on erythroid cells infected with PyNL.
(A) Spleen cells and peripheral blood cells obtained from mice infected with PyNL–GFP were stained with anti-TER119, anti-Fas, and anti-MHC class I antibodies. TER119+ GFP+ infected or TER119+ GFP− uninfected cells were analyzed for their expression of Fas. Numbers on the histograms indicate the percentages of Fas+ cells in the gated cells. (B) Percentages of Fas+ cells in parasitized cells (TER119+ GFP+ Fas+/TER119+ GFP+) are shown as means ± SD from one experiment (N = 4), representative of the three performed. (C) Splenic TER119+ cells infected (right panel) or uninfected (left panel) in mice infected with PyNL–GFP were separated into MHC class Ihi erythroblasts (fluorescence intensity > 102), class Ilo-neg reticulocytes, and mature RBCs and analyzed for their Fas expression. Numbers indicate the percentages of the gated cells in each quadrant.
Figure 3
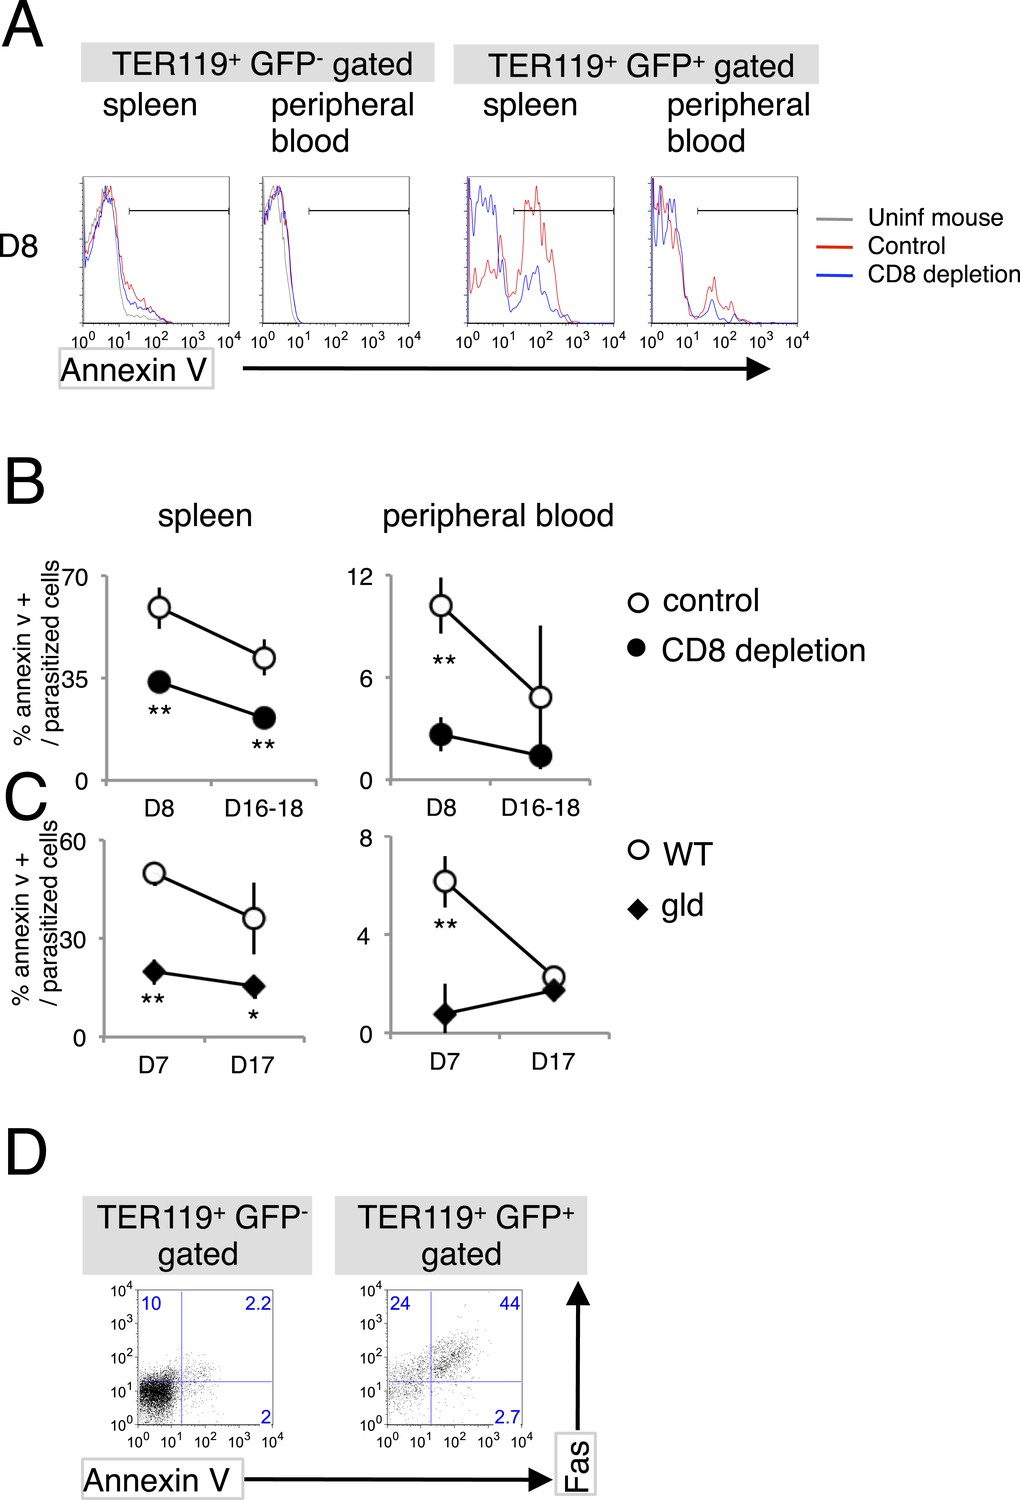
Infection with PyNL induces externalization of phosphatidylserine (PS) on parasitized cells.
(A) Spleen cells and peripheral blood obtained from the indicated mice 8 days after infection with PyNL–GFP were stained with anti-TER119 antibody and annexin V. Infected GFP+ or uninfected GFP− TER119+ cells were analyzed for the expression of PS. (B) Percentages of TER119+ GFP+ PS+ cells in the TER119+GFP+ cells in the control (open symbols) and CD8+-depleted mice (closed symbols) are shown as means ± SD from one experiment (N = 4), representative of the three performed. (C) Those in the gld mice were also analyzed. **p < 0.01, Mann–Whitney U-test. (D) Splenic TER119+ cells infected (right panel) or uninfected (left panel) obtained from mice 8 days after infection with PyNL–GFP were analyzed for the expression of PS and Fas. Numbers indicate the percentages of the gated cells in each quadrant.
Figure 4
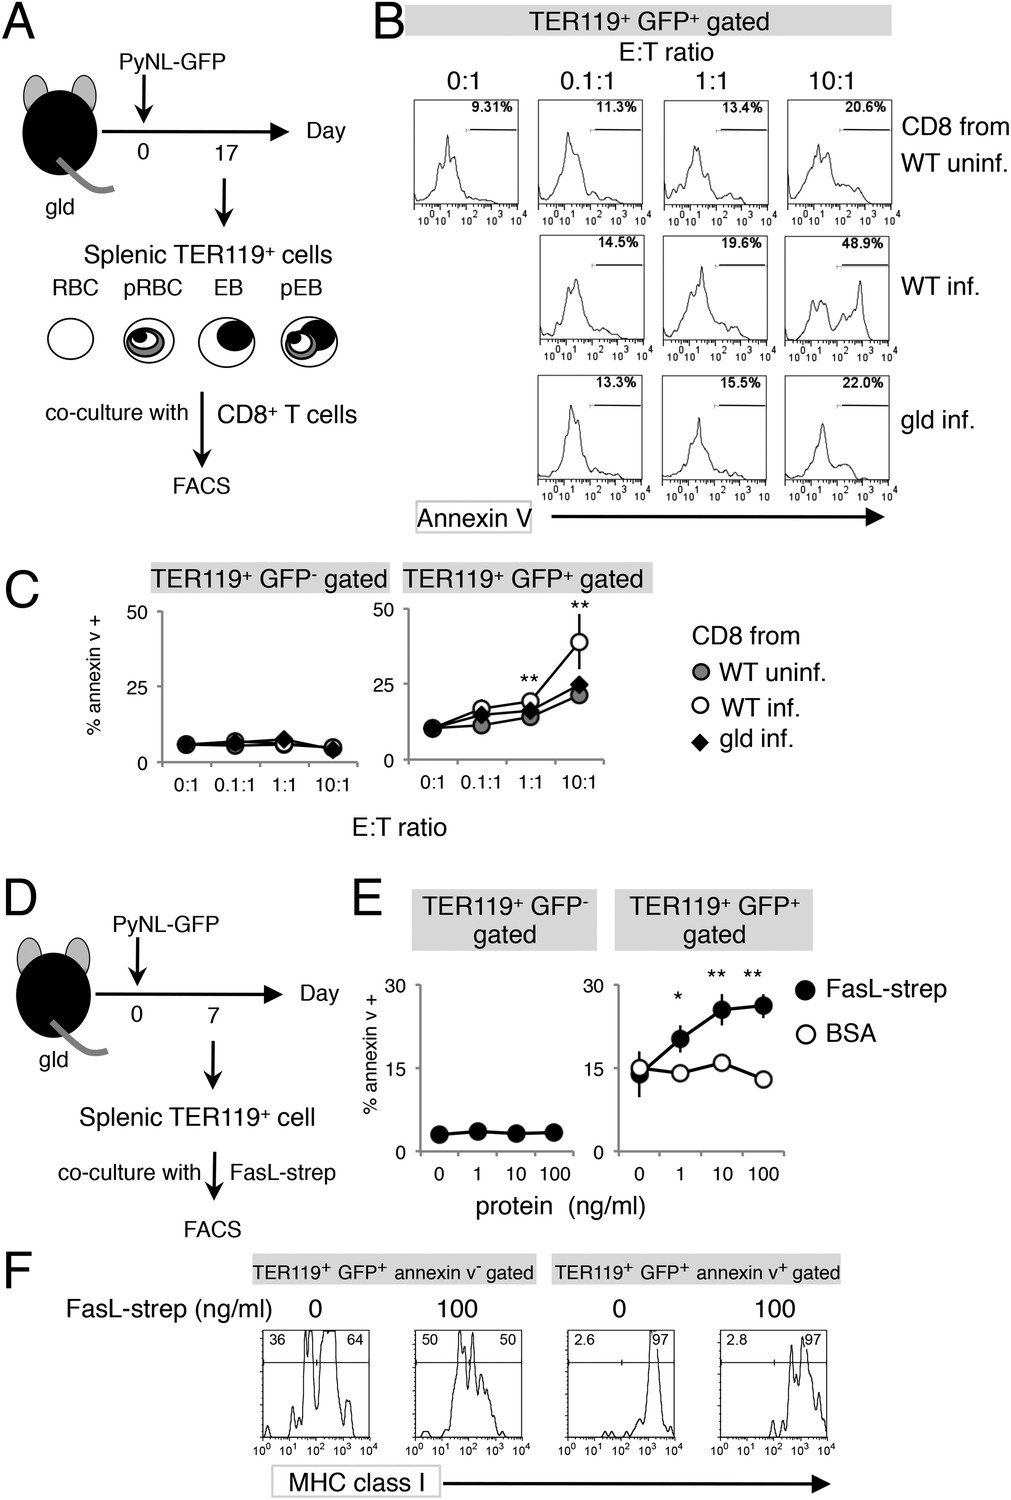
Exposure of PS is dependent on CD8+ T cells and FasL.
(A) Experimental protocol for the evaluation of CD8+-T-cell-dependent PS externalization in parasitized cells in vitro. Splenic TER119+ cells containing RBC, pRBC, erythroblasts (EB) and pEB (3 × 10⁵) isolated from gld mice 17 days after infection with PyNL–GFP were cultured for 4 hr with CD8+ T cells from WT or gld mice 17 days after PyNL infection, at the indicated ratios. (B) Cultured TER119+ cells with CD8+ T cells from the indicated mice were stained with annexin V, and GFP+ cells were analyzed for PS expression. Numbers in histograms indicate percentages of annexin V+ cells in the gated cells. (C) Values are means ± SD from triplicate cultures in one experiment, representative of the four performed. **p < 0.01, Mann–Whitney U-test. (D) Experimental protocol for the evaluation of FasL-dependent PS externalization in parasitized cells in vitro. TER119+ cells isolated from spleens and peripheral blood of gld mice 7 days after infection with PyNL–GFP were cultured for 4 hr with the indicated amounts of FasL–Strep or bovine serum albumin (negative control). (E) Cultured cells were collected and stained with annexin V, and annexin V+ cells among the GFP+ parasitized cells were quantified. Values are means ± SD of triplicate cultures in one experiment, representative of the four performed. *p < 0.05 and **p < 0.01, Mann–Whitney U-test. (F) Annexin V-positive or -negative GFP+ parasitized cells were analyzed for the expression of MHC class I antigens, as in Figure 3C.
Figure 5
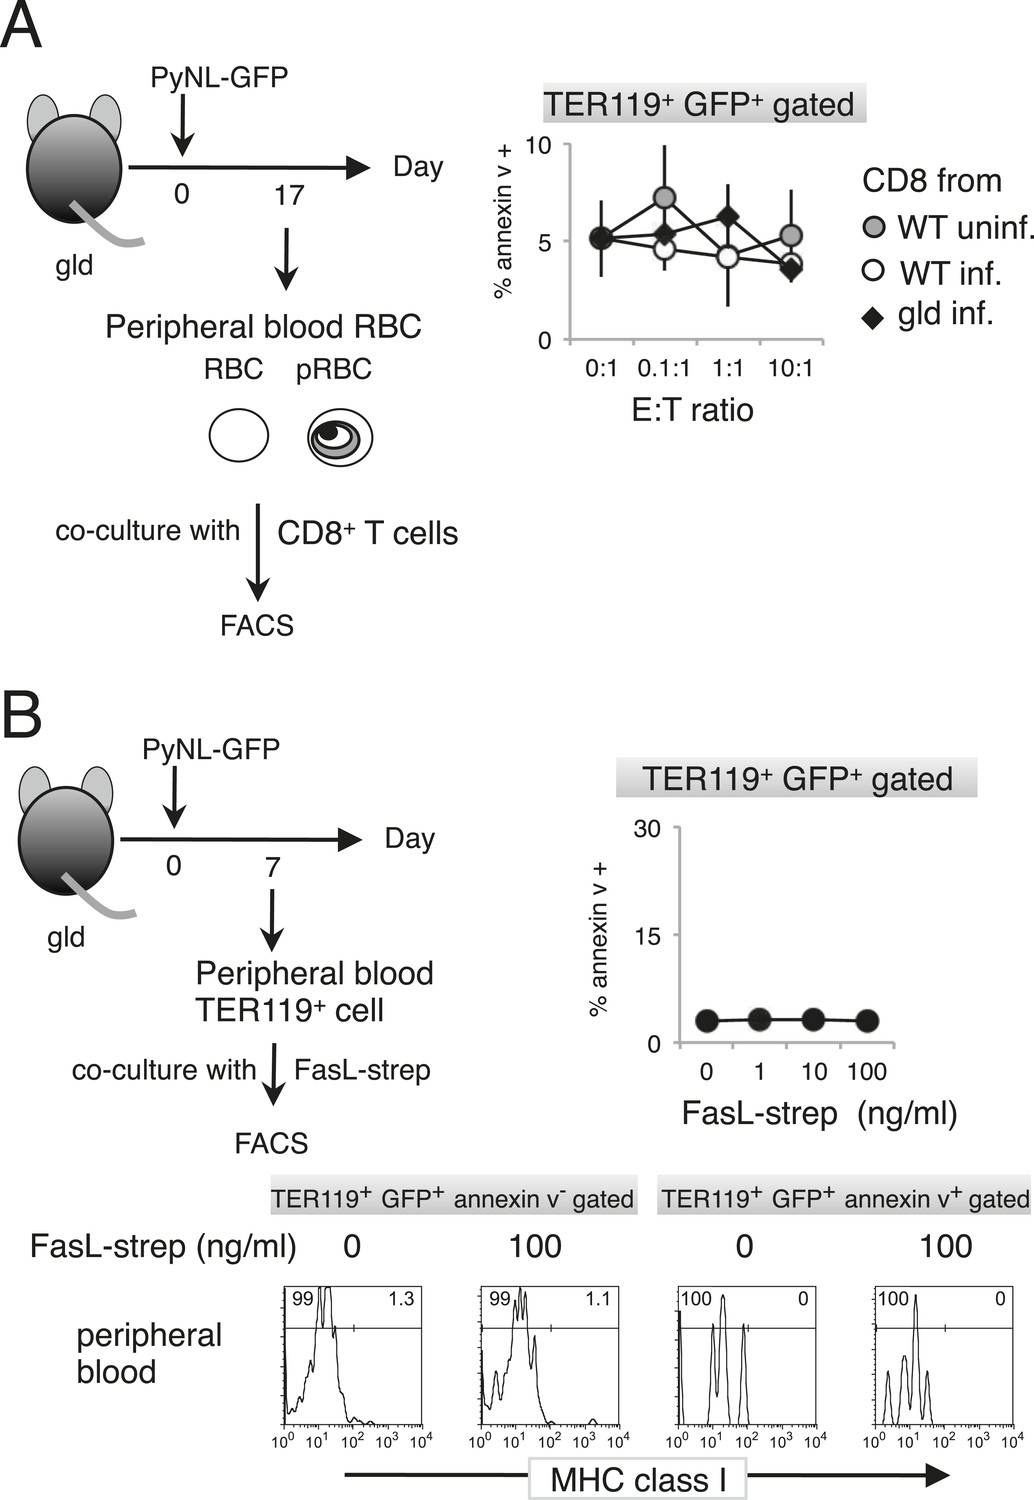
Externalization of PS in pRBCs was not induced in vitro.
Peripheral blood cells obtained from gld mice infected with PyNL–GFP were cultured with CD8+ T cells (A) or FasL–Strep (B) and analyzed as in Figure 4.
Figure 6
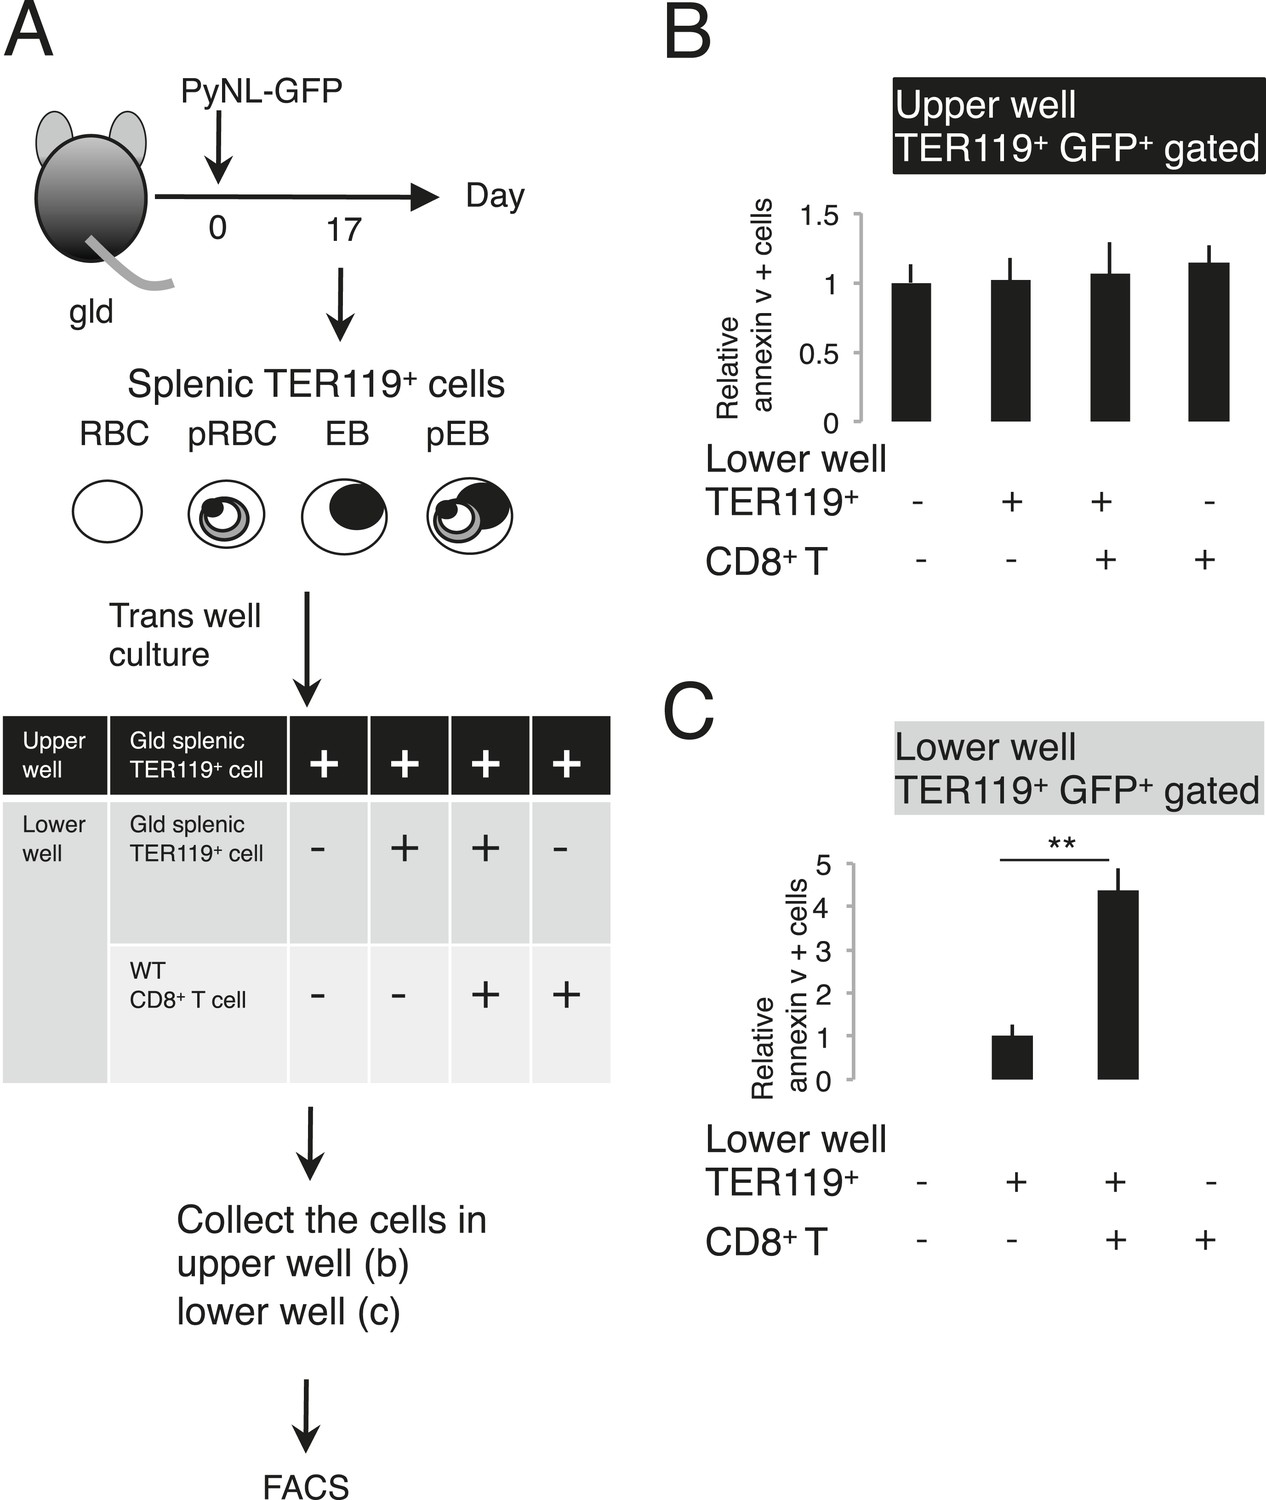
Externalization of PS in parasitized cells requires contact with CD8+ T cells.
(A) Protocol of the contact dependence assay using Transwell cultures. Splenic TER119+ cells from gld mice infected with PyNL–GFP and CD8+ T cells from WT mice infected with PyNL were placed into the upper and/or lower wells and cultured for 6 hr. GFP+ parasitized cells were analyzed for PS expression, as in Figure 4B. The ratio of the percentages of PS+ cells in the GFP+ cells in the upper (B) and lower wells (C) was calculated as (% PS+ GFP+ of GFP+ cells in each test)/(% PS+GFP+ in GFP+ cells in the absence of cell components in the lower well) in (B), and as (% PS+ GFP+ in GFP+ cells in the presence of CD8+ T cells)/(% PS+ GFP+ in GFP+ cells in the absence of CD8+ T cells in the lower well) in (C). Values shown are the means ± SD of triplicate cultures in one experiment, representative of the three performed. **p < 0.01, Mann–Whitney U-test.
Figure 7
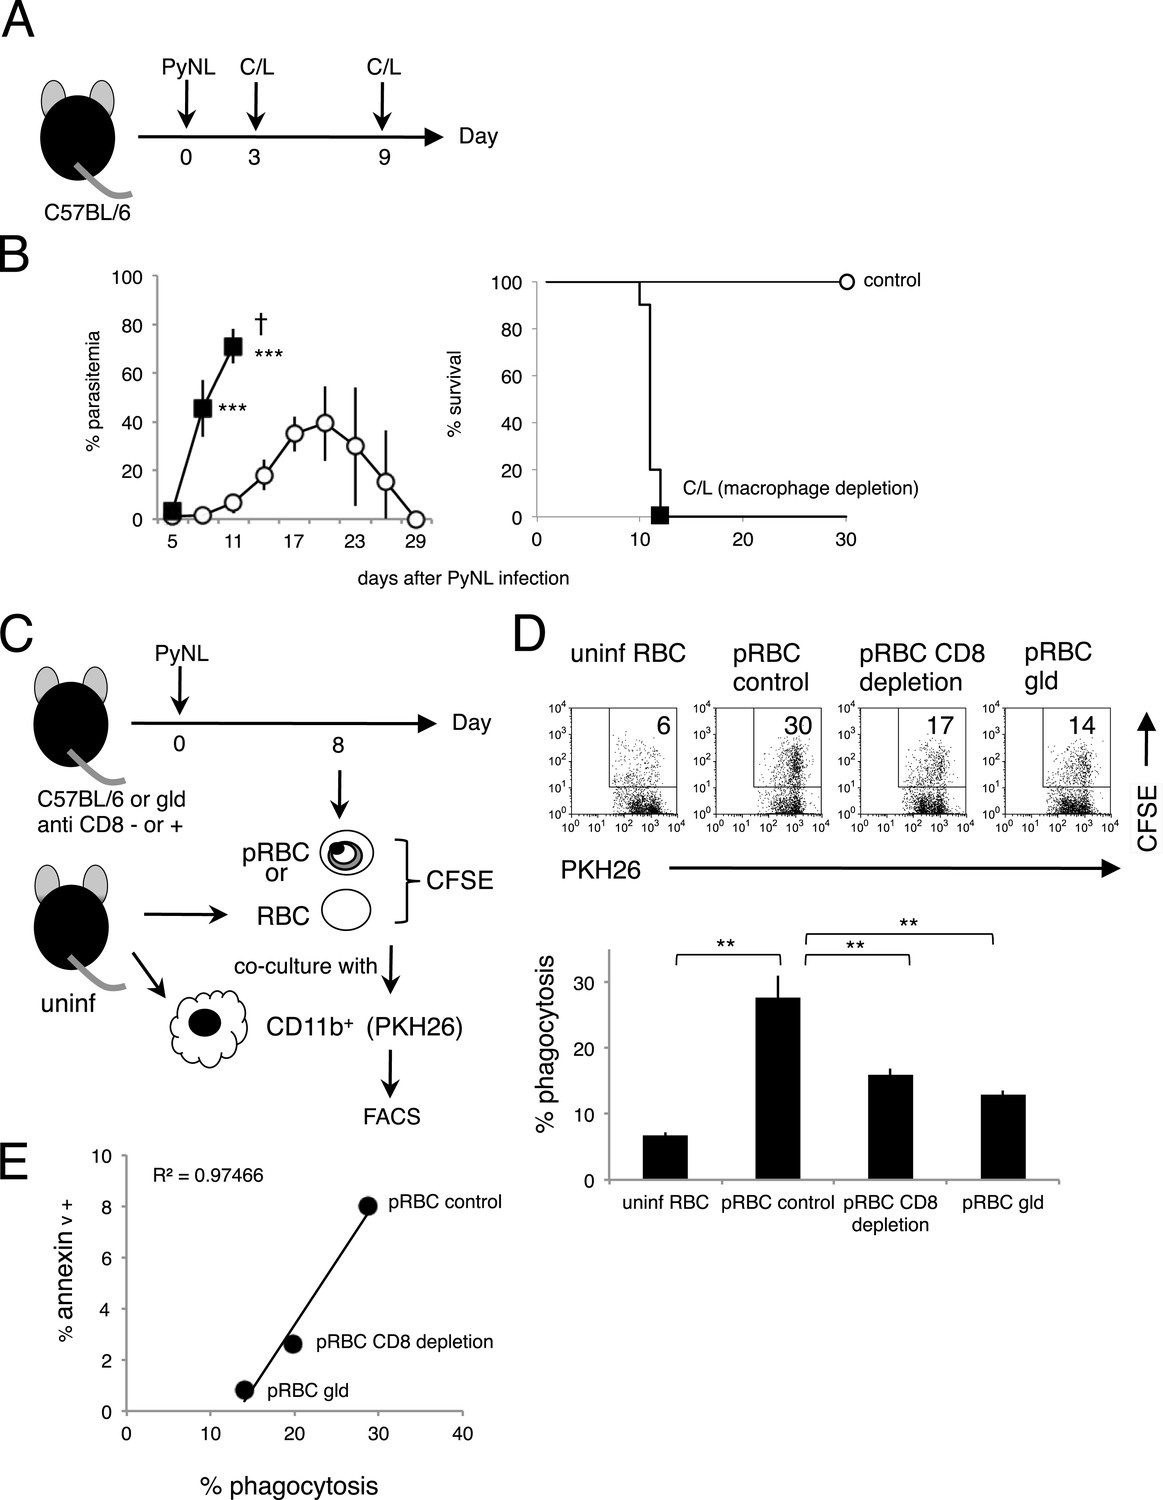
Phagocytosis of parasitized RBCs (pRBCs) by macrophages correlates with RBC PS expression in vitro.
(A) Experimental protocol for depleting macrophage with clodronate/liposomes (C/L). (B) Parasitemia (left panel) and survival rate (right panel) were evaluated from two pooled separate experiments. Control: N = 17; C/L: N = 10. ***p < 0.001, Mann–Whitney U-test. (C) Protocol used to evaluate the phagocytosis of pRBCs. pRBCs obtained from WT, CD8+-depleted, or gld mice were labeled with CFSE, and then cocultured for 4 hr with CD11b+ macrophages obtained from uninfected WT mice, which had been labeled with PKH26 fluorescence. RBC from uninfected WT mice was also tested. The ratio of macrophages to pRBCs or RBC was 1:30. (D) Phagocytosis was evaluated by detecting the PKH+ CFSE+ macrophages after culture with pRBCs isolated from the indicated mice. Numbers in the upper panels indicate the percentage of phagocytic macrophages in the squares in the total macrophages (% phagocytosis = PKH+ CFSE+/PKH+). Values in the bar graph are means ± SD from triplicate cultures in one experiment, representative of the two experiments performed. **p < 0.01, Mann–Whitney U-test. (E) PS exposure correlates with the degree of phagocytosis. The percentage of PS+ cells in each pRBC preparation and the percentage of phagocytic macrophages when each preparation was used are plotted.
Figure 8 with 1 supplement
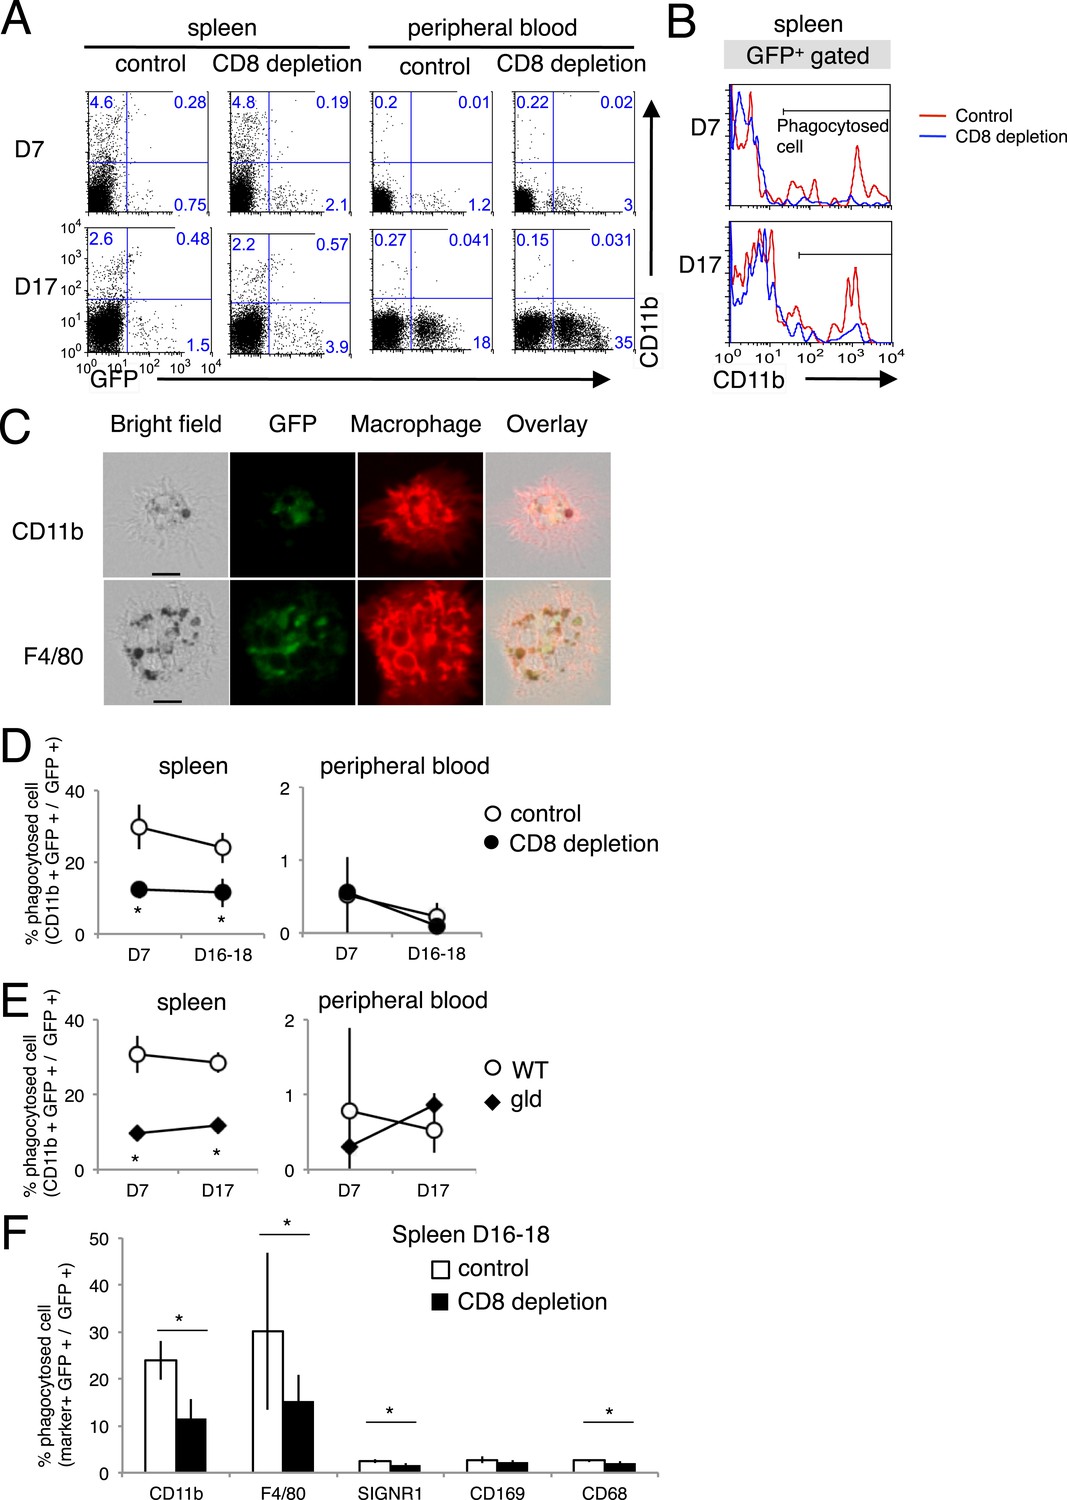
Phagocytosis of parasitized cells by macrophages in vivo.
Spleen cells and peripheral blood were isolated seven or 17 day after mice depleted of CD8+ T cells were infected with PyNL–GFP. (A) Those cells were then stained with anti-CD11b antibody and separated into free parasitized cells (GFP+ CD11b−) and phagocytosed cells (GFP+ CD11b+). The numbers represent the percentages of cells in each quadrant. (B) Histograms indicate CD11b expression in GFP+ gated cells. (C) Images of phagocytosed parasitized cells are shown. Hemozoin-containing adherent macrophages were isolated from spleens with magnetic sorting and were observed microscopically. Scale bars represent 10 μm. Fractions of phagocytosed GFP+ parasitized cells were quantified as CD11b+ cells from mice depleted of CD8+ T cells (D) or from gld mice (E). (F) Macrophage subsets expressing the indicated macrophage markers were also calculated in control and CD8+ T cell-depleted mice. Values are means ± SD of 5–7 mice from three pooled individual experiments. *p < 0.05, Mann–Whitney U-test.
Figure 8—figure supplement 1
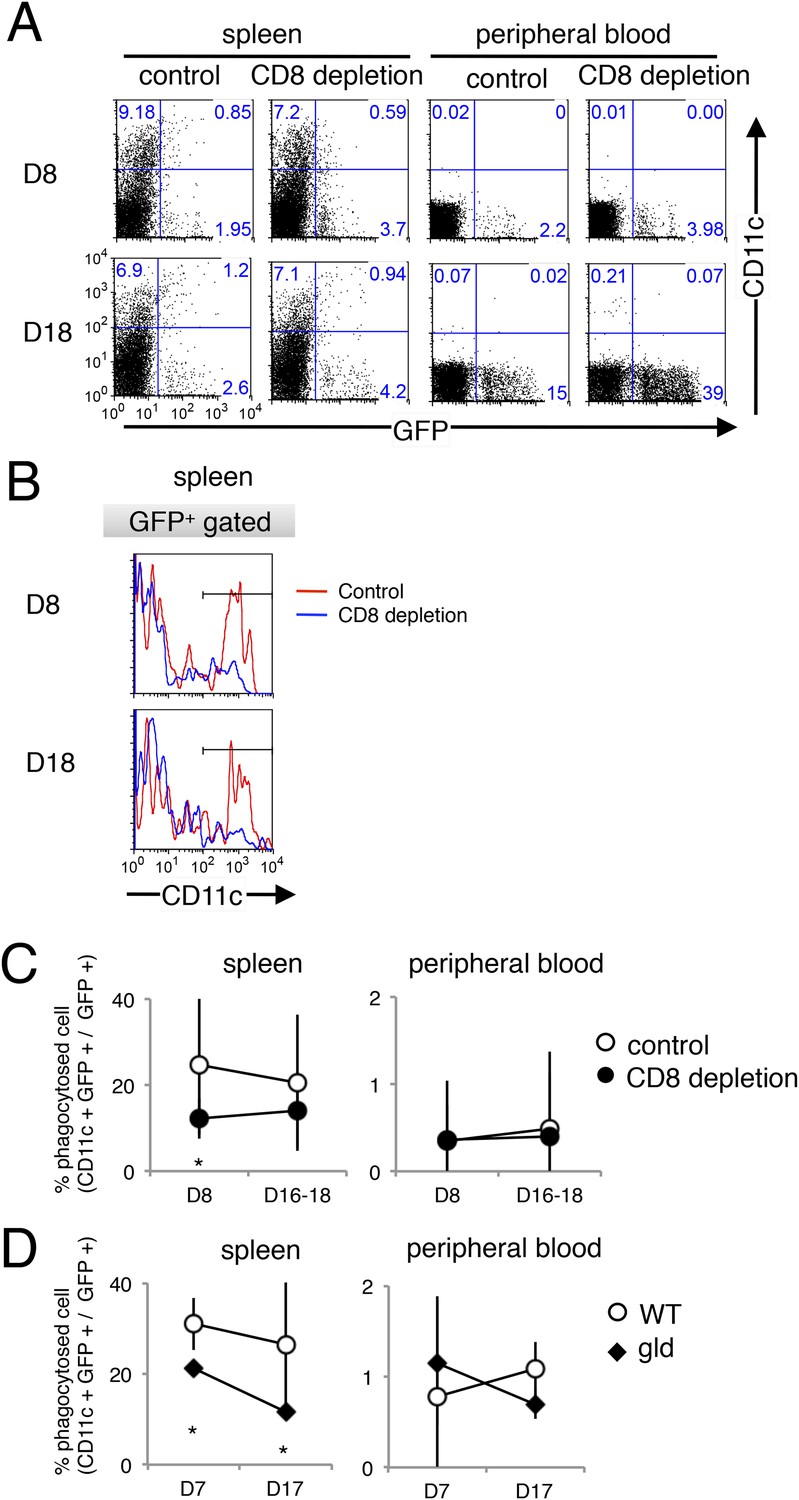
Dendritic cells also phagocytose parasitized cells, presumably in response to PS exposure.
The phagocytosis of parasitized cells by dendritic cells was analyzed as in Figure 8, except that CD11c was used as the dendritic-cell marker instead of CD11b. Spleen cells and peripheral blood were isolated seven or 17 day after mice depleted of CD8+ T cells were infected with PyNL–GFP. (A) Those cells were then stained with anti-CD11c antibody and separated into free parasitized cells (GFP+ CD11c−) and phagocytosed cells (GFP+ CD11c+). The numbers represent the percentages of cells in each quadrant. (B) Histograms indicate CD11c expression in GFP+ gated cells. (C) Fractions of phagocytosed GFP+ parasitized cells were quantified as CD11c+ cells from mice depleted of CD8+ T cells (D) or from gld mice. Values are means ± SD of 5–7 mice from three pooled individual experiments. *p < 0.05, Mann–Whitney U-test.
Figure 9
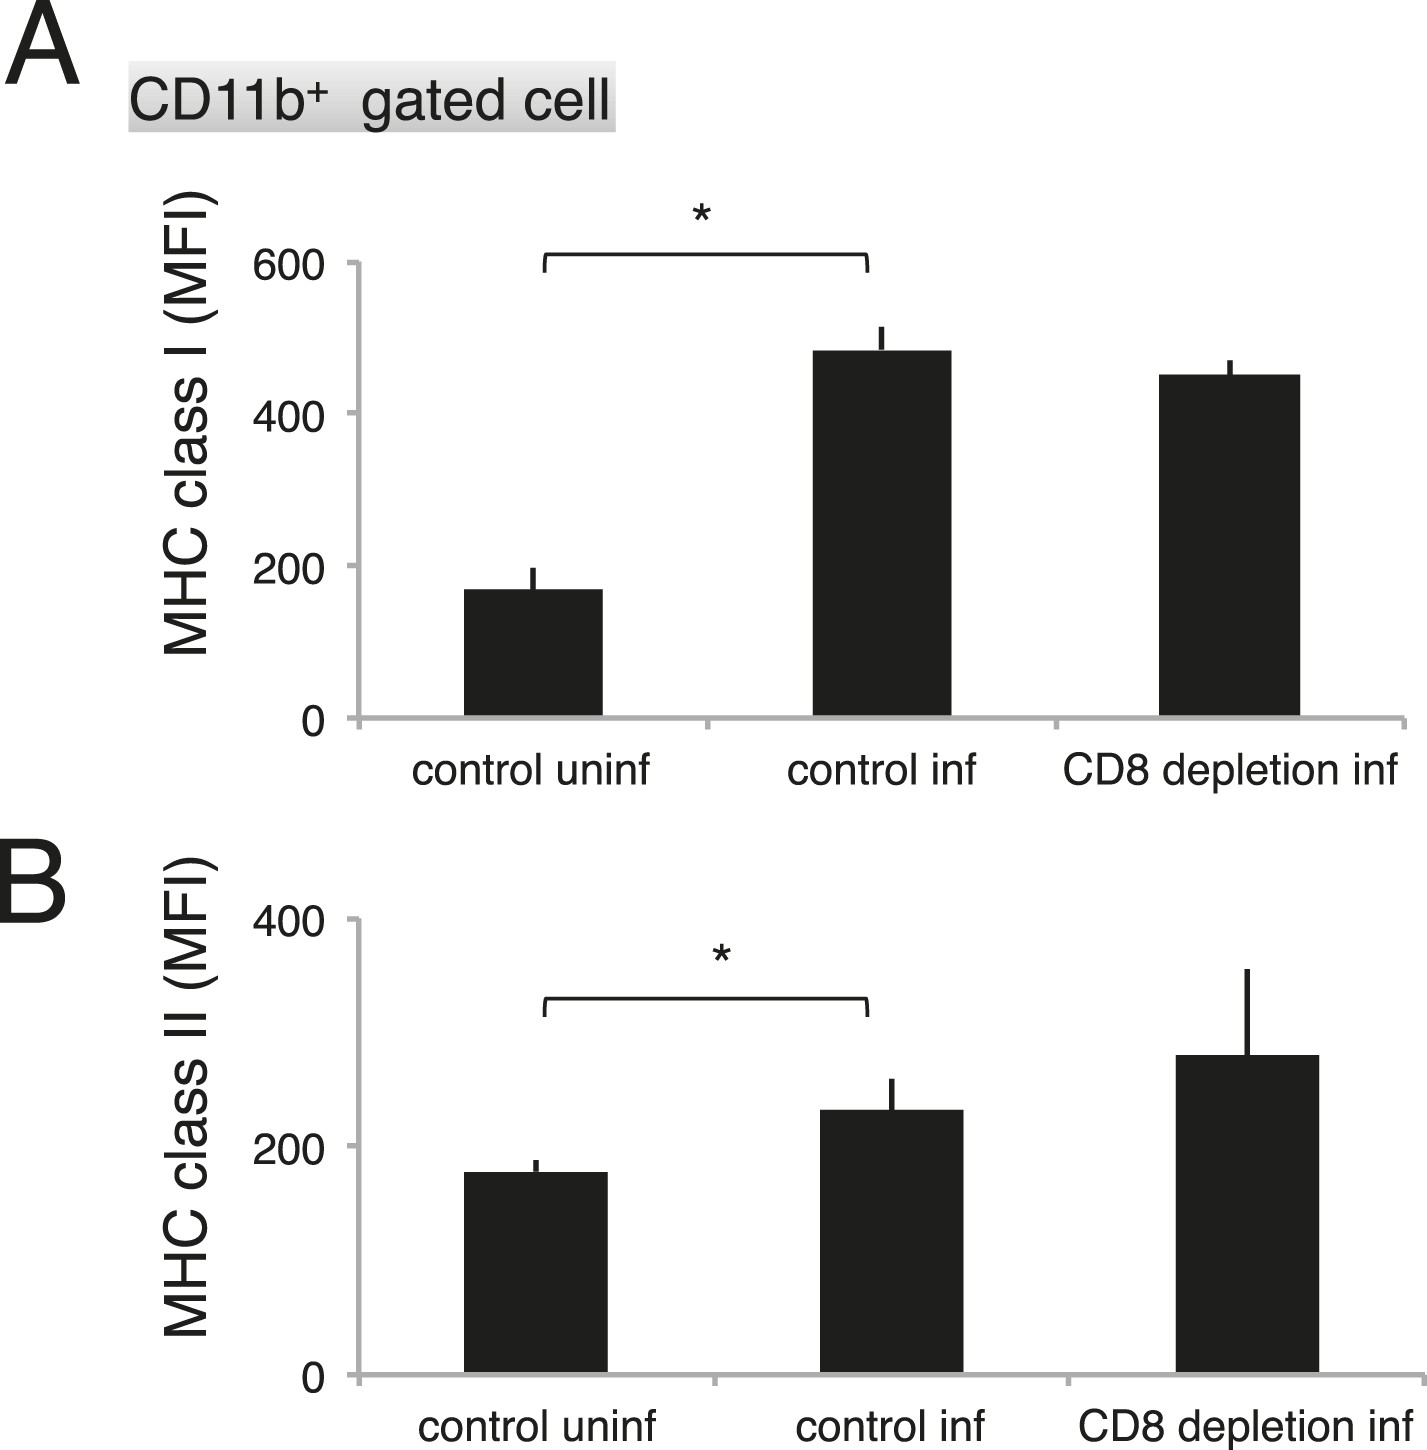
Depletion of CD8+ cells did not affect the activation of macrophages.
Spleen cells collected from the indicated mice 17 days after infection with PyNL were stained with anti-CD11b, anti-MHC class I, and anti-MHC class II antibodies. CD11b+ cells were analyzed for their expression of class I (A) and class II molecules (B). Values shown are the means ± SD of 3–5 mice in one experiment, representative of the two performed. *p < 0.05, Mann–Whitney U-test.
Figure 10
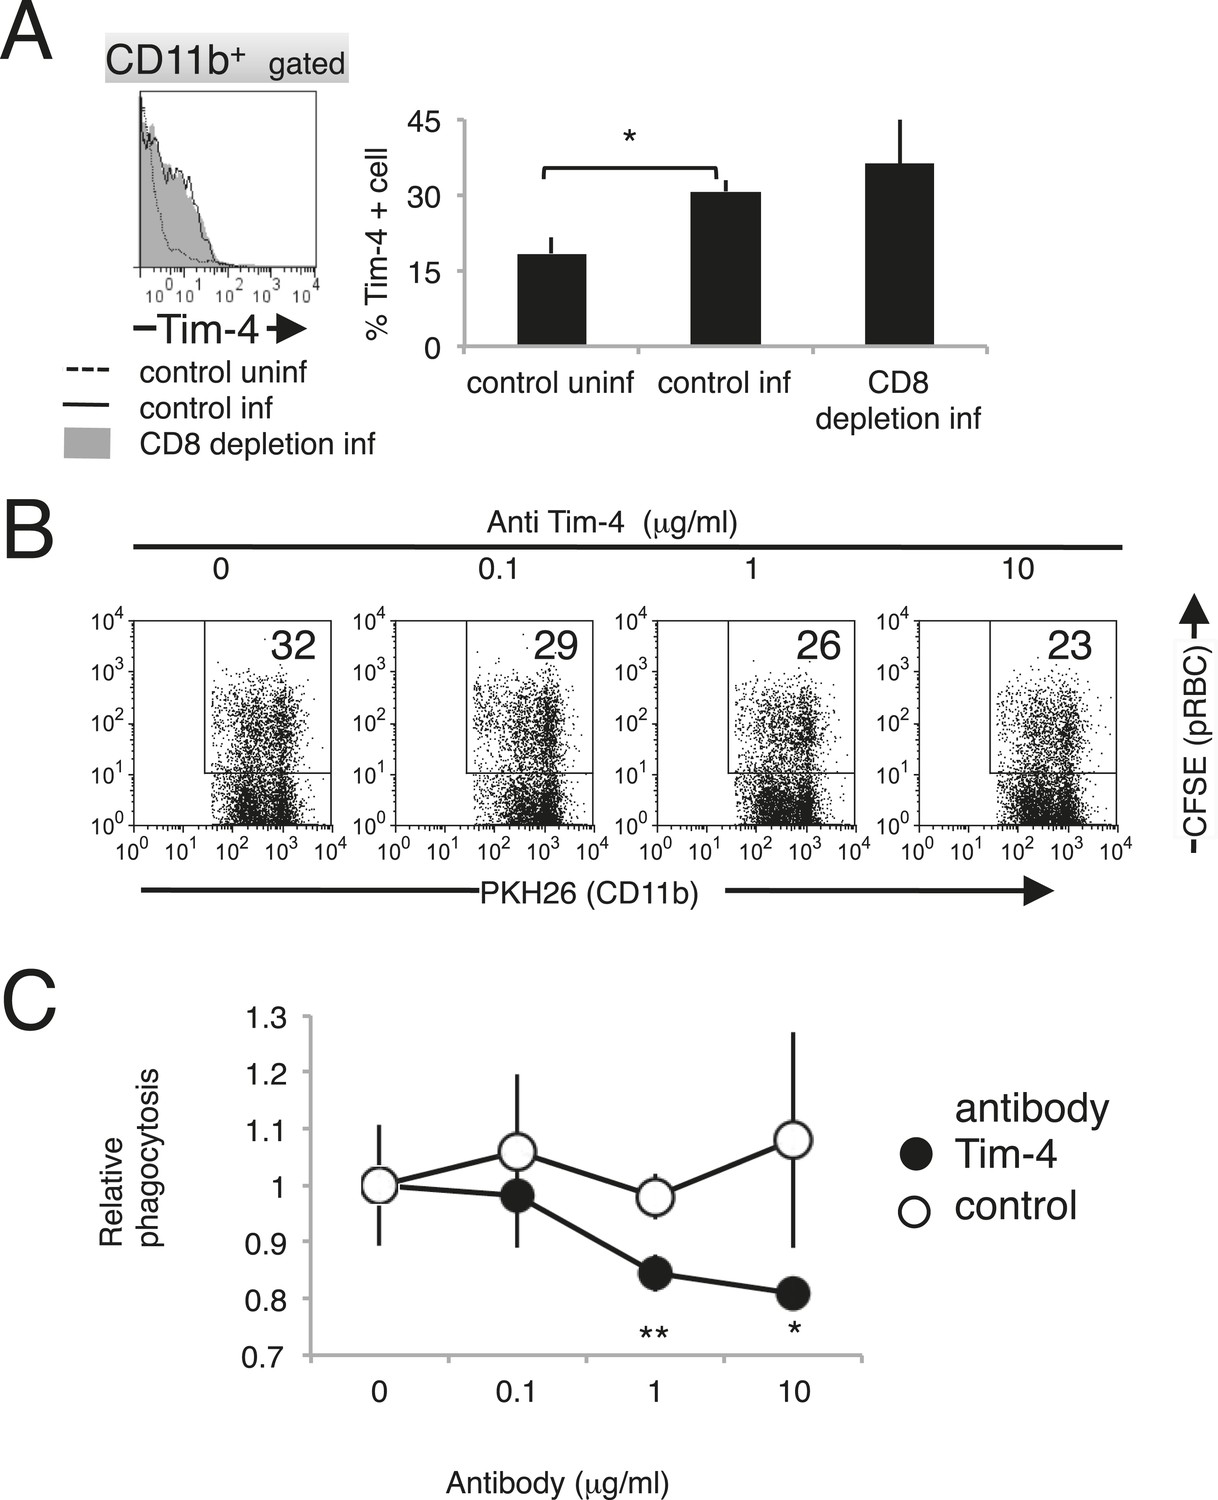
Tim-4 expressed on macrophages contributes to the phagocytosis of pRBCs.
(A) Infection with PyNL induced the expression of Tim-4 on macrophages. Spleen cells obtained from mice 17 days after infection were stained with anti-CD11b and anti-Tim-4 antibodies, and the CD11b+ cells were analyzed for Tim-4 expression. The expression levels of Tim-4 are shown in a histogram. Values in the bar graph are the means ± SD of six mice in two pooled individual experiments. *p < 0.05, Mann–Whitney U-test. (B) Addition of anti-Tim-4 antibody suppressed the phagocytosis of pRBCs by macrophages. PKH-labeled macrophages from uninfected mice were cultured with pRBCs isolated from WT mice 17 days after infection in the presence of the indicted concentrations of anti-Tim-4 antibody. The phagocytic macrophages were evaluated as in Figure 7D. (C) Inhibitory effects of anti-Tim-4 antibody on phagocytic cells were quantified as (% phagocytic macrophages in the presence of the antibody)/(% phagocytic macrophages in the absence of the antibody). Values are the means ± SD of triplicate cultures in one experiment, representative of the four performed. *p < 0.05 and **p < 0.01, Mann–Whitney U-test.
Download links
A two-part list of links to download the article, or parts of the article, in various formats.
Downloads (link to download the article as PDF)
Open citations (links to open the citations from this article in various online reference manager services)
Cite this article (links to download the citations from this article in formats compatible with various reference manager tools)
Cytotoxic activities of CD8+ T cells collaborate with macrophages to protect against blood-stage murine malaria
eLife 4:e04232.
https://doi.org/10.7554/eLife.04232


