CED-3 caspase acts with miRNAs to regulate non-apoptotic gene expression dynamics for robust development in C. elegans
- University of Colorado Boulder, United States
- Howard Hughes Medical Institute, University of Colorado Boulder, United States
Figures
Figure 1 with 1 supplement
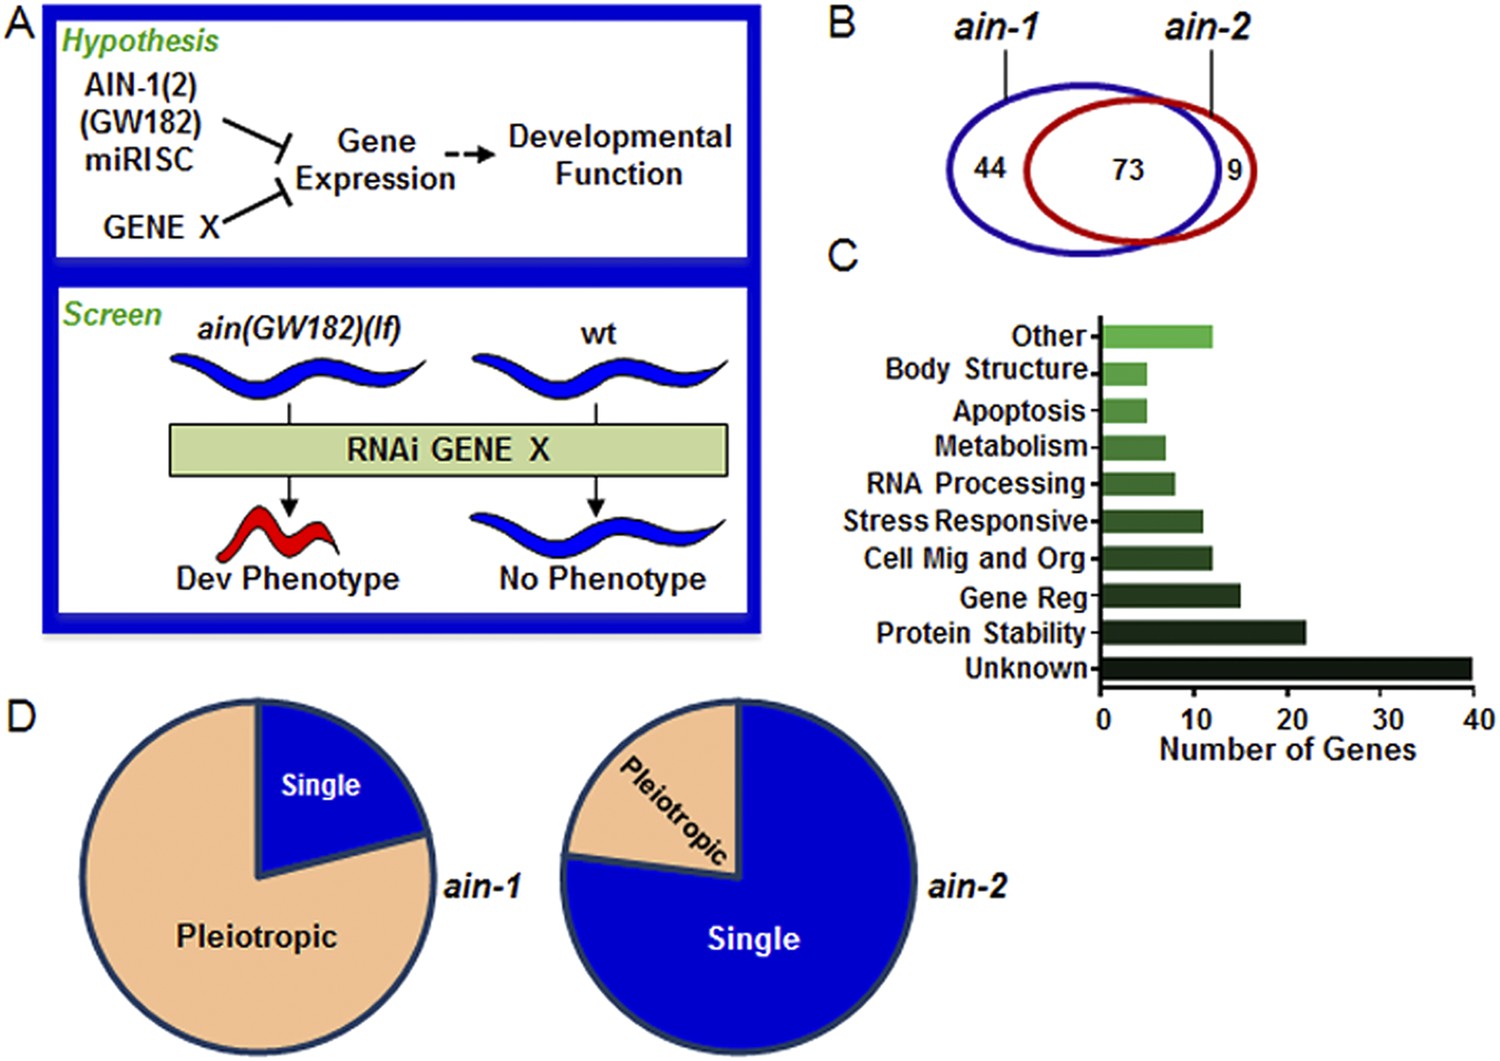
Genome-wide RNAi screen for genes that cooperate with miRISCs to regulate development.
(A) Rationale of enhancer screen strategy (detailed in Figure 1—figure supplement 1A). (B) The number of genes identified as interactors of either/both ain-1(lf) and/or ain-2(lf). (C) Distribution of the 126 interactors into functional categories (interactors listed in Supplementary file 2). (D) The proportion of genes exhibiting singular vs pleiotropic RNAi phenotypes with ain-1(lf) or ain-2(lf) (detailed phenotypic frequencies shown in Figure 1—figure supplement 1B).
Figure 1—figure supplement 1
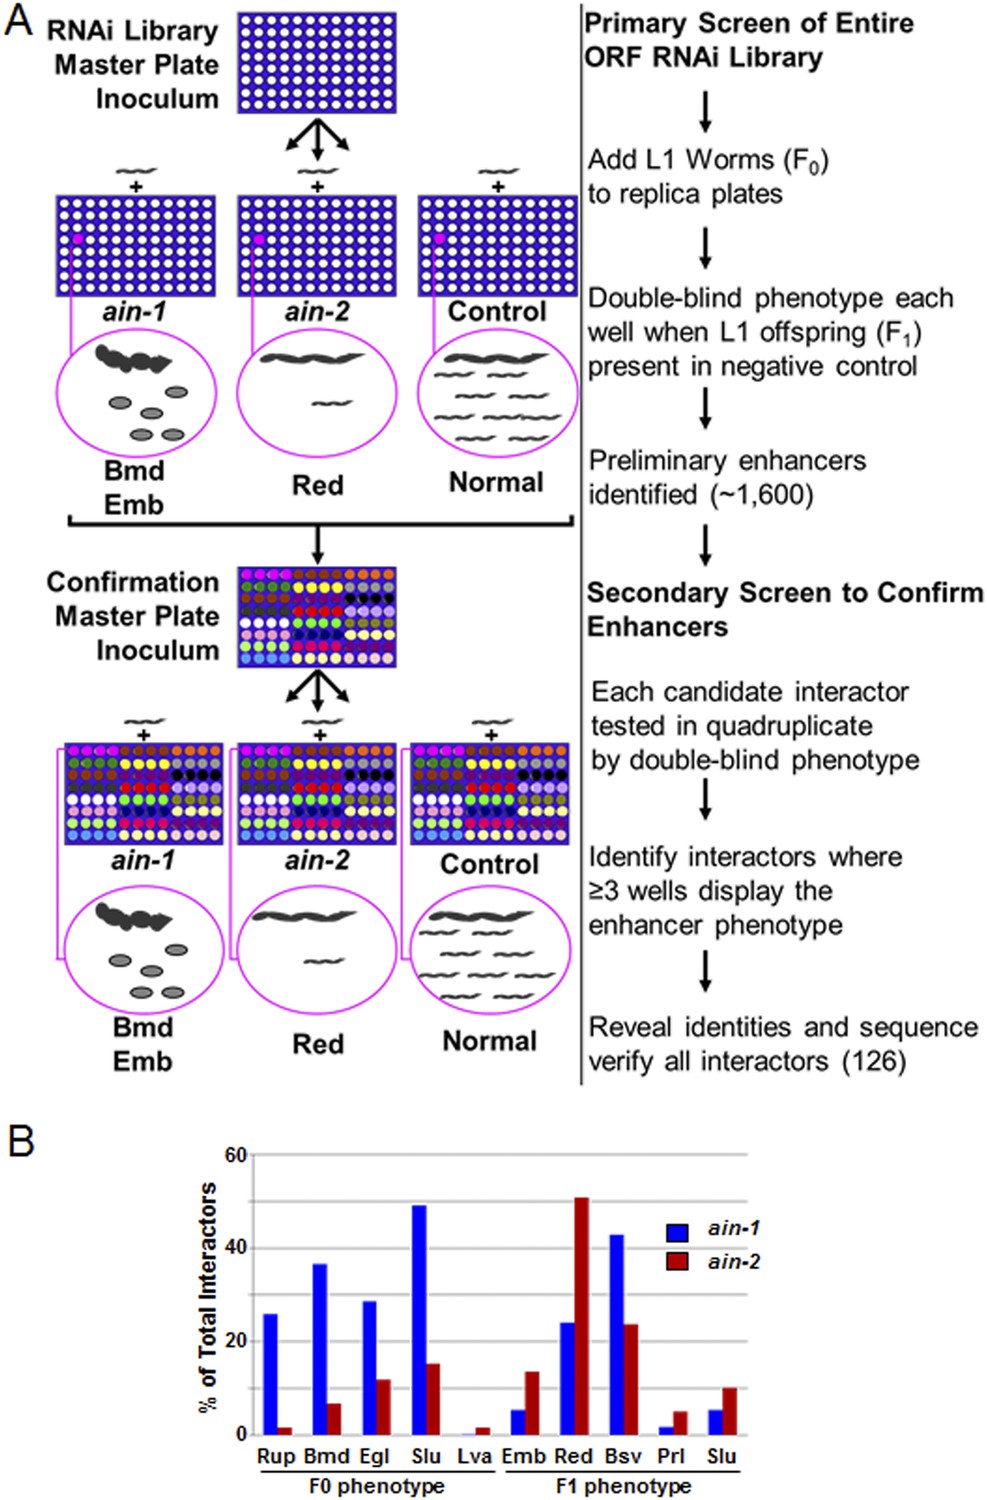
RNAi screen strategy and frequencies of phenotypes.
(A) Cartoon diagram illustrating steps of the screen performed for the entire ORF RNAi library using liquid culture 96-well format. We included the RNAi-sensitizing mutation, rrf-3(lf), with ain-1(lf) and ain-2(lf) to increase screen sensitivity and therefore used rrf-3(lf) alone for the control. In the double blind, we identified genes where the RNAi effect for the control was mostly normal but where ain-1(lf) or ain-2(lf) showed an obvious enhancer phenotype (as defined in Supplementary file 1). Example phenotypes body morphology defect (Bmd), embryonic lethality (Emb), and reduced brood size (Red) are depicted for illustration purposes only. Confirmations were performed in quadruplicate in the double blind. These interactors were all then revealed and sequence-verified. (B) Frequency of phenotypes observed in the RNAi screen. The three letter phenotypes indicated here are all defined in Supplementary file 1 and are depicted here as the frequency of occurrence amongst interactors for either ain-1 or ain-2. Due to pleiotropism, the sum of the phenotypes will exceed 100%. All genes identified in the screen with individual phenotypes are listed in Supplementary file 2.
Figure 2 with 3 supplements
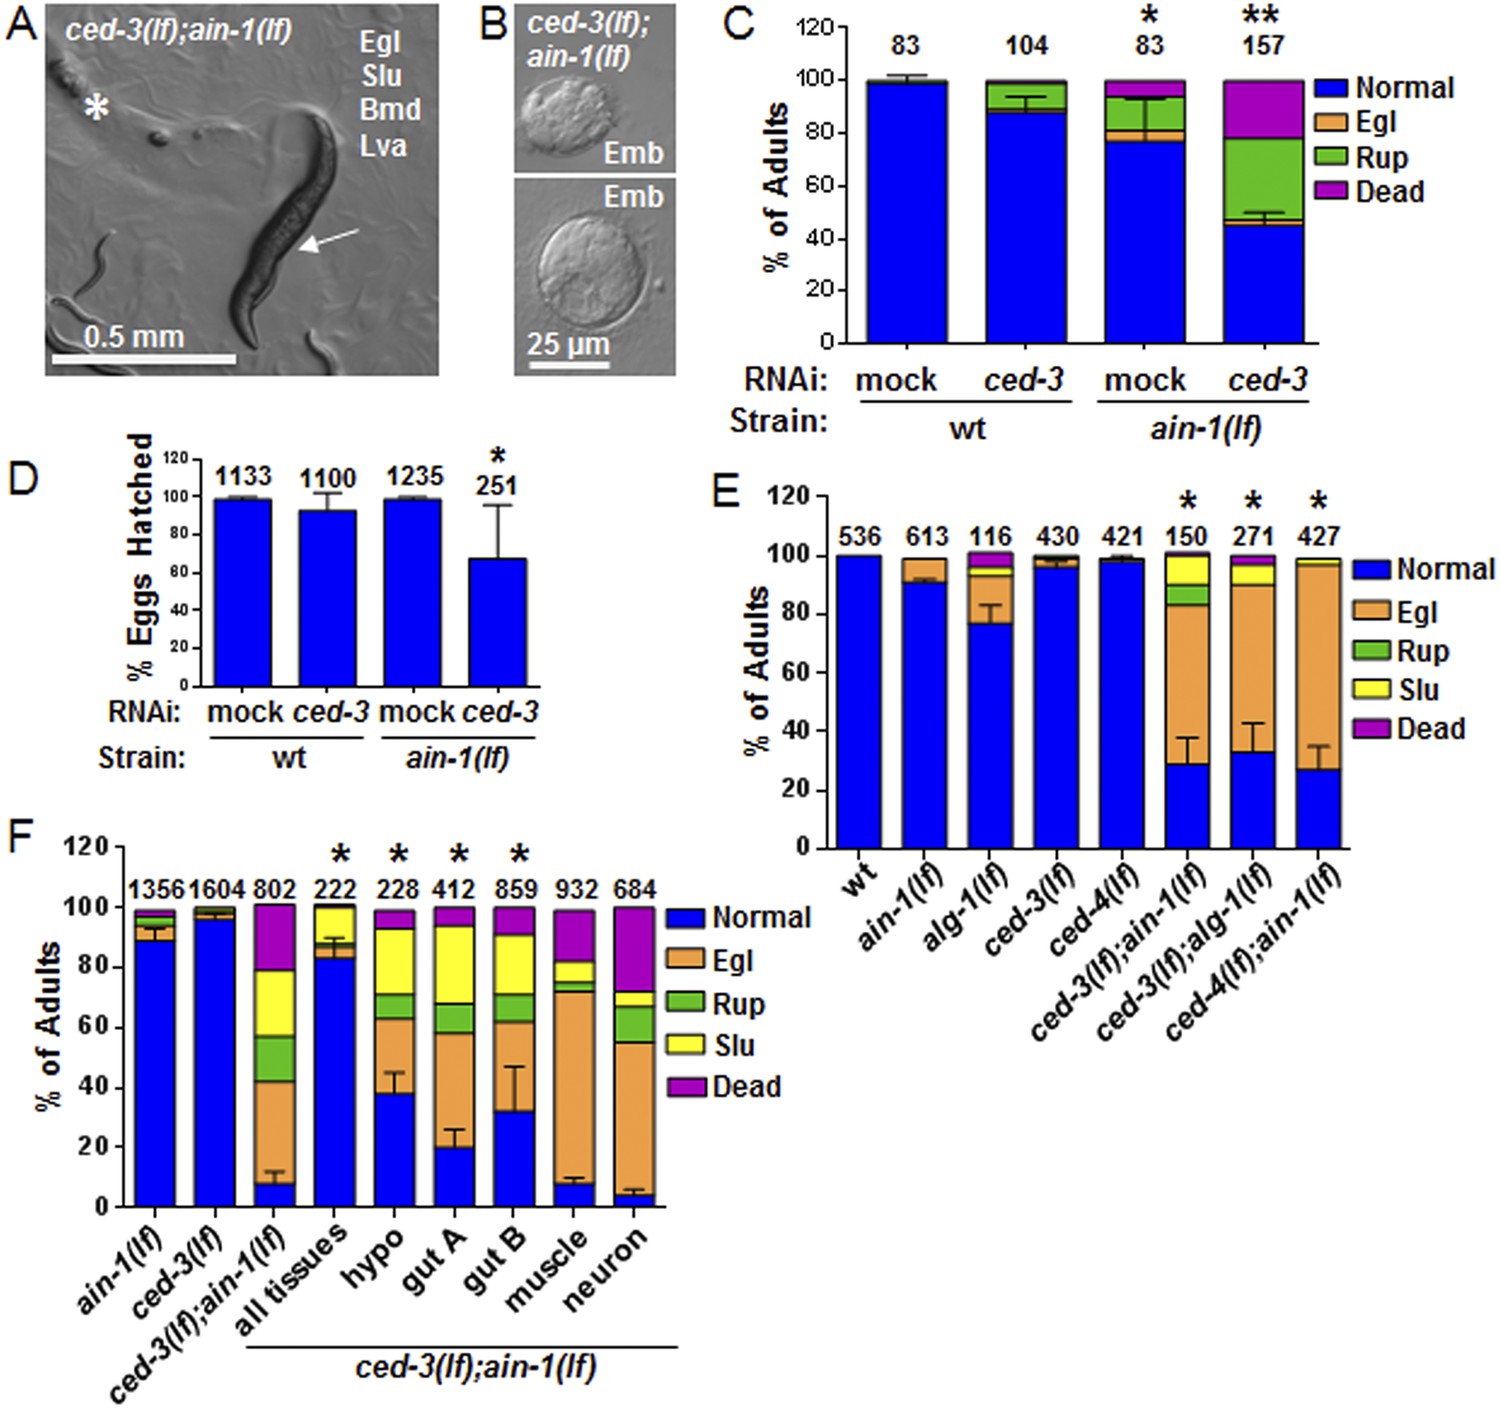
C. elegans strains compromised in both miRISC and ced-3 functions have significant pleiotropic developmental phenotypes.
(A and B) Microscopic images showing the pleiotropic phenotypes of the ced-3(lf);ain-1(lf) double mutant, including egg-laying defect (Egl), sluggish movement (Slu), body morphology defects (Bmd), larval arrest (Lva), and embryonic lethality (Emb). Asterisk in (A) indicates an Egl animal that was devoured by internally hatched progeny, and the arrow indicates an adult animal with multiple defects (Egl, Slu and Bmd). Figure 2—figure supplement 1 shows the phenotype of another interactor, ceh-18, which is very different from ced-3, supporting distinct physiological relevance of the identified interactors. (C) ced-3(RNAi) significantly enhanced the frequency of ain-1(lf) phenotypes. Mean values ± SD for percent normal (p < 0.001, *compared to wt with mock RNAi, **compared to all others, Chi-square test comparing the distributions of phenotypes). Number of worms tested indicated above each bar (same for all figures). (D) Mean values ± SD of embryonic lethality (p < 0.05 **compared to all, Mann–Whitney test). (E) Enhancement of miRISC phenotypes by ced-3(lf) and ced-4(lf). Mean values ± SD for percent normal (p < 0.0001, *compared to each of the relevant single mutants, Chi-square test comparing the distributions of phenotypes). Other ain-1 and ced-3 alleles (Figure 2—figure supplement 2) and the ain-1 interaction with egl-1 (Figure 2—figure supplement 3) were also tested. (F) Rescue effects of expressing ain-1 or ain-2 in specific tissues (driven by tissue-specific promoters for the four principal tissues of C. elegans including the hypodermis, gut, muscle, and nerve; see ‘Materials and methods’) in the ced-3(lf);ain-1(lf) double mutants. ‘All tissues’ indicates a genomic ain-1 transgene. Mean values ± SD for percent normal [p < 0.0001, Fisher's Exact test comparing the distribution of normal and abnormal animals for each rescue to ced-3(lf);ain-1(lf) without rescue (see ‘Materials and methods’ for statistical rationale)].
-
Figure 2—source data 1
Source data quantifying genetic interactions between the miRISC and cell death pathways.
(A) Source data for Figure 2C, (B) Source data for Figure 2D, (C) Source data for Figure 2E, (D) Source data for Figure 2F, (E) Source data for Figure 2—figure supplement 1B, (F) Source data for Figure 2—figure supplement 2A, (G) Source data for Figure 2—figure supplement 2B, (H) Source data for Figure 2—figure supplement 2C, (I) Source data for Figure 2—figure supplement 2D, (J) Source data for Figure 2—figure supplement 3B.
- https://doi.org/10.7554/eLife.04265.006
Figure 2—figure supplement 1
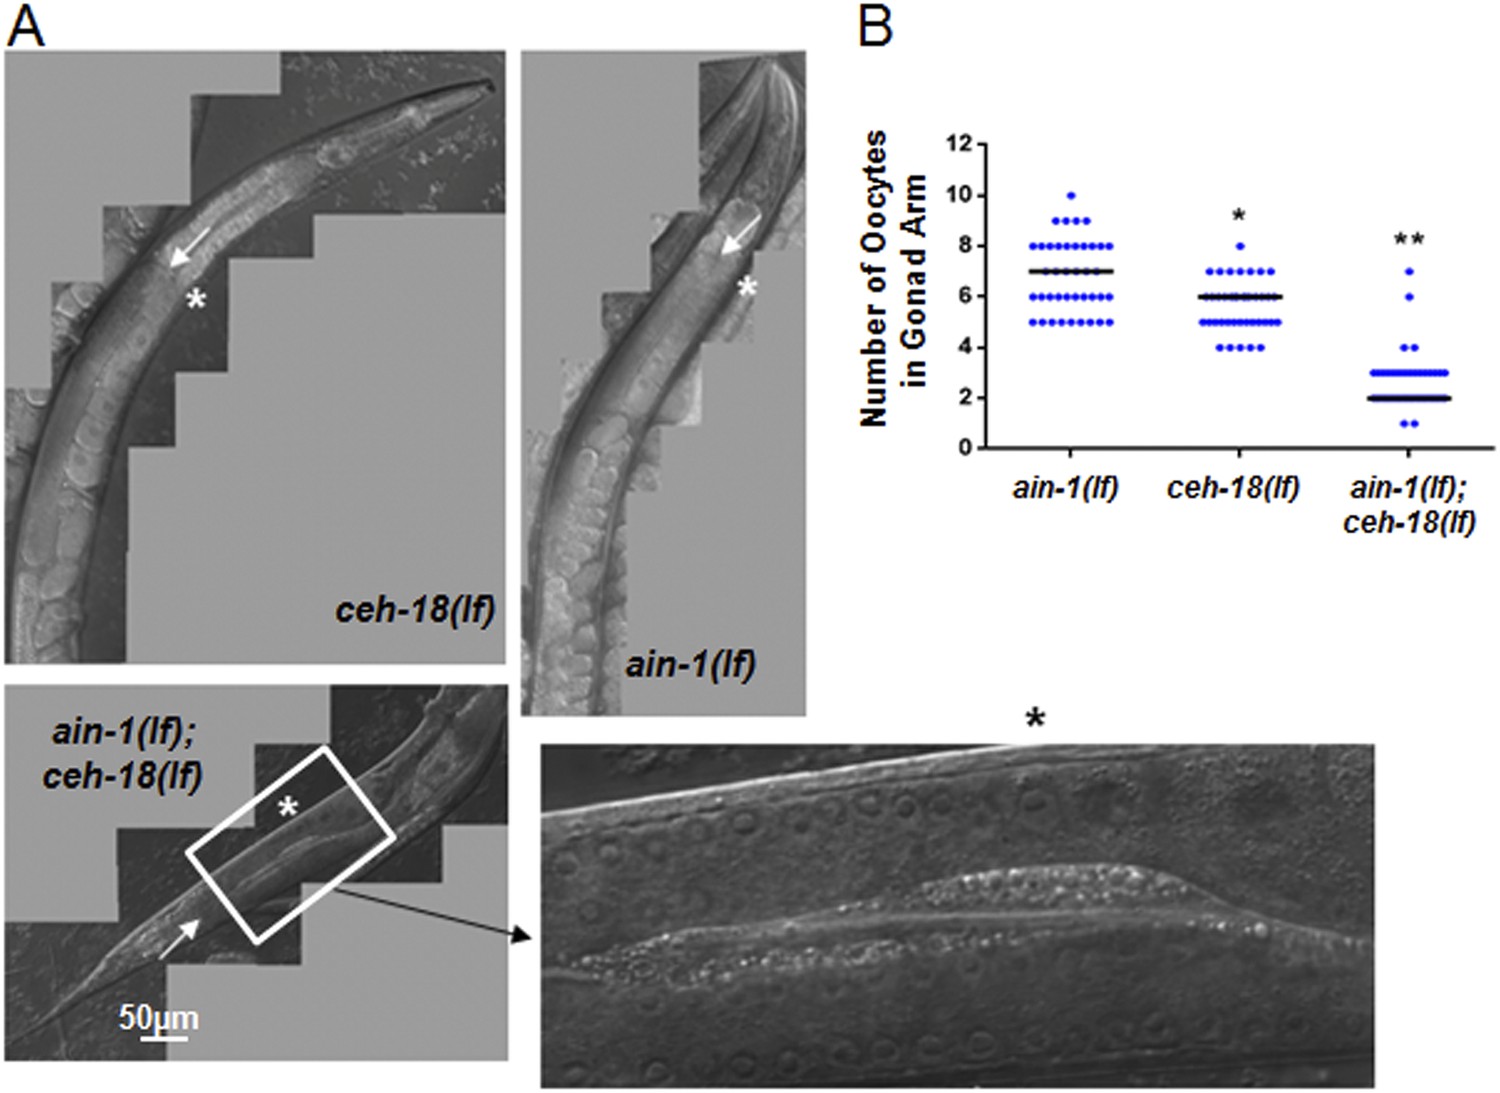
ain-1(lf);ceh-18(lf) double mutants have reduced oocytes.
DIC images of gonads from single and double mutant animals. (A) Arrows indicate the farthest point for the gonad turn. Asterisks are located near the first identifiable oocyte in the given gonad arm. The expanded segment is a digital zoom-in to show the morphological detail of the double mutant gonad for the indicated segment. (B) Dot plot of the oocyte counts per gonad arm (n = 40 for each strain). Each dot represents the number of oocytes in one gonad arm and the median values are given by black bars for each strain (p < 0.001, *compared to ain-1(lf) and **compared to both ain-1(lf) and ceh-18(lf) alone, Mann–Whitney test). The distinct phenotypes observed amongst some of the genetic interactors, such as ced-3 (shown in Figure 2) vs ceh-18 suggest distinct physiological functions and argue against general sickness of the single mutants. This conclusion is also supported more broadly by the frequency of phenotypes observed (Figure 1—figure supplement 1B) such that equal frequency is not observed across the various phenotypes.
Figure 2—figure supplement 2
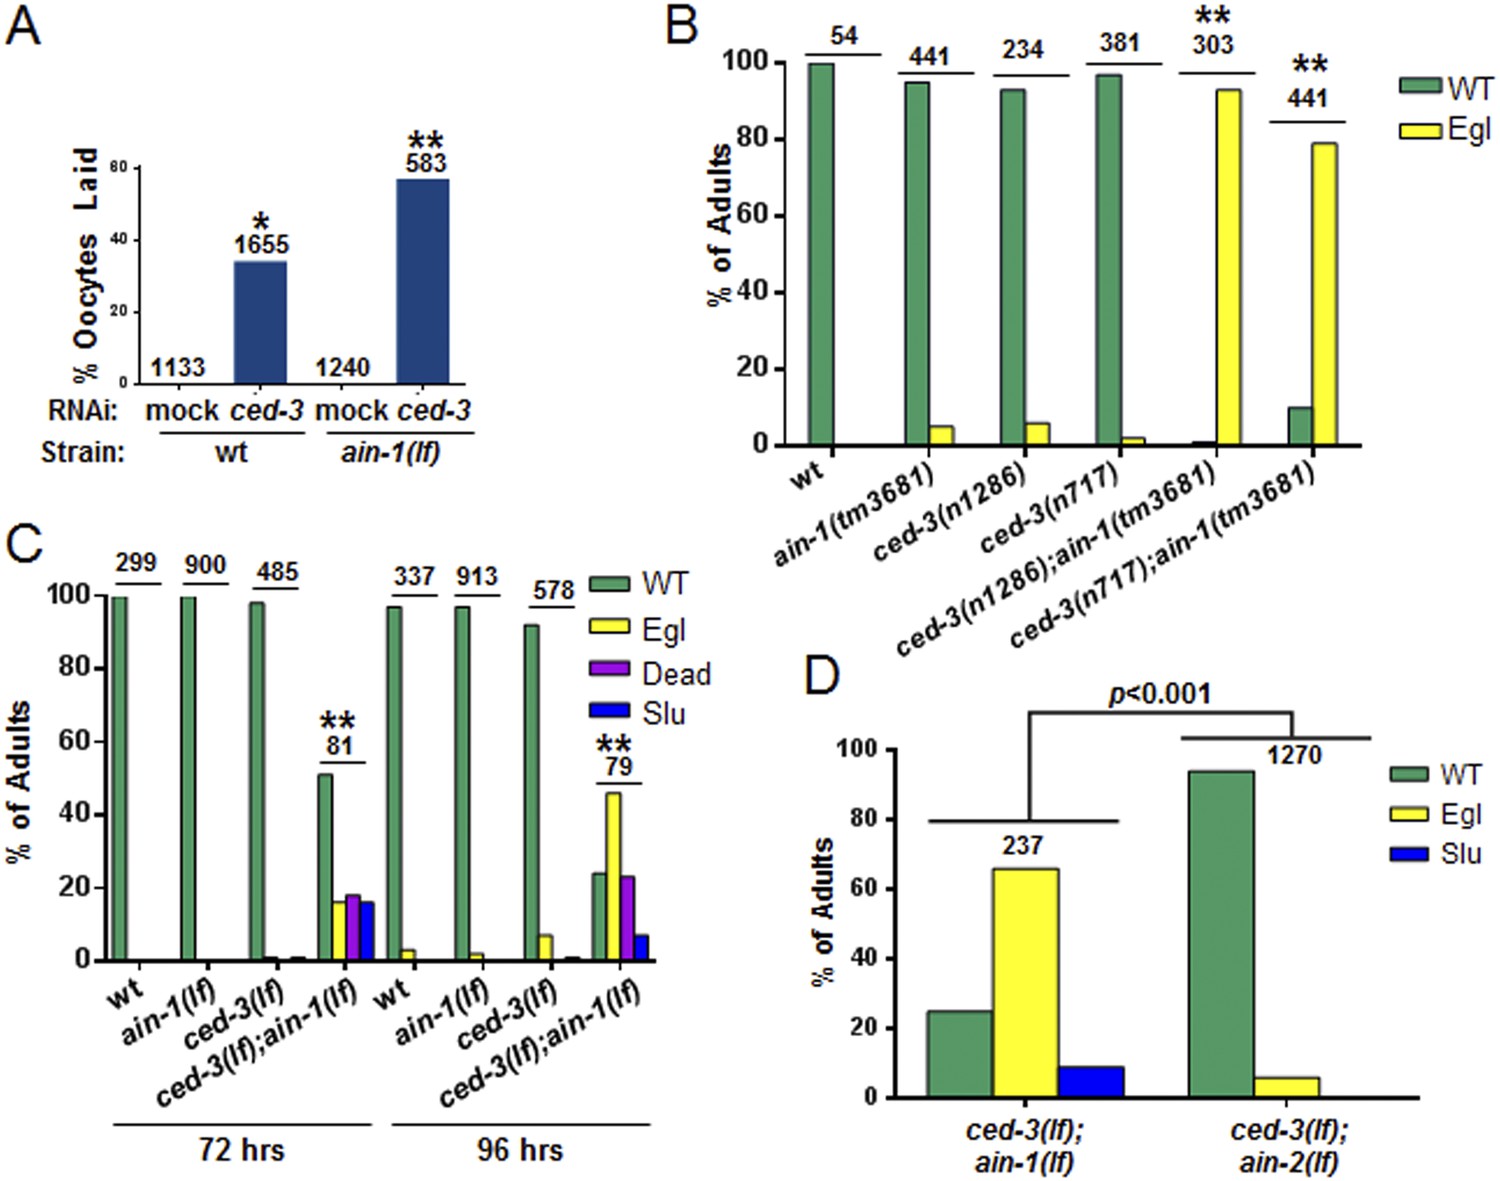
Additional phenotypes of ced-3(lf);ain-1(lf) and test of other alleles.
(A) ain-1(lf) animals treated with ced-3(RNAi) have a significant increase in oocytes laid (p < 0.0001, *compared to wt mock, **compared to all others, Mann–Whitney test). (B) Developmental defects associated with ced-3(lf);ain-1(lf) double mutants were observed for other ain-1(lf) and ced-3(lf) alleles. Bar graph showing the synergistic effect between ain-1(tm3681) and two ced-3(lf) alleles on the egg-laying defective (Egl) phenotype. Animals were scored 5 days after eggs were placed on plates. The mean values are shown (**p < 0.001 compared to wt and each of the relevant single mutants, Fisher's exact test). (C) Phenotypes of adults scored at two time points after synchronized first stage larvae were placed on OP50 food. In panel (C), and elsewhere in the study, unless noted, the ain-1(ku322) and ced-3(n1286) alleles were used (**p < 0.001, relative to wt and single mutants, Fisher's exact test comparing the distribution of normal and abnormal animals). (D) The ced-3(lf);ain-2(lf) double mutant adults are phenotypically comparable to the ced-3(lf) single mutant adults in (C) at 96 hr on OP50 food following synchronization (p < 0.001, Chi-square analysis). For all panels: Slu, sluggish or immobile; Egl, egg-laying defective; Rup, ruptured through vulva. Number of worms tested is indicated above each bar.
Figure 2—figure supplement 3
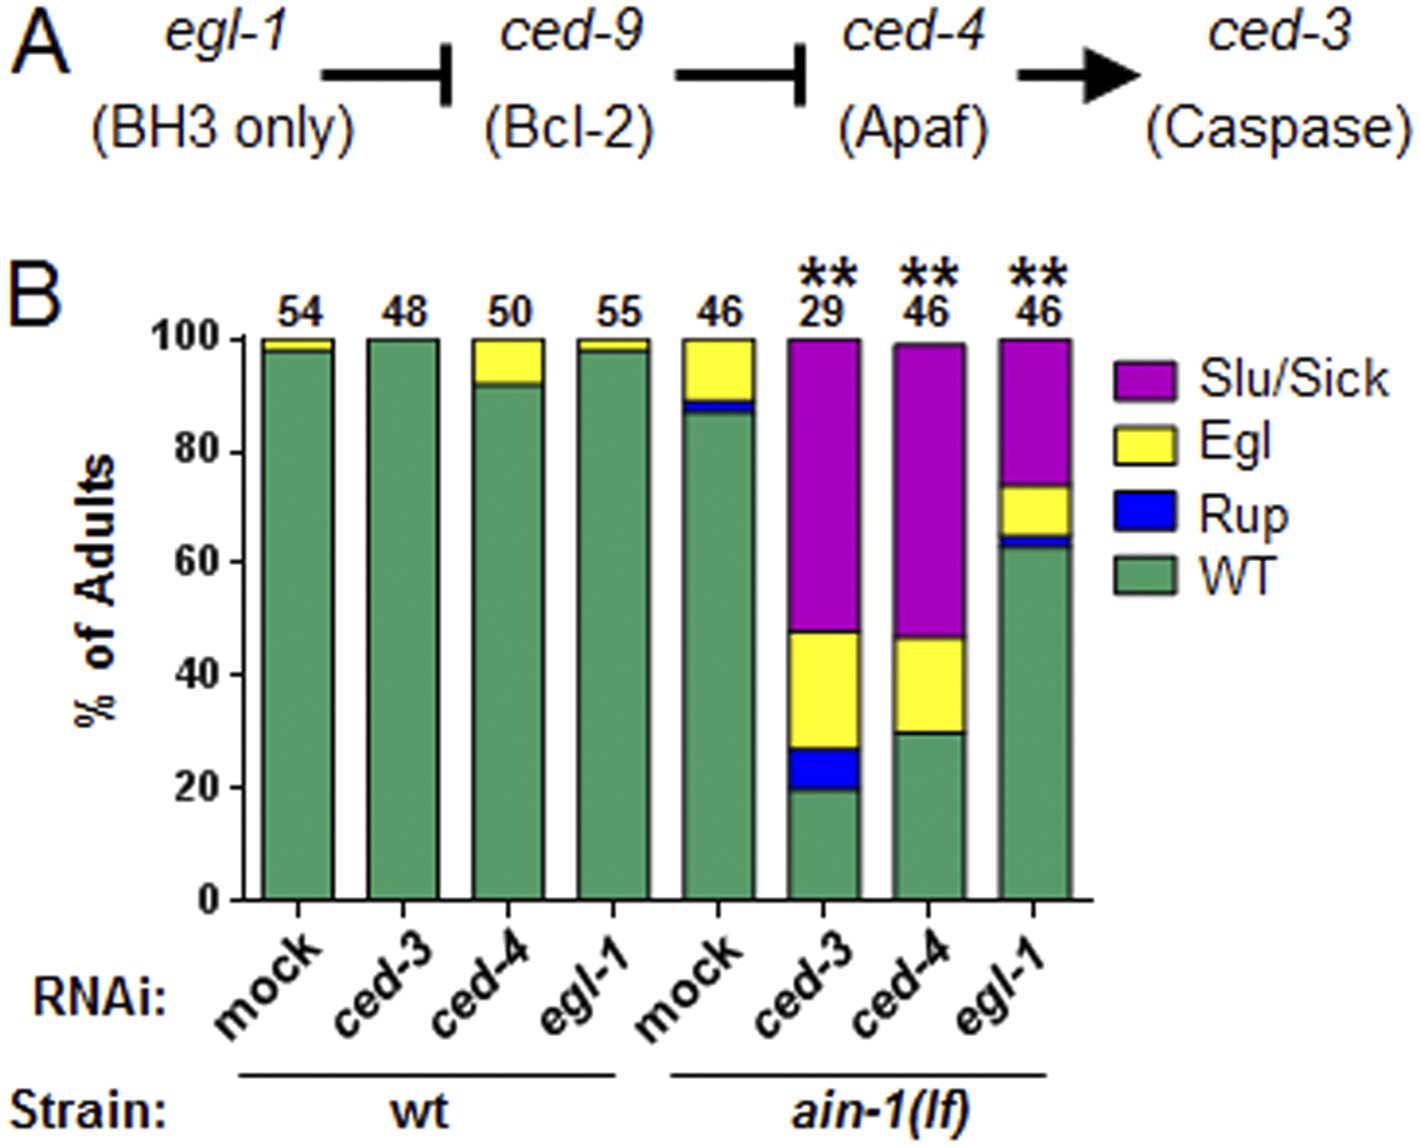
The core apoptotic regulatory pathway acts in parallel to miRISC for normal development.
(A) Core apoptotic regulatory pathway with C. elegans gene names indicated (mammalian counterparts in parentheses). (B) The phenotypes observed for ced-3(lf);ain-1(lf) were observed when combining ain-1(lf) with RNAi of upstream components of the ced-3 pathway. The ain-1(lf) single mutant shows enhanced defects when treated with ced-3, ced-4, or egl-1 RNAi for two RNAi generations. Significance of phenotypes when wt and ain-1(lf) animals were fed the indicated RNAi was determined [**p < 0.001, relative to both ain-1(lf) fed mock RNAi and to wt fed the given RNAi, Fisher's exact test comparing the distributions of normal and abnormal animals (see ‘Materials and methods’ for statistical rationale)].
Figure 3
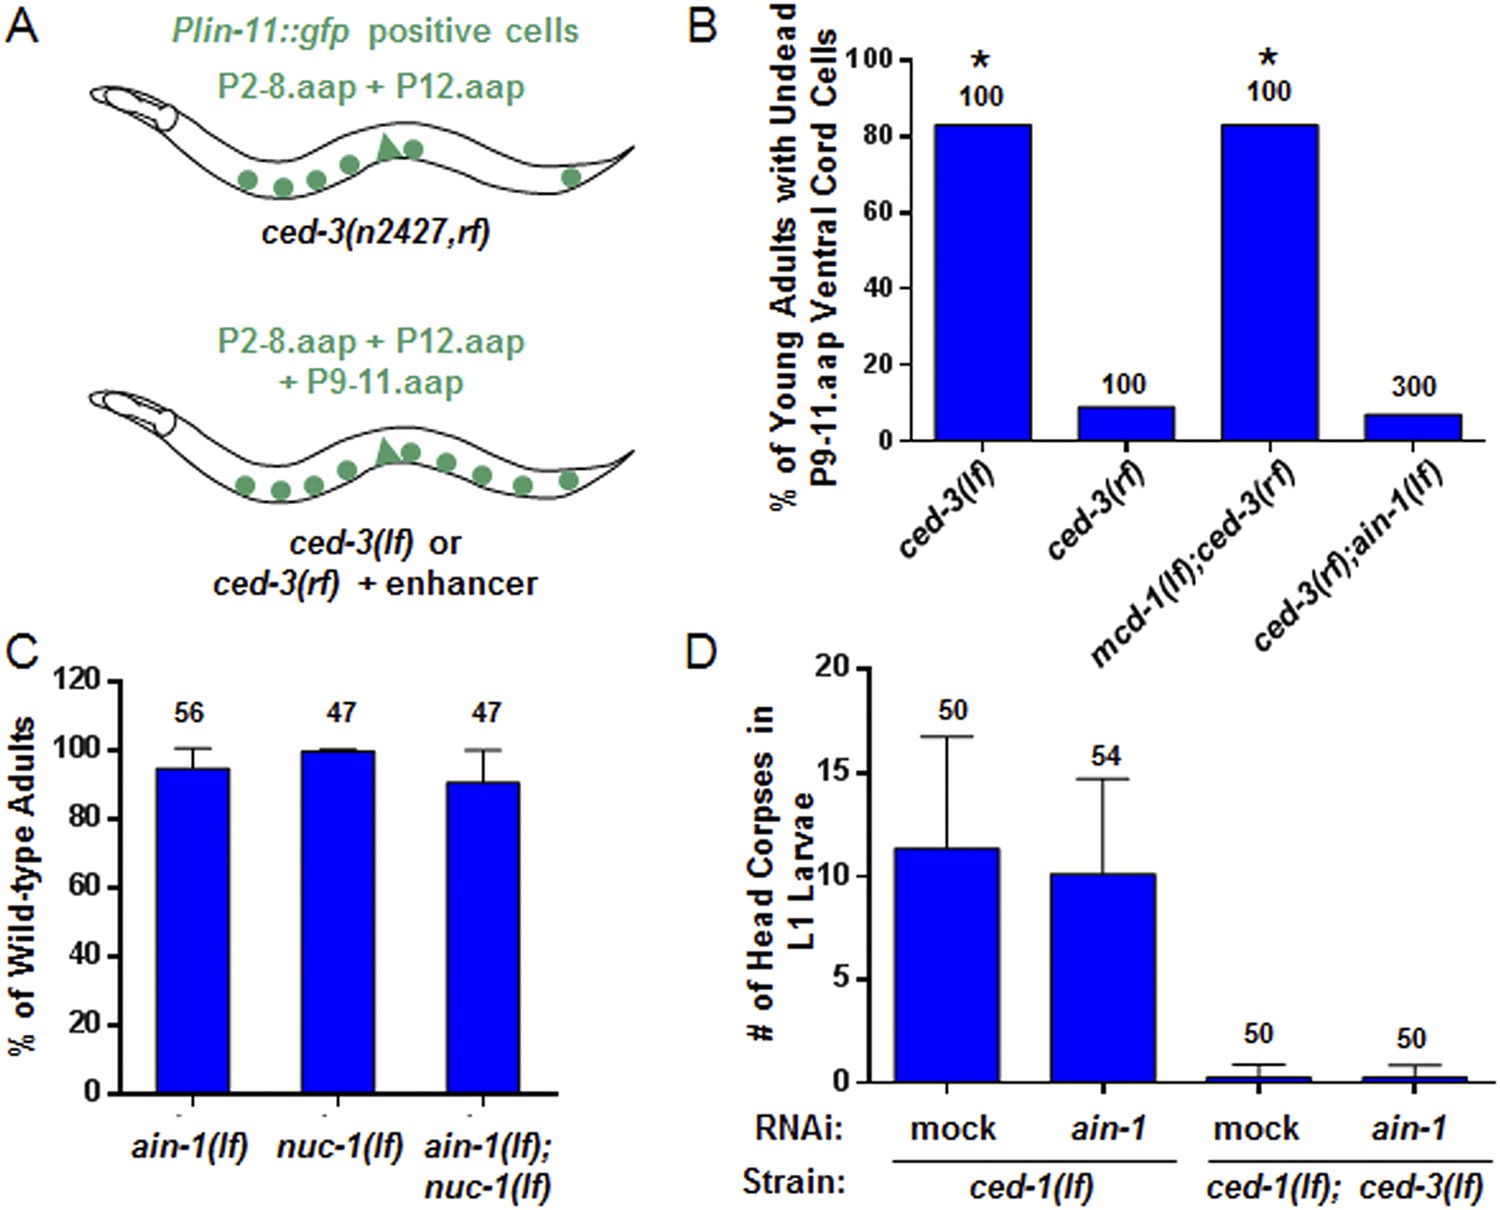
ain-1(lf) does not alter cell-death phenotypes.
(A) Cartoon illustrating a previously established enhancer assay using a reduction-of-function (rf) ced-3 allele (Reddien et al., 2007). (B) ain-1(lf) does not enhance the cell death defect of a ced-3(rf) mutation (p < 0.0001, *compared to ced-3(rf), Mann–Whitney test). (C) No enhanced interaction between ain-1(lf) and nuc-1(lf). Mean values ± SD (no significant difference, Fisher's Exact test comparing the distributions of normal and abnormal animals of the ain-1(lf);nuc-1(lf) double mutant to the single mutants). (D) ain-1(RNAi) does not alter apoptotic events as indicated by L1 head corpses that fail to occur in ced-3(lf) mutants. The ced-1(lf) mutation was used to enhance visualization of head corpses (Ledwich et al., 2000). Mean values ± SD (no significant difference, Mann–Whitney test).
-
Figure 3—source data 1
Source data quantifying apoptotic assays.
- https://doi.org/10.7554/eLife.04265.011
Figure 4 with 1 supplement
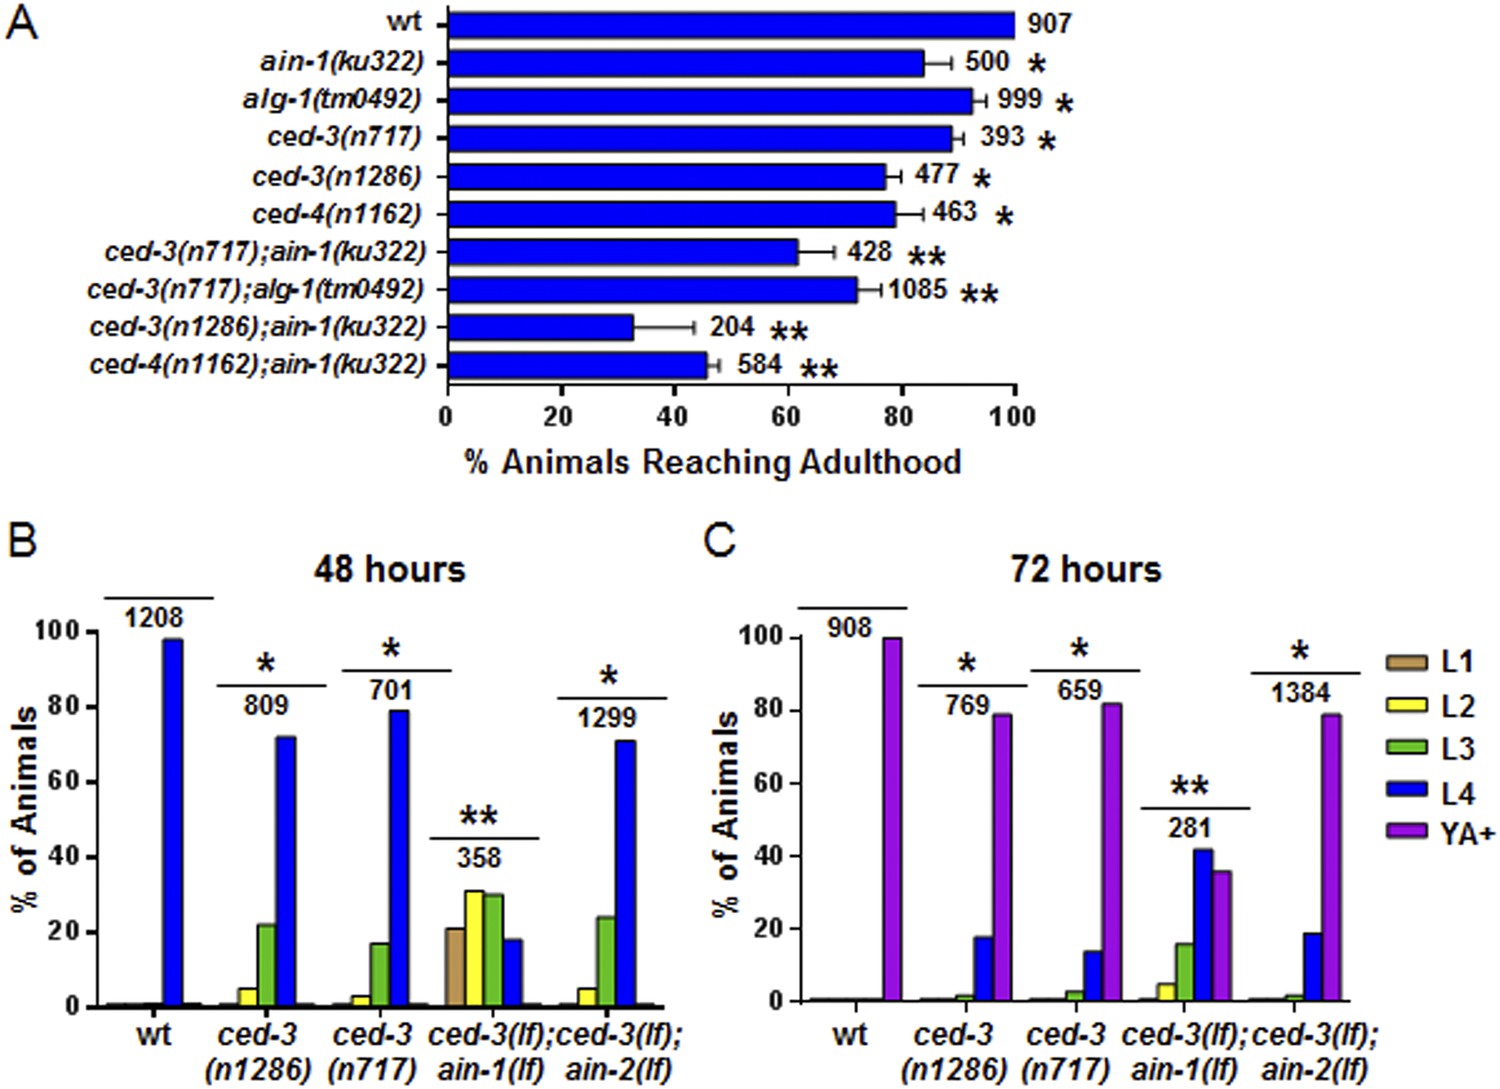
Loss of ced-3 function slows the rate of post-embryonic development.
(A) Percent of animals reaching adulthood at 96 hr after hatching is shown. Mean ± SD (p < 0.0001, *compared to wt, **compared to the relevant single mutants, Fisher's Exact test comparing the distributions of adult to larval-stage animals at this time). (B and C) Distribution of stages at 48 hr and 72 hr with food (p < 0.0001, *compared to wt, **compared to the relevant single mutants, Chi-square test comparing the distributions of all stages). Also see Figure 4—figure supplement 1.
-
Figure 4—source data 1
Source data quantifying post-embryonic growth rates.
(A) Source data for Figure 4A, (B) Source data for Figure 4B, (C) Source data for Figure 4C, (D) Source data for Figure 4—figure supplement 1A, (E) Source data for Figure 4—figure supplement 1B.
- https://doi.org/10.7554/eLife.04265.013
Figure 4—figure supplement 1
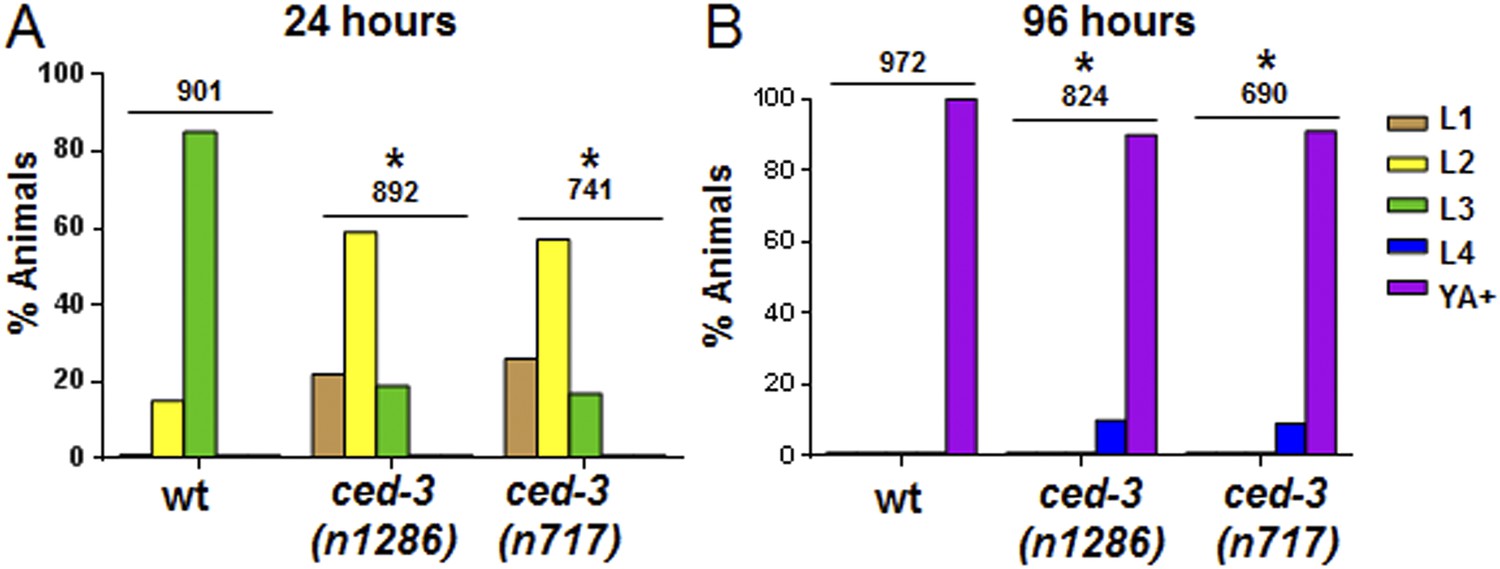
ced-3(lf) mutants displayed a mild but significant reduction in the rate of post-embryonic development.
(A and B) Animals were synchronized 36 hr in M9 buffer at 20°C then placed on standard bacteria food (OP50) and staged every 24 hr thereafter. Data for 24 and 96 hr are shown here and data for 48 and 72 hr are shown in Figure 4B–C. The distribution of animals from first larval stage (L1) through young adult/adult (indicated as YA+) is shown (p < 0.0001, *compared to wt, Chi-square analysis comparing the distributions of stages). Number of worms indicated above each set.
Figure 5
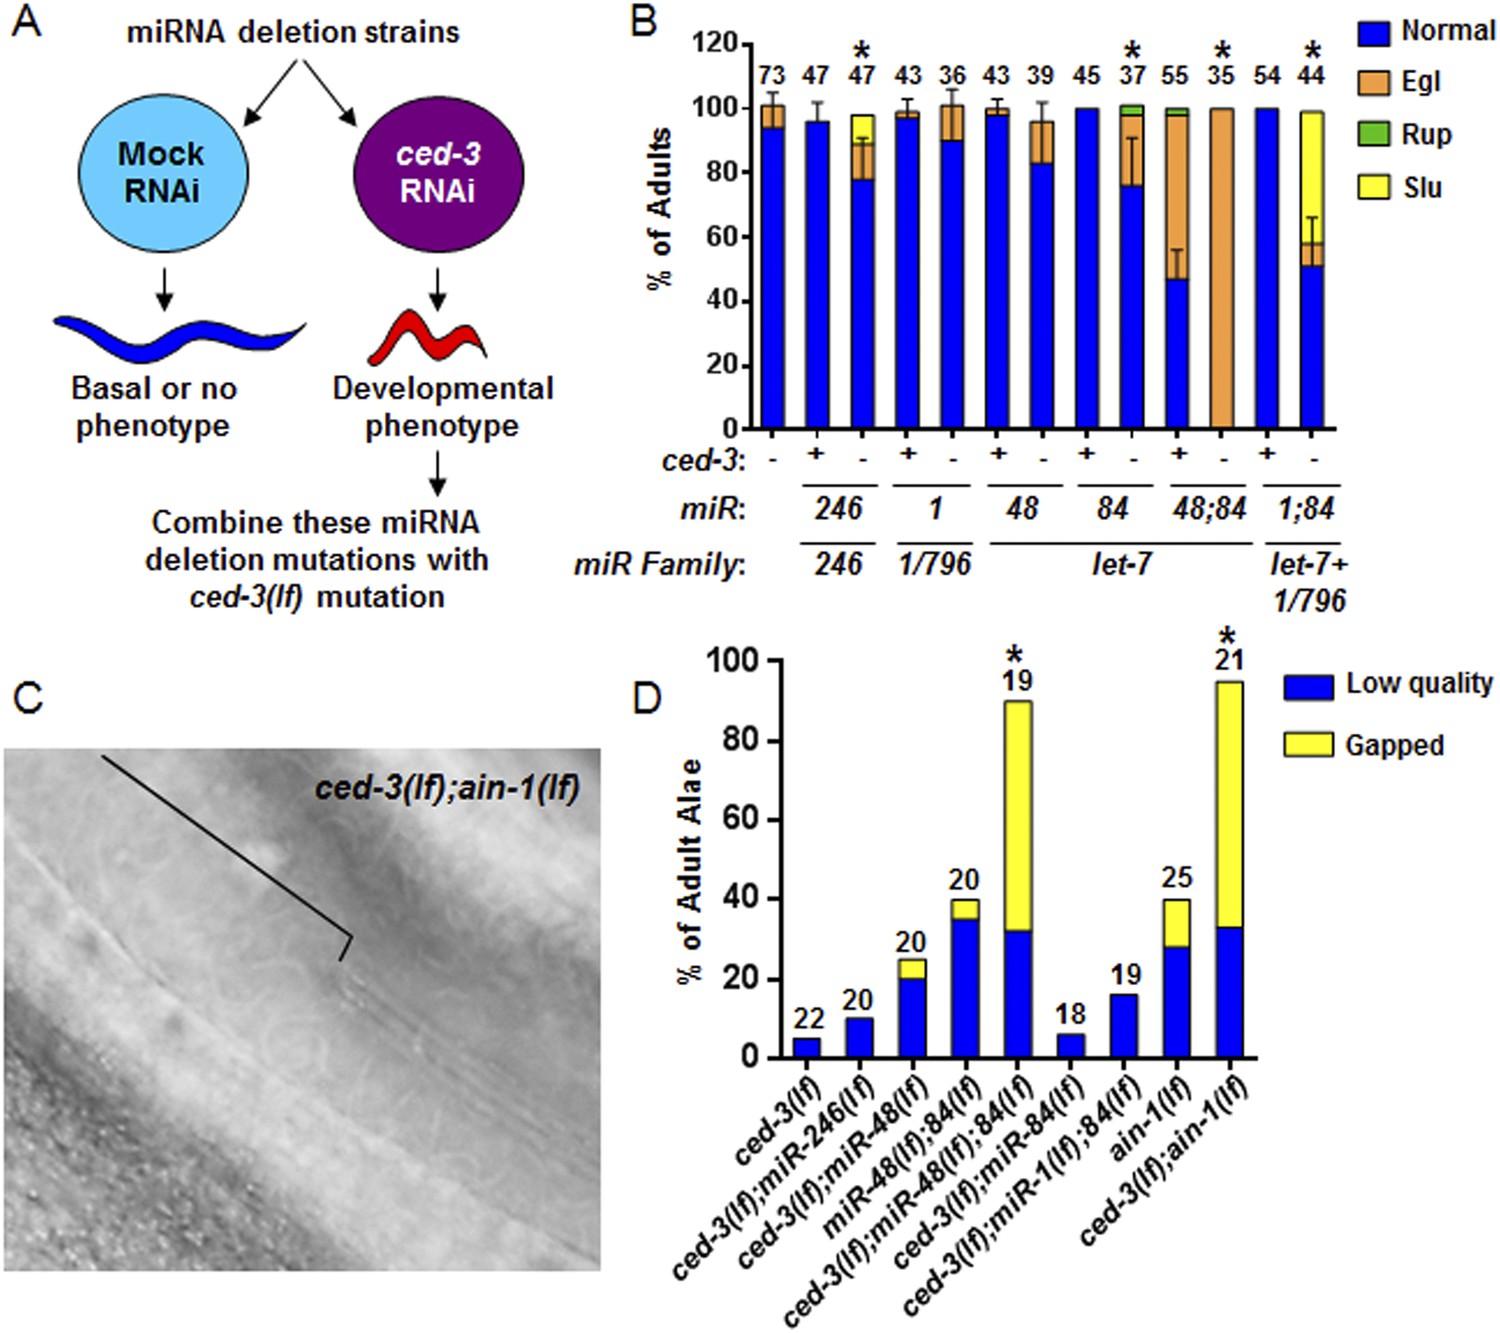
Identification of specific miRNAs that cooperate with ced-3 caspase to regulate development.
(A) Diagram for screening miRNA deletion mutants (listed in Supplementary file 4) when fed mock or ced-3 RNAi to identify overt developmental phenotypes when ced-3 was depleted. let-7(lf) and lin-4(lf) mutants were excluded due to significant defects alone. (B) miRNA deletion(s) [indicated by the miR number(s)] identified in (A) were combined with ced-3(lf). ‘+’ and ‘−’ indicate wild-type and ced-3(null), respectively. Phenotypes including egg-laying defect (Egl), ruptured vulva (Rup), and sluggish movement (Slu) were quantified. Mean values ± SD for percent normal (p < 0.05, *when compared to ced-3(lf) and the relevant miRNA deletion(s) alone, Fisher's Exact test comparing the distributions of normal and abnormal animals). (C and D) ced-3(lf) enhances adult-specific alae defects including low quality (thin and rough) and gapped alae [bracket in (C) near the mid-body shows a gap]. Percent of adults with alae defects (p < 0.001, *compared to the relevant single or double mutants, Chi-square test comparing the distributions of adult alae phenotypes).
-
Figure 5—source data 1
Source data quantifying genetic interactions between miRNA mutants and ced-3.
- https://doi.org/10.7554/eLife.04265.016
Figure 6 with 3 supplements
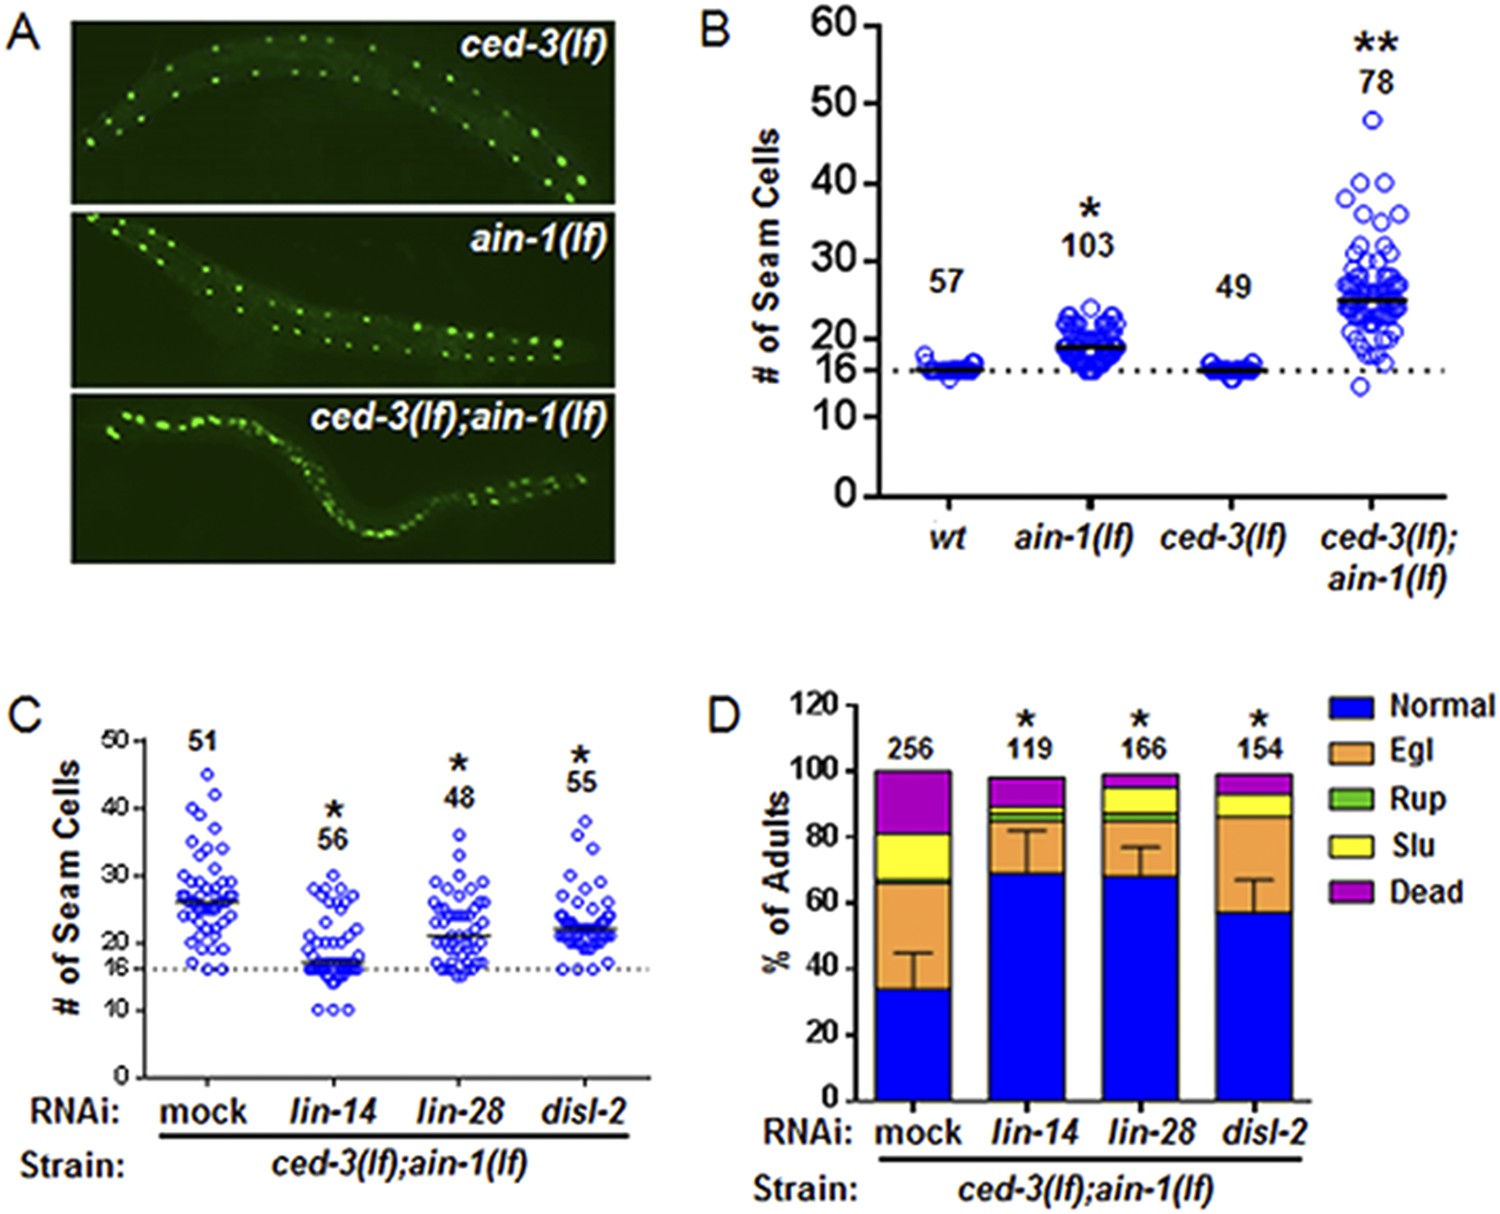
ced-3 may act upstream of multiple conserved pluripotent factors to affect differentiation of stem cell-like seam cells.
(A and B) Pseudocolored GFP from DIC images of a seam cell reporter and dot plot quantitation. The tick line depicts 16 seam cells that are normally found in wild-type animals. Black bars indicate the median values for each strain (p < 0.0001, *compared to wt, **compared to single mutants, Mann–Whitney test). (C) Effect of RNAi treatment beginning at L2 on the seam-cell-number phenotype of the ced-3(lf);ain-1(lf) double mutant (p < 0.0001, *compared to mock RNAi, Mann–Whitney test). C. elegans disl-2 is homologous to mammalian Dis3l2 (Figure 6—figure supplement 1). (D) Effect of the same RNAi on the ced-3(lf);ain-1(lf) double mutant defects. Mean values ± SD for percent normal [p < 0.0001, *compared to mock RNAi, Fisher's Exact test comparing the distributions of normal and abnormal animals (see ‘Materials and methods’ for statistical rationale)].
-
Figure 6—source data 1
Source data quantifying temporal cell fate patterning and other phenotypes.
(A) Source data for Figure 6B, (B) Source data for Figure 6C, (C) Source data for Figure 6D, (D) Source data for Figure 6—figure supplement 2B, (E) Source data for Figure 6—figure supplement 2C, (F) Source data for Figure 6—figure supplement 3B.
- https://doi.org/10.7554/eLife.04265.018
Figure 6—figure supplement 1
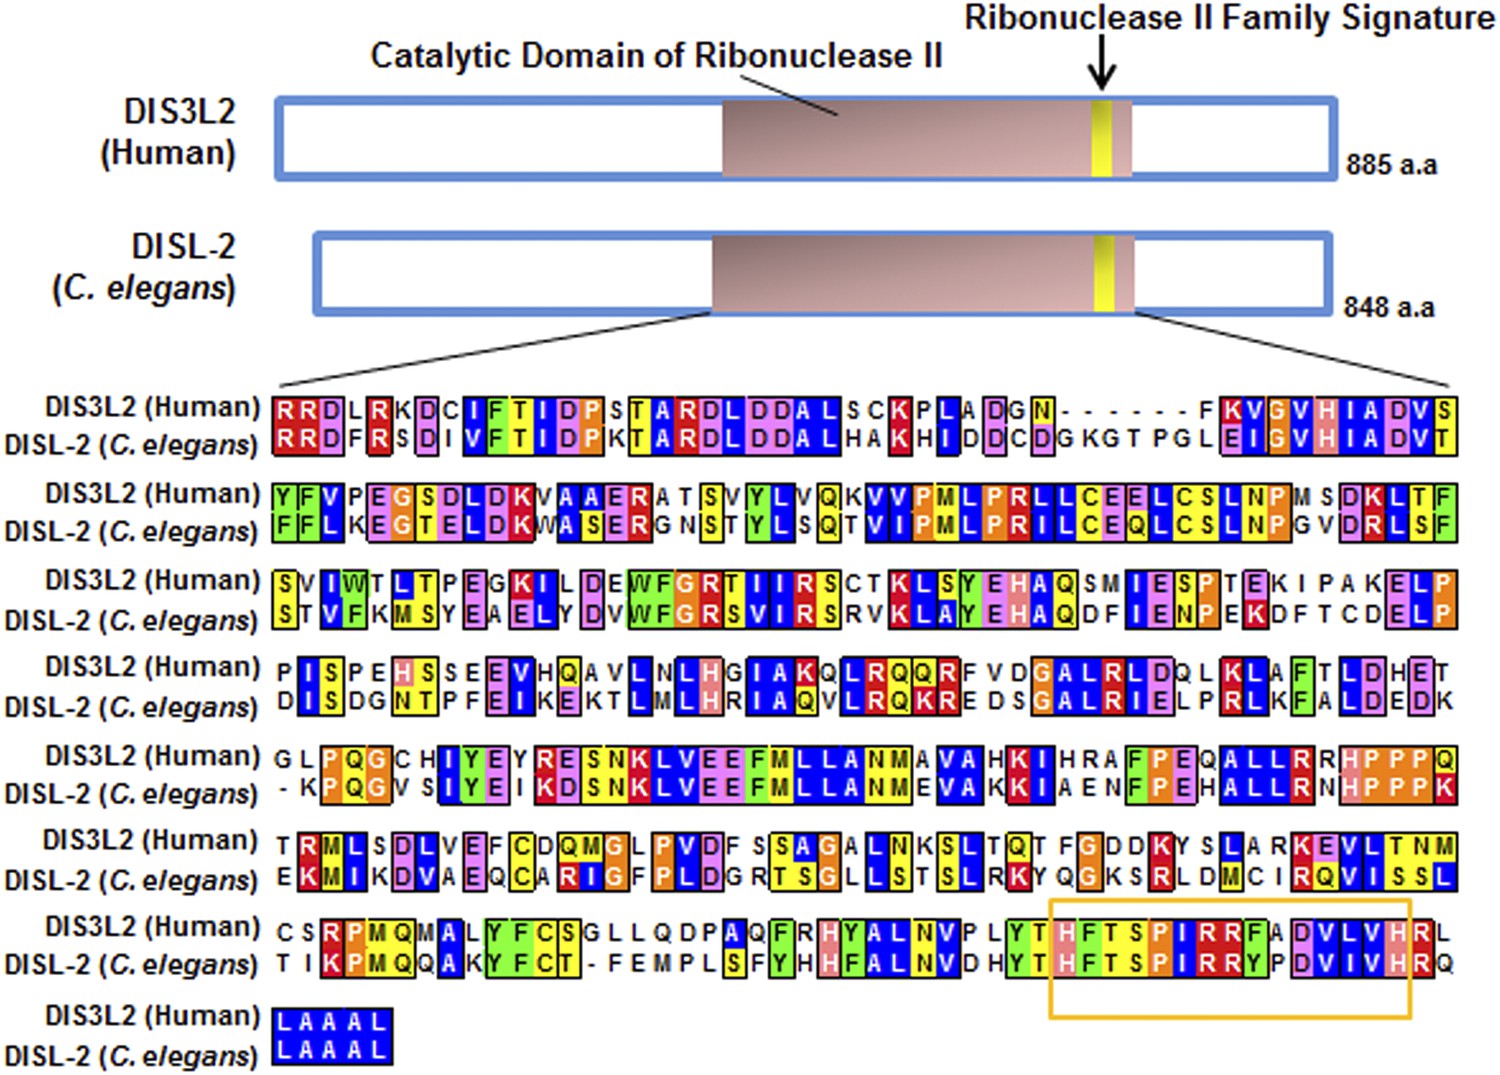
Protein sequence alignment of human DIS3L2 and C. elegans DISL-2.
Domain prediction and sequence alignment of the mammalian DIS3L2 protein with the C. elegans DISL-2 protein. Domain prediction was done by Interpro (Hunter et al., 2012) and Pfam (Punta et al., 2012), and the alignment was done using Clustal W (Larkin et al., 2007).
Figure 6—figure supplement 2
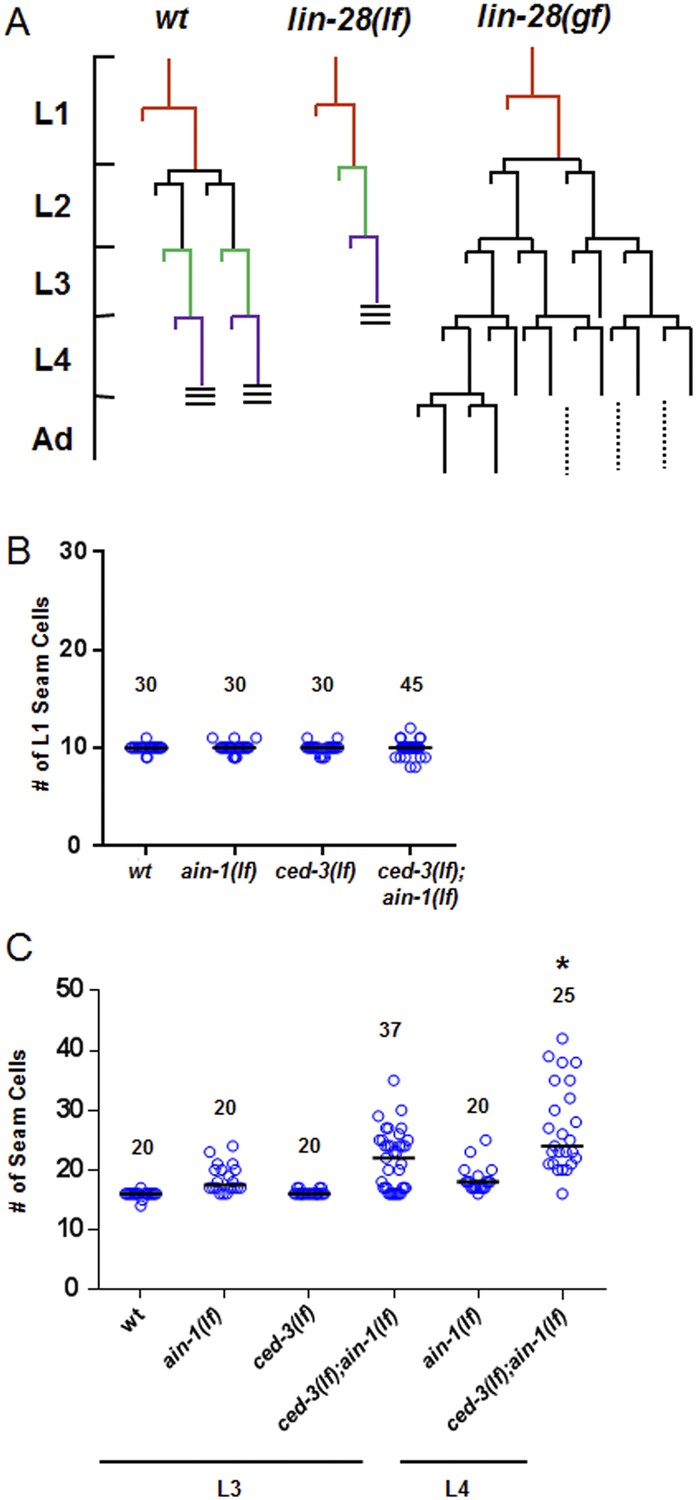
Additional analyses of seam cells for the ced-3(lf);ain-1(lf) double mutant.
(A) Diagram depicting the symmetric and asymmetric cell divisions of V1–V4 and V6 lineages (based on content detailed in a recent review [Rougvie and Moss, 2013]). One cell is shown beginning at L1 (red). In wt, the L2 stage has a symmetric division followed by asymmetric divisions thereafter. The lin-28(lf) mutation generates a precocious phenotype without the L2-specific symmetric division; whereas, the lin-28(gf) mutation generates a retarded phenotype with further L2-like reiterations. Thus, a normal animal hatches with 10 seam cells that result in 16 terminally differentiated seam cells by adulthood. (B) The ced-3(lf);ain-1(lf) double mutant animals hatch with the correct number of seam cells which continue to develop during late larval stages. 10 seam cells are observed for all strains with no significant differences observed. Black bars indicate the median values for each strain (p > 0.05, Mann–Whitney test, all single and double mutants compared to wild-type). (C) Quantitation of third and fourth larval stages of the ced-3(lf);ain-1(lf) double mutant animals suggests supernumerary seam cells continue to arise during late larval stages. Black bars indicate the median values for each strain (p = 0.008, *compared to L3 stage ced-3(lf);ain-1(lf), Mann–Whitney test). The data shown for the L4 animals in panel (B) here are unique from the main Figure 6B and are not repeated.
Figure 6—figure supplement 3
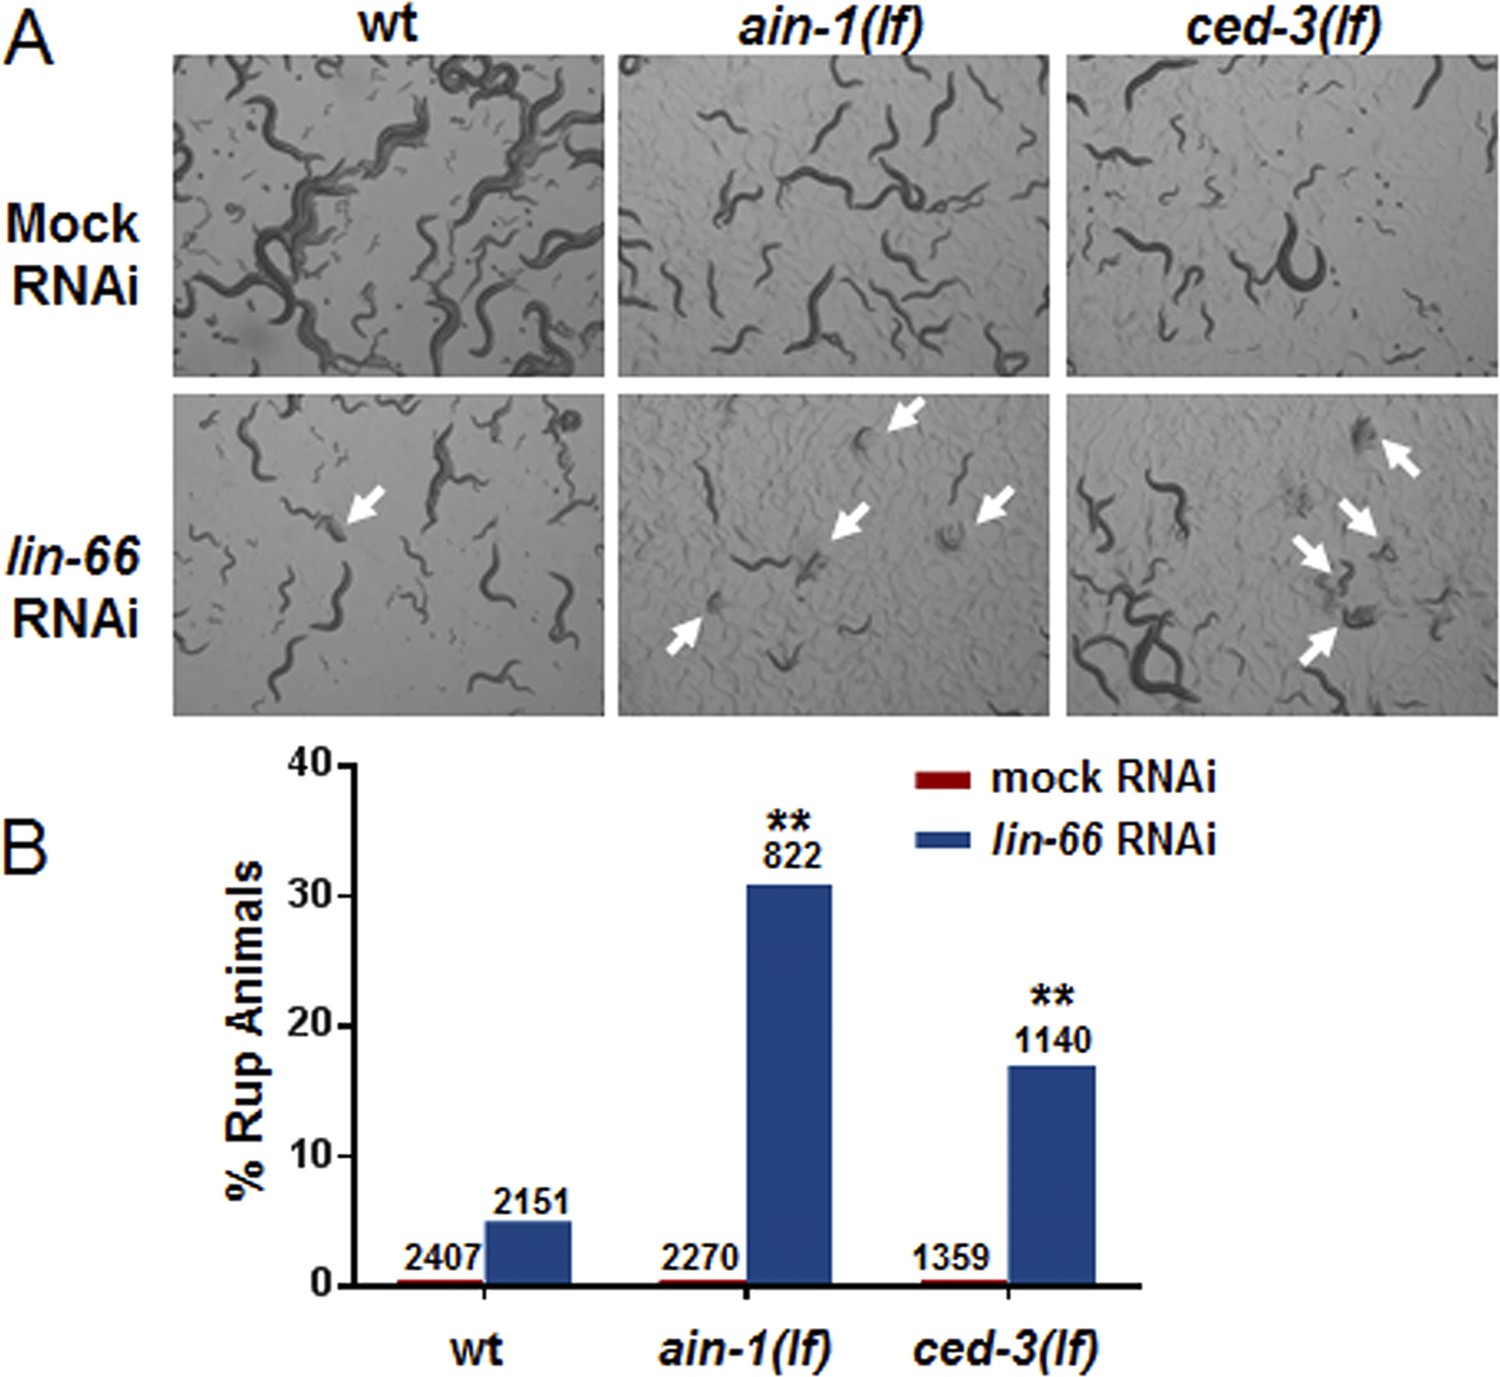
ced-3(lf) mutants enhance lin-66(RNAi) ruptured vulva phenotype.
lin-66 was previously shown to limit the expression of LIN-28 by an incompletely understood mechanism (Morita and Han, 2006). We therefore tested if loss of ced-3 could enhance the vulva defect in lin-66(RNAi). (A) Images and (B) bar graph showing that lin-66(RNAi) increases the frequency of ruptured vulva of both ced-3(lf) and ain-1(lf) mutants. L2 stage animals were fed either mock or lin-66(RNAi) and the subsequent generation was scored for ruptured vulva (Rup) at adulthood (multiple ruptured animals are indicated by arrows). RNAi was used due to the fourth larval stage lethality of the lin-66(lf) alleles. ain-1 in miRISC is already known to negatively regulate LIN-28 expression and its enhancer phenotype here with lin-66(RNAi) serves as a positive control. The percent mean values are shown (number of worms indicated above each bar, **p < 0.001, Chi-square analysis).
Figure 7 with 2 supplements
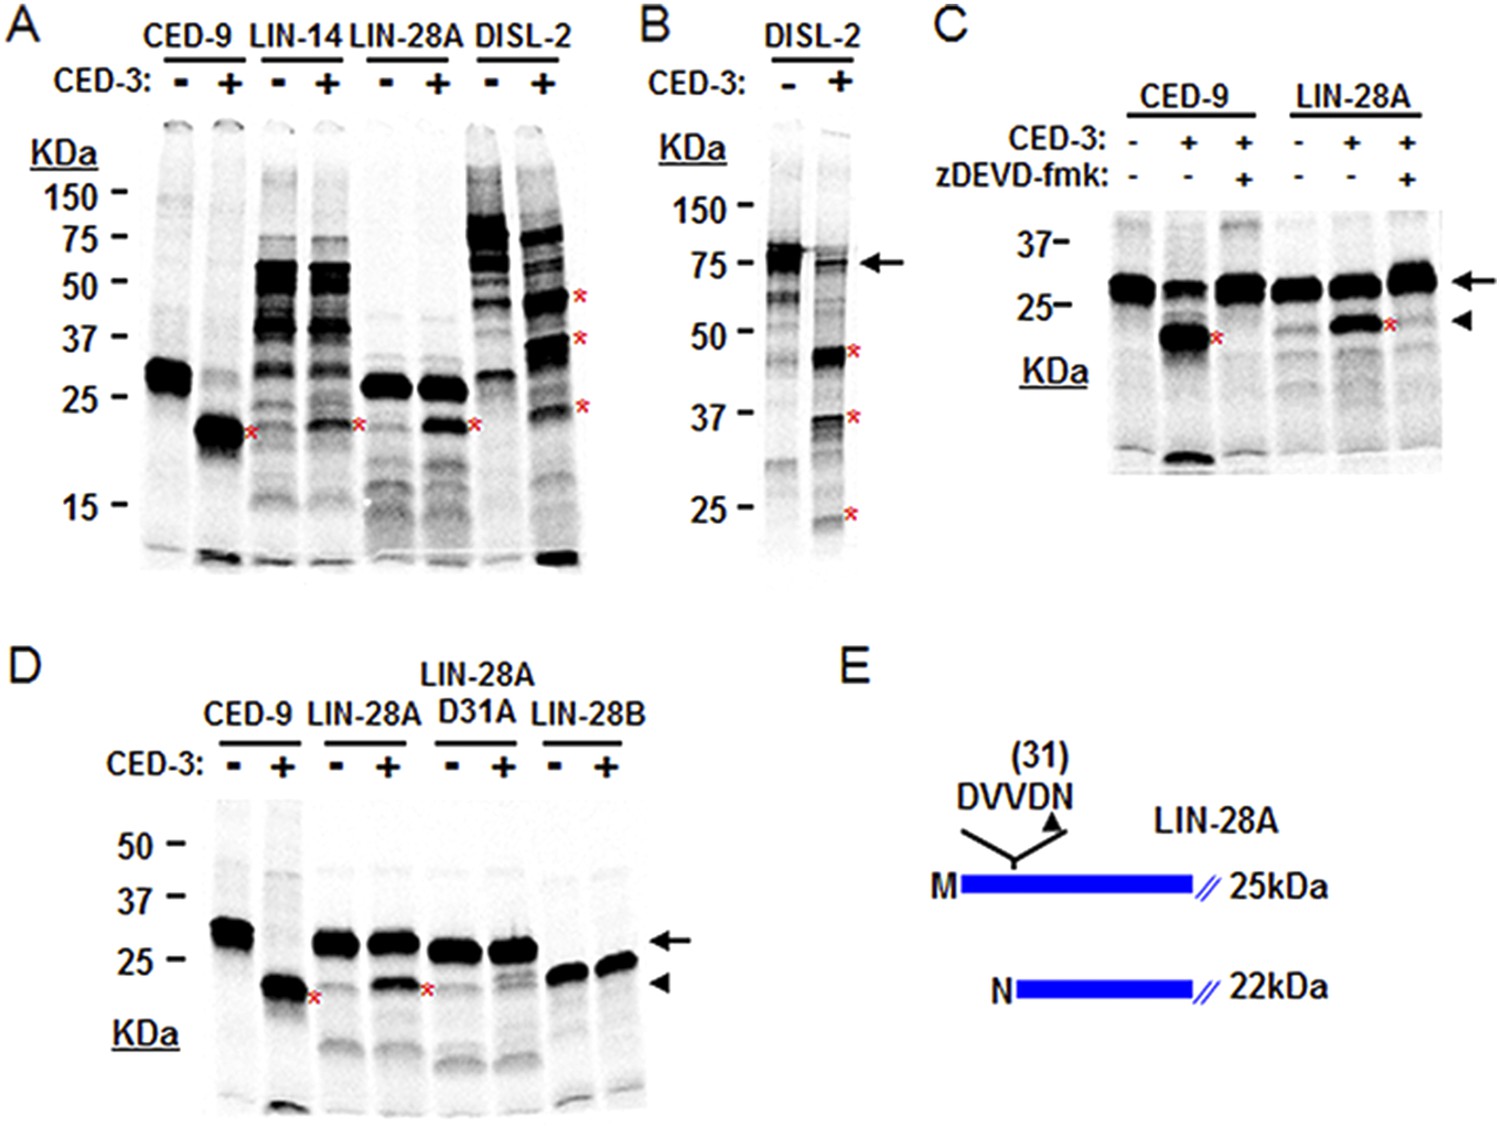
CED-3 cleavage of LIN-14, LIN-28, and DISL-2 (DIS3L2) in vitro.
(A) Established in vitro CED-3 cleavage assay (Xue et al., 1996) of 35S-labeled proteins. CED-9 served as a positive control throughout. Red asterisks indicate cleavage products (same in B–D). (B) Result from a longer-run gel showing near quantitative cleavage of full-length DISL-2 (arrow indicates the full-length protein). (C) In vitro cleavage assay with the zDEVD-fmk caspase-specific irreversible inhibitor (Rickers et al., 1998). The arrow and arrowhead (and red asterisks) indicate the full-length protein and a predominant CED-3 cleavage product, respectively. (D) Effect of the D31A mutation on CED-3 cleavage (for other mutants see Figure 7—figure supplement 1). (E) Diagram showing the position and consequence of LIN-28A cleavage by CED-3 in vitro (22 kDa with an N-terminal asparagine). Each panel was performed as an independent experiment.
Figure 7—figure supplement 1
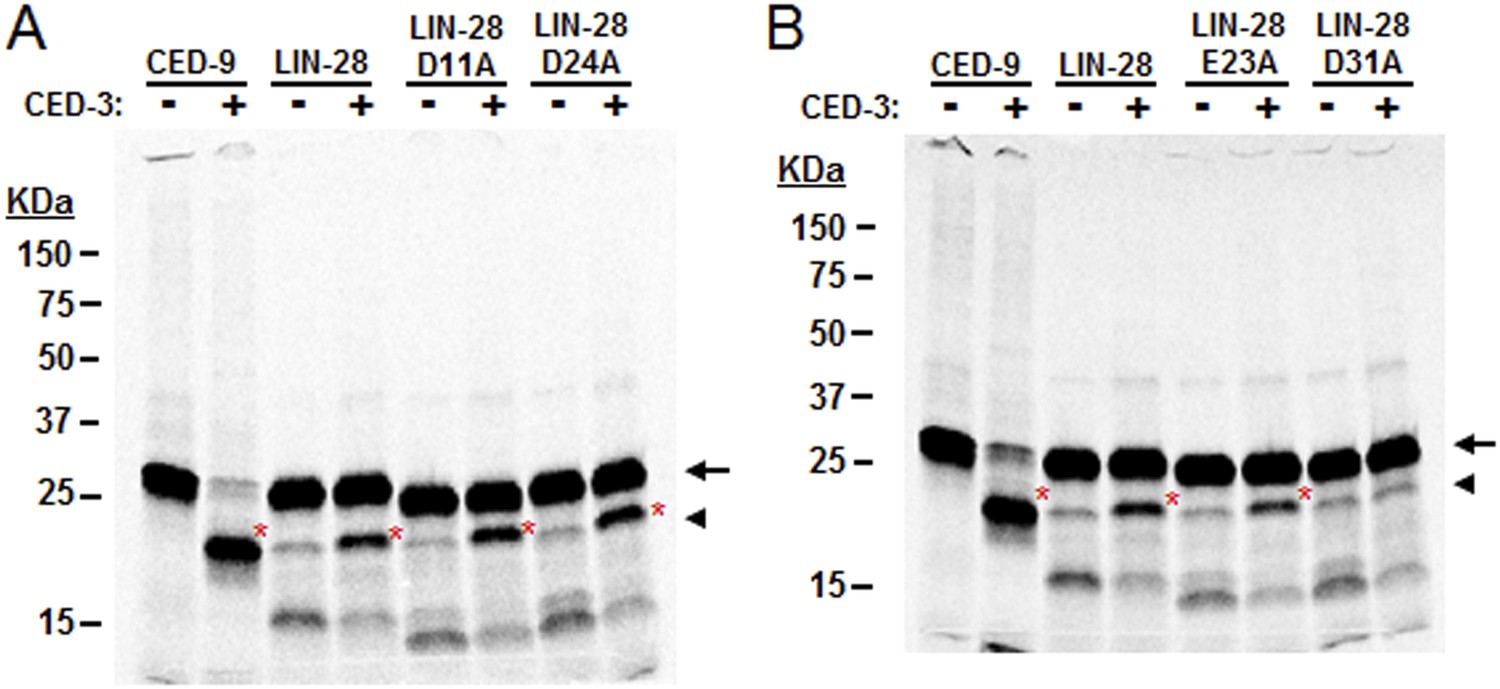
Mutagenesis of LIN-28A to identify the CED-3 cleavage site.
Several possible cleavage sites exist in the C. elegans LIN-28A protein corresponding to the tetra-peptide D(E,N,G)xxD(E) cleavage sequence with the alternate residues indicated in parentheses and the proximal residue for cleavage underlined (aspartic acid in this position strongly favored) (Xue et al., 1996). (A–B) Mutants were made for the second acidic residue in the tetra-peptide sequence for all such sites in the LIN-28A N-terminal region but only the DVVD to DVVA mutation (noted as D31A in panel B and Figure 7D) abolished CED-3 cleavage. Cleavage products are indicated by red asterisk. These experiments were run independently of those shown in Figure 7 and thus constitute replicates for the mutant D31A cleavage assay.
Figure 7—figure supplement 2
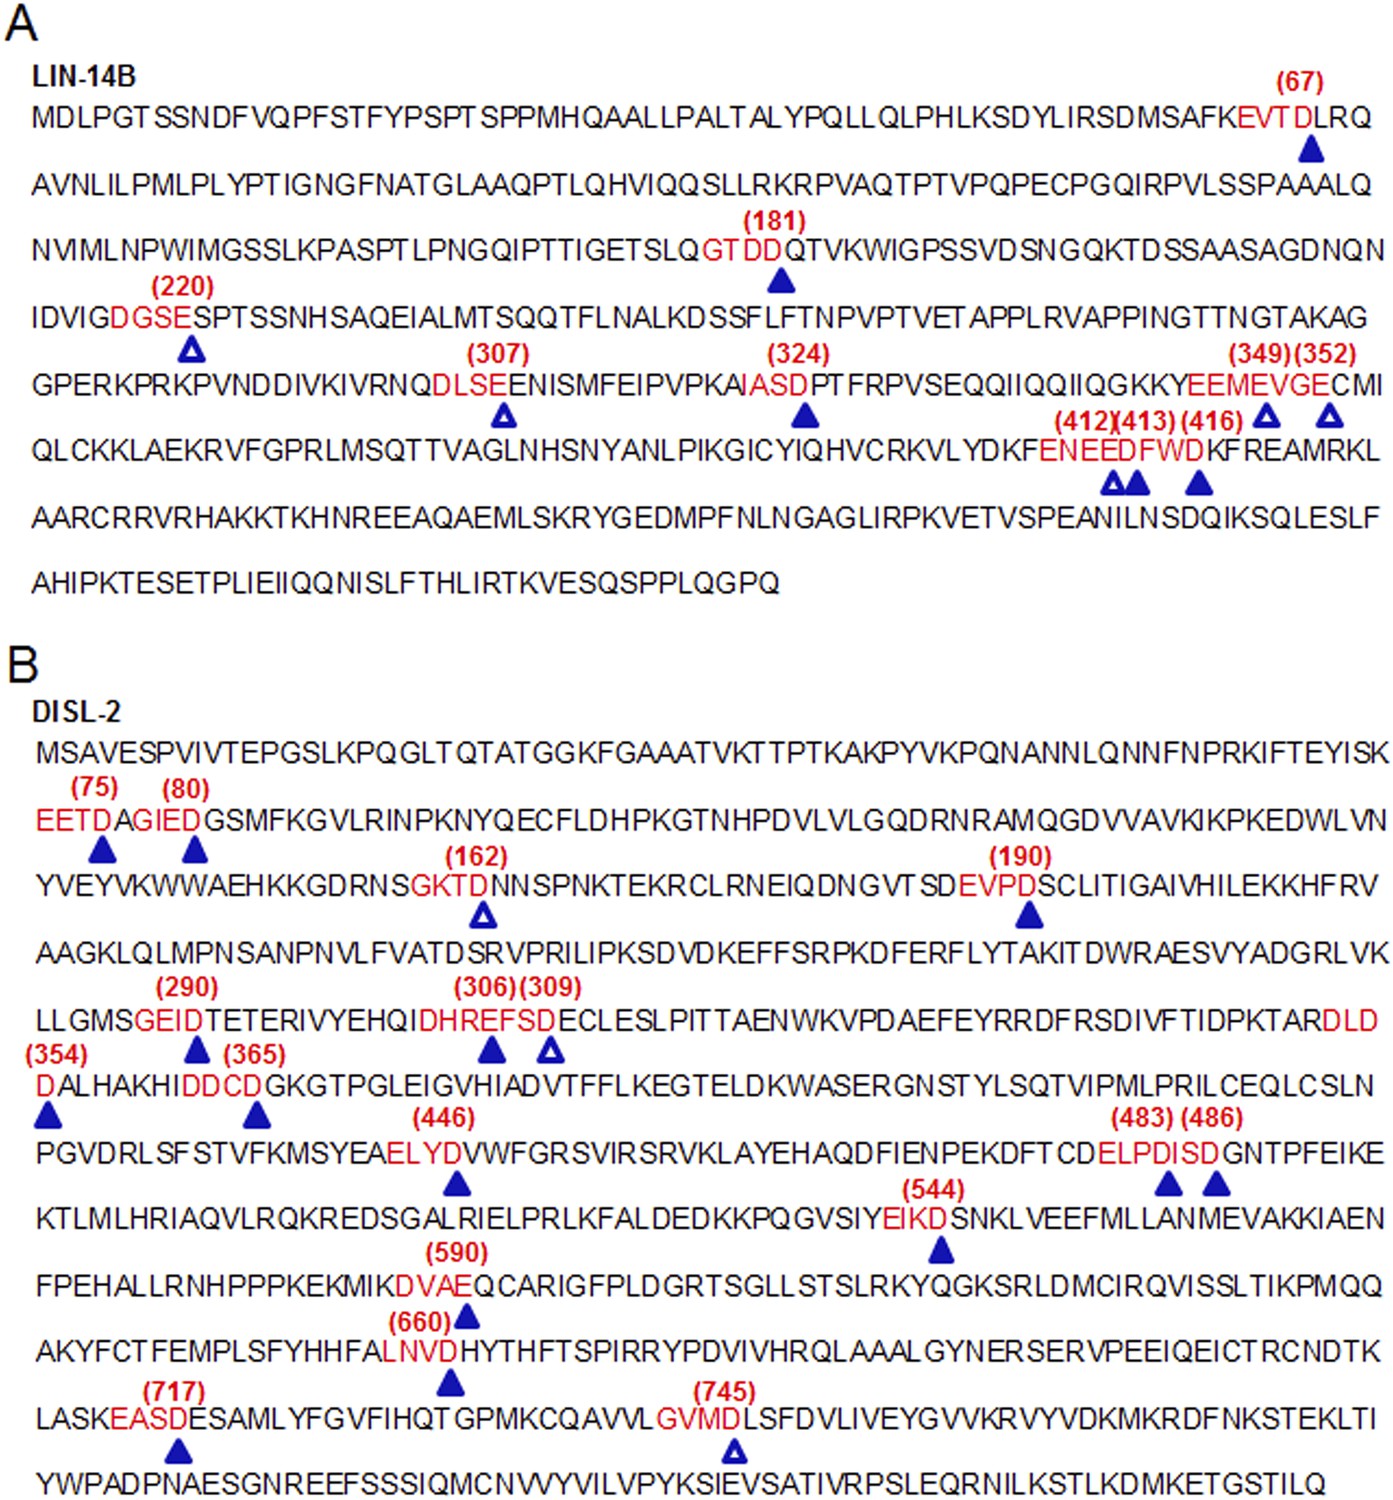
Identification of possible CED-3 cleavage sites in LIN-14 and DISL-2.
Numerous possible CED-3 cleavage sites are found in LIN-14B and DISL-2 based on the consensus motif detailed in Figure 7—figure supplement 1 (Xue et al., 1996). (A–B) Potential CED-3 substrate tetrapeptides are shown in red font, some of which overlap. Closed triangles and open triangles indicate potential cleavage sites of high and moderate probability, respectively. The numbers in parentheses above the sequences indicate the proximal acidic residue. The LIN-14B isoform is shown in (A) since this is the isoform we cloned. However, all of the predicted cleavage sites shown here are also present in the LIN-14A isoform, which differs in the amino terminus prior to the first predicted site.
Figure 8 with 2 supplements
In vivo confirmation that CED-3 caspase negatively regulates LIN-28 expression in late larval stages.
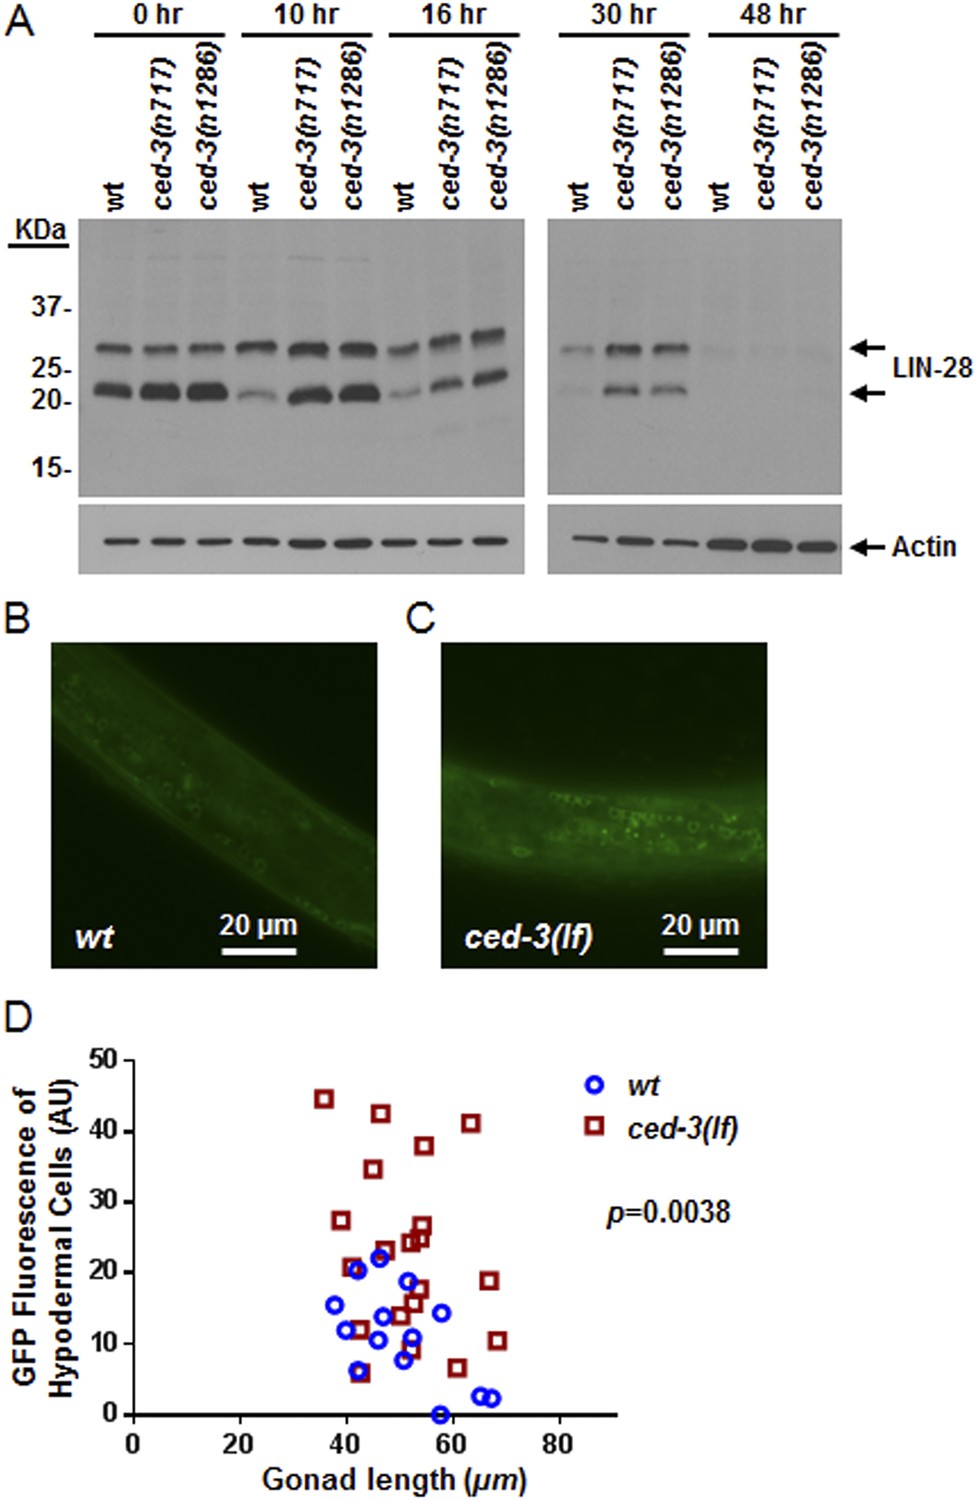
(A) Western blot with the LIN-28 antibody we developed (validation shown in Figure 8—figure supplement 1) to see the effects of ced-3(lf) mutations on LIN-28 protein expression during developmental transitions. Notice that the cleavage product of the larger isoform of LIN-28 observed in the in vitro assay (Figure 7) is not detectable in the in vivo analysis, suggesting that the cleavage product, which has an Asn instead of Met as the N-terminal end residue, may potentially be sensitive to the N-end rule proteasomal degradation pathway. The pattern and timing of LIN-28 expression and downregulation we show here for wt are similar to previous findings (Seggerson et al., 2002; Morita and Han, 2006) and two independent ced-3(lf) mutant strains are shown here (quantitation is shown in Figure 8—figure supplement 1C). (B–C) Pseudocolored GFP from DIC images of L3 larvae near the mid-body. Also see DIC images of these same animals without GFP illumination (similar length gonads shown in Figure 8—figure supplement 2A,B) and test of similar staging (Figure 8—figure supplement 2C). Size bars are indicated. ‘wt’ indicates the lin-28(+)::gfp integrated transgene alone previously shown to be functional (Moss et al., 1997) and ‘ced-3(lf)’ indicates this same transgene combined with a ced-3(lf) mutation. (D) Quantitation of the LIN-28::GFP expression between the strains within the L3 stage. (p = 0.0038, significant compared to wt, Mann–Whitney test comparing the integrated intensity of LIN-28::GFP hypodermal expression in L3 larvae). Persistent expression of LIN-28::GFP in head cells (Figure 8—figure supplement 2D,E).
-
Figure 8—source data 1
Source data quantifying effects of ced-3(lf) on LIN-28::GFP expression.
(A) Source data for Figure 8D, (B) Source data for Figure 8—figure supplement 2C, (C) Source data for Figure 8—figure supplement 2E.
- https://doi.org/10.7554/eLife.04265.026
Figure 8—figure supplement 1
Validation of our newly generated LIN-28 antibody and quantitation of Western blot data.
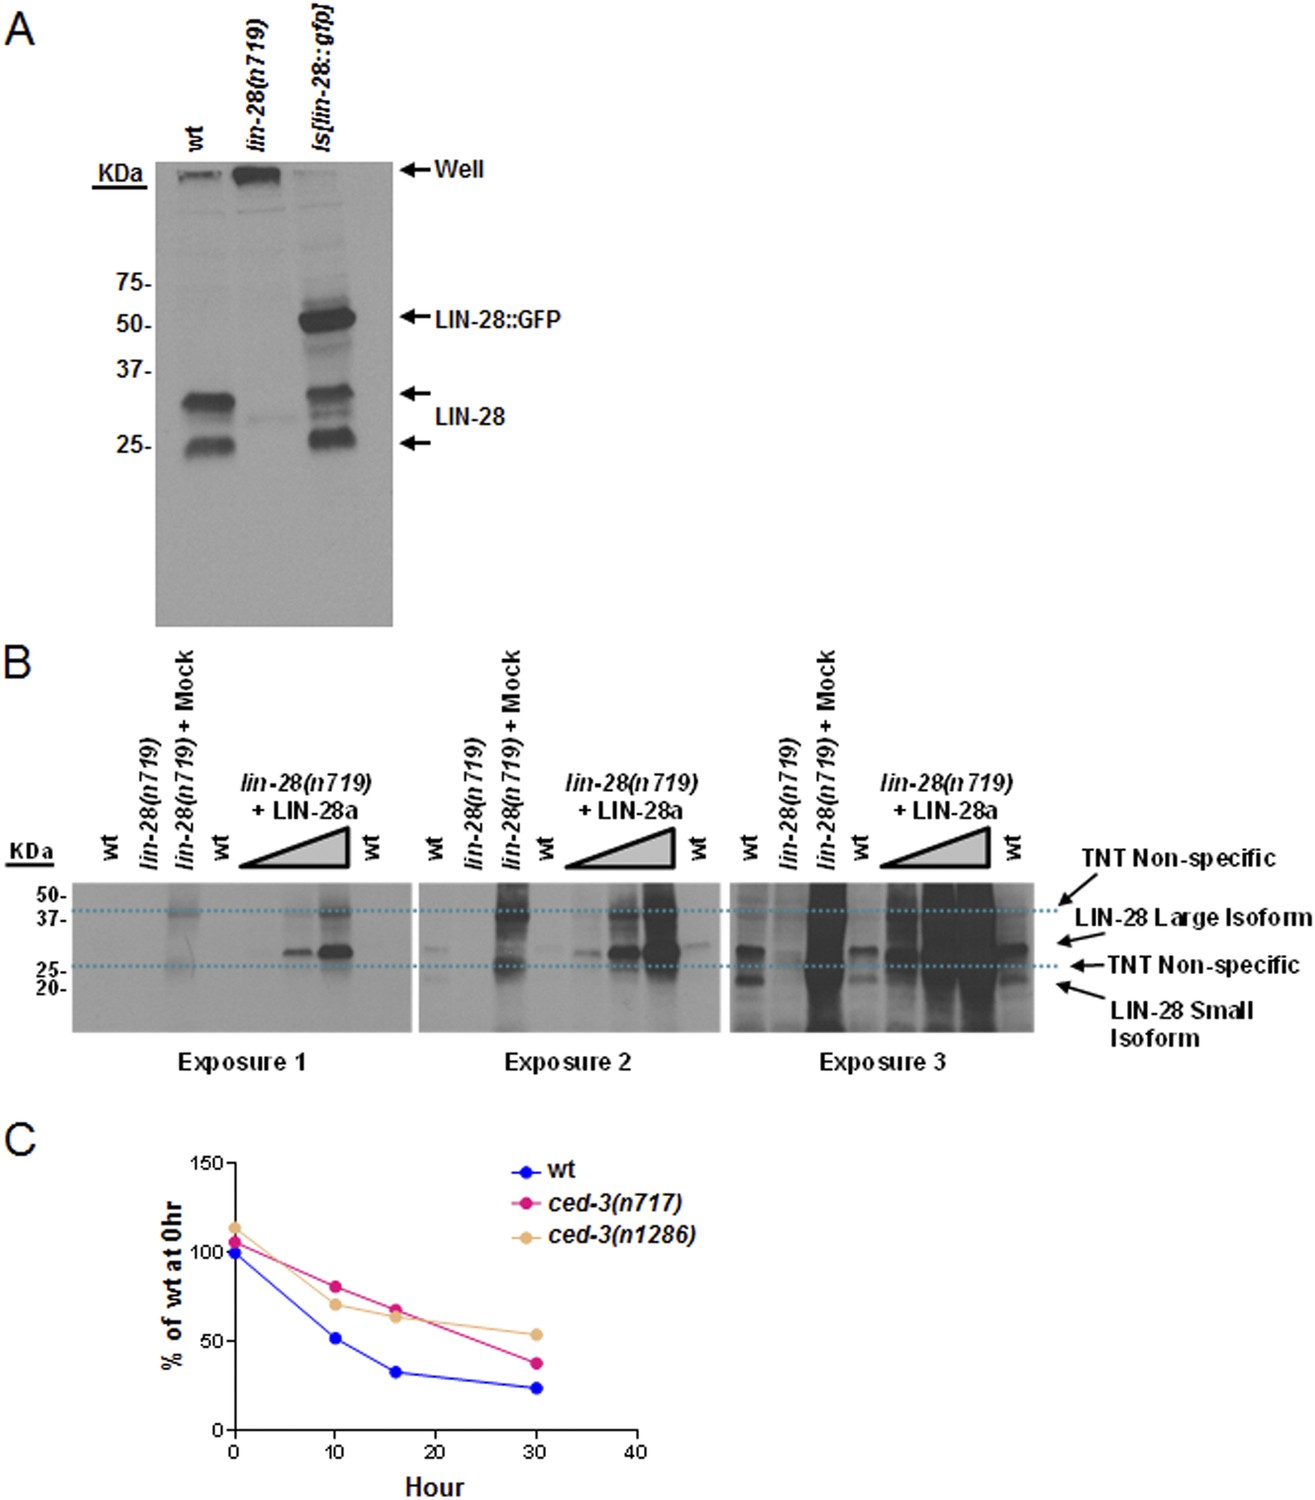
(A) Western blot to demonstrate the specificity of our peptide-purified rabbit-anti-C. elegans LIN-28 antibody. The peptide we chose to immunize the rabbits with is found near the C-terminus (reported in ‘Materials and methods’) and therefore should recognize both the a and b isoforms equally well. Equivalent amounts of extracts from mixed staged wt, lin-28(n719,lf), and a strain with an integrated transgene of lin-28::GFP were resolved by SDS-PAGE then probed with our purified LIN-28 antibody. The Is[lin-28::gfp] strain shows both the endogenous forms of LIN-28 and the shifted fusion protein. (B) The large isoform of LIN-28 (corresponding to the a isoform) was synthesized in vitro then added at increasing amounts into the lin-28(n719,lf) strain to simulate a complex mixture for all other background proteins. Three exposures of the same gel are shown. Two predominant background bands from the in vitro lysate are indicated by dashed blue lines. LIN-28-specific bands (identified in panel A) are indicated. The lin-28(n719) + mock lane has as much in vitro lysate as the most +LIN-28a lane but with a mock vector to show lysate background. This background is not present in the worm extracts (compare the lin-28(n719) lane vs lin-28(n719) + mock). (C) Quantitation of Western blot data from Figure 8A. Arbitrarily, 100% was defined as the intensity of total LIN-28 at 0 hr normalized to actin for the wt strain. Both ced-3(lf) strains were set relative to the wt 0 hr. The subsequent time points for all strains were compared to this 0 hr value.
Figure 8—figure supplement 2
Larval staging and persistent LIN-28::GFP expression.
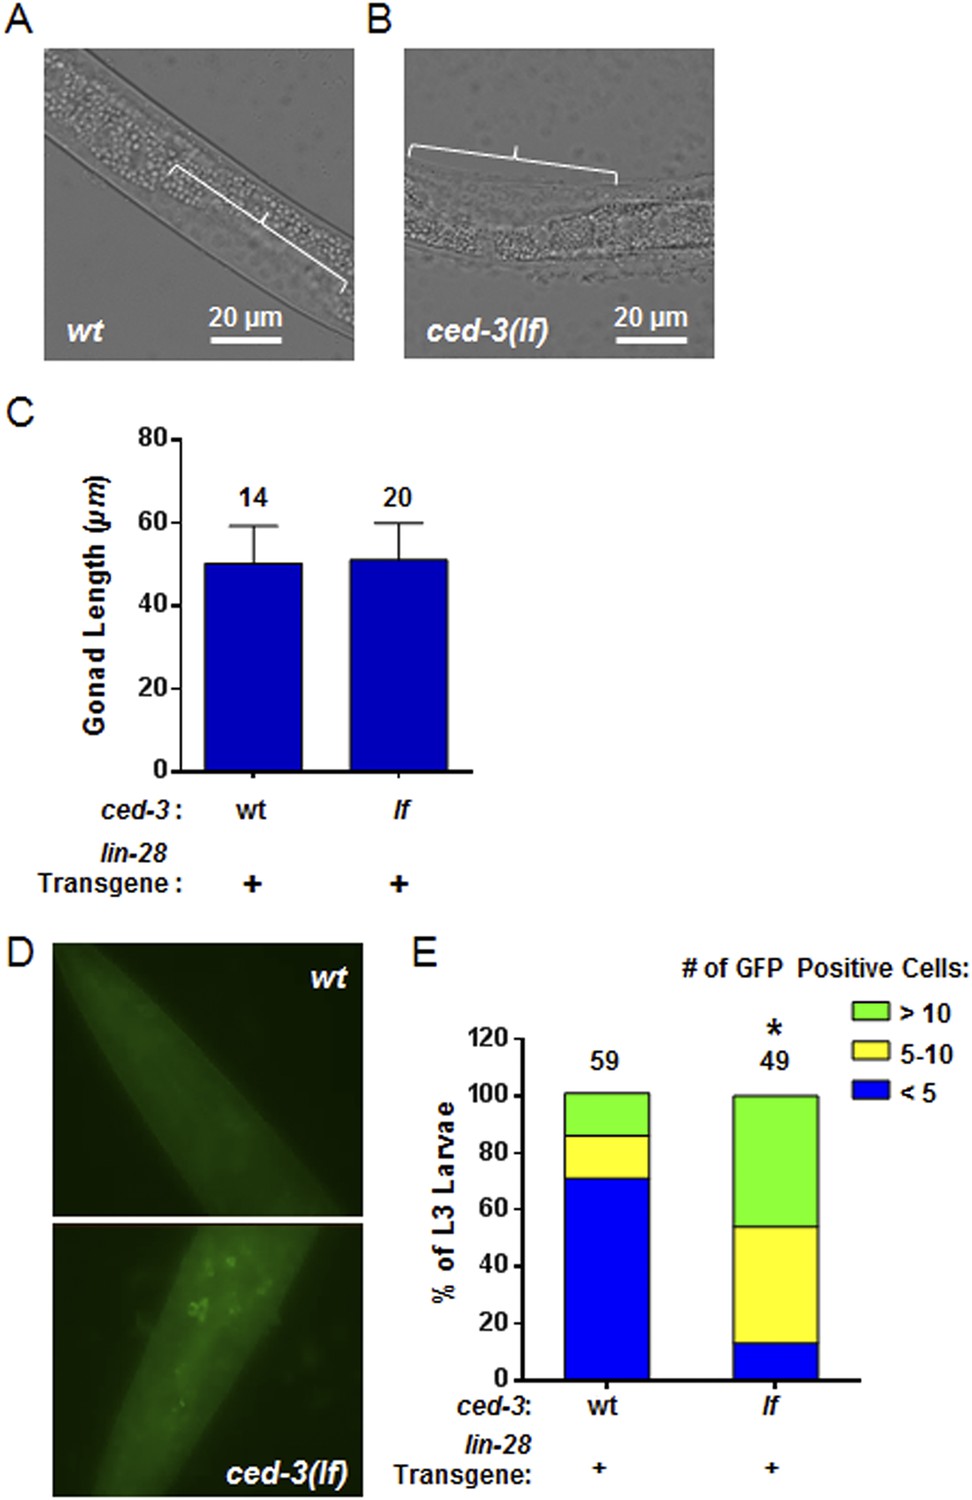
(A–C) Analysis of gonad length in LIN-28(+) transgenic lines with ced-3(wt) or ced-3(lf). We first picked L3 stage animals in the blind on a non-fluorescent microscope. Prior to GFP illumination, we assessed the sub-stages of animals by measuring the gonad length of the animals. This was done since the animals had roller phenotype making P cell division difficult to observe and strong defects in LIN-28, directly, are known to have only minor effects on gonad development (Ambros, 1997). Thus, these strains should not be expected to have significant defects in gonad extension and gonad length should serve as a quantifiable metric of larval stage similar to previous reports (Ambros and Horvitz, 1984; Moss et al., 1997; Abbott et al., 2005). The images shown here (A–B) are from the same animals shown in the main Figure 8B–C. The white bars indicate 20 μM. The white brackets indicate the gonads of equal length. (C) No significant difference in gonad length for the L3 samples was observed between the two strains suggesting similar sub-stage. Mean ± SD is shown (p > 0.05, Mann–Whitney test). (D–E) Pseudocolored GFP from DIC head images of L3 larvae and quantitation of the number of cells expressing LIN-28::GFP (p < 0.0001, *compared to wt;(+), Chi-square test comparing the distributions of L3 larvae based on the number of LIN-28::GFP positive cells). ‘+’ indicates the lin-28(+)::gfp integrated transgene previously shown to be functional (Moss et al., 1997). This set of experiments was done completely independently of the ones shown in main Figure 8B–D. A similar method for selection of L3 animals in the blind on a non-fluorescent microscope was used. All animals were visualized for GFP positive cells through multiple focal planes of the head. All images were taken with identical exposure times, and all cells were counted by an individual who did not take the images.
Figure 9 with 4 supplements
CED-3 caspase represses LIN-28 in vivo to ensure proper temporal cell fate patterning regulation.
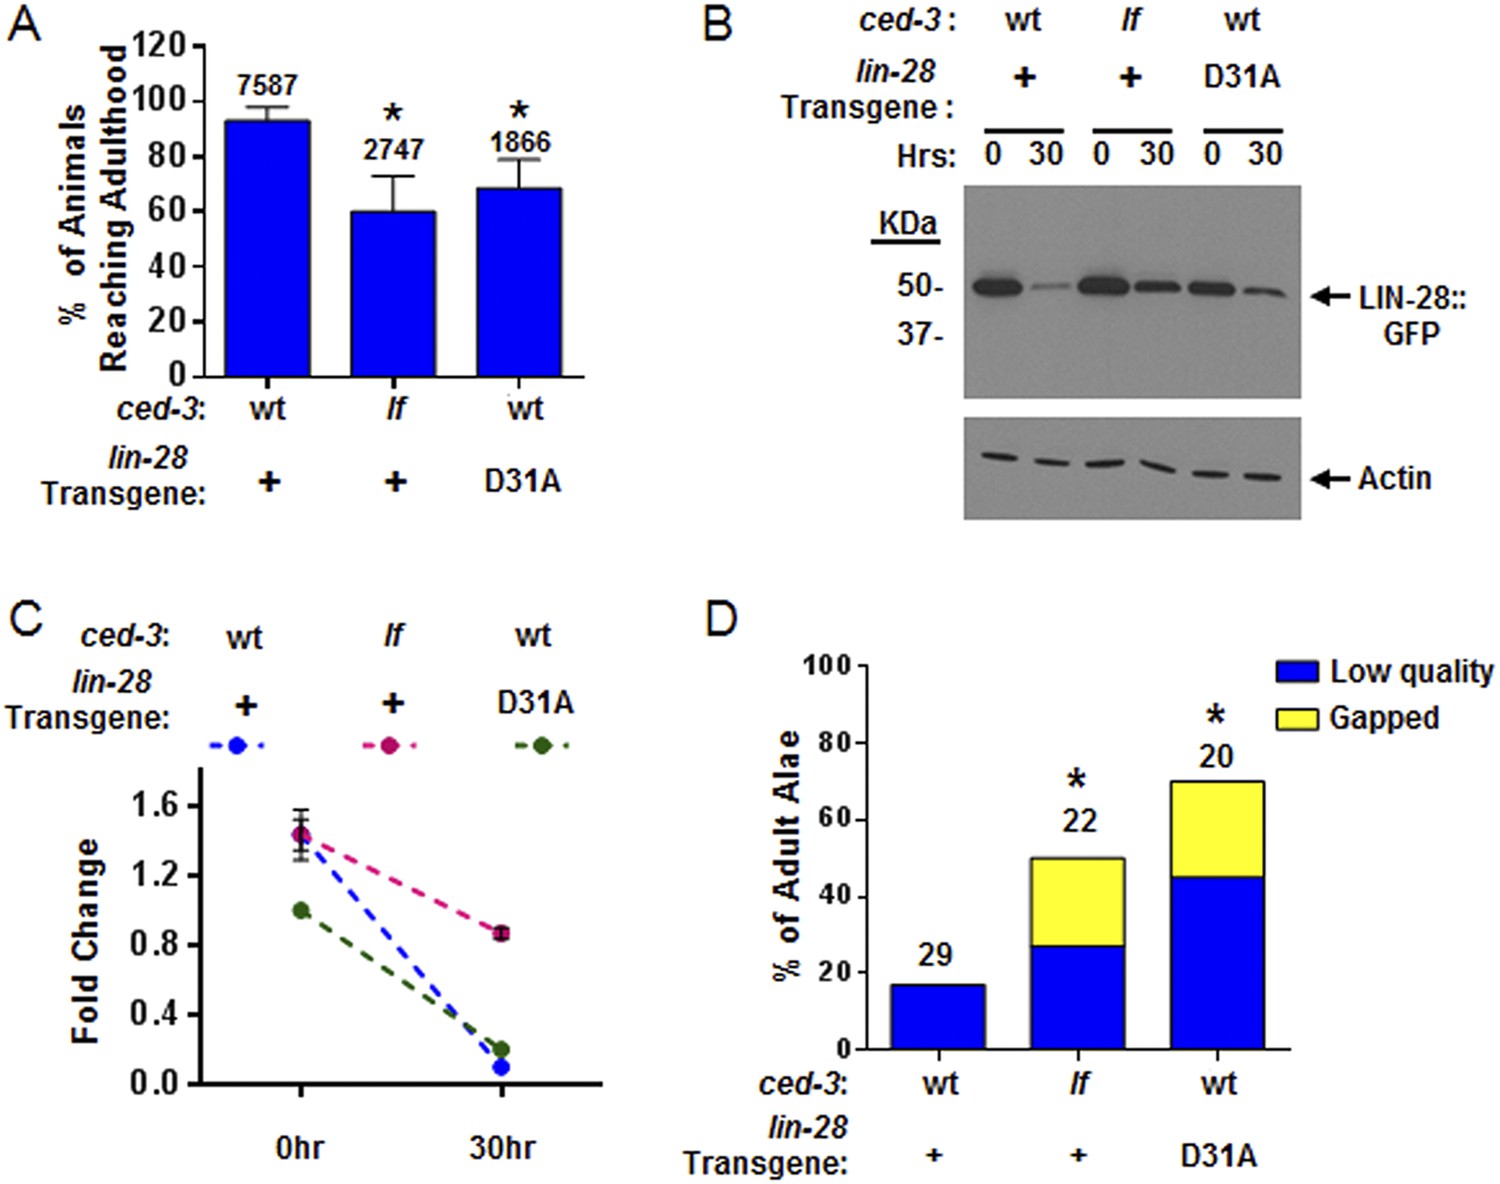
(A) Effects of disrupting CED-3 activity on LIN-28 in vivo on the rate of post-embryonic growth. Percent of animals reaching adulthood at 96 hr after hatching is shown. ‘+’ indicates the lin-28(+)::gfp integrated transgene described in Figure 8B–C. D31A indicates a transgene integration with the CED-3-cleavage-resistant D31A point mutation in the first exon of LIN-28 but is otherwise identical to the original (+) transgene. Test of lin-28(lf) rescue (Figure 9—figure supplement 1) and copy number of the transgenes (Figure 9—figure supplement 2). Mean values ± SD (p < 0.0001, *compared to wt;(+), Fisher's Exact test comparing the distributions of adult to larval-stage animals at this time). (B–C) Western blot for the LIN-28::GFP transgenes described in (A) and quantitation from three independent Western blot experiments of the LIN-28::GFP transgenes [one Western blot shown in (B)]. Here, 1.0 was defined as the intensity of total LIN-28(D31A)::GFP at 0 hr normalized to actin. Both the lin-28(+) and the ced-3(lf);lin-28(+) strains and the 30 hr time point for all strains were compared to this value. Mean ± SEM for the two time points (dashed lines are used only to indicate the net change in relative expression for the three strains). (D) Disrupting CED-3 activity on LIN-28 enhances adult alae defects of the strains described in (A) (p < 0.01, *compared to wt;(+), Chi-square test comparing the distributions of adult alae phenotypes). Figure 9—figure supplement 3 shows examples of the adult alae phenotypes for these three strains. Data for increased expression of LIN-14 in ced-3(lf) mutants at the first larval stage is shown in Figure 9—figure supplement 4.
-
Figure 9—source data 1
Source data quantifying effects of ced-3(lf) and LIN-28(D31A) mutation on protein levels and developmental phenotypes.
(A) Source data for Figure 9A, (B) Source data for Figure 9C, (C) Source data for Figure 9D, (D) Source data for Figure 9—figure supplement 1B.
- https://doi.org/10.7554/eLife.04265.030
Figure 9—figure supplement 1
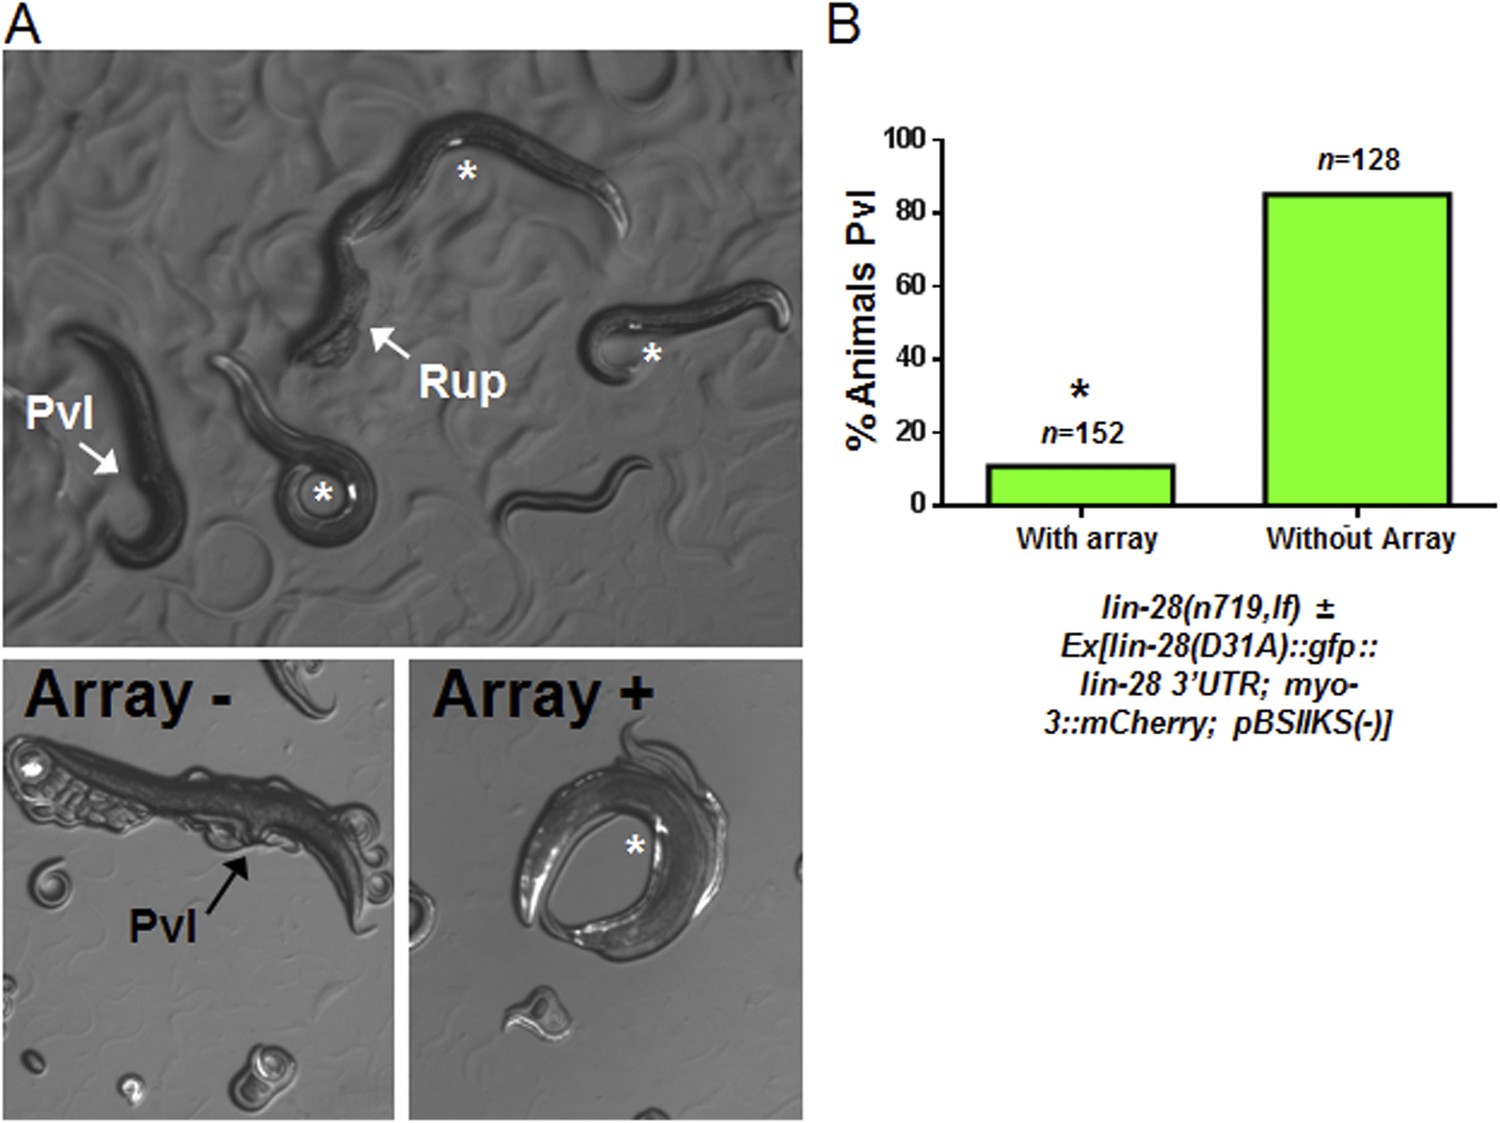
Test for lin-28(D31A) function in overcoming the lin-28(n719,lf) protruding vulva defect.
The full name of the extrachromosomal array that we tested: Ex[lin-28(D31A)::gfp::lin-28 3′UTR; myo-3::mCherry; pBSIIKS(−)] where myo-3::mCherry served as the transgenic marker. (A) Myo-3::mCherry positive animals are rescued from the Pvl phenotype similar to the original lin-28(+)::gfp described previously (Moss et al., 1997). The top panel shows two adults not carrying the array which displayed the protruding vulva (Pvl) and ruptured vulva (Rup) (arrows) phenotype, respectively. Three adults carrying the array are indicated in this same panel by an asterisk near their well-developed vulva (also myo-3::mCherry positive). The bottom two panels show magnified images of two different animals, one without array, and therefore Pvl, and one with the array, and therefore not Pvl. (B) The array-positive animals have a significant rescue compared to animals without the array (89% rescued on average, p < 0.0001, *when compared to animals without the array, Fisher's Exact test) showing that the D31A mutation does not alter the gross function of the protein. Rather, we conclude that the D31A mutation only abolishes the direct cleavage of LIN-28 as supported by our in vitro experiments (Figure 7 and Figure 7—figure supplement 1). The offspring from parents bearing the rescue array may have some maternal effect with ∼10% of adults not carrying the array without Pvl but with severe egg-laying defect (also suggests a non-functional vulva) and the remaining 5% with apparently normal vulva.
Figure 9—figure supplement 2
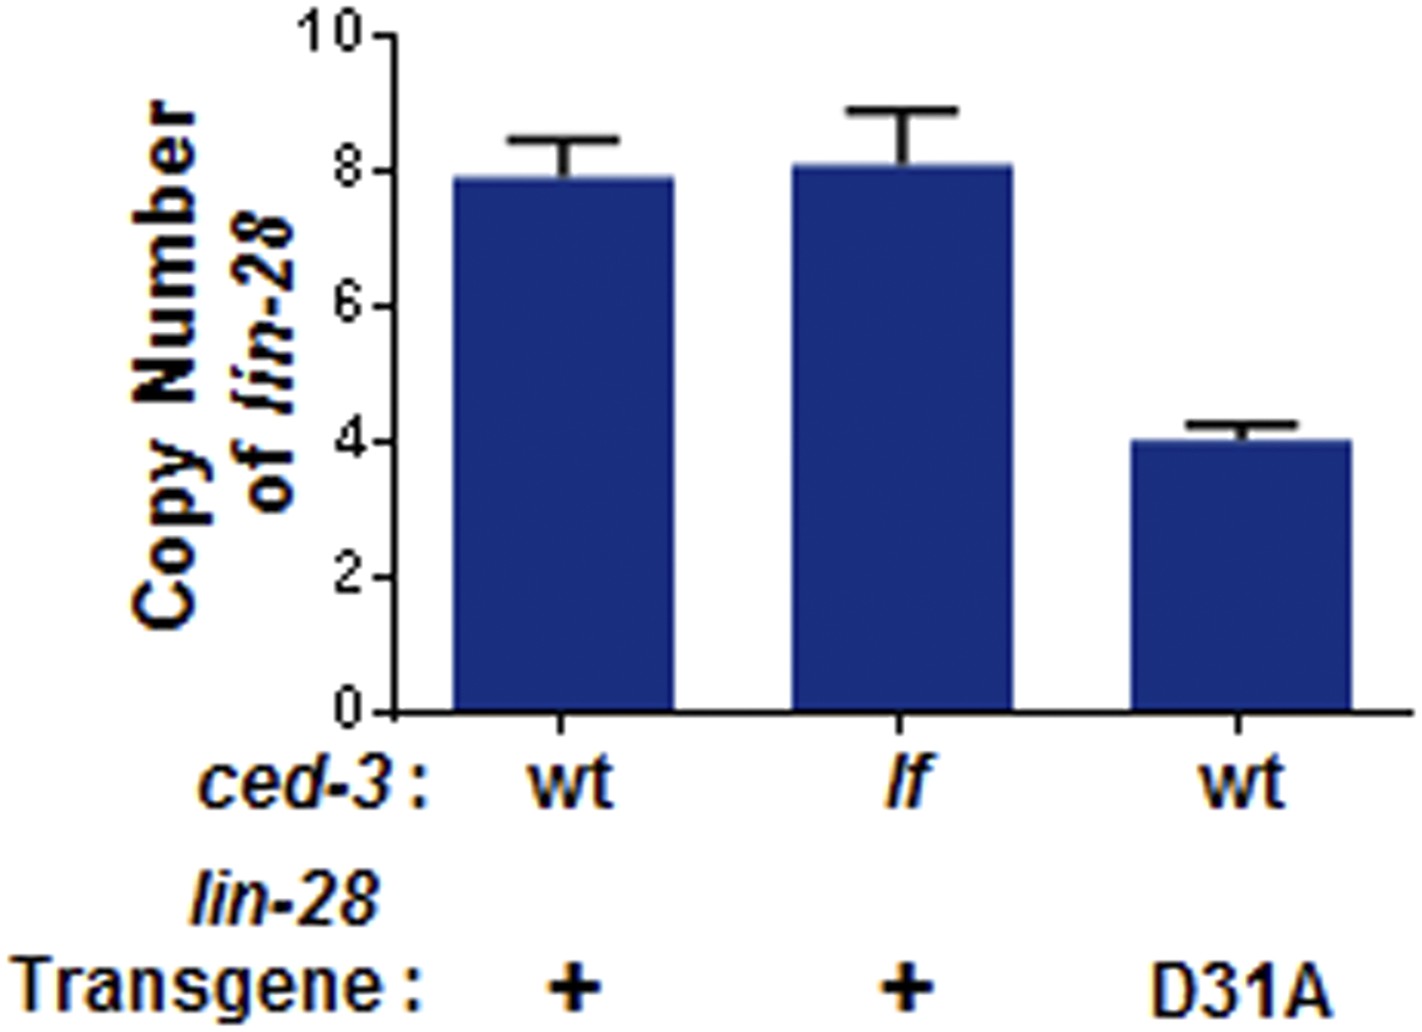
Transgene copy number determination.
+ indicates the [lin-28(+)::gfp::lin-28 3′UTR; rol-6] integrated transgene which was previously published as functional (Moss et al., 1997). D31A indicates the transgene integration we generated which contains the D31A point mutation in the first exon of LIN-28. Following integration, total DNA was used as input for qPCR to quantify the copy number. Mean ± SD is from two sets of lin-28 primers normalized to two sets of unrelated endogenous genes (ain-1 and hrp-1). These findings suggest low copy number integration for the two transgenes.
Figure 9—figure supplement 3
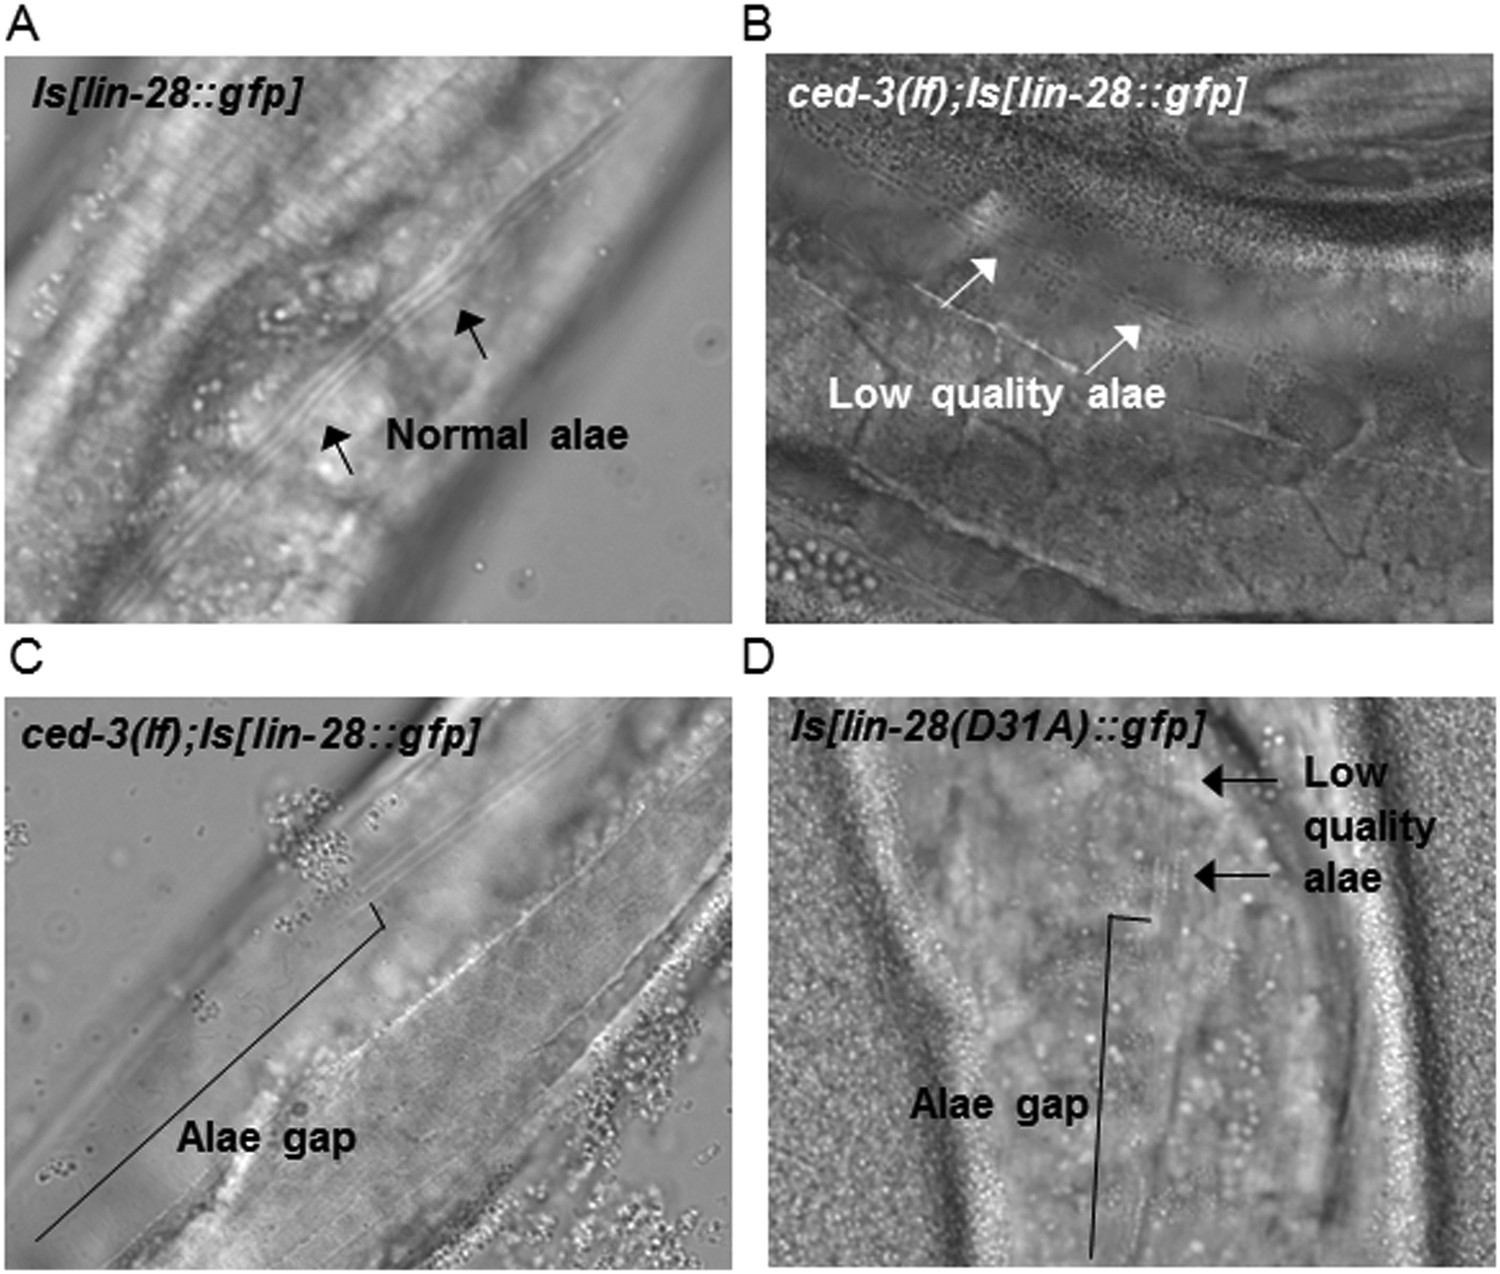
Loss of ced-3 function or mutating the CED-3 cleavage site of LIN-28 enhances adult alae defects by a multi-copy lin-28 transgene.
(A–D) Adult alae were scored using DIC optics (quantitation of findings is shown in Figure 9D). These images serve only as visual reference for the phenotypes scored. The strains are described in Figure 9—figure supplements 1–2.
Figure 9—figure supplement 4
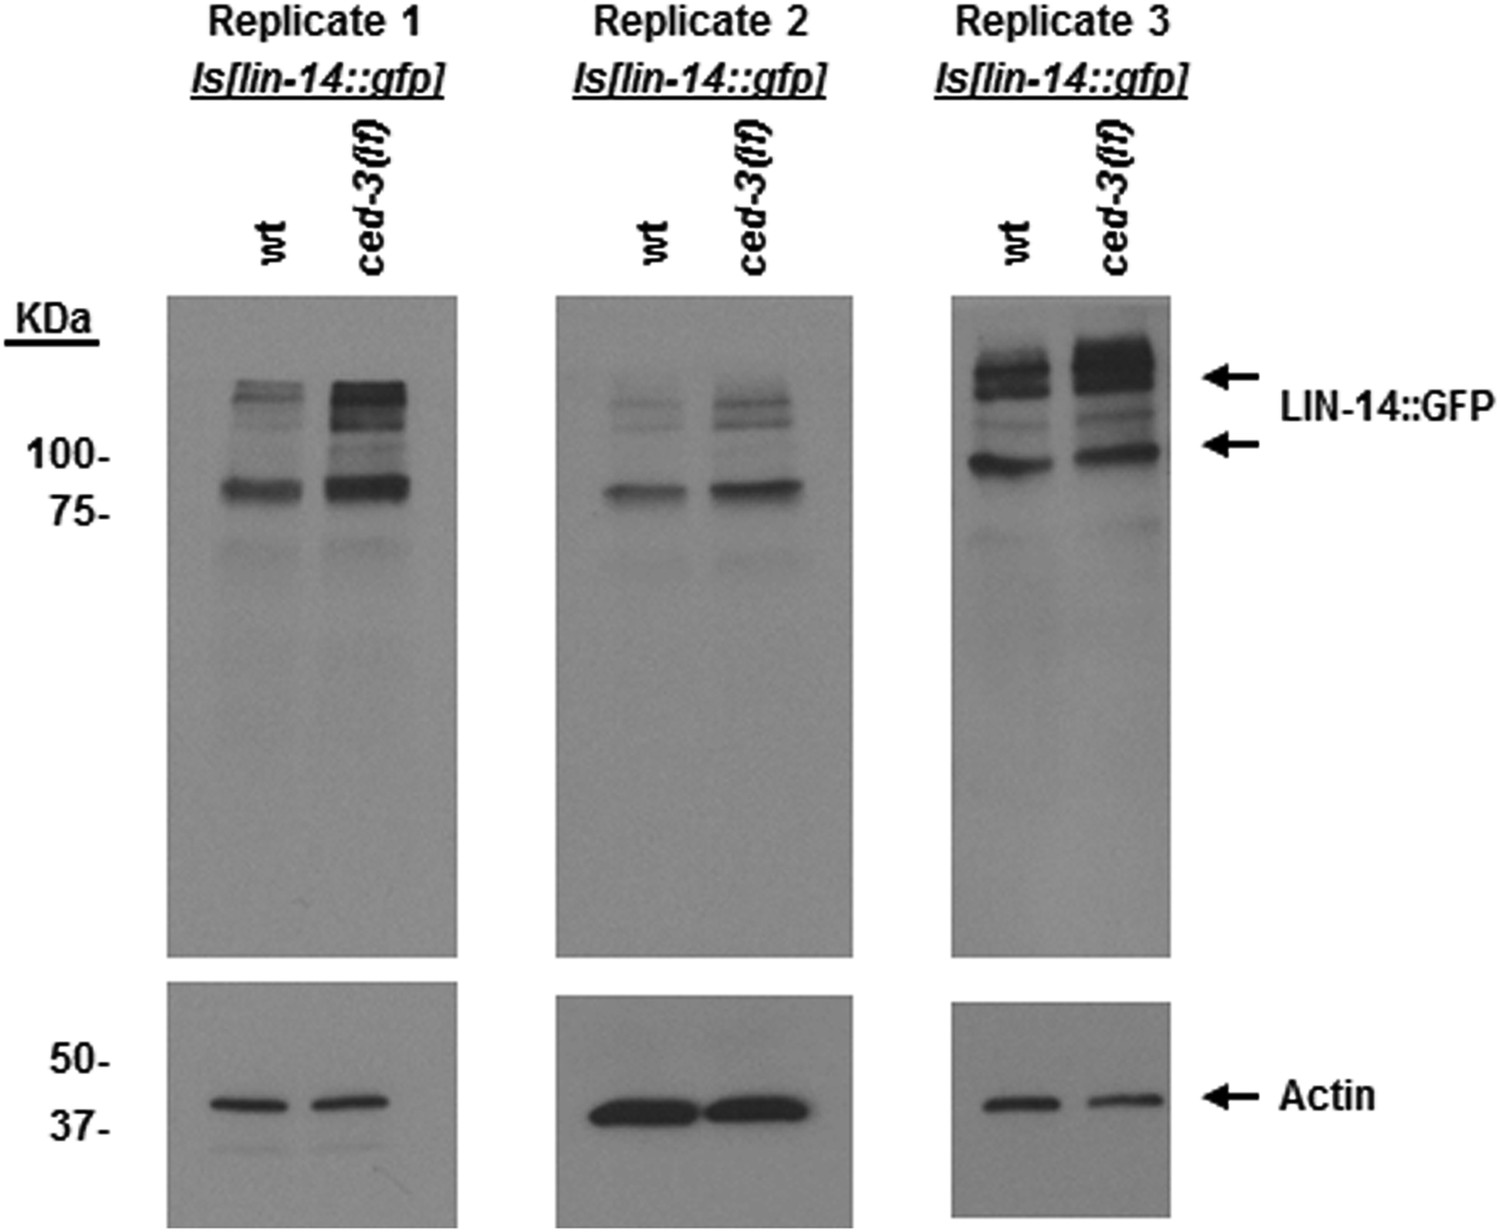
LIN-14 protein levels are increased in ced-3(lf) mutants at the first larval stage.
An integrated transgenic strain Is[lin-14::gfp] previously published (Olsson-Carter and Slack, 2010) was crossed with a ced-3(lf) mutation. Sibling offspring were isolated to obtain the Is[lin-14::gfp] (with wild-type ced-3 gene) and the ced-3(lf);Is[lin-14::gfp]. Results from three independent Western blots of three independent synchronous first stage larvae are shown here. Samples were synchronized, collected, processed, probed by Western blot with an anti-GFP antibody (Clontech, Antibody JL8) independently at different times. Though the difference between wild-type and ced-3(lf) is subtle, it is repeatable. The subtle effects seen for LIN-14 are also of note since it is, in part, an upstream positive regulator of lin-28. Thus, subtle effects may be physiologically significant.
Figure 10 with 1 supplement
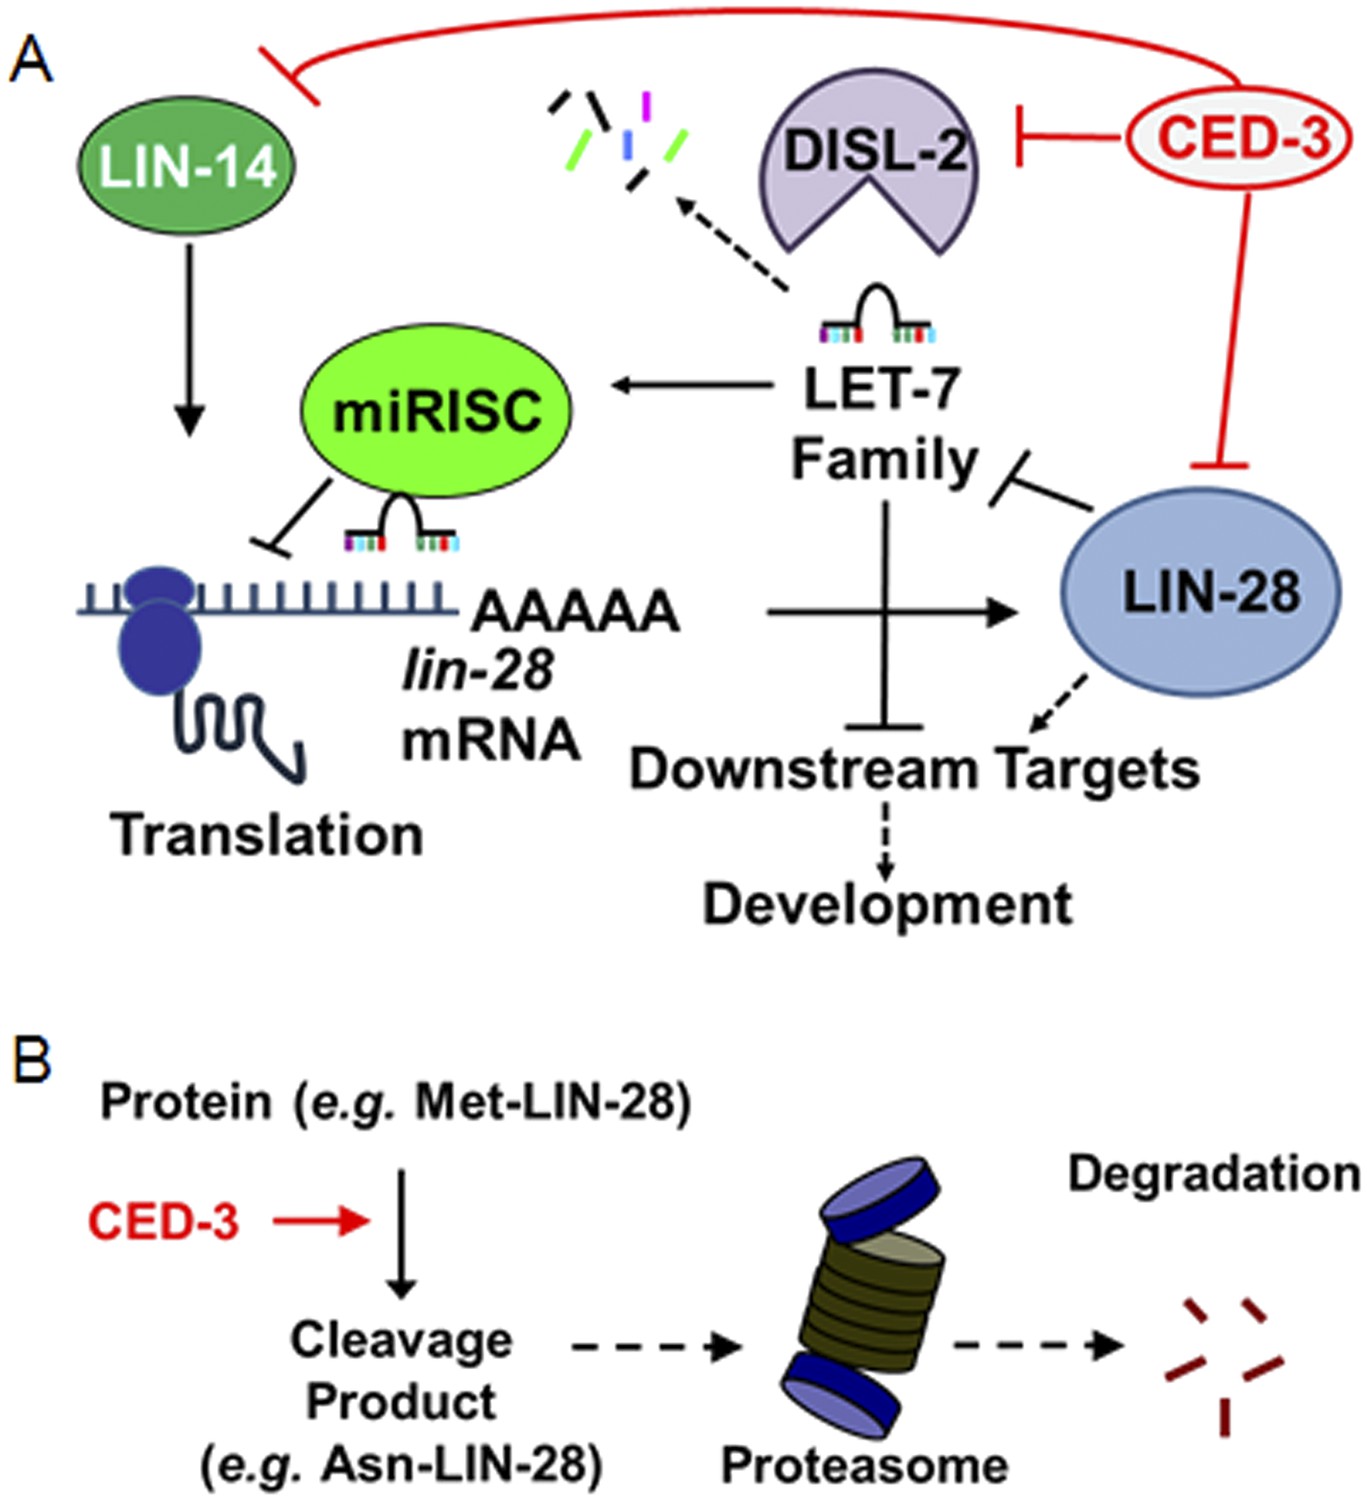
Model for CED-3 function in temporal cell fate patterning regulation.
(A) Model of CED-3 collaborating with miRNAs to repress the expression of LIN-14, LIN-28, and DISL-2. Red blocks indicate the new findings. For simplicity, many other factors in the pathway were not included here including additional regulators associated with this pathway that were also identified in our genomic enhancer screen (see Figure 10—figure supplement 1). (B) Hypothetical model for the biochemical role of CED-3 cleavage in protein turnover during development whereby a new N-terminus is generated which could potentially destabilize the protein according to the N-end rule (see text).
Figure 10—figure supplement 1

A more detailed genetic model for roles of CED-3 caspase in regulating the heterochronic pathway and for showing other genes from our genomic screen in this pathway.
Modified from the discussion provided by a recent review (Rougvie and Moss, 2013), this model is still simplified given the complex and dynamic processes (Ambros, 1989; Slack and Ruvkun, 1997; Ambros, 2000; Pasquinelli and Ruvkun, 2002; Resnick et al., 2010; Rougvie and Moss, 2013). Black arrows and blocks indicate aspects of the pathway that were previously known. Red blocks and font indicate the major findings of this study. Blue font indicates factors known to function in this pathway that were also identified in our enhancer screen (Supplementary file 2) as genetic interactors of GW182 (ain-1 and/or ain-2). The blue asterisk associated with let-7 is to indicate that we also identified the let-7 family miRNAs in our miRNA-ced-3 enhancer screen (Figure 5A,B) and that ced-3(lf) was able to enhance their specific temporal cell fate patterning phenotypes as seen with adult-specific alae defects (Figure 5D). The blue asterisks and dashed red lines for miR-1 and miR-246 indicate additional miRNAs we identified in our miRNA-ced-3 enhancer screen (Figure 5A,B). Both miR-1 and miR-246 are predicted to target lin-14 mRNA (See ‘Materials and methods’) but have not been experimentally demonstrated to do so here. They failed to show enhanced specific developmental timing defects and were not pursued further. Dashed arrows and blocks are intended to indicate a combination of complex direct and indirect effects ultimately affecting developmental fate and timing. ** Previous works have indicated DAF-12 functions on several components of the pathway (Rougvie and Moss, 2013; Hochbaum et al., 2011), providing the basis for us to have observed the enhanced developmental defects associated with ain-1(lf) and daf-12(RNAi) (Supplementary file 2). The exact mechanism of LIN-66 function is still unclear (dashed block) though it is able to negatively regulate LIN-28 function (Morita and Han, 2006). MSI-1 (Musashi-1) was identified as an RNA-binding protein that may be important for LIN-28-mediated regulation of pre-miRNA processing as well as translational regulation (Sakakibara et al., 1996; Kawahara et al., 2011). Interestingly, we also identified the C. elegans musashi-1 ortholog, msi-1, as an enhancer in our screen (Supplementary file 2). Following binding by LIN-28, pre-let-7 is poly-uridylated by a TUTase (poly-U-polymerase) to mark it for destruction. PUP-2 is indicated here as a C. elegans ortholog for TUTase and it was also identified in our screen (Supplementary file 2). Recently, the RNAse, Dis3l2 (Dis-3-like RNAse gene 2), was identified as the 3′-5′ exonuclease that degrades poly-uridylated-pre-let-7 miRNA and is the RNAse mutated in Perlman syndrome (Kawahara et al., 2011; Chang et al., 2013; Ustianenko et al., 2013). We suggest that the C. elegans gene F48E8.6 is the C. elegans ortholog of Dis3l2 and have therefore named it DISL-2 (Dis-3-like RNAse gene 2) (See Figure 6—figure supplement 1). The intricate network of regulatory factors shown here emphasizes the importance of this pathway and how CED-3 caspase cooperates with the miRISC and numerous other factors to control temporal cell fate patterning.
Additional files
-
Supplementary file 1
Definition of phenotypes scored in this study.
- https://doi.org/10.7554/eLife.04265.037
-
Supplementary file 2
List of ain-1 and ain-2 genetic interactors identified in this study and their relevant phenotypes in brief. RNAi clones are listed alphabetically by gene name. Relevant phenotypes indicated for the given strains are defined in Supplementary file 1.
- https://doi.org/10.7554/eLife.04265.038
-
Supplementary file 3
Phenotypes observed for reverse confirmation test with ain-1 and ain-2 RNAi. Effects indicated are relative to the given mutant strain phenotype on mock RNAi. These are results for one generation on the indicated RNAi and not with RNAi enhancing mutations.
- https://doi.org/10.7554/eLife.04265.039
-
Supplementary file 4
List of C. elegans strains and relevant genotypes used in this study.
- https://doi.org/10.7554/eLife.04265.040
Download links
A two-part list of links to download the article, or parts of the article, in various formats.
Downloads (link to download the article as PDF)
Open citations (links to open the citations from this article in various online reference manager services)
Cite this article (links to download the citations from this article in formats compatible with various reference manager tools)
CED-3 caspase acts with miRNAs to regulate non-apoptotic gene expression dynamics for robust development in C. elegans
eLife 3:e04265.
https://doi.org/10.7554/eLife.04265


