Ionic selectivity and thermal adaptations within the voltage-gated sodium channel family of alkaliphilic Bacillus
- Howard Hughes Medical Institute, Boston Children's Hospital, United States
- Toyo University, Japan
- Icahn School of Medicine at Mount Sinai, United States
- Harvard Medical School, United States
Figures
Figure 1 with 1 supplement
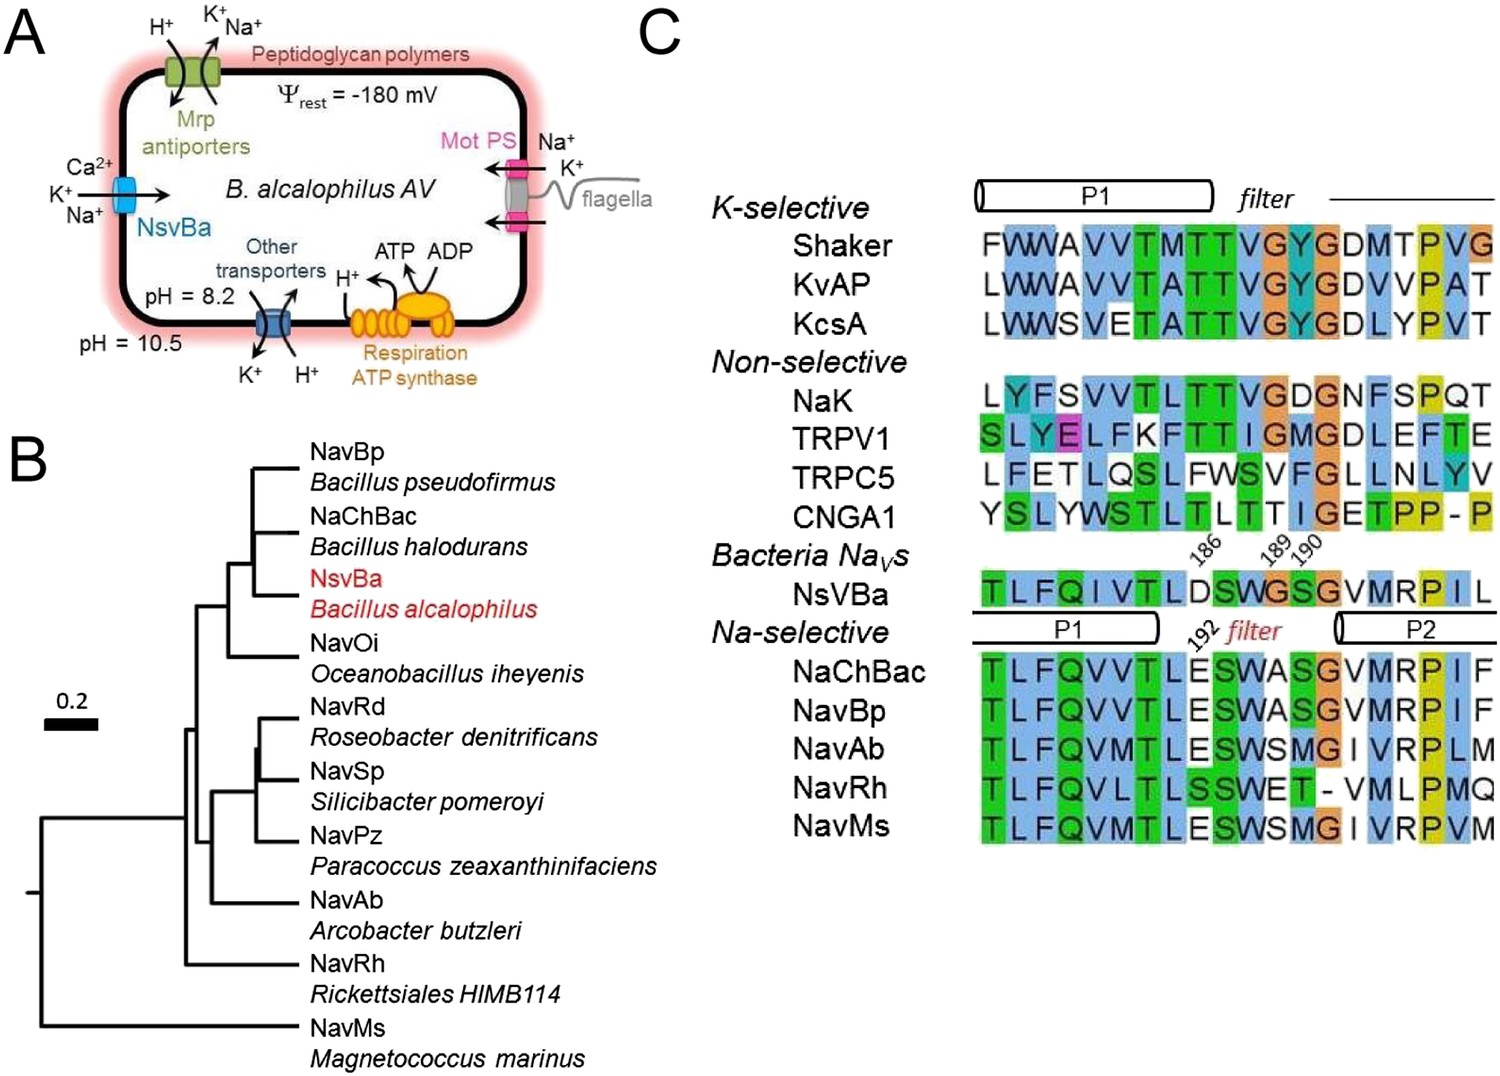
The alkaliphilic Bacillus cation cycle and the relationship between bacteria Nav homologs.
(A) A diagram depicting the membrane proteins involved in the Na+ cycle of Bacillus alcalophilus. The cation/proton antiporters, including Mrp antiporters, catalyze net proton accumulation in the cytoplasm in cells that are extruding protons during respiration. Na+ re-entry in support of pH homeostasis is achieved by Na+ solute symporters and through the voltage-gated channel, NsvBa . (B) Relatedness within functionally characterized members of the bacterial sodium channel superfamily. A rooted phylogenic tree analysis of bacterial Nav channels calculated by using the CLUSTALW program (http://clustalw.genome.jp). Branch lengths are proportional to the sequence divergence (scale bar = 0.2 substitutions per amino acid site). (C) An alignment of the selectivity filters from various Na+, K+, and nonselective ion channels. The pore region from the indicated ion channel families (italic) were aligned using the ClustalW multiple sequence alignment program applying the default color scheme with <60% conservation of character: Hydrophobic (blue); polar (green); glutamine, glutamate, aspartate (magenta). Special amino acids are designated with their own color: glycine (orange); proline (yellow) and tyrosine or histidine (cyan). The barrels indicate the regions spanning the pore helices found in the Shaker (K+-selective), NaK and NavRh crystal structures.
Figure 1—figure supplement 1
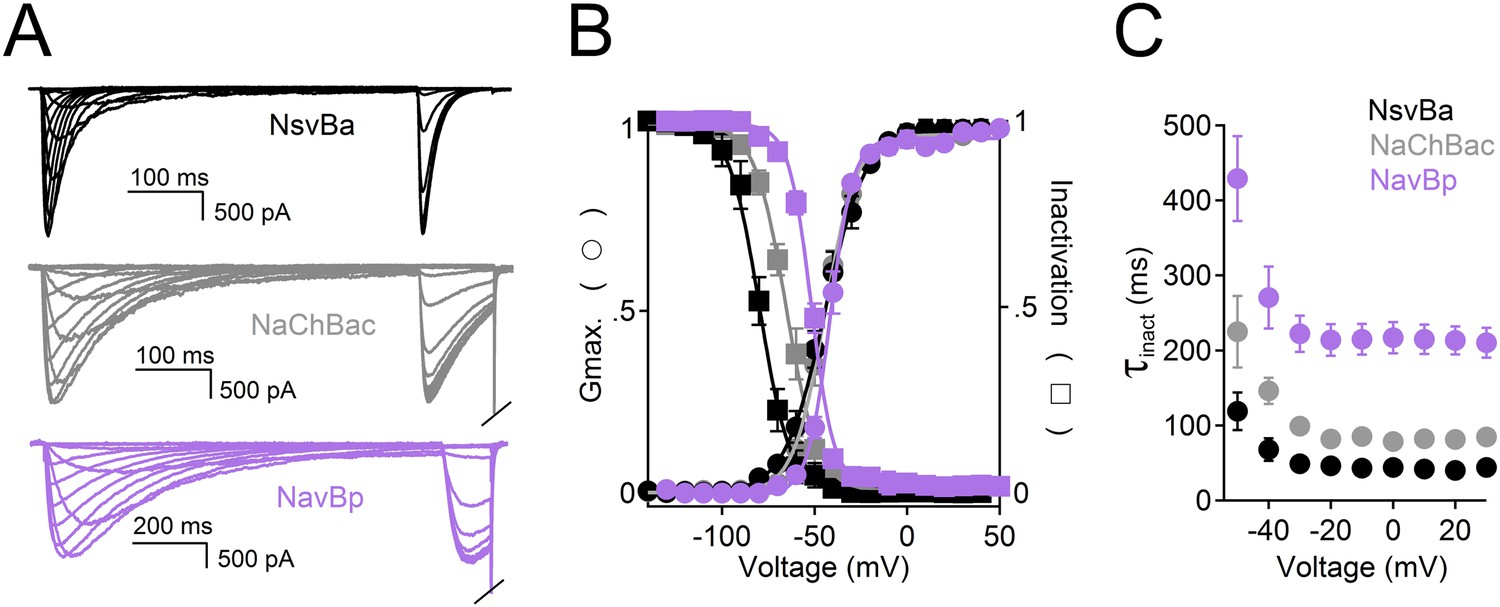
A comparison of the voltage-dependence of the bacterial Nav channels.
(A) Left, Example traces from HEK 293T cells expressing sodium channels, NsvBa (black), NaChBac (gray) and NavBp (purple). Currents were activated by 0.5 s (NsvBa and NaChBac) or 1 s NavBp prepulses of increasing potential followed by a test pulse to −20 mV. (B) Resulting conductance-voltage and inactivation-voltage relationships were measured by plotting the average prepulse peak current converted to conductance, and reduction of test pulse peak current, respectively as a function of prepulse potential (n = 6–10, Error = ±SEM) and fit to a sigmoid equation. (C) Inactivation rate (τinact) -voltage relationship was measured by fitting the current decay to a single exponential equation for NsvBa (Black), NaChBac (gray) and NavBp (purple).
Figure 2 with 1 supplement
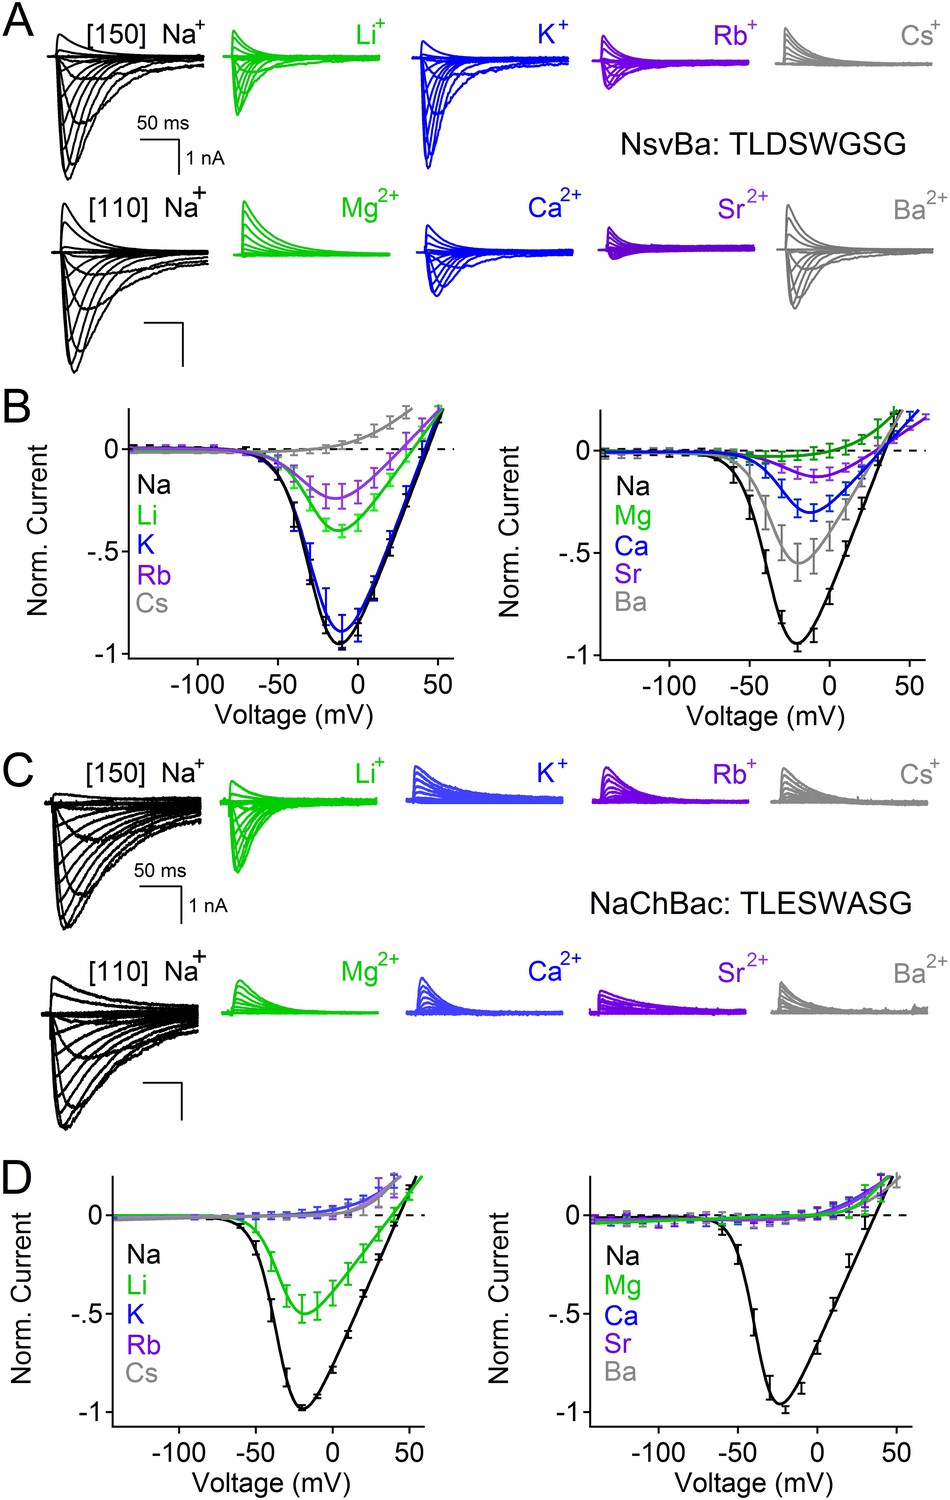
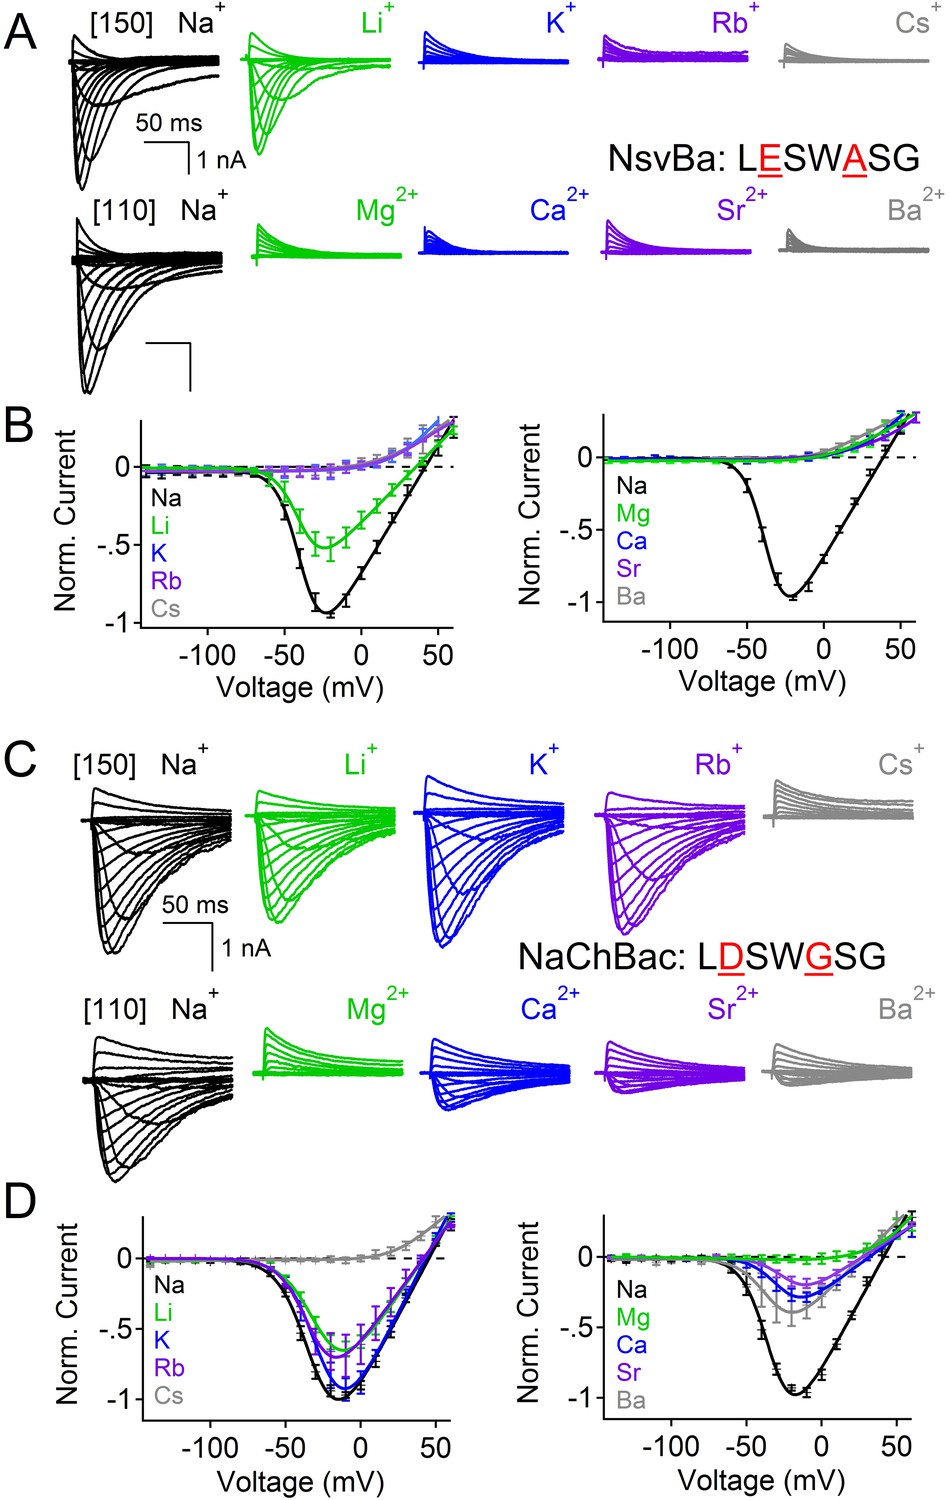
Comparison of cation selectivity between the nonselective NsvBa and Na+-selective NaChBac channels.
(A and C) Representative current traces from NsvBa channel (A) or from the NaChBac channel (C) showing the first 0.25 s of 0.5 s activations from −180 mV holding potential: Top, 150 mM Na+ was substituted with an equal concentration of the indicated monovalent ions; Bottom, 110 mM Na+ was substituted for equal concentrations of the indicated divalent cations. (B and D) Resulting current-voltage relationships measured for the conditions tested in (A) and (C). NsvBa: n = 5–9, NaChBac: n = 6–9; Error = ±SEM.
Figure 2—figure supplement 1
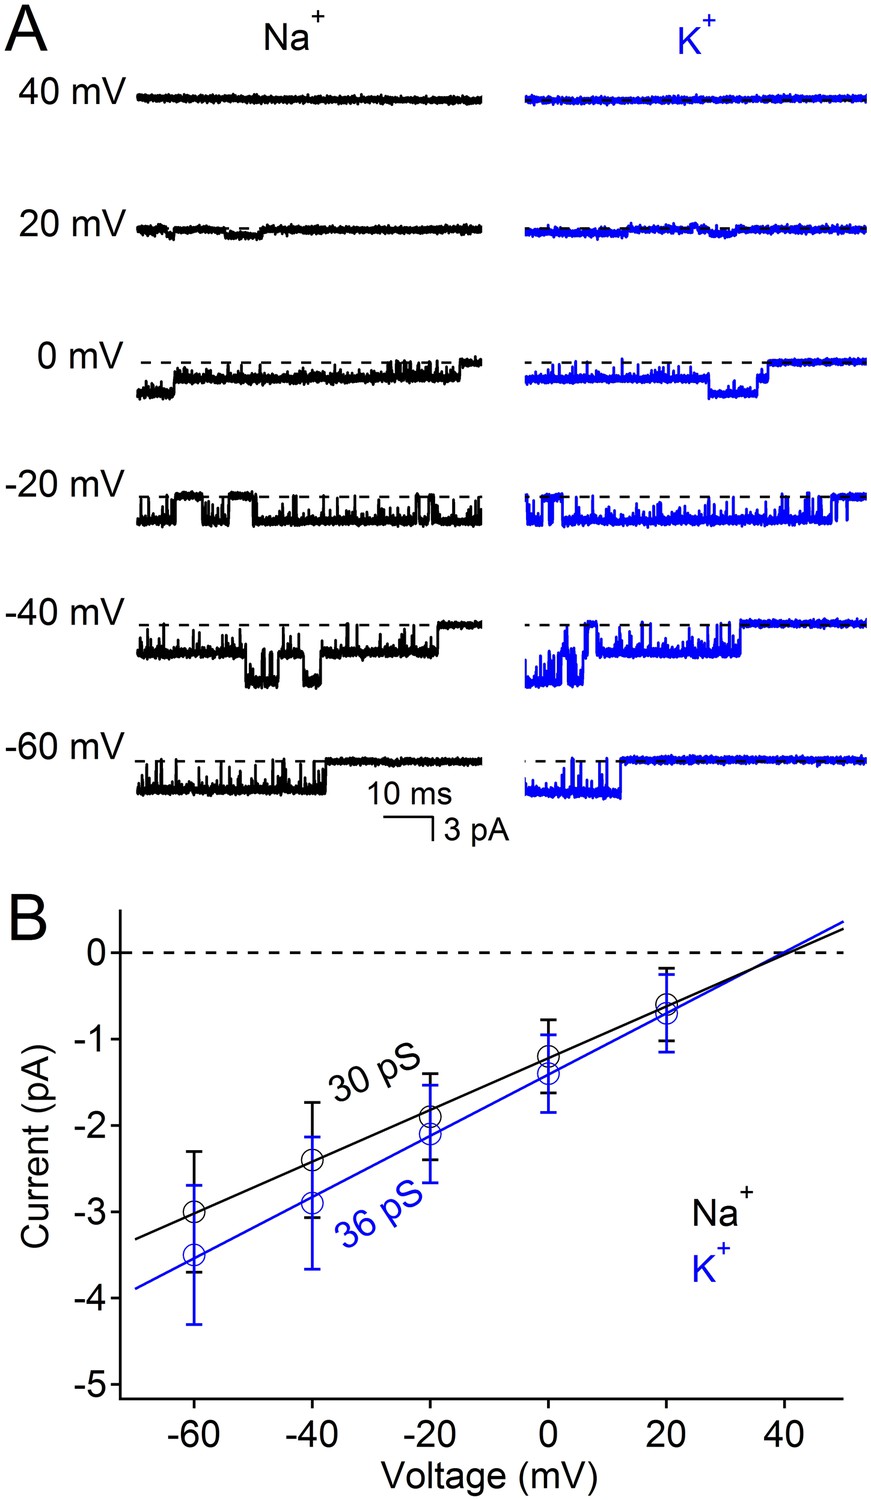
Na+ and K+ are highly conductive through the nonselective NsvBa channel.
(A) Example single channel opening events recorded from Na+ and K+ conditions in the inside-out patch configuration. (B) Average current amplitudes plotted over the indicated potentials (n = 4, Error = ±SEM). The conductance for the K+ (36 pS) and Na+ (30 pS) conditions was derived from the slope of a linear fit of the current amplitudes.
Figure 3 with 1 supplement
Reciprocal substitutions of the NsvBa and NaChBac filters transfers cation selectivity.
(A, B) The selectivity mutant NsvBa channel containing the NaChBac selectivity filter sequence TLESWASG (D186E: G189A) or the (C, D) mutant NaChBac channel containing the NsvBa selectivity sequence TLDSWGSG (E192D:A195G). (A and C) Representative current traces from the mutant channels under the same conditions described in Figure 2. (B and D) Resulting current-voltage relationships measured for the mono- and divalent conditions. (n = 4–9 for both channels, Error = ±SEM).
Figure 3—figure supplement 1
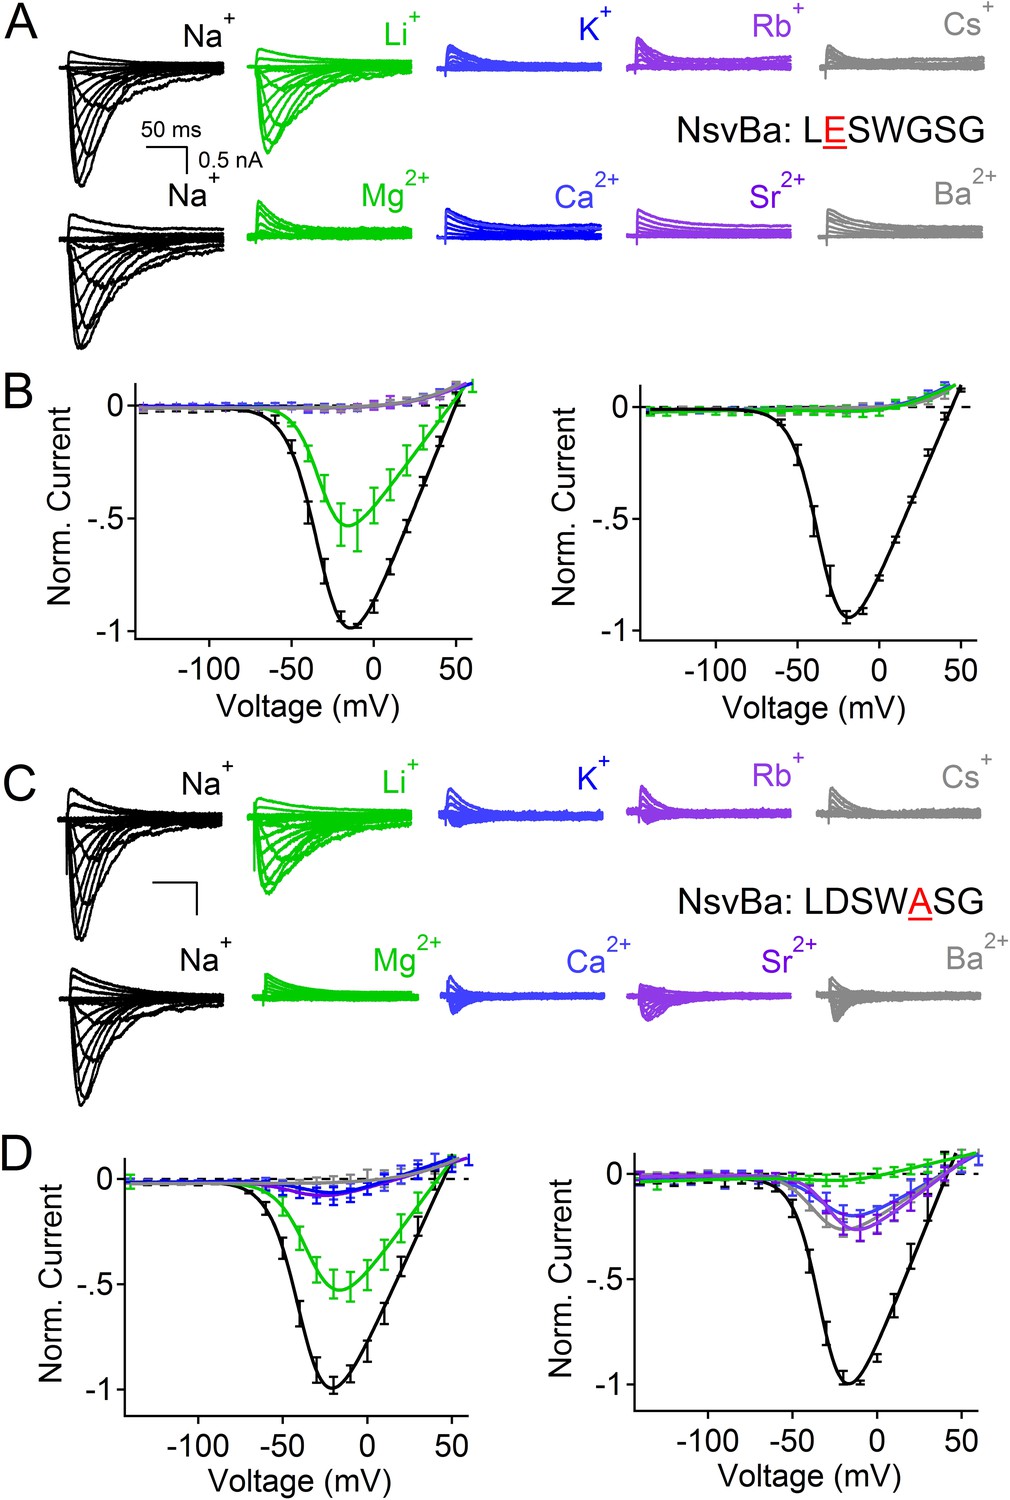
The effects of the single mutations D186E and G189A in the NsvBa selectivity filter.
(A and C) Representative current traces recorded from the NsvBa selectivity filter mutations D186E (sequence TLESWGSG) and G189A (sequence TLDSWASG) in response to 10 mV depolarizing activation steps from −140 mV in (top) monovalent or (bottom) divalent extracellular conditions. (B and D) Resulting current–voltage relationships measured for the mono- (150 mM) or divalent (110 mM) conditions. Current amplitudes are normalized to either the maximum inward current recorded in the 150 mM or 110 mM Na+ condition (n = 4–9 cells for both channels, Error = ±SEM).
Figure 4 with 2 supplements
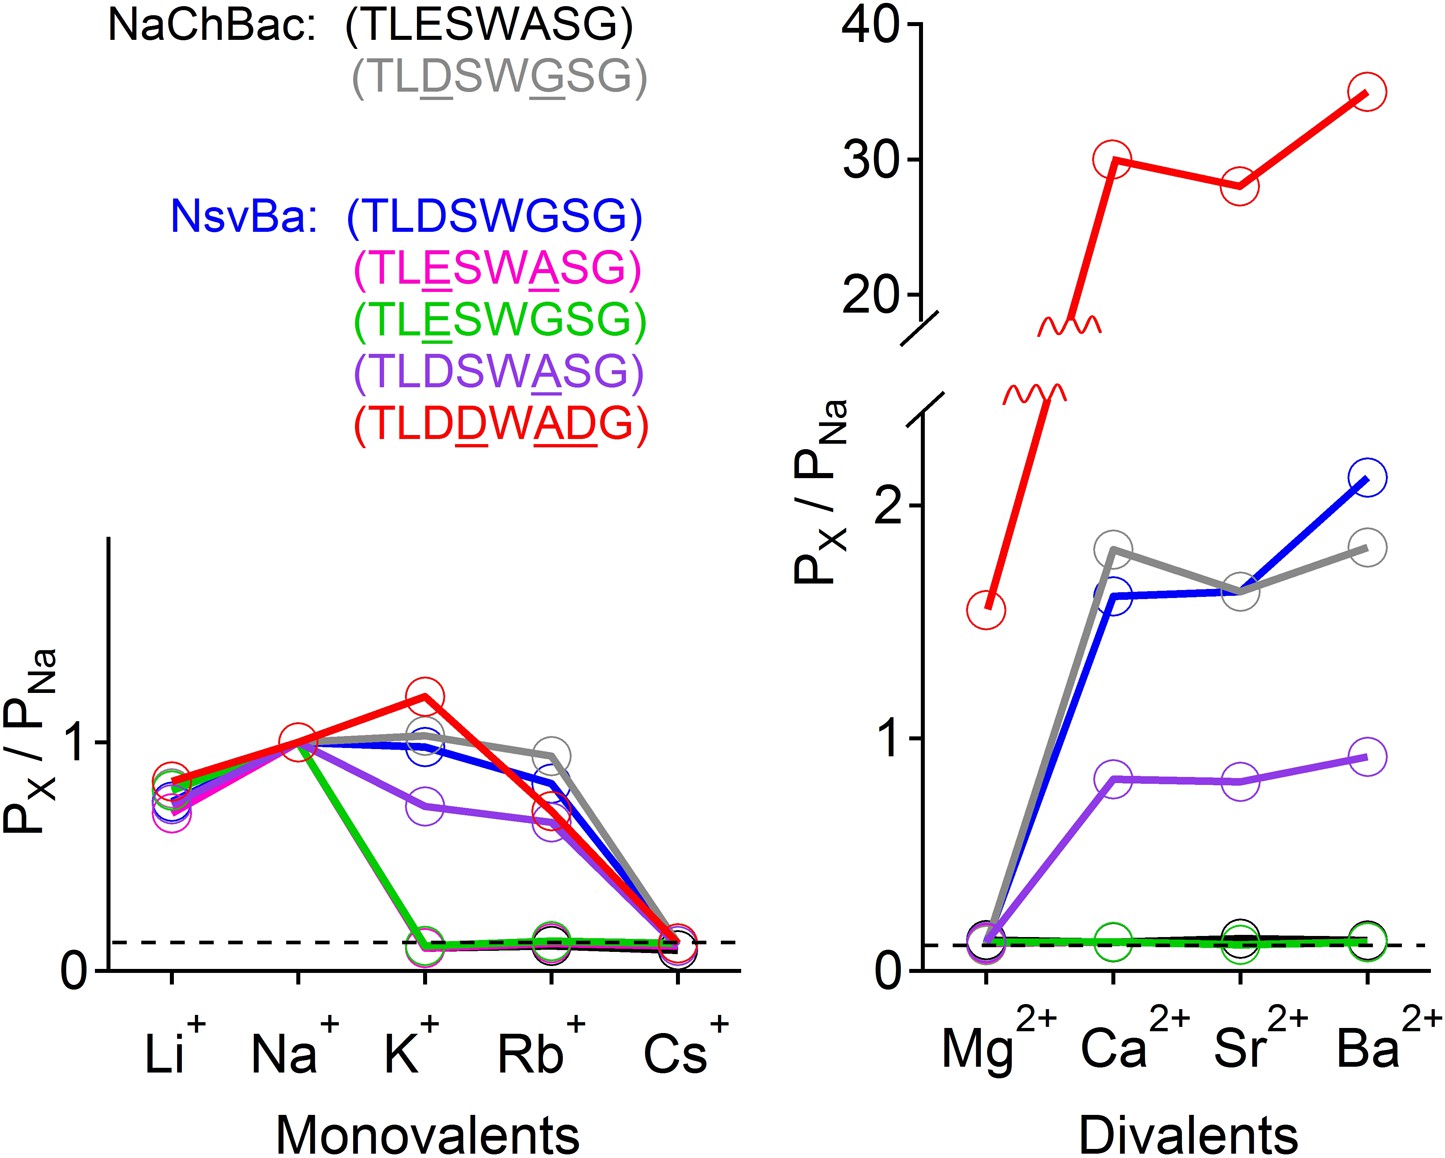
Summary of the relative permeability of cations from selectivity filter mutations.
The relative permeability of monovalent and divalent cations against sodium for each channel tested. Values are listed in and Figure 4—figure supplement 1. The relative permeability (Px/PNa) was estimated using the Goldman-Hodgkin-Katz equation. Dashed lines indicate the lower limit of Px/PNa detection under our experimental conditions (See ‘Materials and methods’).
Figure 4—figure supplement 1
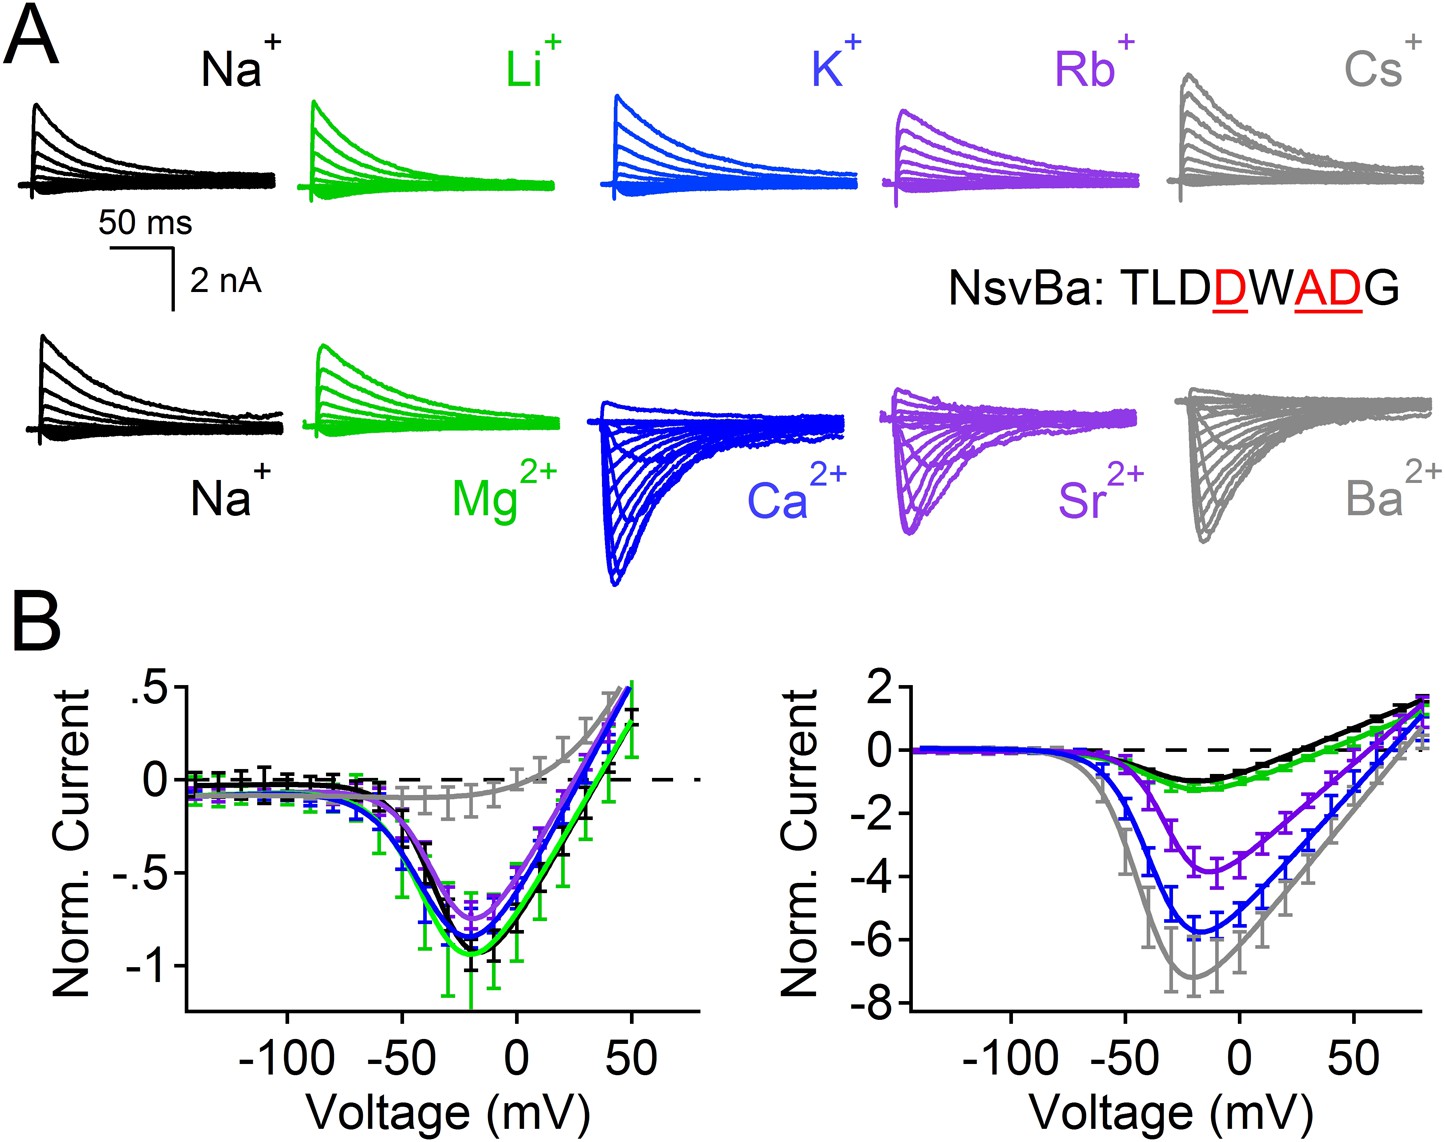
NsvBa can be converted into a divalent cation-selective channel.
The selectivity mutant NsvBa channel was replaced with the CaVBac selectivity filter sequence TLDDWADG (S187D:G189D:S190D). (A) Representative current traces from the mutant channels under the same conditions described in Figure 2. (B) Resulting current-voltage relationships measured for the mono and divalent conditions. (n = 4–8 for each channel, Error = ±SEM).
Figure 4—figure supplement 2
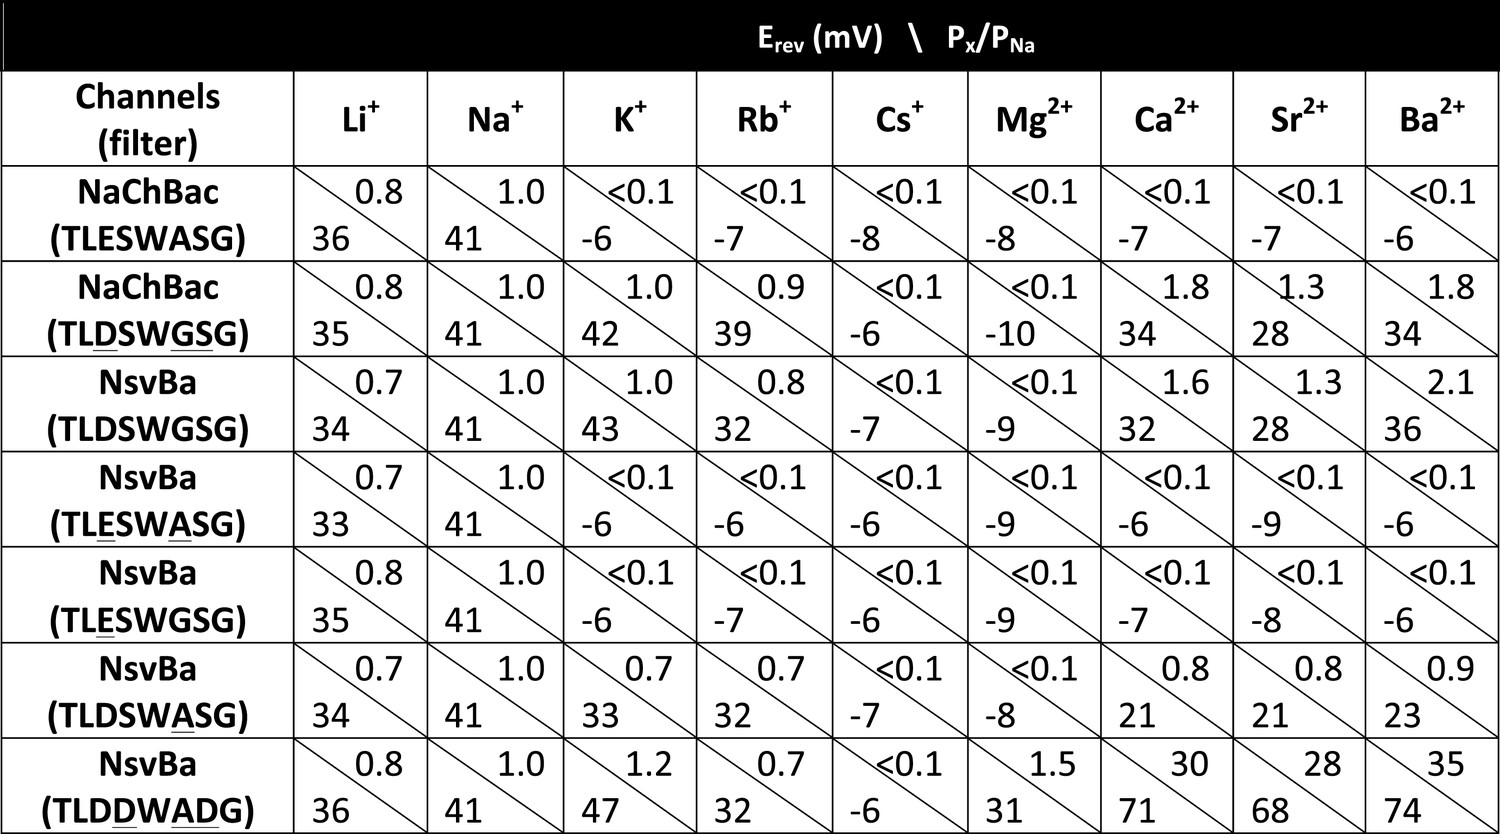
Reversal potentials (Erev) measured at steady state with calculated relative permeability (Px/PNa) for bacterial Nav channels.
https://doi.org/10.7554/eLife.04387.011
Figure 5 with 1 supplement

The bacterial Nav channels are modulated by extracellular alkaline pH (pHo).
Left, representative traces recorded from one cell expressing the NsvBa (black), NaChBac (gray) and hNav1.1 (green) channels in 150 mM NaCl conditions with the external pH adjusted to 6.4, 7.4, 8.4 and 9.4. Currents were activated by +10 mV steps from a holding potential of −140 mV (NsvBa and NaChBac) or −120 mV (hNav1.1). Right, resulting voltage current relationship normalized to the peak current measured in the 7.4 pHo condition (n = 4–7 for each channel, Error = ±SEM).
Figure 5—figure supplement 1
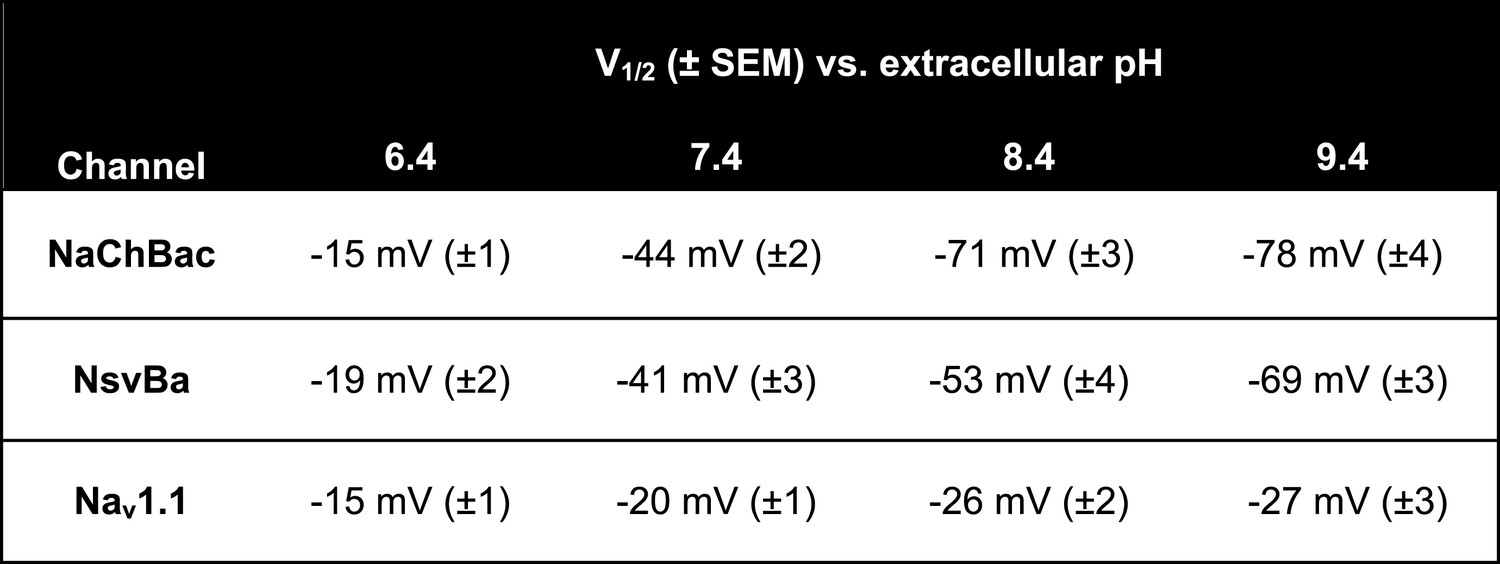
Nav steady state voltage-dependence of activation (V1/2) measured in different extracellular pH (pHo) conditions.
https://doi.org/10.7554/eLife.04387.013
Figure 6 with 1 supplement
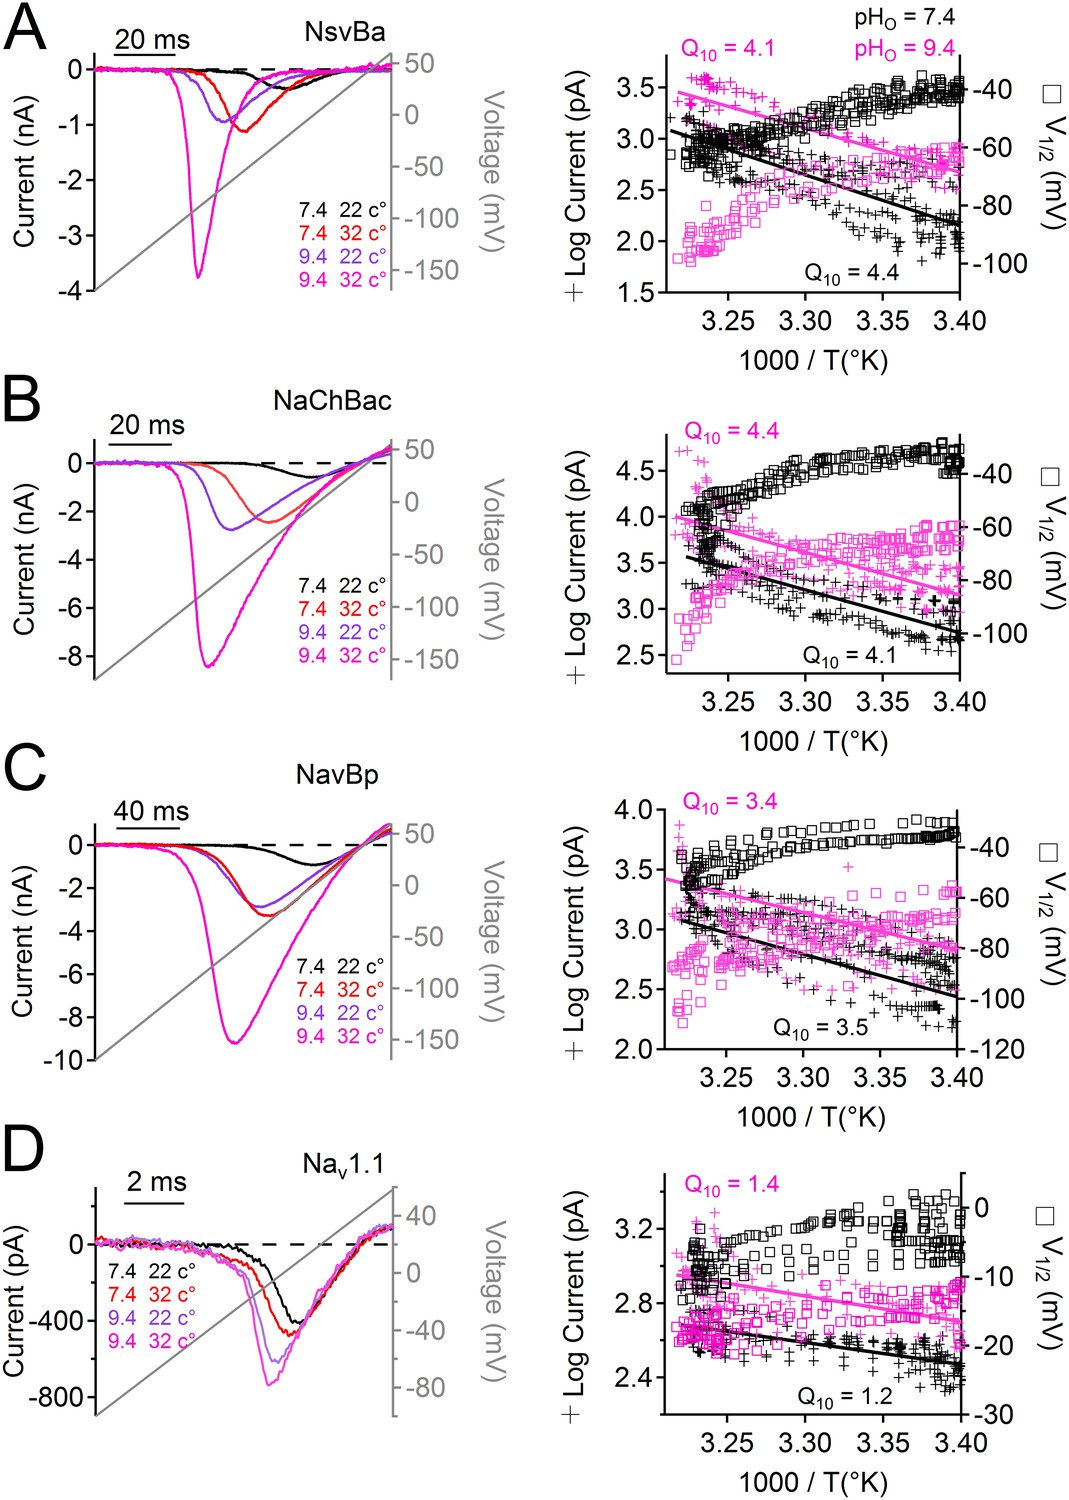
Temperature and pH dependence of sodium channels.
Left Example INa traces conducted by (A) NsvBa, (B) NaChBac, (C) NavBp and (D) Nav1.1 channels, when the extracellular saline (pH = 7.4 or 9.4) was heated from 20 to 37°C. Channels were activated by a 0.5 Hz voltage ramp. Voltage ramps were applied for different durations to compensate for different channel kinetics of activation and inactivation: NsvBa and NaChBac (100 ms); NavBp (200 ms) and Nav1.1 (10 ms). Right, Arrhenius plots with resulting peak current (plus symbols) and V1/2 (open squares) are graphed as a function of temperature. The peak currents were fit to a linear equation and the resulting slope (Peak Q10) given for both external pH conditions (n = 4).
Figure 6—figure supplement 1
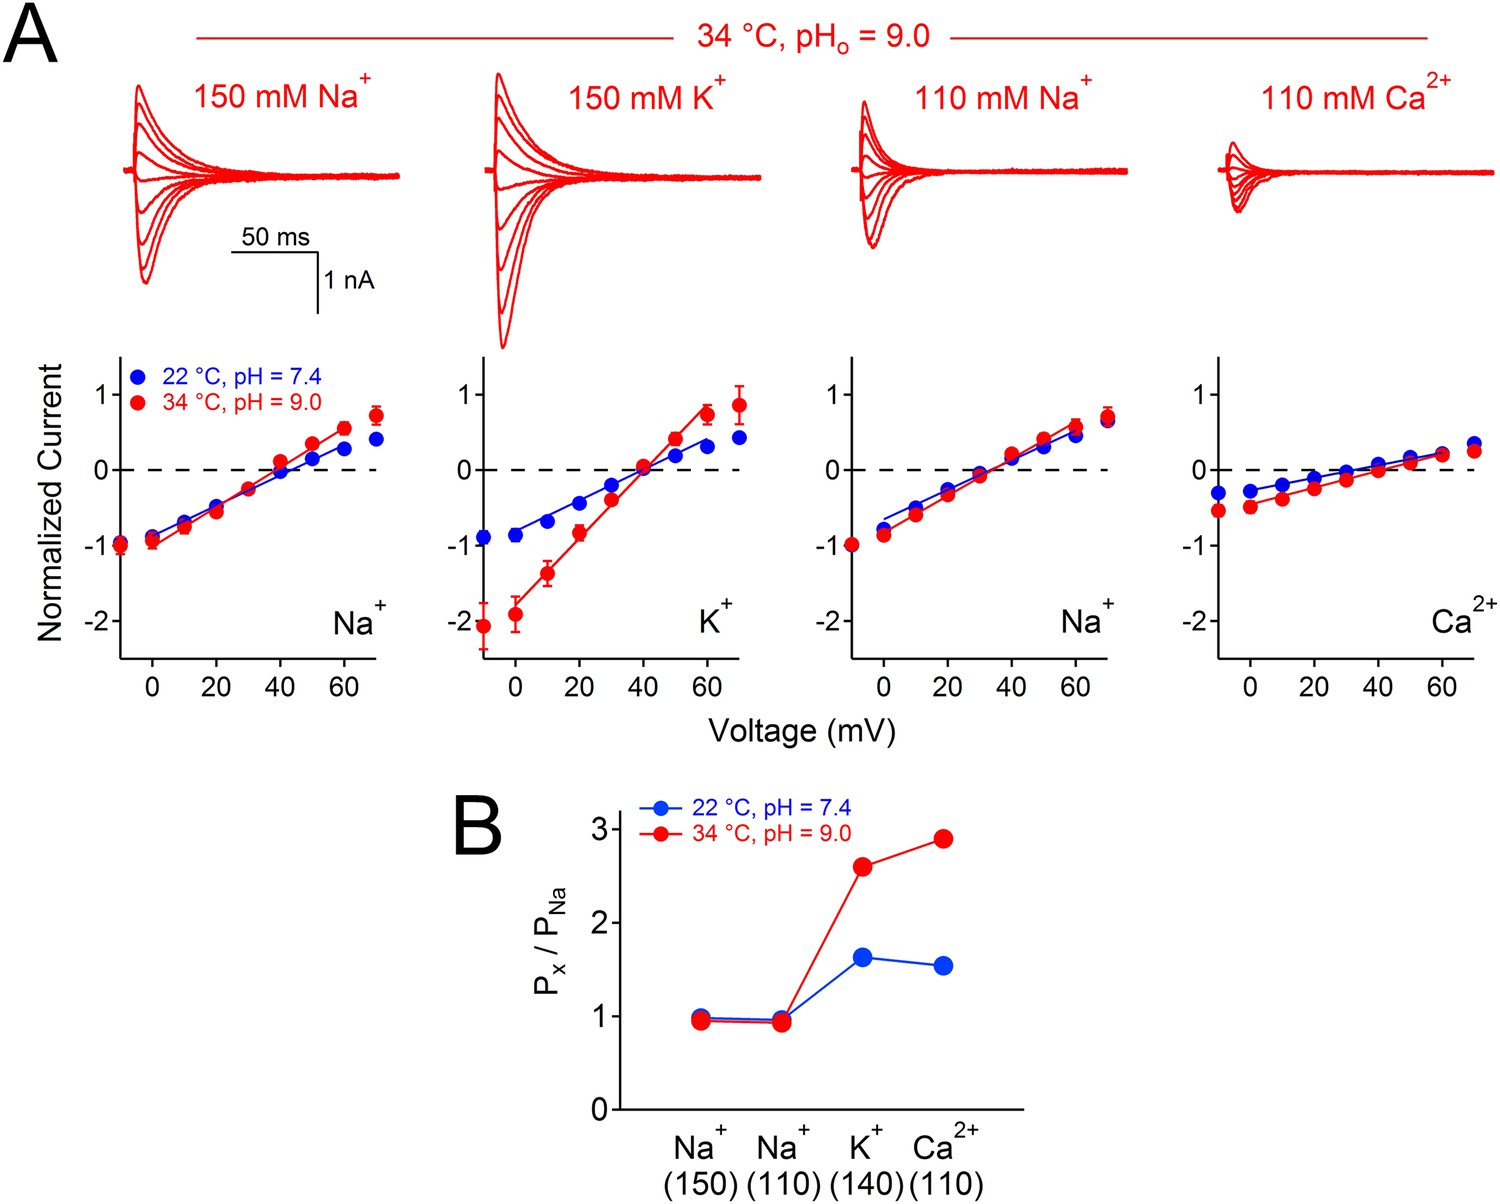
The effect of temperature and pH on NsvBa selectivity.
(A) Top, Representative NsvBa current traces recorded at 34⁰C under different extracellular cationic conditions with a pH = 9. Currents were activated by increasing potentials from −10 mV to 70 mV from a holding potential of −140 mV. Bottom, Corresponding current–voltage relationships measured under the conditions listed above (n = 4 or 5 for each condition, Error = ±SEM). Peak inward currents were normalized to the Na+ current measured either in 110 or 150 mM extracellular solution. Erev was calculated by fitting the current from 0 mV to 60 mV to a linear equation, and determining the potential at zero current. When corrected for liquid junction potential differences in the salines, Erev under these conditions were 40 mV for 150 mM Na+; 36 mV for 110 mM Na+; 41 mV for 110 mM Ca2+ and 43 mV for 150 mM KCl. (B) The calculated relative permeability for cations measured at 22⁰C and 34⁰C.
Figure 7 with 1 supplement
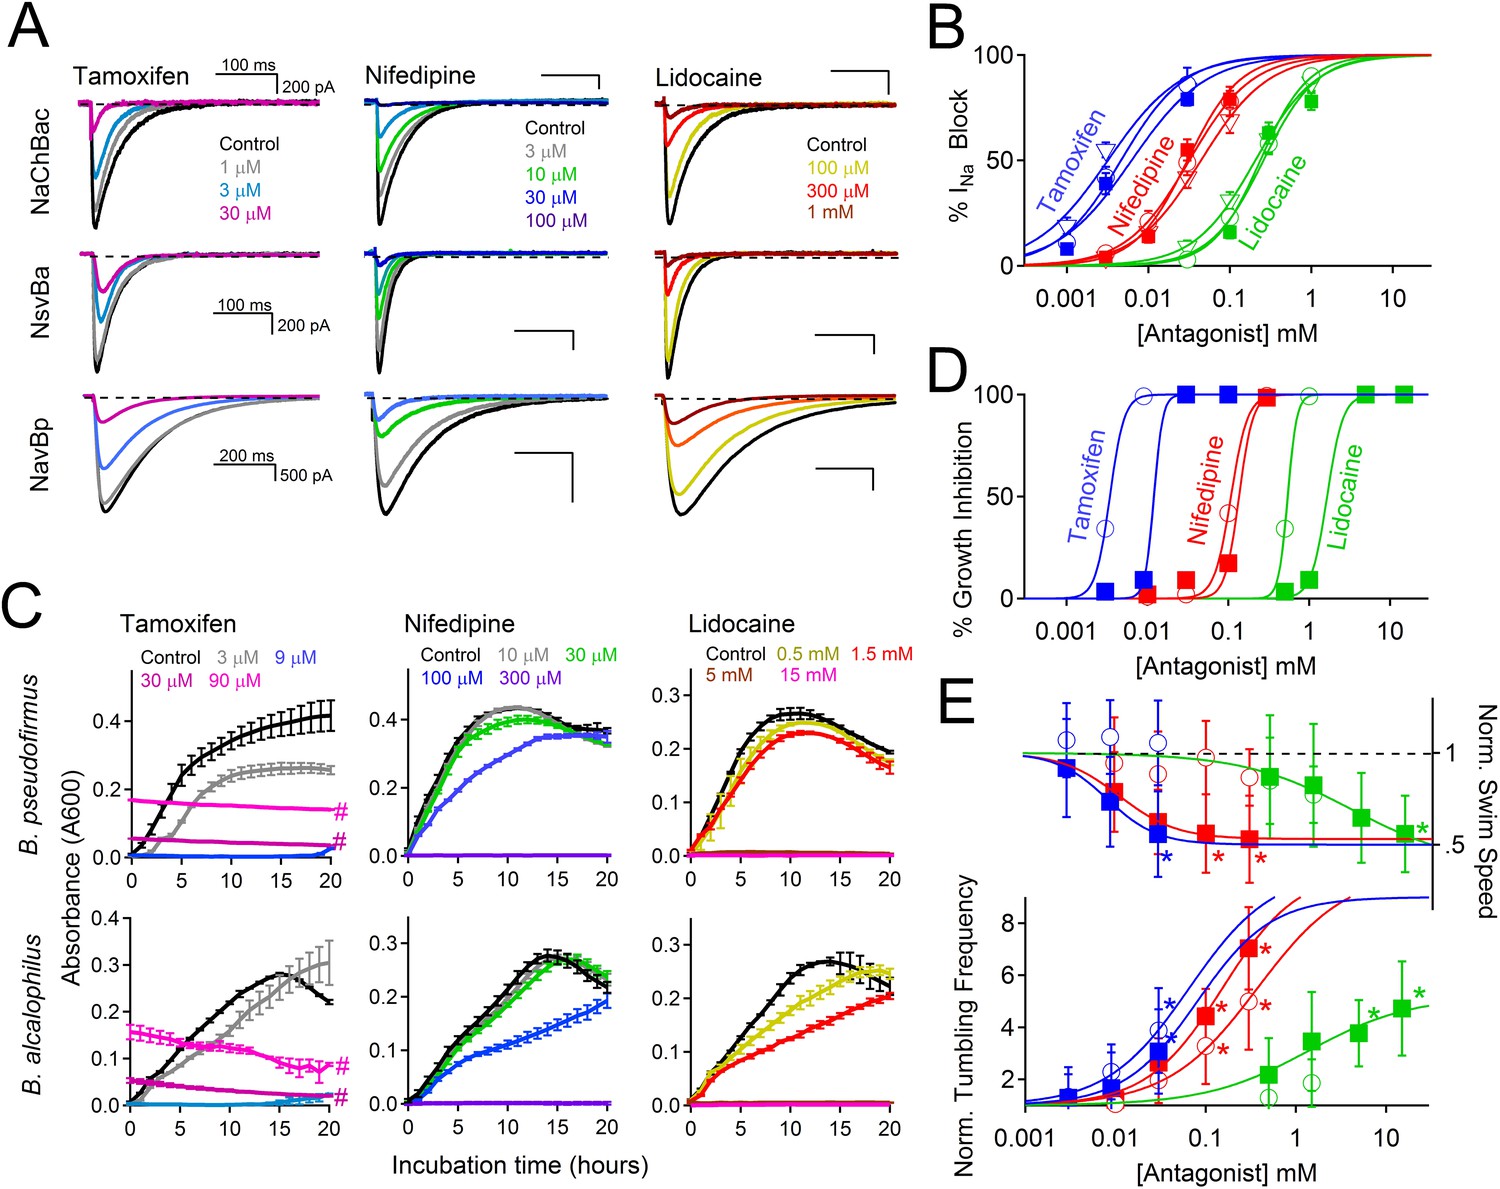
Antagonism of Nav channels blocks the growth and motility of alkaliphilic Bacillus.
(A) Example Na+ currents from NaChBac, NsvBa and NavBp channels in the presence of vehicle control (≤0.1% DMSO) and extracellularly applied drugs. Currents were activated by a 0.2 Hz train of 500 ms depolarizations to 0 mV from −140 mV. (B) The resulting NsvBa (open circles) and NaChBac (filled triangles) Na+ current block-drug relationship by tamoxifen, nifedipine and lidocaine (n = 4–6 cells per concentration, Error = ±SEM). (C) The effect of drugs on the time course of bacterial growth. (D) The resulting drug antagonism of growth by Bacillus alcalophilus (open circles) and Bacillus pseudofirmus (filled squares) inferred by light spectroscopy 600 λ absorbance (n = 4 growth trials, Error = ±SEM). Tamoxifen is a fluorescent compound which significantly absorbs 600 λ light at concentrations above 30 μM, indicated by a hashtag (#). (E) The effect of nifedipine, tamoxifen, and lidocaine on Bacillus alcalophilus (open circles) and pseudofirmus (filled squares) tumbling and swim speed (n = 4 trials, Error = ±SEM). Statistical significance of motility in untreated and drug-treated cells using a Student's t-test and indicated by an asterisk (p < 0.05) (*). EC50 and IC50 values for all assays are listed in Figure 7—figure supplement 1.
Figure 7—figure supplement 1
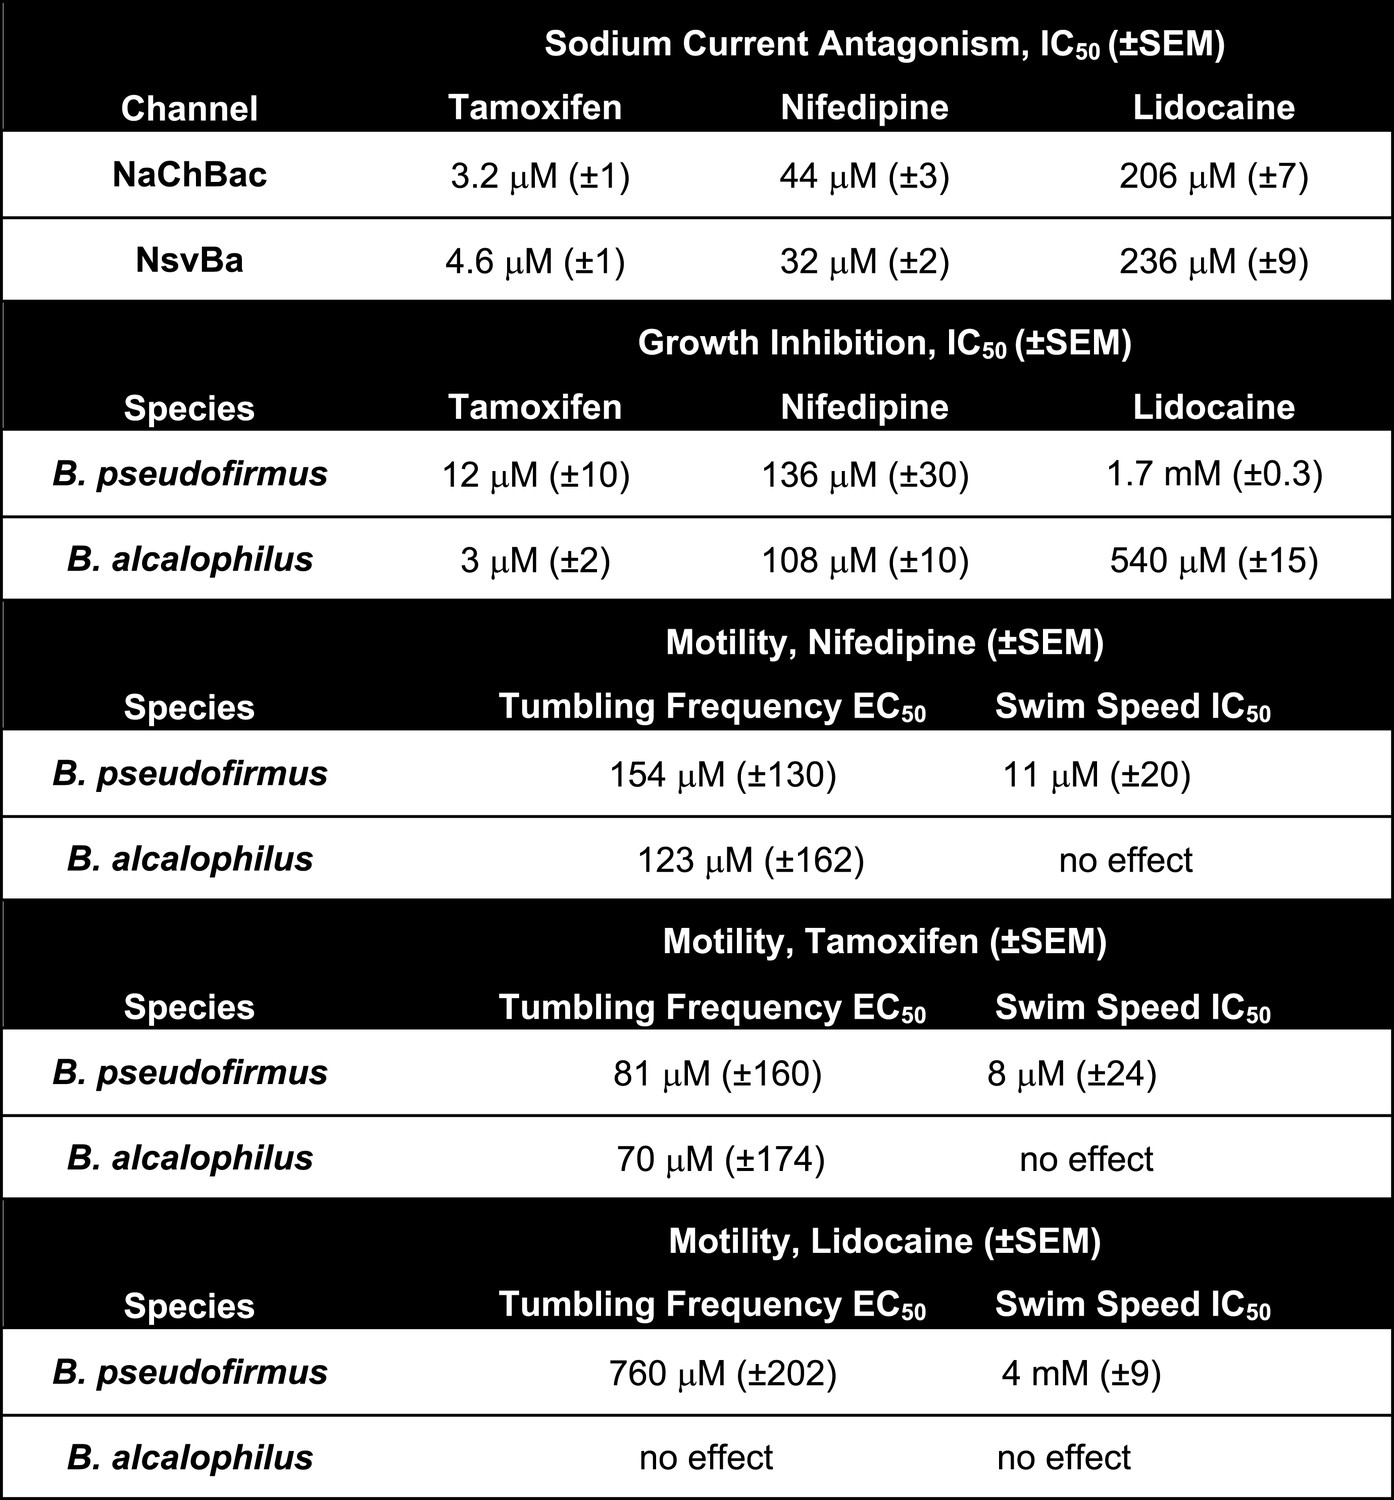
The effect of Nav antagonist on INa, bacteria motility and growth by drugs: lidocaine, tamoxifen and nifedipine.
https://doi.org/10.7554/eLife.04387.017Download links
A two-part list of links to download the article, or parts of the article, in various formats.
Downloads (link to download the article as PDF)
Open citations (links to open the citations from this article in various online reference manager services)
Cite this article (links to download the citations from this article in formats compatible with various reference manager tools)
Ionic selectivity and thermal adaptations within the voltage-gated sodium channel family of alkaliphilic Bacillus
eLife 3:e04387.
https://doi.org/10.7554/eLife.04387


