Lymph node stromal cells constrain immunity via MHC class II self-antigen presentation
- Vrije Universiteit Medical Center, Netherlands
- University of Porto, Portugal
- University Medical Center Utrecht, Netherlands
Figures
Figure 1

Lymph node stromal cells express MHC-II in the steady-state.
(A) MHC-II expression on lymph node stromal cells was assessed by flow cytometry. Fibroblastic reticular cells (FRCs) were identified as CD45−gp38+CD31− cells; lymphatic endothelial cells (LECs) as CD45−gp38+CD31+ cells; and blood endothelial cells (BECs) as CD45−gp38−CD31+ cells. Filled histograms represent control staining, whereas open histograms represent MHC-II expression. Representative example of five independent experiments performed. (B) mRNA expression of MHC-II (H2-Ab1) and MHC-II-related genes, CD74, H2-M, and LAMP-1, was determined on wild-type FACS-sorted stromal cells by real-time PCR. Total pLN cells (arbitrarily set at one) and FACS-sorted CD45+MHC-II- and CD45+MHC-II+ cells were used as controls. The data represent mean ± SEM; n = 4.
Figure 2 with 7 supplements

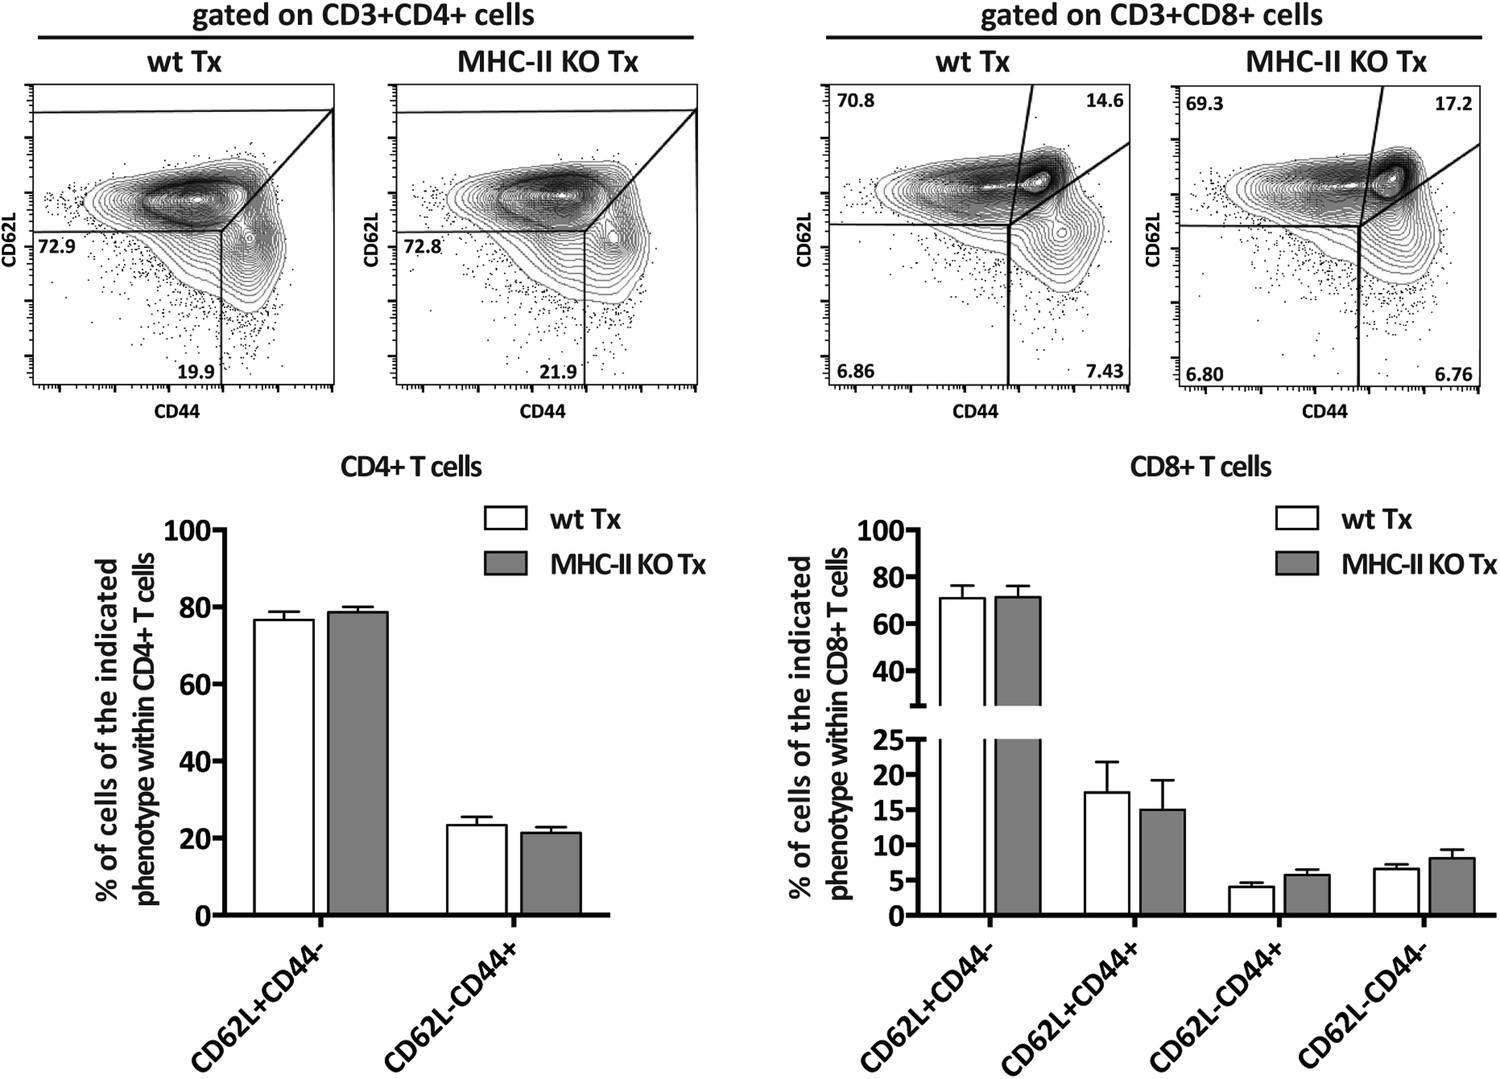
MHC-II+ lymph node stromal cells regulate T cell activation.
Wild-type mice were transplanted with either wild-type (wt Tx) or MHC-II KO (MHC-II KO Tx) lymph nodes. After 4 weeks, host-derived CD4+ and CD8+ T cells present within the transplants were characterized by flow cytometry (A). In (B), transplanted animals were depleted of CD4+ T cells by administration of the antibody GK1.5. For easier comparison, the data of Figure 2A regarding CD62L−CD44+CD8+ T cells are duplicated here. Representative contour plots are shown; the numbers in the plots indicate the frequency of cells within the drawn gates. The data represent mean ± SEM; n = 4; *p ≤ 0.05, **p ≤ 0.01.
Figure 2—figure supplement 1
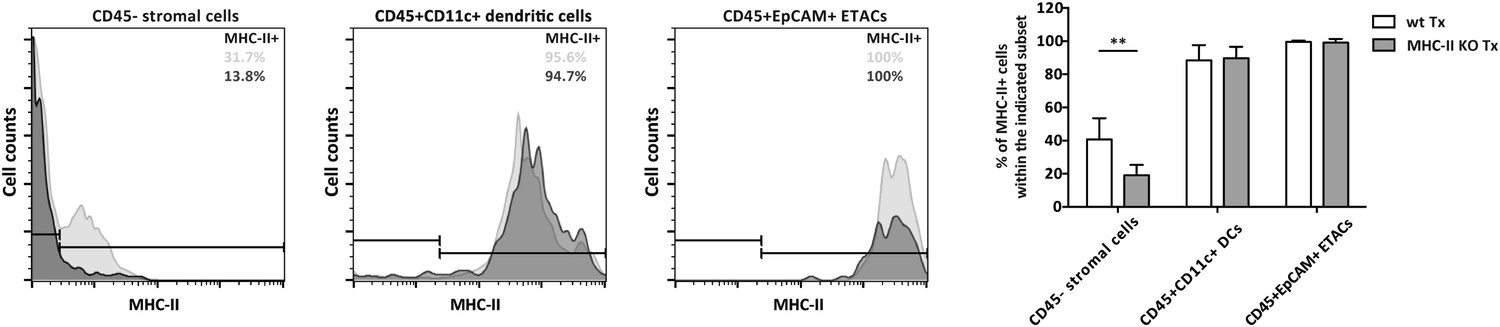
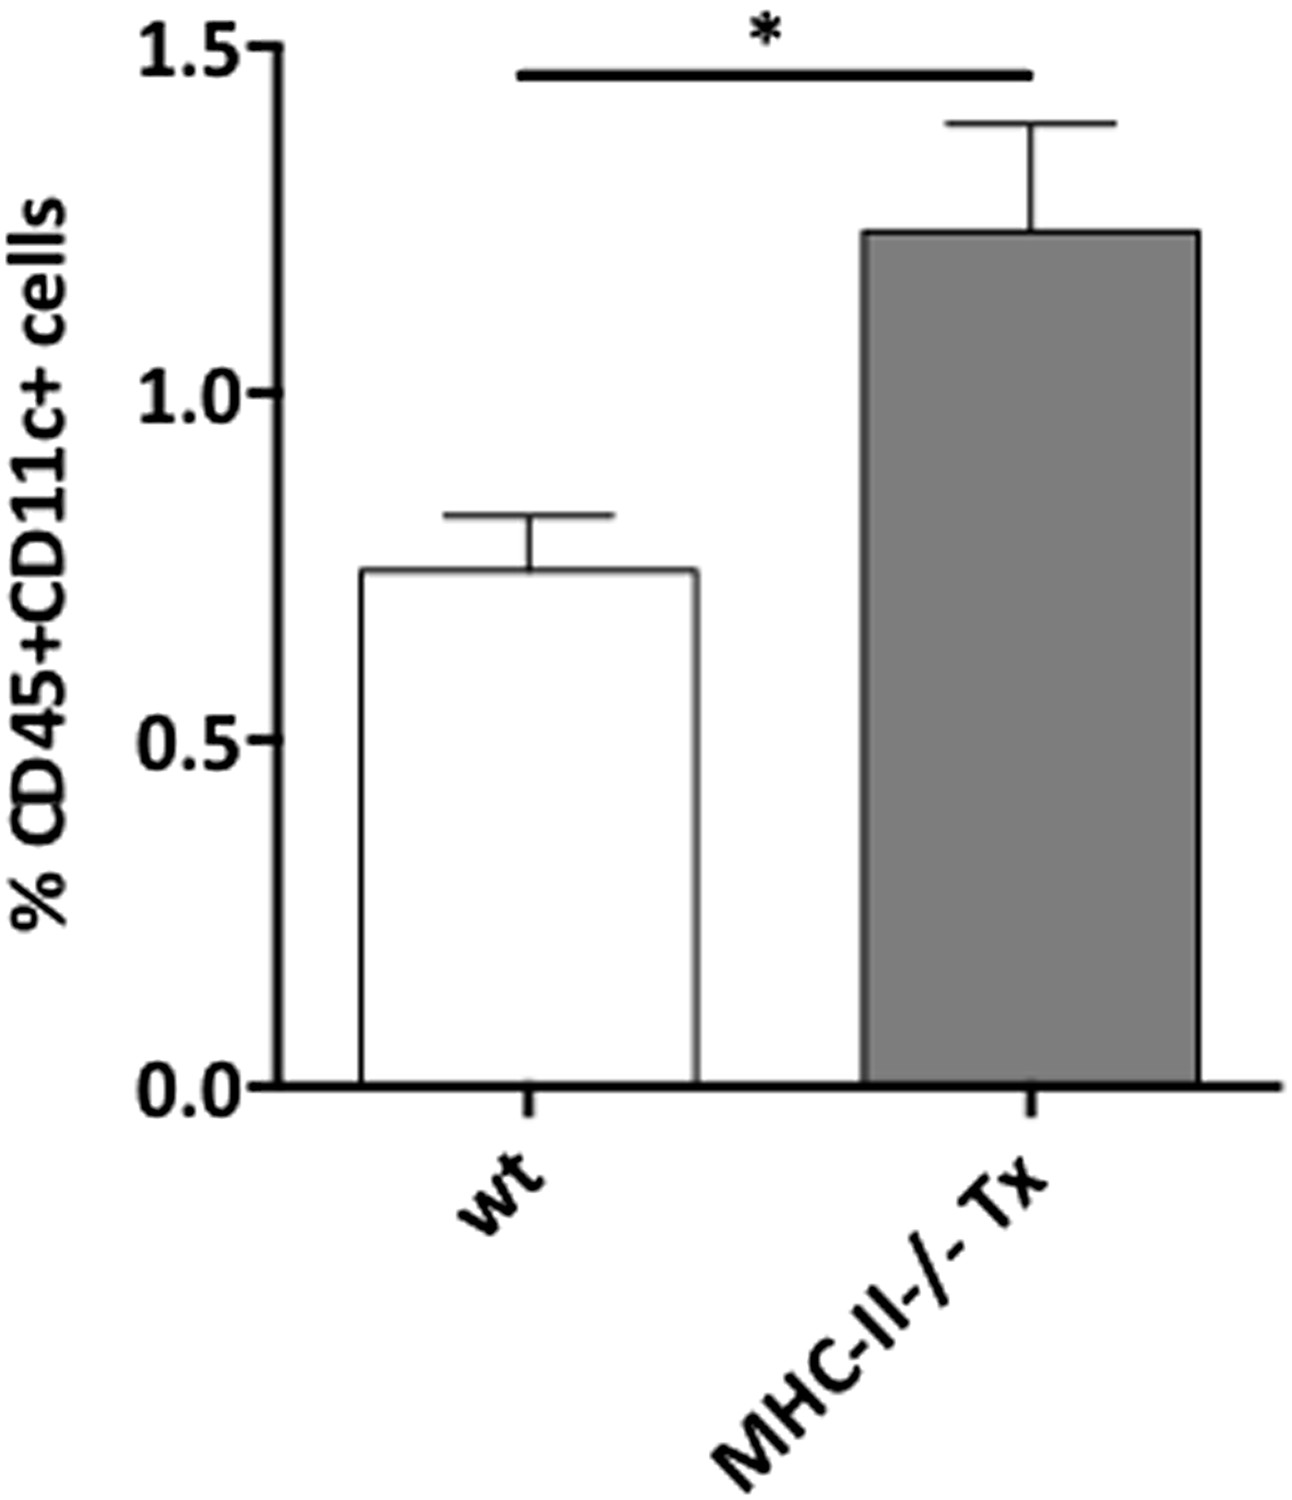
Stromal cell MHC-II expression in MHC-II KO lymph node transplants.
Wild-type mice were transplanted with either wild-type (wt Tx) or MHC-II KO (MHC-II KO Tx) lymph nodes. After 4 weeks, transplants were dissected and MHC-II expression on CD45− stromal cells, CD45+CD11c+ dendritic cells, and CD45+EpCAM+ extra-thymic AIRE-expressing like cells (ETACs) was determined by flow cytometry. Pale histograms represent MHC-II expression in wild-type transplants; whereas, dark histograms represent MHC-II expression in MHC-II KO transplants. Following the same color scheme, the numbers in the histograms represent the percentage of MHC-II+ cells. The graph on the right summarizes the data of seven transplants per group. The data represent mean ± SEM; **p ≤ 0.01.
Figure 2—figure supplement 2
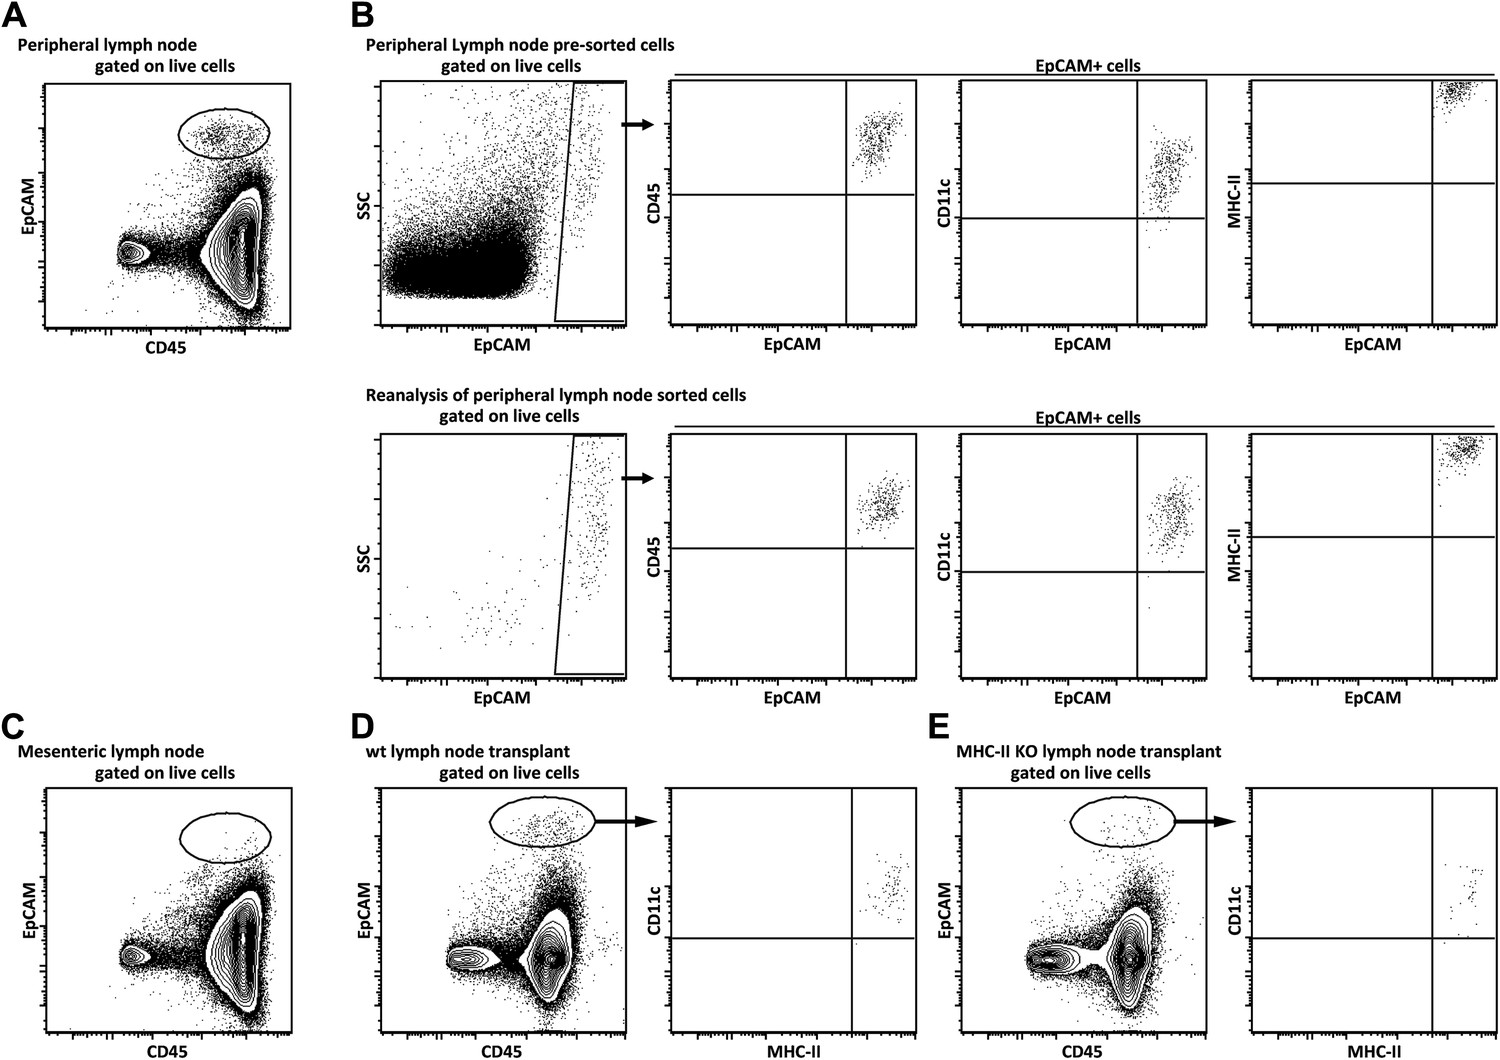
Lymph node EPCAM+ cells phenotypically represent a dendritic cell subset that is still present in MHC-II KO lymph node transplants as MHC-II expressing cells.
Lymph node EpCAM+ cells were characterized by flow cytometry. Single cell suspensions of peripheral (A, B), mesenteric (C), and wild-type (D) or MHC-II KO (E) transplanted lymph nodes obtained by enzymatic digestion were stained for EpCAM and CD45 (A, C), or EpCAM, CD45, MHC-II, and CD11c (B, D, E). In (B), EpCAM+ cells were sorted and reanalyzed by flow cytometry.
Figure 2—figure supplement 3
In normopenic conditions, T cell activation is restricted to MHC-II KO lymph node transplants.
Wild-type mice were transplanted with either wild-type (wt Tx) or MHC-II KO (MHC-II KO Tx) lymph nodes. After 4 weeks, host-derived CD4+ and CD8+ T cells present within the hosts' endogenous lymph nodes were characterized by flow cytometry. Representative contour plots are shown; the numbers in the plots indicate the frequency of cells within the drawn gates. The data represent mean ± SEM; n = 4 for CD4+ T cell analysis and n = 8 for CD8+ T cell analysis.
Figure 2—figure supplement 4
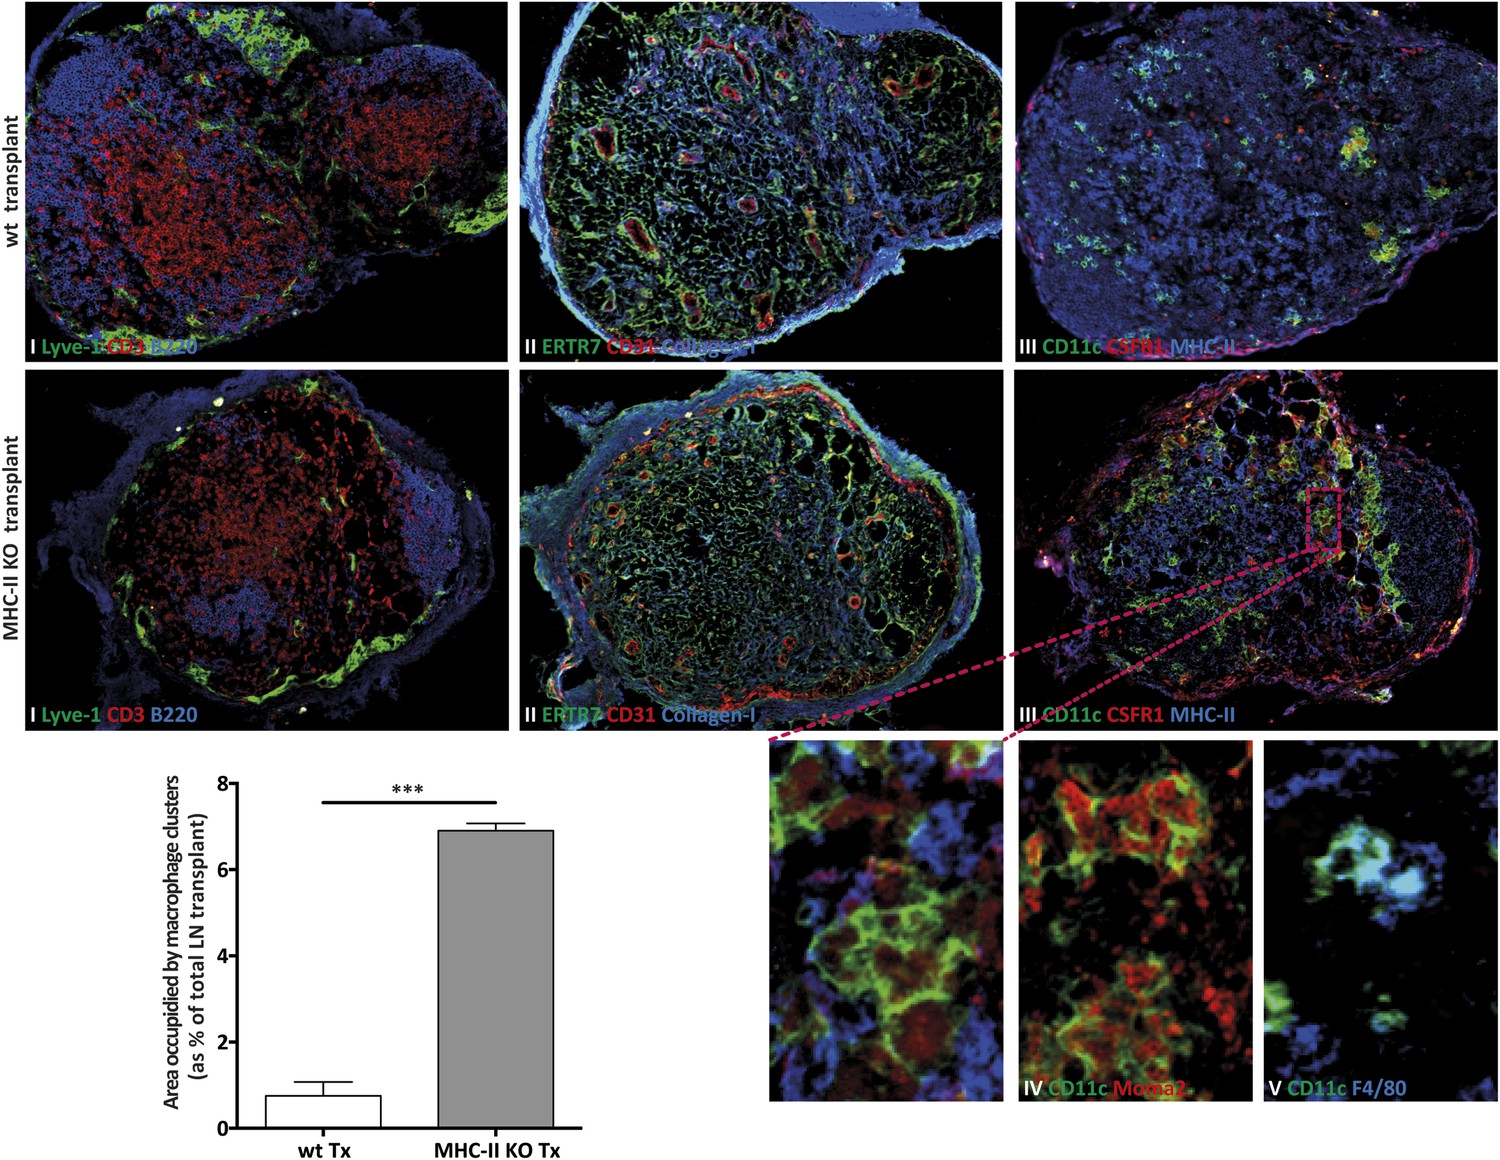
MHC-II KO lymph node transplants are rejected in wild-type recipients.
Wild-type mice were transplanted with either wild-type (wt Tx) or MHC-II KO (MHC-II KO Tx) lymph nodes. After 4 weeks, the transplants were collected and analyzed by immunofluorescence. (A) Tissue sections were stained for (I) Lyve-1 (green), CD3 (red), and B220 (blue); (II) ERTR7 (green), CD31 (red), and Collagen type I (blue); (III) CD11c (green), CSFR1 (red), and MHC-II (blue); (IV) CD11c (green) and Moma2 (red); and (V) CD11c (green) and F4/80 (blue). Small figures are high magnifications of the area highlighted. In (B), the area occupied by CSFR1+CD11c+ clusters was quantified and presented as the % of the area of the lymph node transplants. The data represent mean ± SEM; n = 4; ***p ≤ 0.001.
Figure 2—figure supplement 5
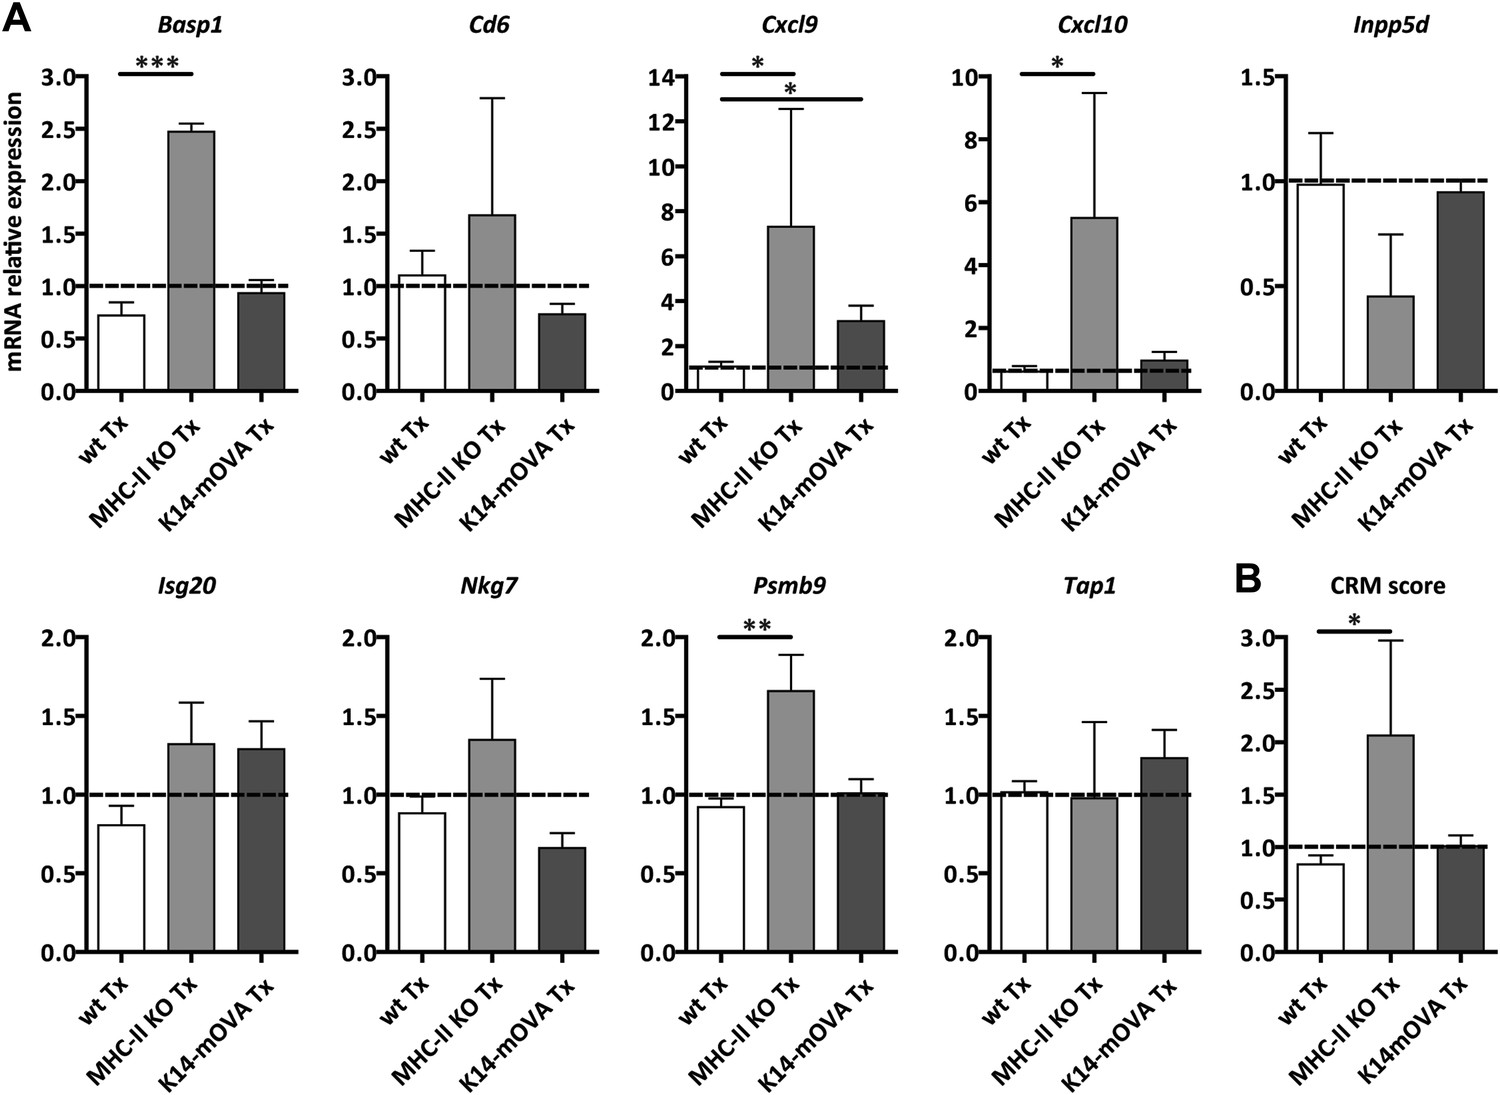
MHC-II KO lymph node transplants exhibit increased common rejection module (CRM) score.
Wild-type mice were transplanted with wild-type (wt Tx), MHC-II KO (MHC-II KO Tx), or K14-mOVA (K14-mOVA Tx) lymph nodes. After 4 weeks, the transplants were collected and analyzed by real-time PCR. (A) Abundance of transcripts belonging to the CRM. Lck and runx3 transcripts were not detected in all the samples. Gene expression in non-transplanted endogenous lymph nodes was arbitrarily set at 1 and is shown as a dotted line in each graph. (B) Graph showing the CRM score. Data represent mean ± SEM; n = 4 for wild-type non-transplanted lymph nodes, n = 5 for wild-type transplants, n = 2 for MHC-II KO transplants and n = 3 for K14-mOVA transplants. *p ≤ 0.05, **p ≤ 0.01, ***p ≤ 0.001.
Figure 2—figure supplement 6
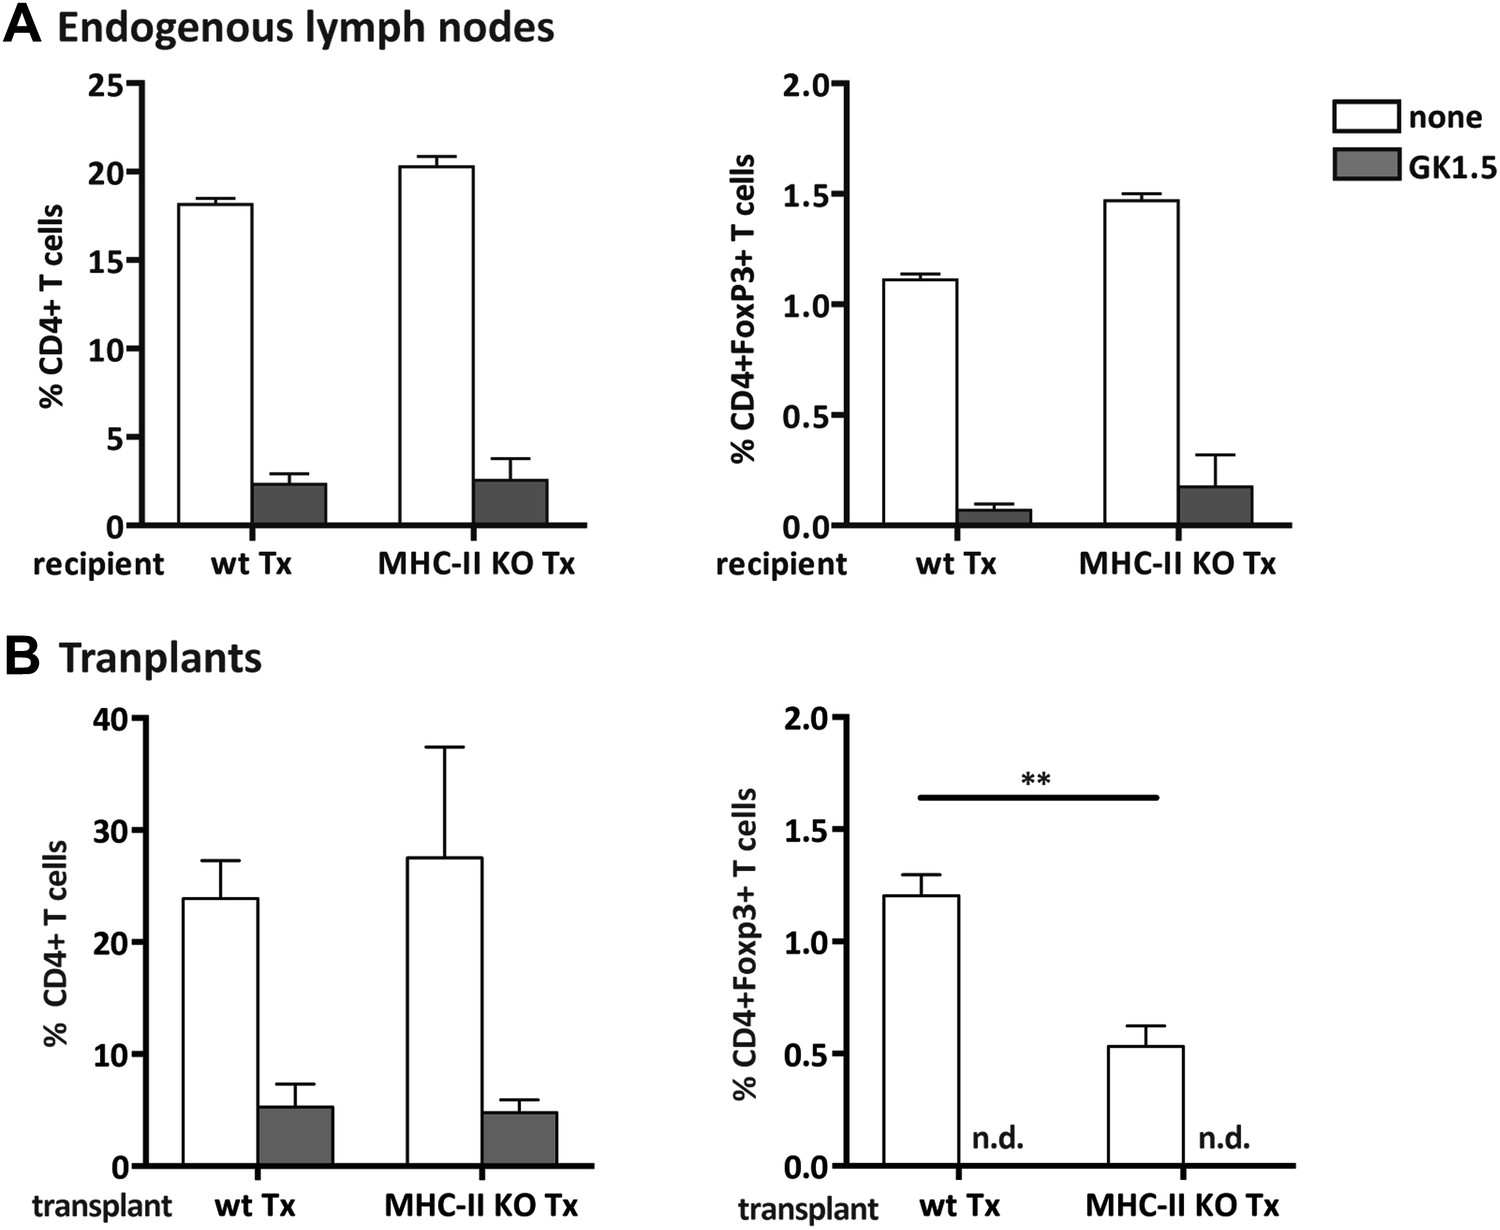
Efficient CD4+ T cell depletion in donor and recipient tissues.
Wild-type mice were transplanted with either wild-type (wt Tx) or MHC-II KO (MHC-II KO Tx) lymph nodes and depleted of CD4+ cells by administration of the anti-CD4 antibody GK1.5. Graphs represent the frequency of host-derived CD4+ T cells and CD4+Foxp3+ T cells in the endogenous lymph nodes (A) and in the transplants (B), 4 weeks after the transplantation procedure, among total lymph node cells. The extremely low number of CD4+ T cells present in GK1.5-treated animals precluded the analysis of transplant infiltrating CD4+Foxp3+ T cells. Data represent mean ± SEM; n = 6 for endogenous lymph nodes and n = 3 for transplants. **p ≤ 0.01.
Figure 2—figure supplement 7
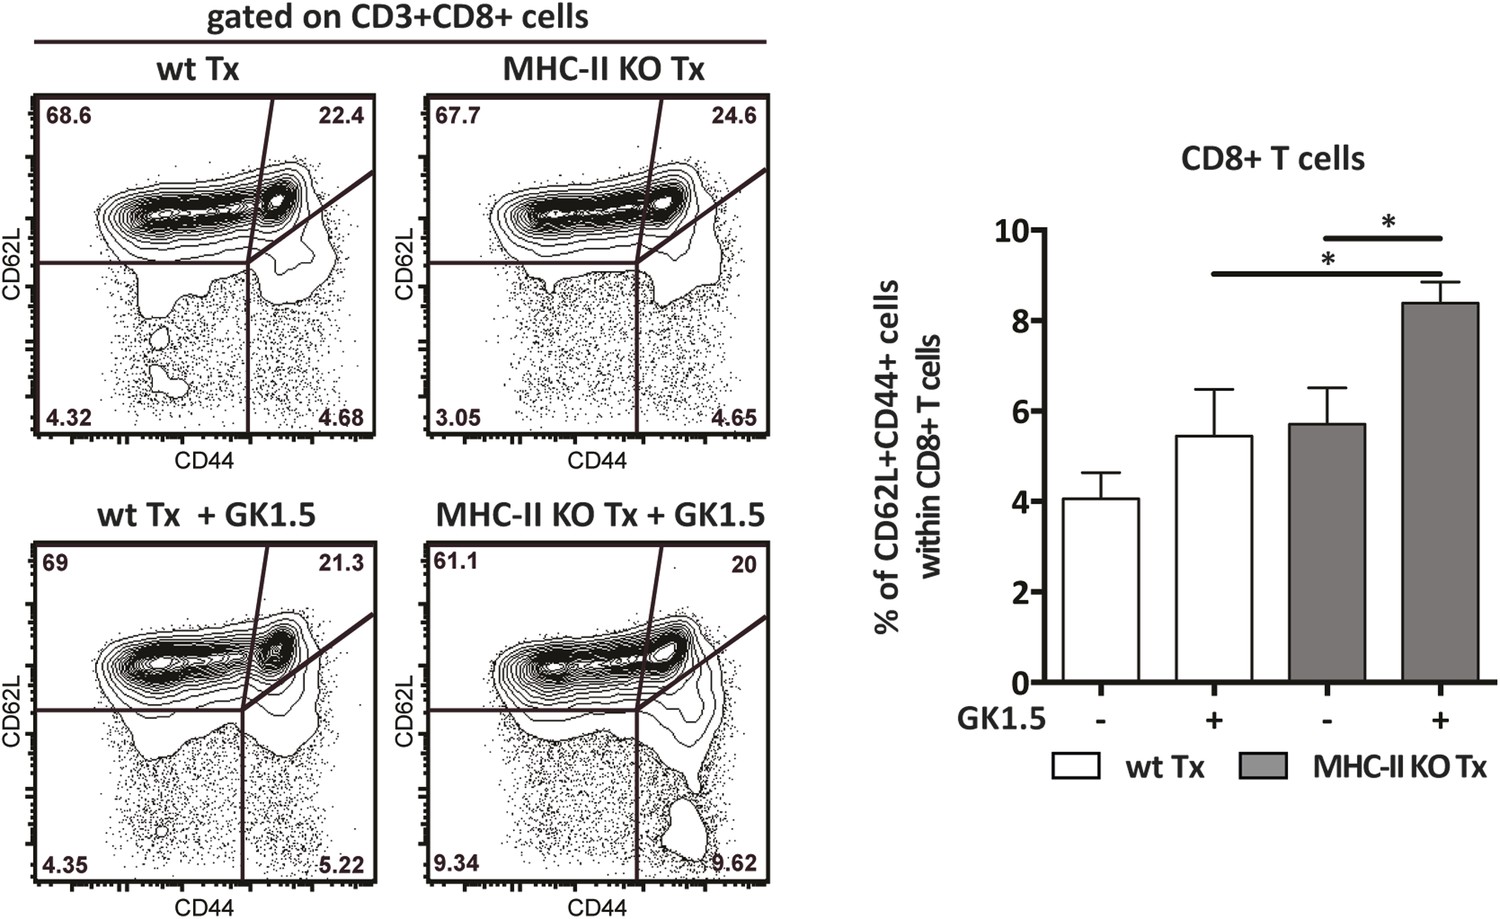
CD4+ T cells prevent the systemic spreading of MHC-II-deficient stromal cell-mediated CD8+ T cell activation.
Wild-type mice were transplanted with either wild-type (wt Tx) or MHC-II KO (MHC-II KO Tx) lymph nodes and depleted of CD4+ cells by administration of the anti-CD4 antibody GK1.5. Counter plots show the cytometric characterization of host-derived CD8+ T cells present within the recipient's endogenous lymph nodes. Numbers in plots indicate the frequency of cells within the drawn gates. The graph depicts the percentage of activated CD62L−CD44+ cells within CD8+ T cells. Data represent mean ± SEM; n = 8; *p ≤ 0.05.
Figure 3 with 1 supplement
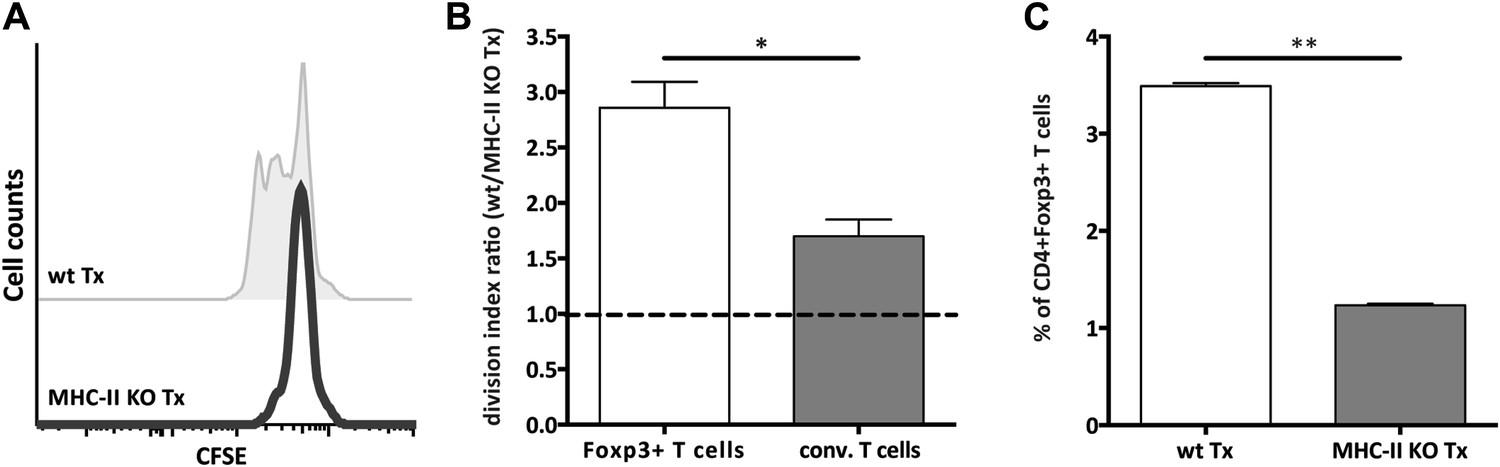
MHC-II+ lymph node stromal cells support Treg homeostatic proliferation.
Rag2-deficient mice transplanted with either wild-type (wt Tx) or MHC-II KO (MHC-II KO Tx) lymph nodes were injected with 107 CFSE-labeled wild-type lymphocytes. 48 hr later, mice were sacrificed and the transferred cells within the lymph node transplants analyzed by flow cytometry. The CFSE profile of transferred Foxp3+CD4+ T cells is shown in (A). In (B), the ratio between the division indexes of wild-type (B6) and MHC-II KO lymph node transplant recovered CD4+Foxp3+ Tregs and CD4+Foxp3− conventional T cells is shown. The frequency of CD4+Foxp3+ Tregs recovered from wild-type and MHC-II KO lymph node transplant is shown in (C). The data represent mean ± SEM; n = 2 independent experiments with 2–3 animals per group; *p ≤ 0.05, **p ≤ 0.01.
Figure 3—figure supplement 1

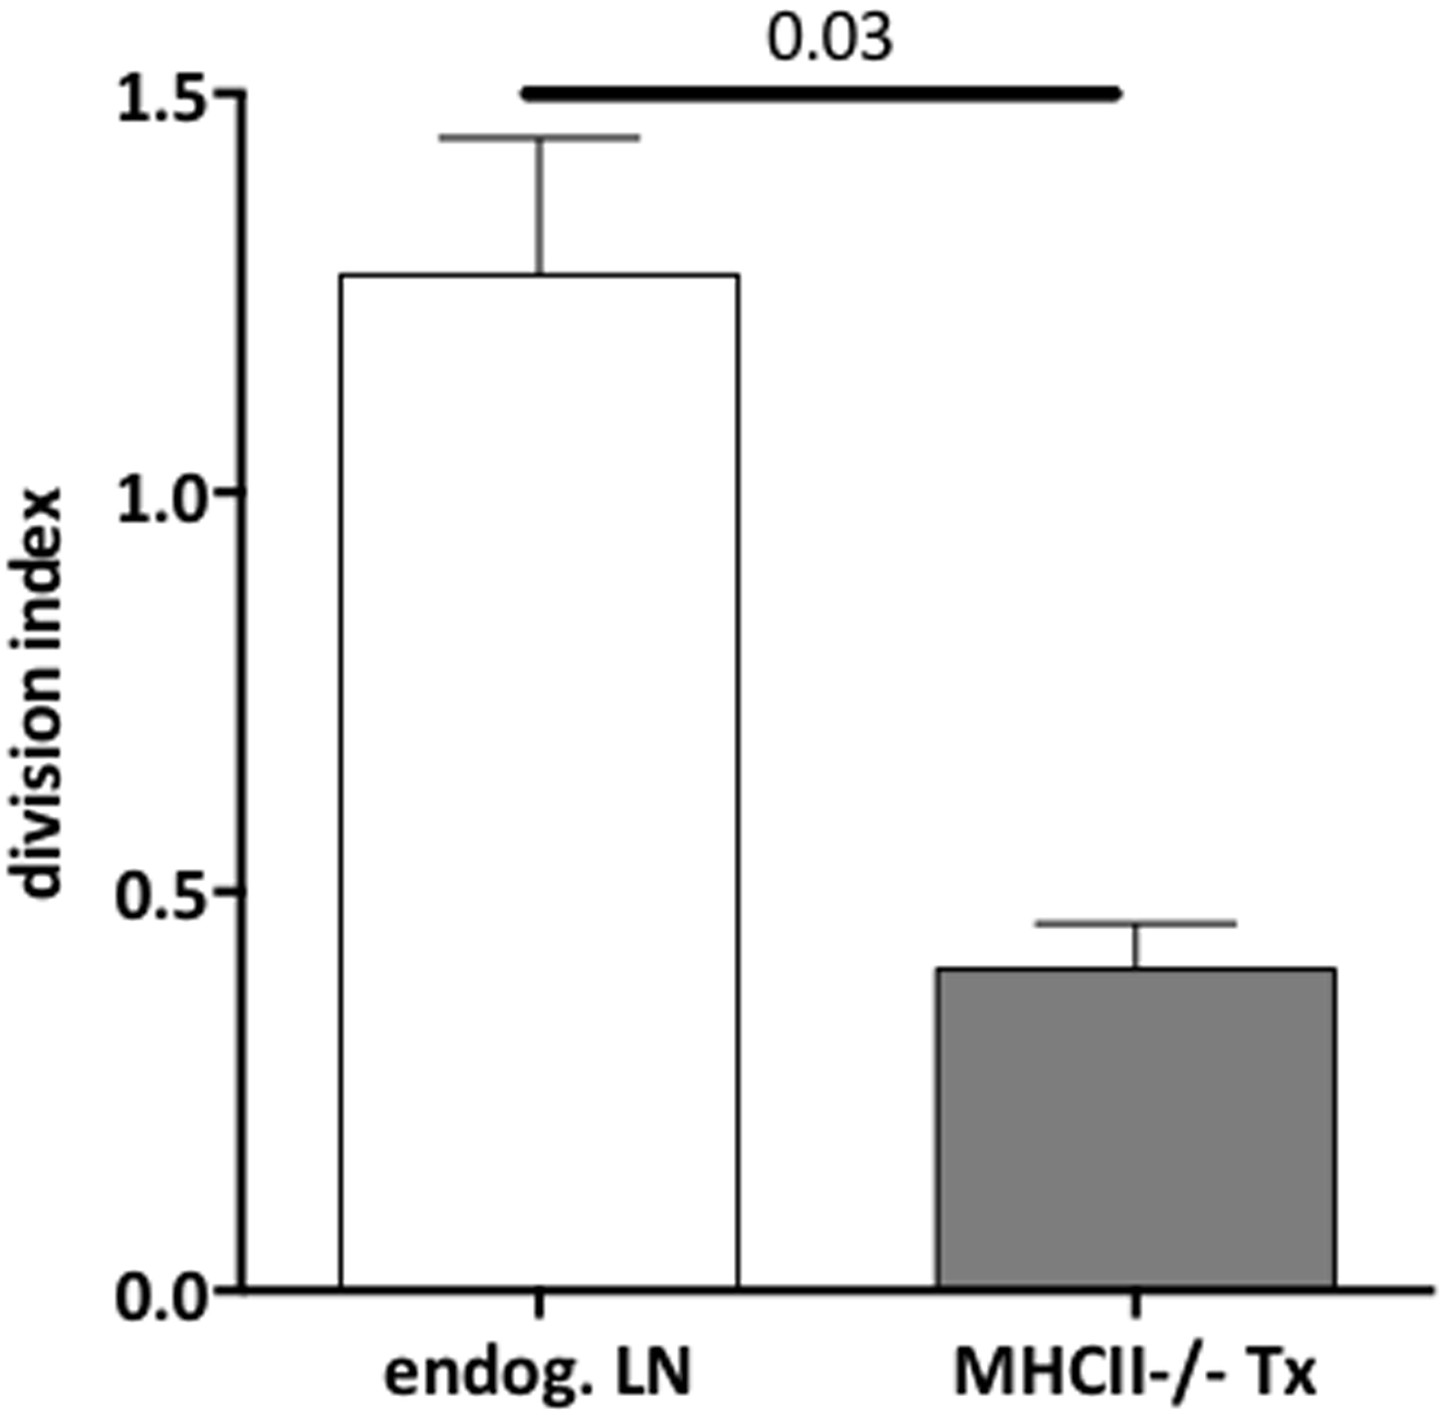
Reduced CD4+ T cell proliferation in the absence of lymph node stromal cell MHC-II expression.
Rag2-deficient mice transplanted with either wild-type (wt Tx) or MHC-II KO (MHC-II KO Tx) lymph nodes were injected with 107 CFSE-labeled wild-type lymphocytes. 48 hr later, mice were sacrificed and the transferred cells within the lymph node transplants analyzed by flow cytometry. The division index of CD4+Foxp3− conventional T cells and CD4+Foxp3+ Tregs in the transplanted lymph nodes (A) and in the endogenous lymph nodes of transplant recipients (B) is shown. The data represent mean ± SEM; n = 2 independent experiments with 2–3 animals per group; *p ≤ 0.05, **p ≤ 0.01.
Figure 4 with 3 supplements
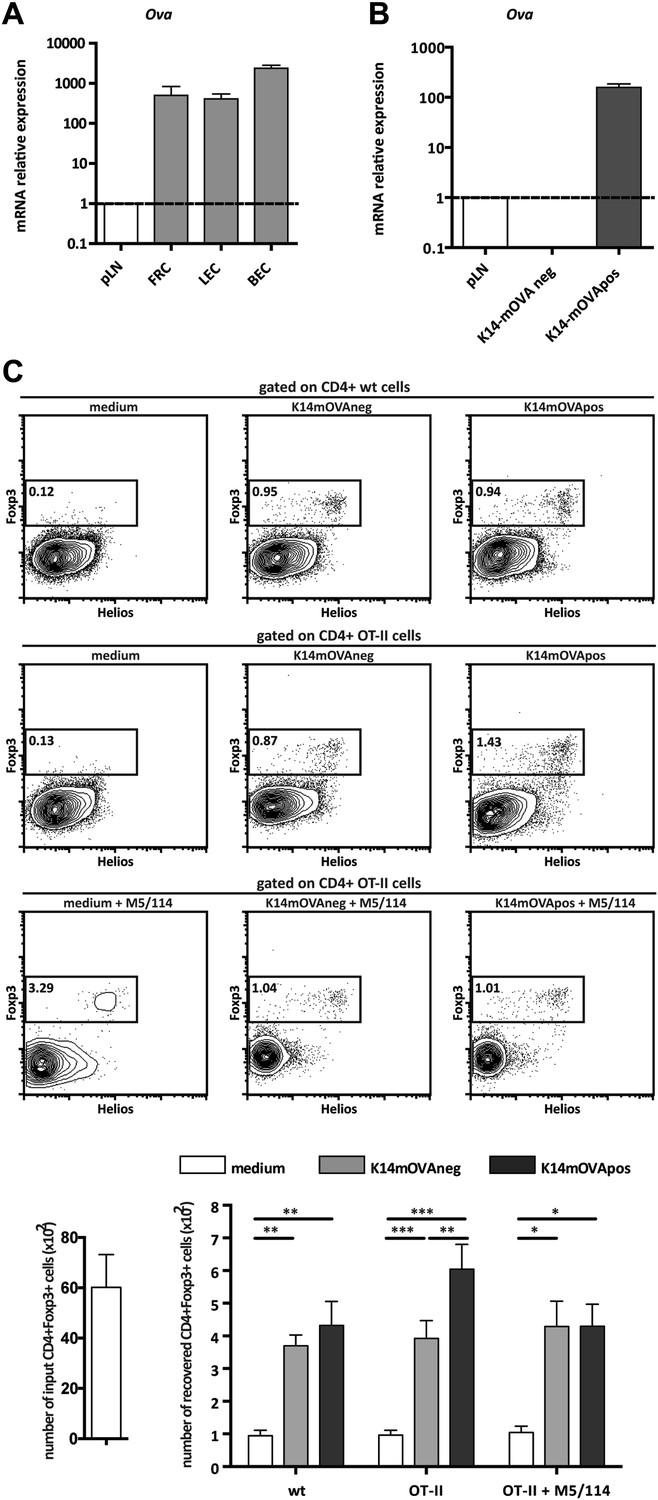
Endogenous OVA presentation by lymph node stromal cells promotes Treg maintenance in vitro.
OVA mRNA expression in primary FACS-sorted stromal cells (A; n = 2) and in vitro-generated stromal cell lines derived from K14-mOVA mice (B; n = 5) was determined by real-time PCR. Peripheral lymph nodes (pLN) from K14-mOVA mice were used as controls. (C) MACS-sorted CD4+ wild-type or OT-II transgenic cells were cultured together with in vitro-generated stromal cell lines of K14-mOVA origin in the absence or presence of the MHC-II blocking antibody M5/114. After 72 hr of co-culture, OT-II cells were characterized by flow cytometry. Representative counterplots are shown; the numbers in the plots represent the frequency of CD4+Fox3+ T cells. Graphs depict the number of CD4+Fox3+ T cells in the beginning and at the end of culture. Data represent mean ± SEM; n = 3 for wild-type CD4+ T cells; n = 8 for OT-II cells; and n = 3 for OT-II cells + M5/114. *p ≤ 0.05, **p ≤ 0.01, ***p ≤ 0.001.
Figure 4—figure supplement 1
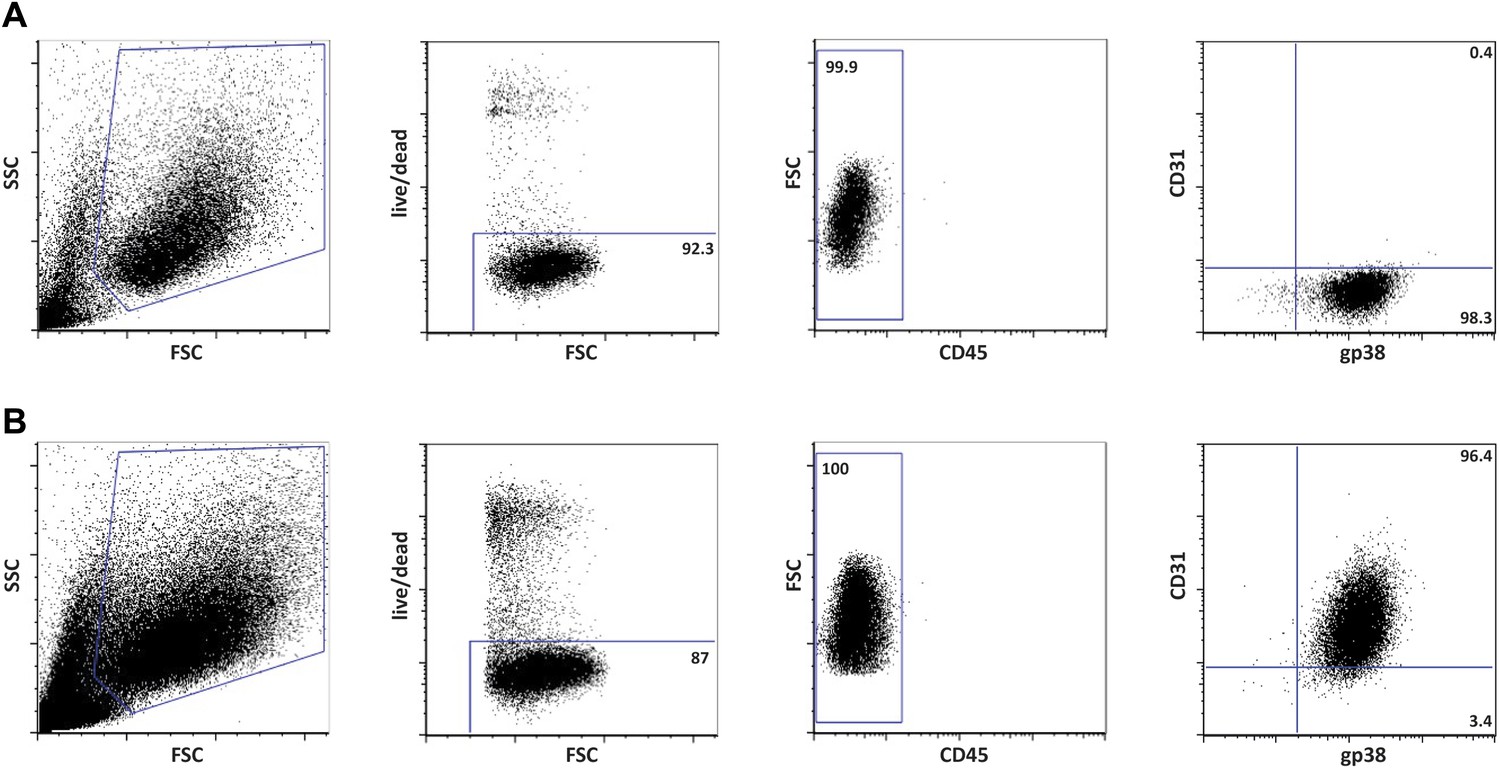
Phenotypically K14-mOVAneg and K14-mOVApos cells represent fibroblastic reticular cells (FRCs) and lymphatic endothelial cells (LECs), respectively.
Flow cytometrical characterization of the cell lines, K14-mOVAneg (A) and K14-mOVApos (B), derived by long-term culture of primary lymph node stromal cells of K14-mOVA origin.
Figure 4—figure supplement 2
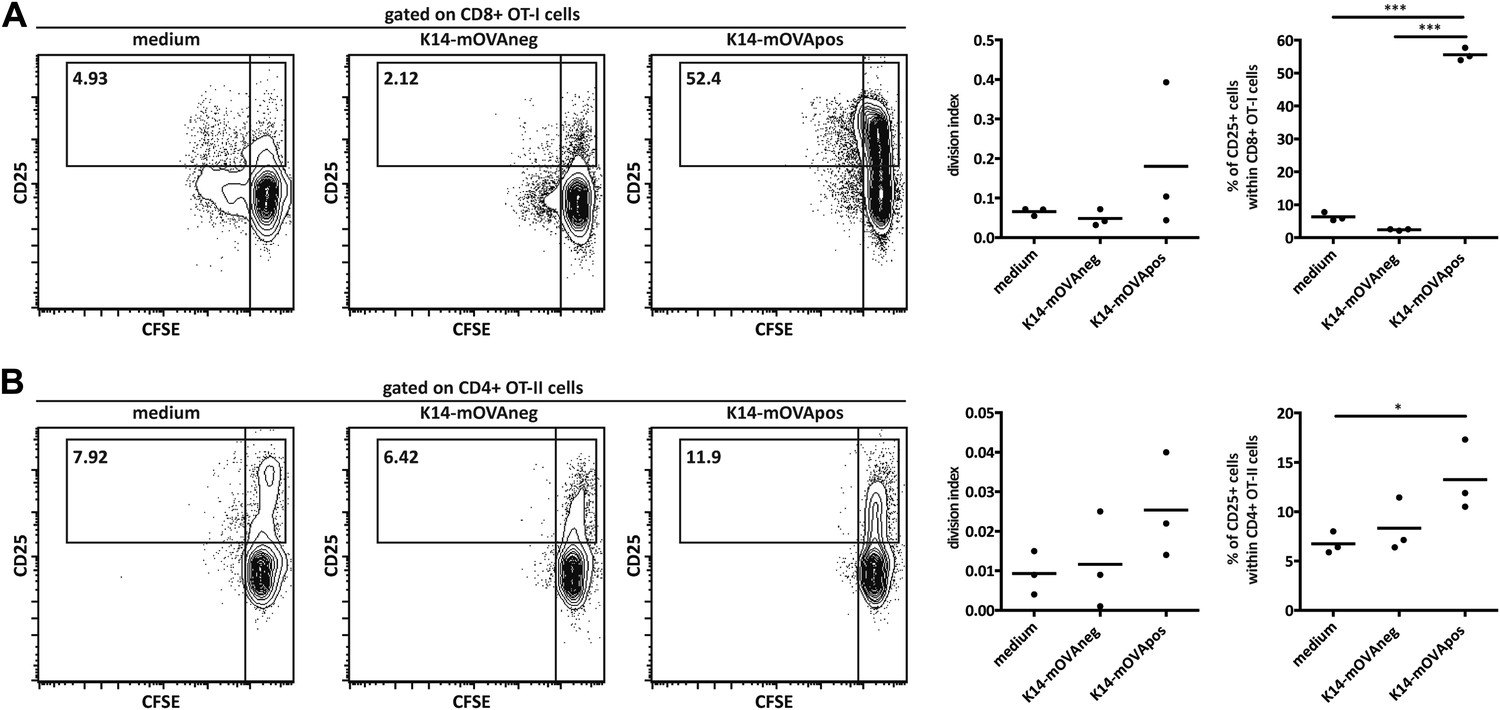
K14-mOVA stromal cells present endogenous OVA-derived peptides in vitro.
MACS-sorted CD8+ OT-I (A) and CD4+ OT-II (B) transgenic cells were cultured in the absence or presence of in vitro-generated stromal cell lines of K14-mOVA origin. Cell division and CD25 expression were determined after 72 hr. Left panels: representative contour plots; numbers in plots indicate the percentages of cells within the drawn gates. Right panels: summary of all experiments. n = 3, each dot represents one individual observation. *p ≤ 0.05, ***p ≤ 0.001.
Figure 4—figure supplement 3
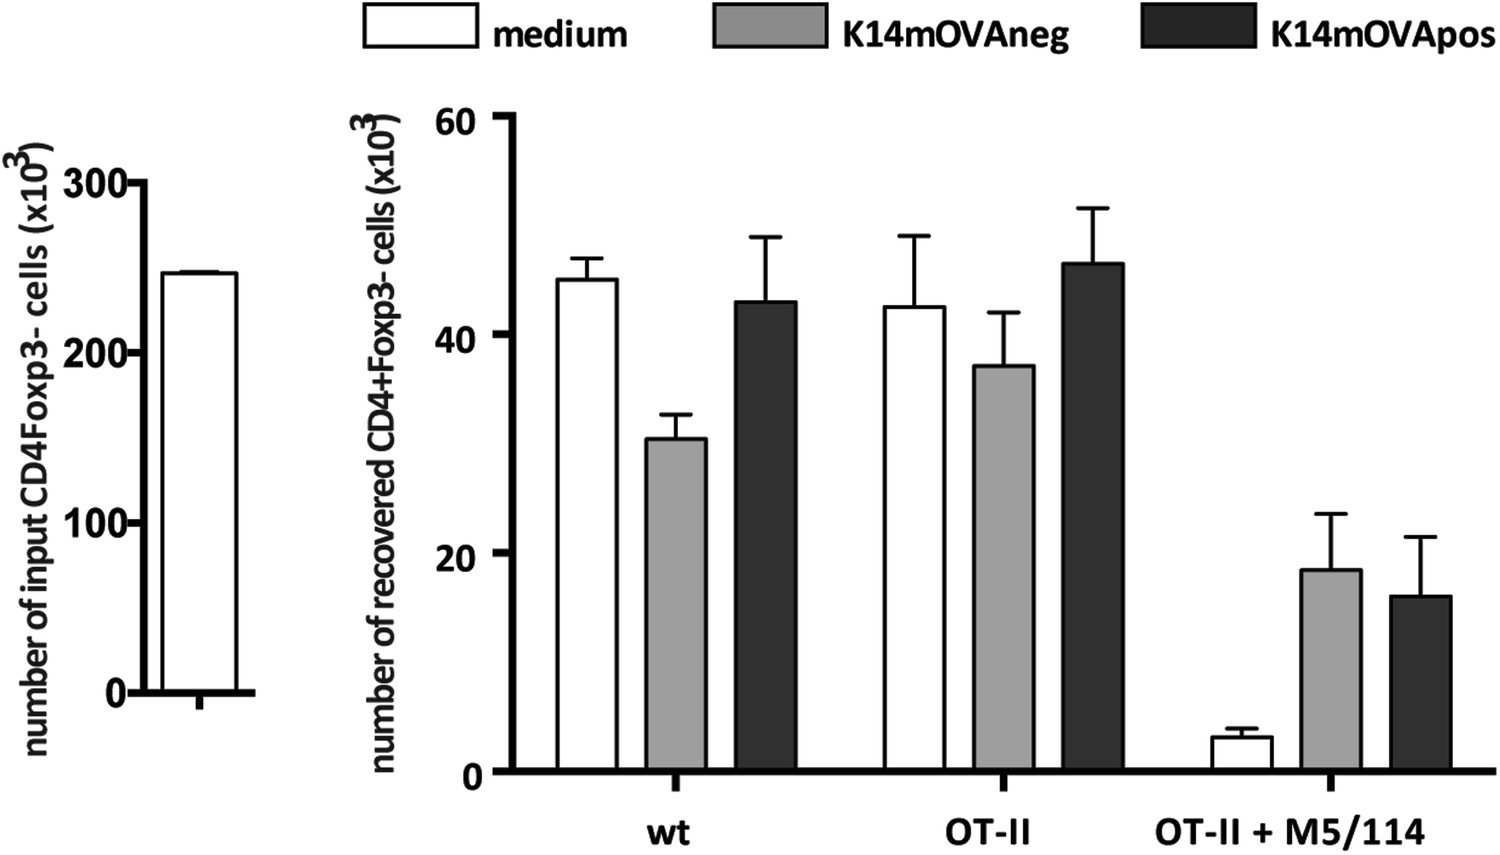
Endogenous OVA presentation by lymph node stromal cells does not affect CD4+Foxp3− conventional T cells.
MACS-sorted CD4+ wild-type or OT-II transgenic cells were cultured together with in vitro-generated stromal cell lines of K14-mOVA origin in the absence or presence of the MHC-II blocking antibody M5/114. After 72 hr of co-culture, OT-II cells were characterized by flow cytometry. The number of CD4+Fox3− conventional T cells in the beginning and at the end of culture is shown. Data represent mean ± SEM. n = 3 for wild-type CD4+ T cells; n = 8 for OT-II cells; and n = 3 for OT-II cells + M5/114.
Figure 5 with 2 supplements
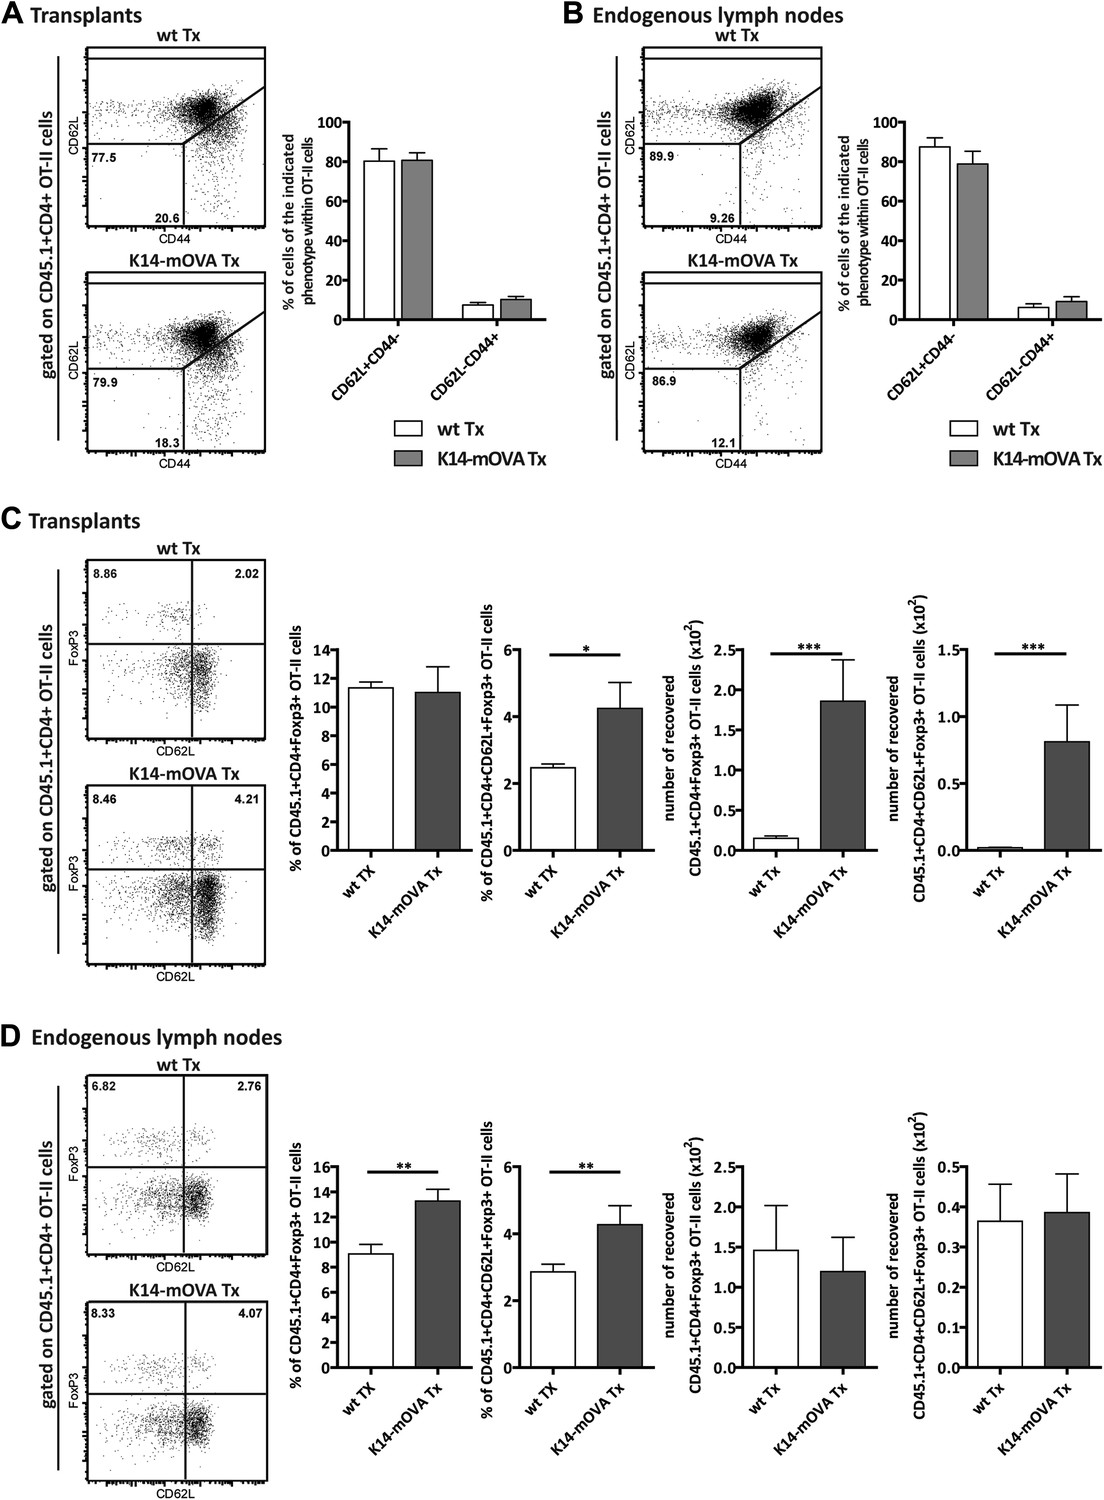
Endogenous OVA presentation by lymph node stromal cells promotes Treg maintenance in vivo.
Wild-type mice transplanted with either wild-type (wt Tx) or K14-mOVA transgenic (K14-mOVA Tx) lymph nodes were injected with 107 CD45.1+ OT-II cells. 3 days after the transfer, mice were sacrificed and the transferred OT-II cells in both the transplanted lymph nodes (A, C) and the endogenous lymph nodes (B, D) analyzed by flow cytometry. Naïve and activated OT-II T cells were defined as CD62L+CD44- and CD62L−CD44+ cells, respectively (A, B); naïve-like OT-II Tregs as CD4+CD62L+Foxp3+ cells (C, D). Representative contour plots of the analysis performed are shown on the left; the numbers in the plots indicate the frequency of cells within the drawn gates. The graphs shown on the right represent the mean ± SEM of 2 independent experiments; n = 6 and n = 8 for wild-type and K14-mOVA lymph node transplanted animals, respectively; *p ≤ 0.05, **p ≤ 0.01, ***p ≤ 0.001.
Figure 5—figure supplement 1
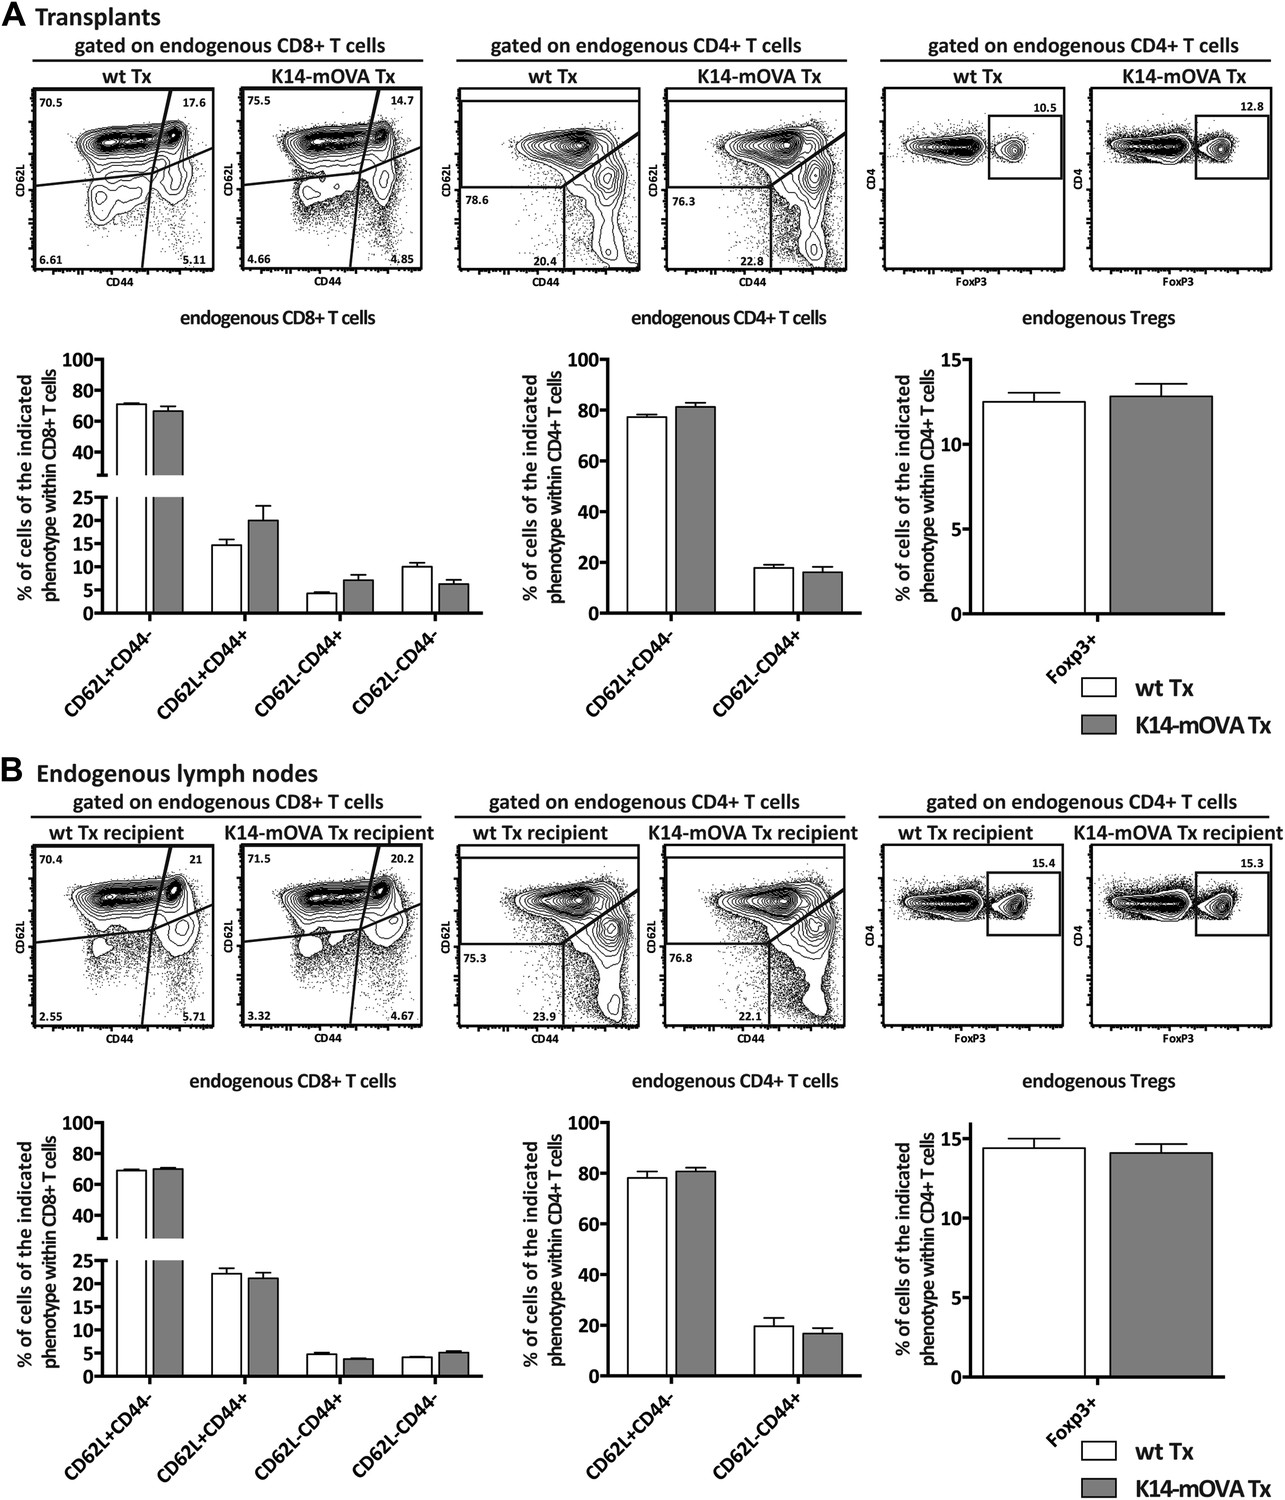
Endogenous CD8+ and CD4+ T cells are not affected by the transplantation of K14-mOVA transgenic lymph nodes.
Wild-type recipient mice were transplanted with either wild-type (wt Tx) or K14-mOVA transgenic (K14-mOVA Tx) lymph nodes. 4 weeks later, host-derived lymphocytes in transplanted lymph nodes (A) as well as in endogenous lymph nodes (B) were analyzed by flow cytometry. Naïve, effector, and memory CD8+ and CD4+ T cells were defined by the pattern of expression of CD44 and CD62L. Tregs were defined as CD4+FoxP3+ T cells. Representative contour plots of the analysis performed are shown on top; the numbers in the plots indicate the frequency of cells within the drawn gates. Summarizing graphs are shown on the bottom. Data depict mean ± SEM and represent two independent experiments; n = 6 and n = 8 for wild-type and K14-mOVA lymph node transplanted animals, respectively.
Figure 5—figure supplement 2
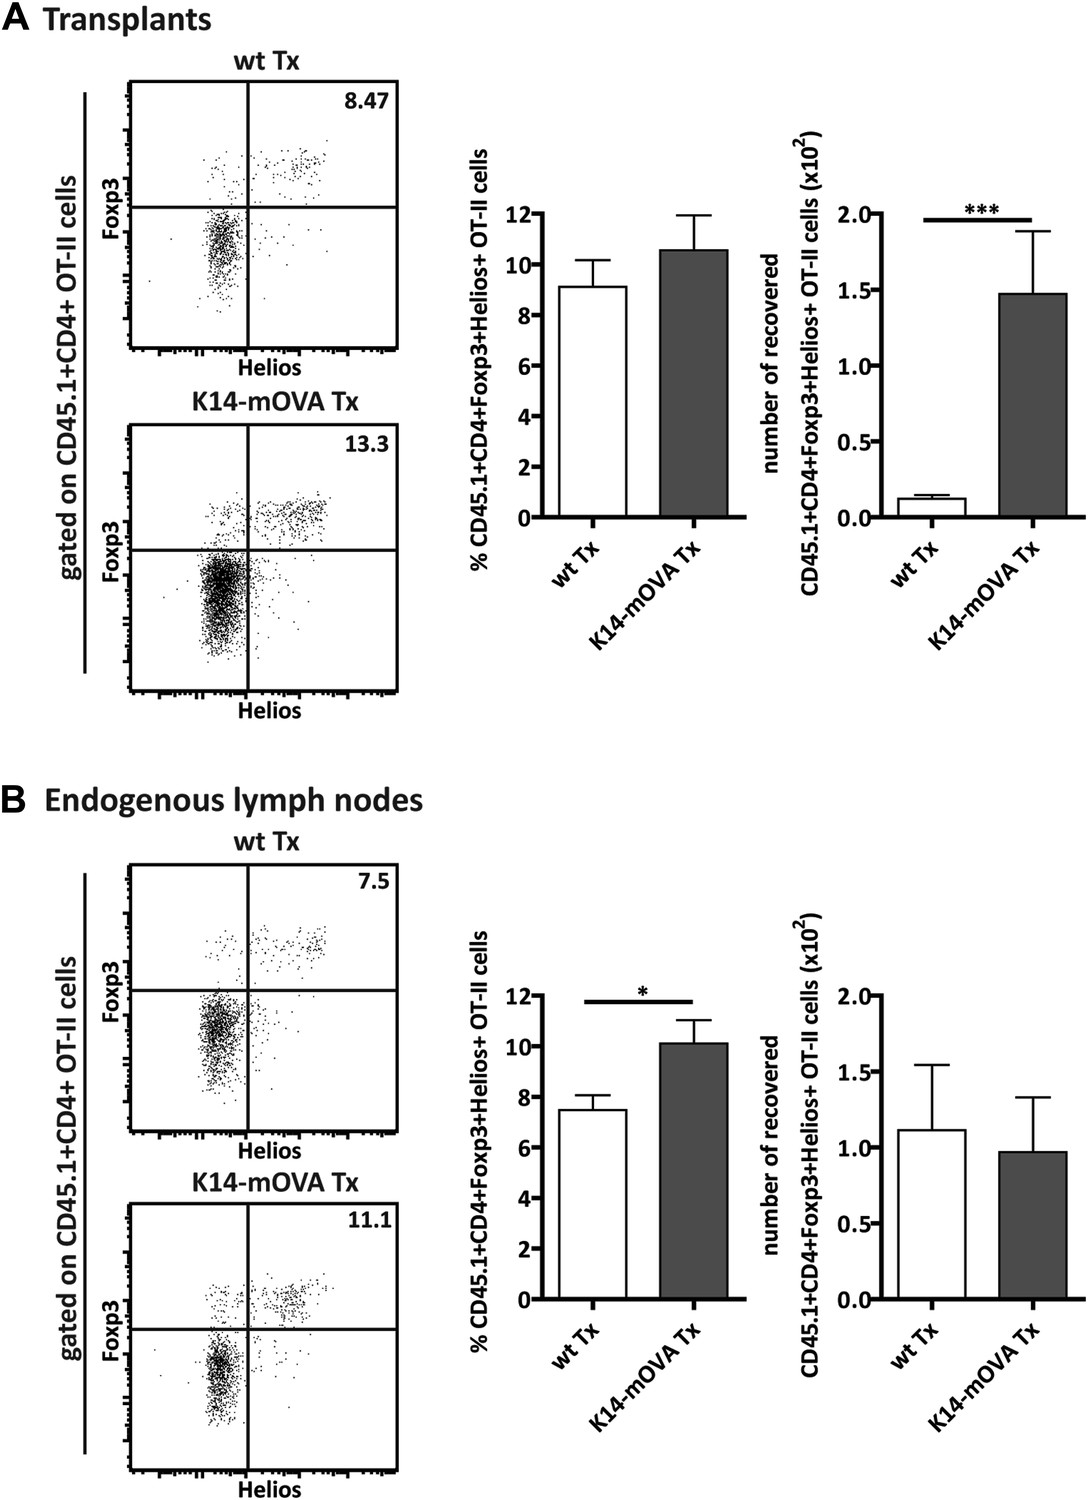
Expansion of CD4+FoxP3+Helios+ OT-II Tregs in mice transplanted with K14-mOVA lymph nodes.
Wild-type recipient mice were transplanted with either wild-type (wt Tx) or K14-mOVA transgenic (K14-mOVA Tx) lymph nodes. 4 weeks later, 107 CD45.1+ OT-II cells were intravenously injected. 3 days after the transfer, OT-II cells in both transplanted lymph nodes (A) as well as in endogenous lymph nodes (B) were analyzed by flow cytometry. Left panels: dot plots depict the expression of FoxP3 and Helios on CD45.1+CD4+ OT-II cells; the numbers on the dot plots indicate the frequency of FoxP3+Helios+ cells. Right panels: graphs show the frequency and the number of recovered CD45.1+CD4+FoxP3+Helios+ OT-II cells and represent the mean ± SEM of 2 independent experiments; n = 6 and n = 8 for wild-type and K14-OVA lymph node transplanted animals, respectively; *p ≤ 0.05, ***p ≤ 0.001.
Figure 6 with 1 supplement

Endogenous OVA presentation by lymph node stromal cells constrains immune reactivity.
(A) Wild-type mice transplanted with either wild-type (wt Tx) or K14-mOVA transgenic (K14-mOVA Tx) lymph nodes were immunized with OVA in incomplete Freund's adjuvant (IFA) in the tail base and re-challenged with OVA alone in both ears. In vivo delayed-type hypersensitivity (DTH) responses were determined by ear swelling. The data represent mean ± SEM; n = 5 mice per group; *p ≤ 0.05. (B) Wild-type mice either left untreated or transplanted with wild-type or K14-mOVA transgenic lymph nodes, at week -4, were transplanted with either wild-type or K14-mOVA skin on day 0. 4 weeks after skin transplantation, skin grafts were isolated and mRNA transcripts belonging to the common rejection module (CRM) analyzed by real-time PCR. The aggregate CRM score is shown. n = 6 mice per group; *p < 0.05, ***p ≤ 0.001.
Figure 6—figure supplement 1
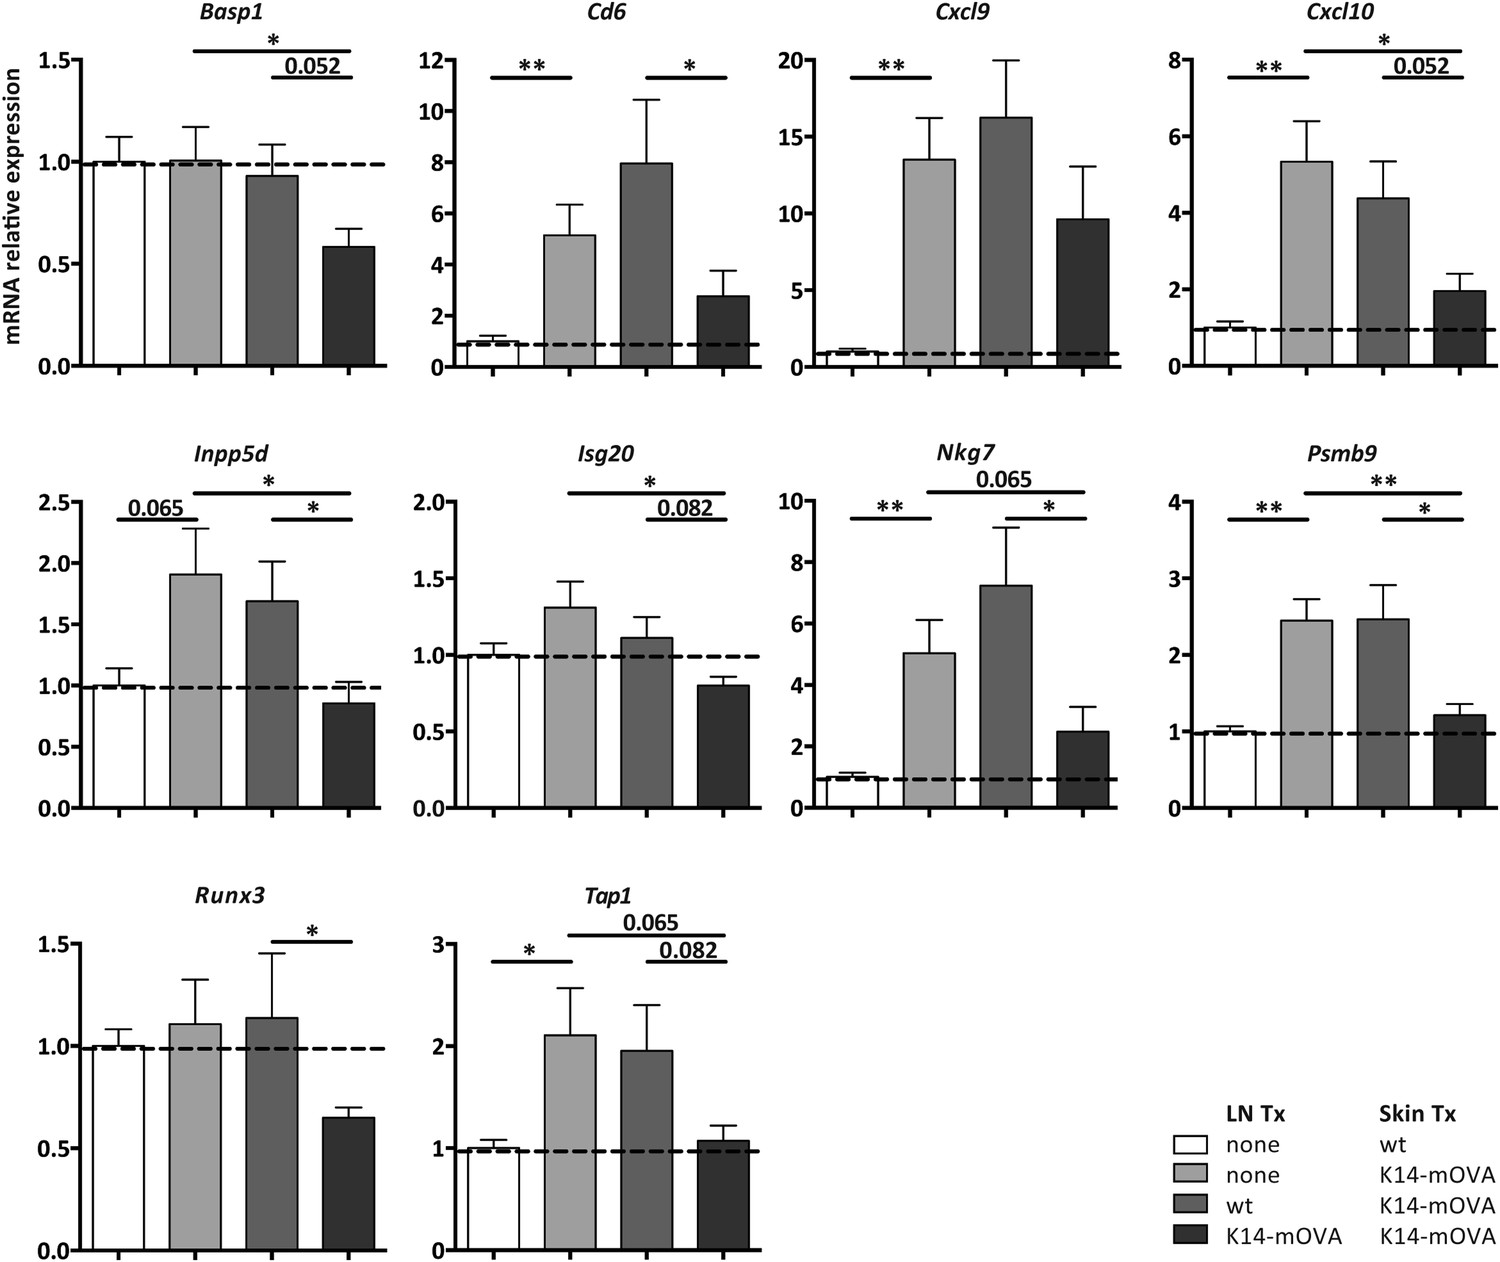
Self-antigen-presenting stromal cells constraint immune reactivity in a dual transplantation system.
Wild-type mice either left untreated or transplanted with wild-type or K14-mOVA transgenic lymph nodes, at week -4, were transplanted with either wild-type or K14-mOVA skin on day 0. 4 weeks after skin transplantation, skin grafts were isolated and mRNA transcripts belonging to the common rejection module (CRM) analyzed by real-time PCR. n = 6 mice per group; *p ≤ 0.05, ***p ≤ 0.001.
Author response image 1

Author response image 2
Author response image 3
Download links
A two-part list of links to download the article, or parts of the article, in various formats.
Downloads (link to download the article as PDF)
Open citations (links to open the citations from this article in various online reference manager services)
Cite this article (links to download the citations from this article in formats compatible with various reference manager tools)
Lymph node stromal cells constrain immunity via MHC class II self-antigen presentation
eLife 3:e04433.
https://doi.org/10.7554/eLife.04433


