Amygdala neural activity reflects spatial attention towards stimuli promising reward or threatening punishment
- Columbia University, United States
- New York State Psychiatric Institute, United States
Figures
Figure 1

Detection task design.
(A) Task schematic. After fixating, a pair of cues appeared at either side of the fixation point. Following a variable delay, a target appeared at one of the two locations; trials were scored a ‘hit’ if monkeys made a saccade to the target's location and a ‘miss’ if they failed to do so. (B) Association between cues and outcomes. The table illustrates the outcomes associated with each cue type (given that the target appeared at that cue's location) on hit and miss trials. (C) Trial types. On a given trial, monkeys viewed a reward and punishment cue (R/P), a reward and neutral cue (R/N), or a punishment and neutral cue (P/N). Each trial type had two possible spatial configurations (only one configuration is shown).
Figure 2
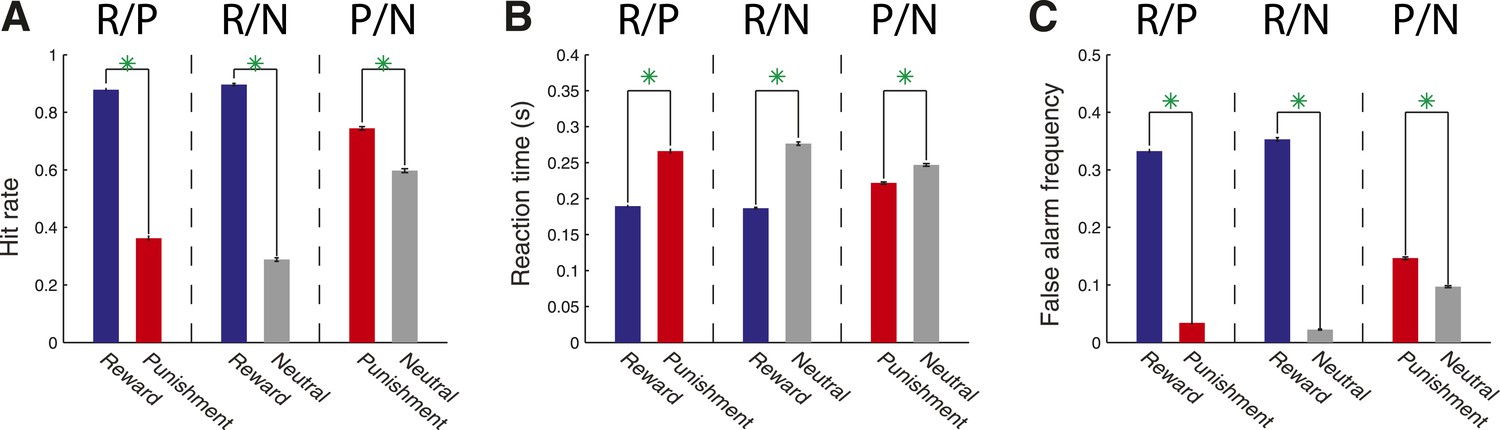
Monkeys allocate attention according to stimulus–outcome associations in a detection task.
(A) Hit rate varied according to the cue–outcome associations. Hit rate is plotted for R/P trials (mean ± standard error; R cue: 0.879 ± 0.004; P cue: 0.362 ± 0.007), R/N trials (R cue: 0.896 ± 0.004; N cue: 0.288 ± 0.006) and P/N trials (P cue: 0.744 ± 0.006; N cue: 0.597 ± 0.007); green asterisks indicate a significant difference between each pair of target conditions (χ2-test, p < 10−4). (B) Reaction times for R/P trials (R cue: 0.189 ± 0.001 s; P cue: 0.266 ± 0.002 s), R/N trials (R cue: 0.187 ± 0.001 s; N cue: 0.277 ± 0.002 s) and P/N trials (P cue: 0.222 ± 0.002 s; N cue: 0.247 ± 0.002 s; green astericks: Wilcoxon, p < 10−4). (C) False alarm frequency for R/P trials (R cue: 0.333 ± 0.003; P cue: 0.034 ± 0.001), R/N trials (R cue: 0.353 ± 0.003; N cue: 0.023 ± 0.001) and P/N trials (P cue: 0.147 ± 0.002; N cue: 0.097 ± 0.002; green asterisks: χ2-test, p < 10−4).
Figure 3
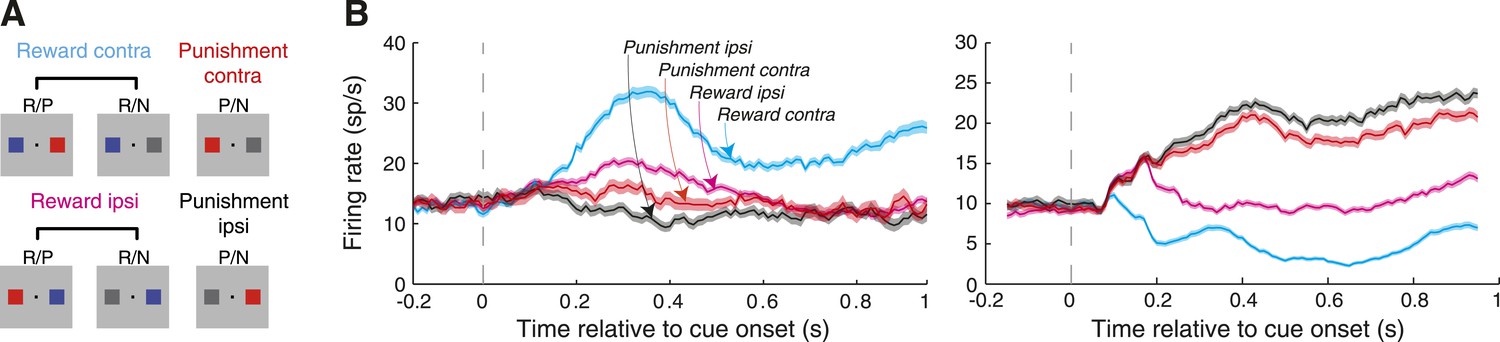
The spatial location of cues predicting rewarding and aversive outcomes modulates amygdala neural activity.
(A) Grouping of trial types for the purpose of neural analyses. (B) Example neuron firing rates as a function of time relative to cue onset. Firing rates are plotted for the four trial types (illustrated in A) and shading indicates the standard error of firing rates across trials. For each neuron, spatial-reward selectivity was significant in all time windows (Wilcoxon, p < 0.05); for the neuron on the left, spatial-punishment selectivity was significant in the first two time windows (100–400 ms, 400–700 ms), and the for the neuron on the right, spatial-punishment selectivity was significant in the last two time windows (400–700 ms, 700–1000 ms).
Figure 4
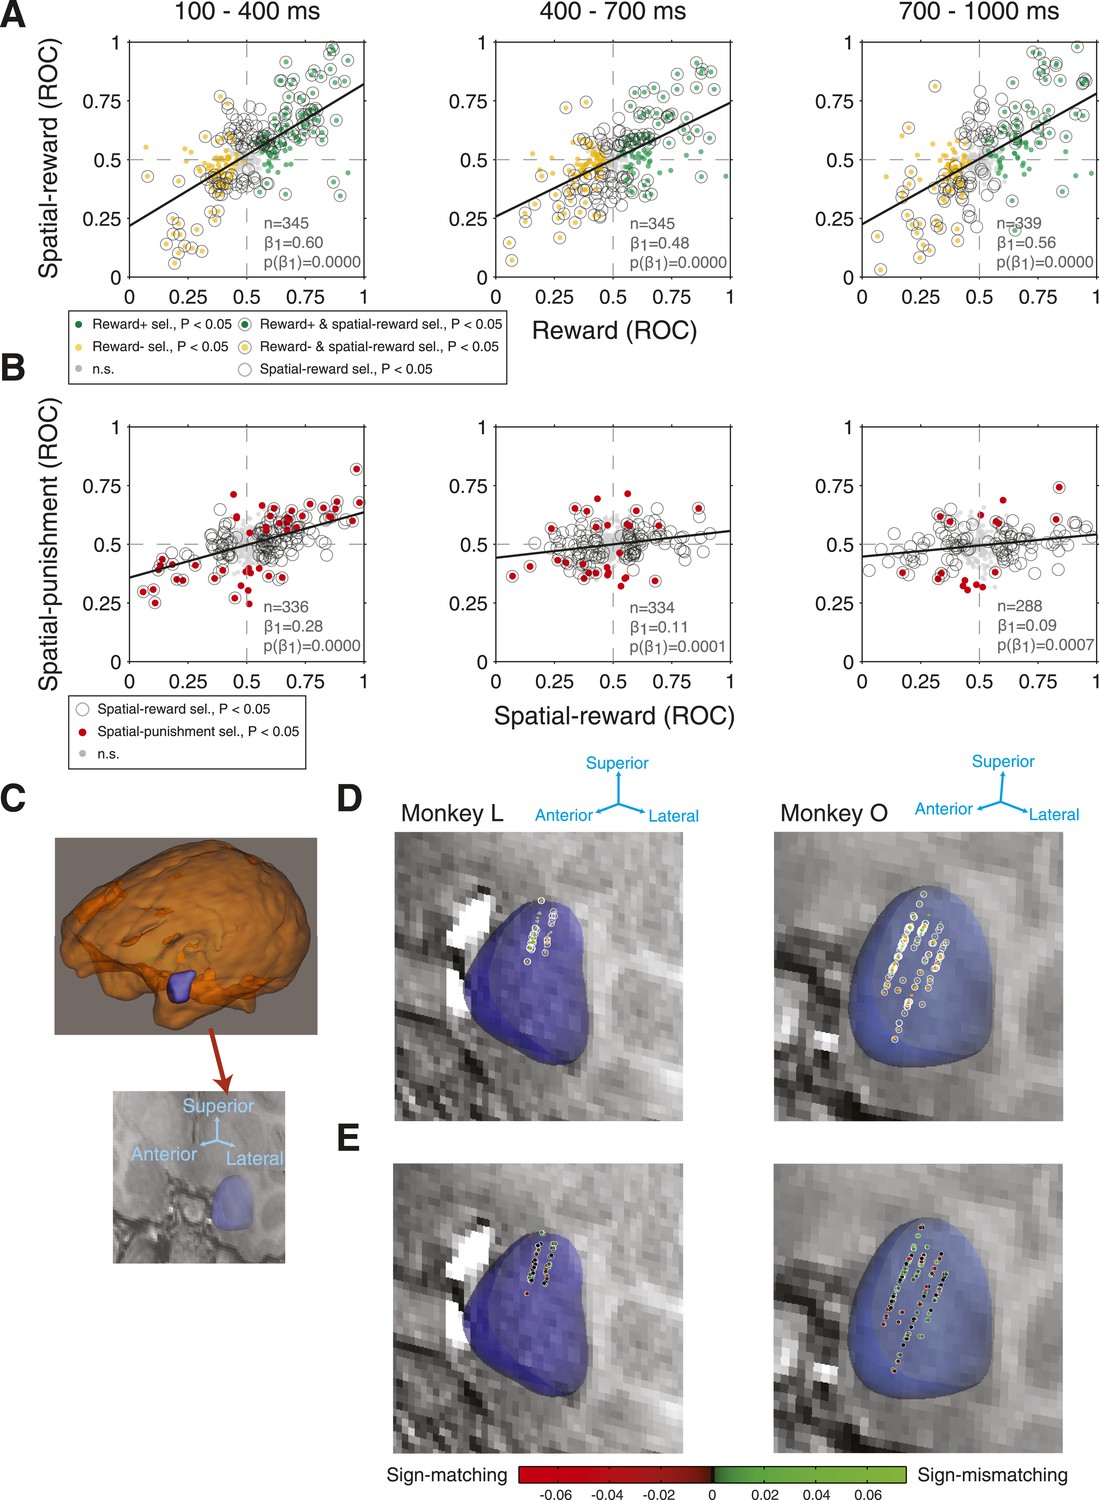
Amygdala neurons exhibit consistency between reward selectivity, spatial-reward selectivity, and spatial-punishment selectivity.
(A) Relationship between reward selectivity and spatial-reward selectivity indices in each time epoch. (B) Relationship between spatial-reward selectivity and spatial-punishment selectivity indices. For both (A) and (B), plot style indicates the significance selectivity for each recording site (see legends) and regressions lines are plotted (significant in each case, p < 0.001). (C) 3D reconstruction of the whole brain and the amygdala for Monkey O (top), and the 3D reconstruction of the amygdala overlaid on a single coronal MRI slice for that monkey (bottom). (D and E) Recording sites. Each coronal slice has been tilted to enable visualization of all electrode tracks. Arrows provide the orientation of the slice after tilting. Each data point represents the location of one site recorded during the task for each monkey (Monkey L: left; Monkey O: right) and the significance of selectivity for that site (D, as in A; p < 0.05 in at least one time epoch) or the degree of sign-matching/magnitude of the spatial-reward and spatial-punishment selectivity indices (E). In (E) positive values (green dots) indicate those neurons with matching signs of selectivity, while negative values (red dots) indicate non-matching selectivity; the brightness of the data points indicates the magnitude of the selectivity.
Figure 5
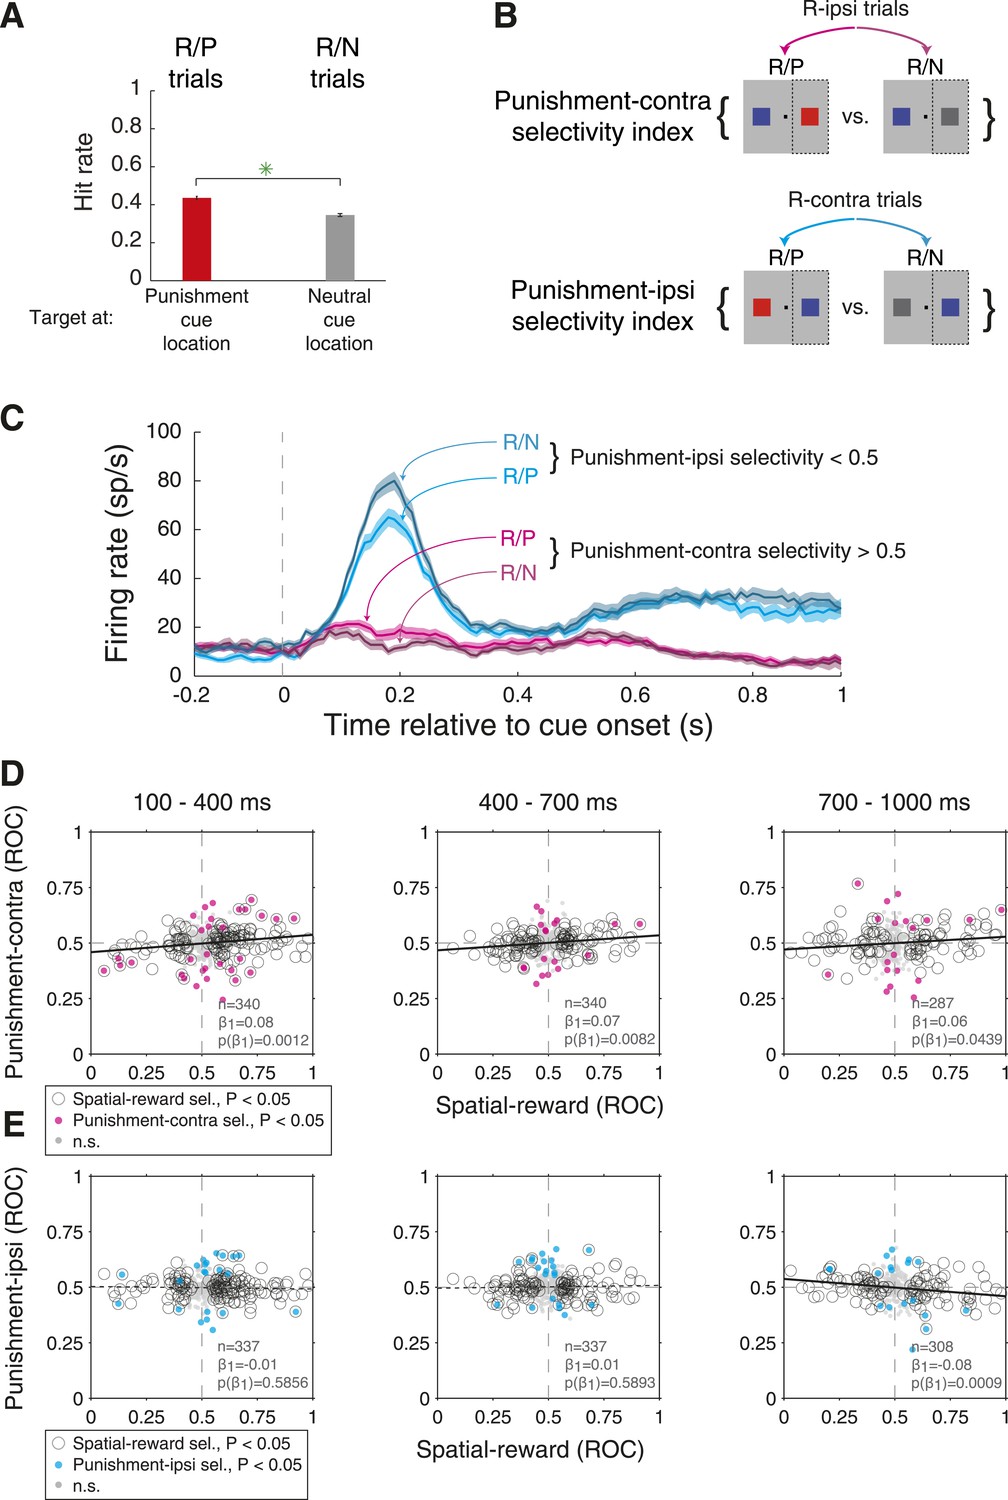
Amygdala neurons reflect subtle changes in attention on R-present trials driven by punishment cues.
(A) Hit rates for secondary cues compared across R/P and R/N trials (bottom). Hit rates were greater for the P cue relative to the N cue; green stars indicate significance (p < 0.05). (B) Trial types used to compute punishment-contra and punishment-ipsi selectivity indices and corresponding behavior; dashed rectangles indicate the contralateral hemifield in each comparison. (C) Firing rates of an example neuron on R/P & R/N trials. For this neuron, both punishment-contra and punishment ipsi selectivity were significant (p < 0.05) in the early time window (100–400 ms). (D and E) Relationship between spatial-reward selectivity indices and (D) punishment-contra or (E) punishment-ipsi selectivity indices for each time epoch. Spatial-reward selectivity indices on the x-axis are the same as those on the x-axis of Figure 4B. Plot style indicates the significance of selectivity indices (see legend); solid and dashed regression lines indicate significant (p < 0.05) and non-significant relationships, respectively.
Figure 6
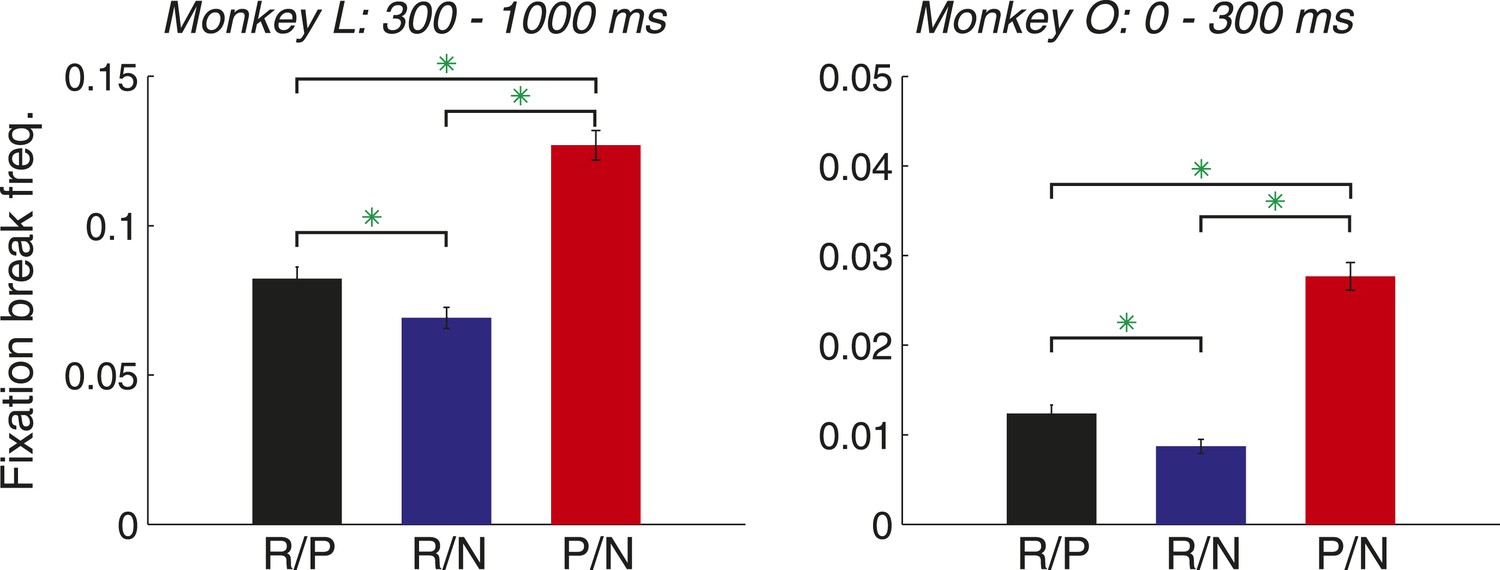
Monkeys break fixation in proportion to the reinforcement value of the cues.
Fixation break frequency is plotted for each trial type for monkey L (left; mean ± standard error; R/P: 0.082 ± 0.004; R/N: 0.069 ± 0.004; P/N: 0.127 ± 0.005) and monkey O (right; R/P: 0.012 ± 0.001; R/N: 0.009 ± 0.001; P/N: 0.028 ± 0.002). Time windows are relative to cue onset, and green asterisks indicate the significance of comparisons (p < 0.05).
Figure 7
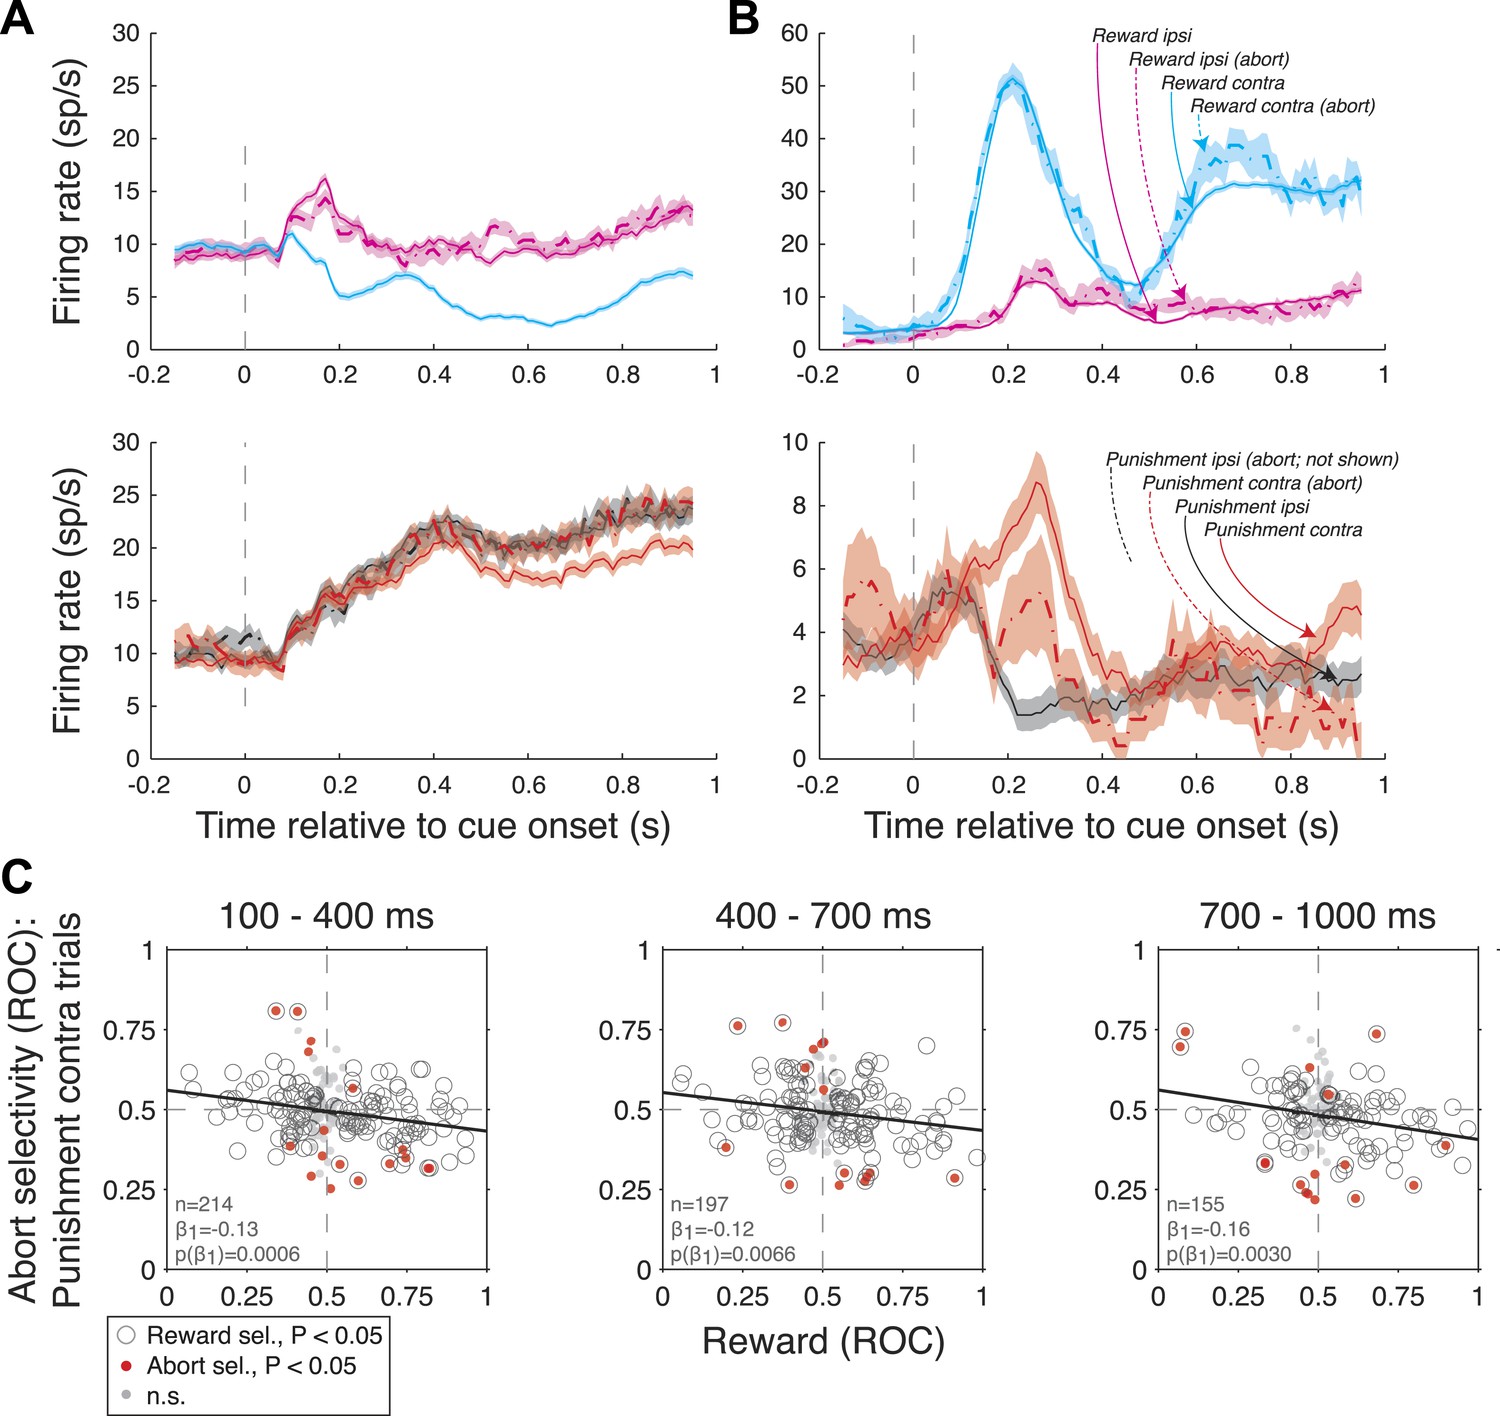
Amygdala firing rate selectivity for aborted trials.
(A and B) Example neuron cue-aligned firing rates for aborted (dashed lines) and non-aborted trials (solid lines) on R-present trials (left; R-contra, R-ipsi) and R-absent trials (right; P-contra, P-ipsi). Shading indicates standard error across trials. Note that firing rates for abort trials are not plotted in cases where there were fewer than 6 aborts. (A) Neuron with reward selectivity and spatial-reward selectivity indices <0.5 in all time epochs (p < 0.05). Abort selectivity was significant only on P-contra trials in the 700–1000 ms epoch (index = 0.70, p < 0.05). (B) Neuron with reward selectivity and spatial-reward selectivity indices >0.5 in all time epochs (p < 0.05). Abort selectivity was significant only on P-contra trials in the 700–1000 ms epoch (index = 0.39, p < 0.05). Different y-axis ranges are used for R-present and R-absent trials to illustrate abort selectivity. (C) Relationship between reward selectivity and abort selectivity indices on punishment-contra trials for each time epoch. Plot style indicates the significance of selectivity indices (see legend); solid lines indicate significant regressions (p < 0.05).
Author response image 1
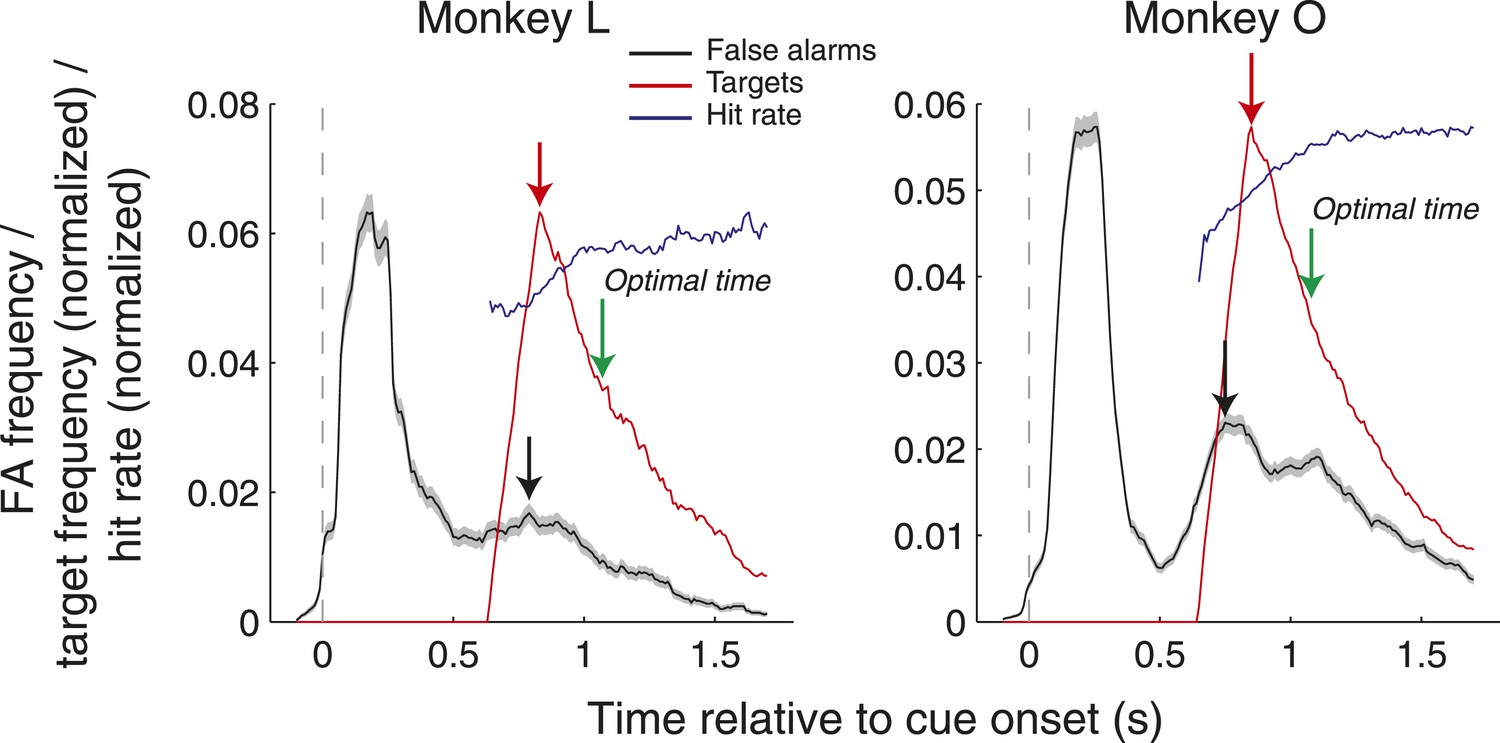
False alarm frequency (black), target onset frequency (red, normalized), and hit rate (blue, normalized) as a function of time relative to cue onset. Black and red arrows indicate the peaks of the false alarm and target onset frequency, and green arrows indicate the optimal time to saccade that would maximize hit rate. All data was computed in 200 ms windows stepped by 10 ms.
Author response image 2

Amygdala firing rate selectivity for aborted trials. (A and B) Example neuron cue-aligned firing rates for aborted (dashed lines) and non-aborted trials (solid lines) on R-present trials (left; R-contra, R-ipsi) and R-absent trials (right; P-contra, P-ipsi). Shading indicates standard error across trials. Note that firing rates for abort trials are not plotted in cases where there were less than 6 aborts. (A) Neuron with reward selectivity and spatial-reward selectivity indices <0.5 in all time epochs (p<0.05). Abort selectivity was significant only on P-contra trials in the 700-1000 ms epoch (index = 0.70, p<0.05). (B) Neuron with reward selectivity and spatial-reward selectivity indices >0.5 in all time epochs (p<0.05). Abort selectivity was significant only on P-contra trials in the 700-1000 ms epoch (index = 0.39, p<0.05). Different y-axis ranges are used for R-present and R-absent trials to illustrate abort selectivity. (C) Relationship between reward selectivity and abort selectivity indices on punishment-contra trials for each time epoch. Plot style indicates the significance of selectivity indices (see legend); solid lines indicate significant regressions (p<0.05).
Tables
Table 1
Counts of sites with significant selectivity
| Reward selectivity | Spatial-reward selectivity | Spatial-punishment selectivity | |
|---|---|---|---|
| R present > R absent | R contra > R ipsi | P contra > P ipsi | |
| R present < R absent | R contra < R ipsi | P contra < P ipsi | |
| 100–400 ms | 95 (27.5%) | 101 (29.3%) | 26 (7.7%) |
| 85 (24.6%) | 51 (14.8%) | 22 (6.5%) | |
| n = 345, p < 10−4 | n = 345, p < 10−4 | n = 345, p < 10−4 | |
| 400–700 ms | 85 (24.6%) | 67 (19.4%) | 12 (3.6%) |
| 91 (26.4%) | 64 (18.6%) | 16 (4.8%) | |
| n = 345, p < 10−4 | n = 345, p < 10−4 | n = 334, p = 0.0065 | |
| 700–1000 ms | 77 (22.5%) | 62 (18.3%) | 8 (2.8%) |
| 77 (22.5%) | 54 (15.9%) | 9 (3.1%) | |
| n = 342, p < 10−4 | n = 339, p < 10−4 | n = 288, p < 0.4969 |
-
For each cell within the table, the counts of sites with ‘positive’ selectivity (Wilcoxon, p < 0.05; selectivity index >0.5) and ‘negative’ selectivity (selectivity index <0.5) are displayed. Percentages were calculated relative to the number of sites for each type of selectivity and time window; this number varied due to the decreasing number of trials available for analysis in later time windows. The frequency of significantly selective neurons, including those with positive and negative selectivity, was tested against chance frequency (Binomial-test, α = 0.05).
Download links
A two-part list of links to download the article, or parts of the article, in various formats.
Downloads (link to download the article as PDF)
Open citations (links to open the citations from this article in various online reference manager services)
Cite this article (links to download the citations from this article in formats compatible with various reference manager tools)
Amygdala neural activity reflects spatial attention towards stimuli promising reward or threatening punishment
eLife 3:e04478.
https://doi.org/10.7554/eLife.04478


