A combined quantitative mass spectrometry and electron microscopy analysis of ribosomal 30S subunit assembly in E. coli
- Scripps Research Institute, United States
Figures
Figure 1 with 2 supplements
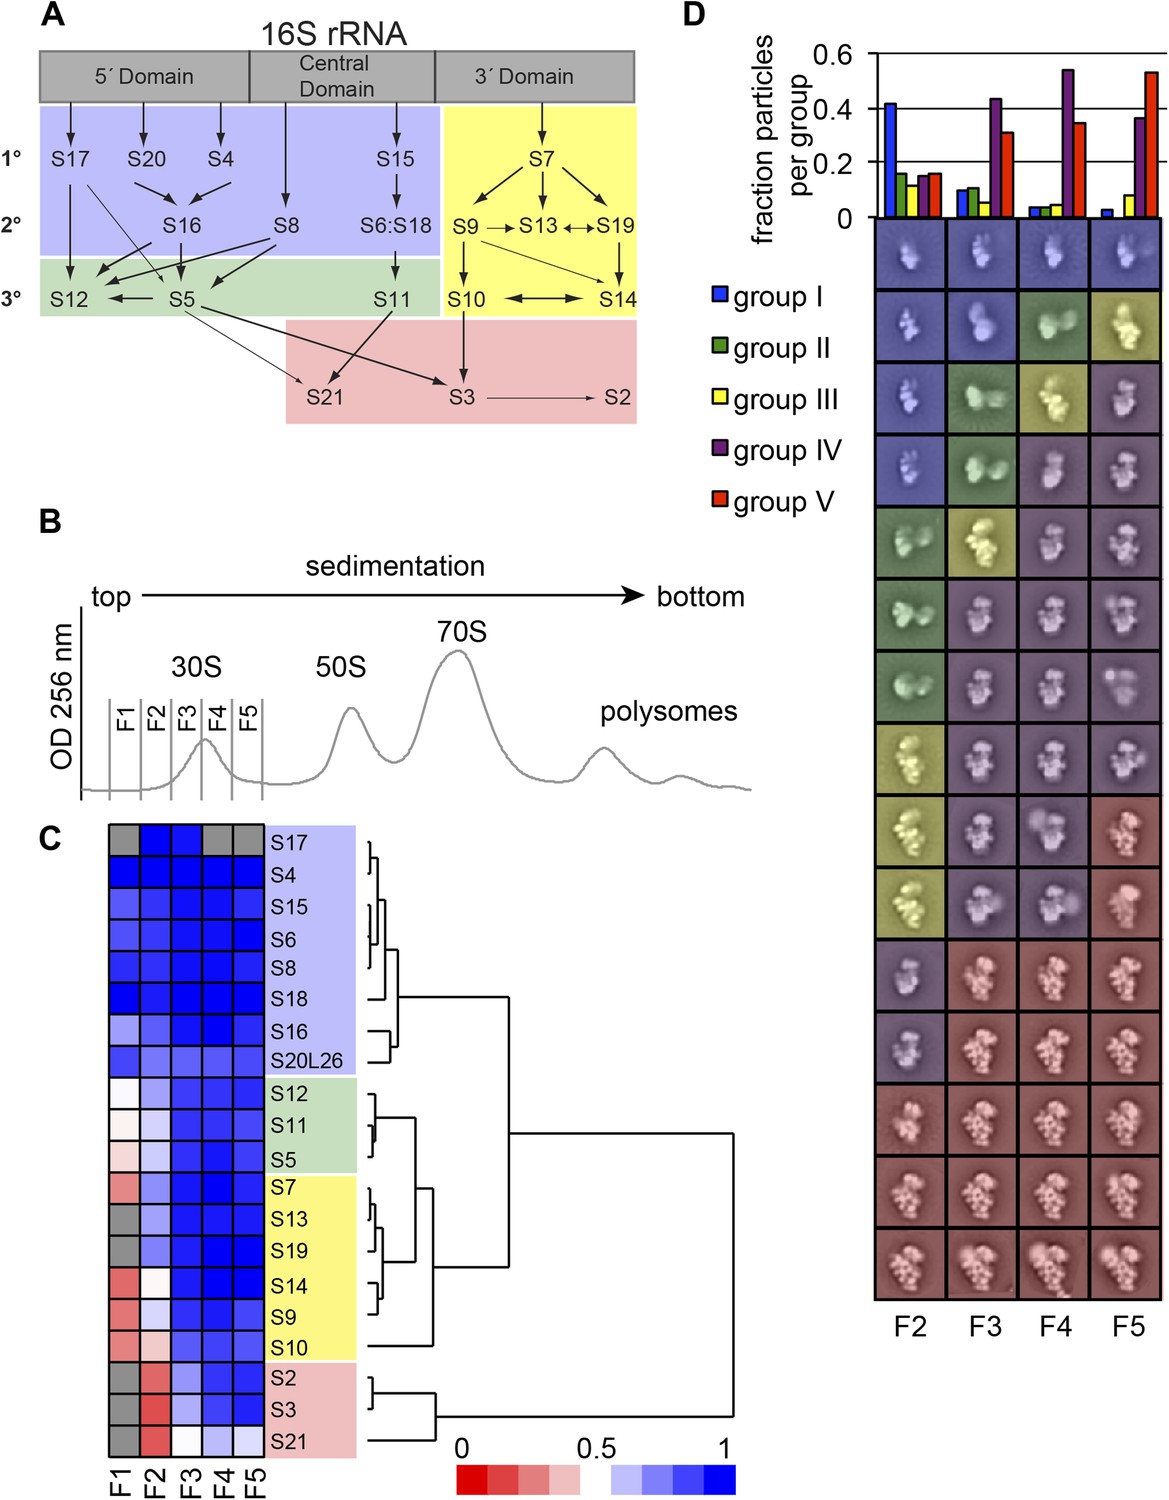
High-throughput qMS/EM analysis of assembly intermediates from WT E. coli.
(A) Nomura assembly map; adapted. Three major regions of 16S rRNA are labeled at top. Arrows represent binding dependencies, with primary, secondary and tertiary proteins labeled on left. (B) Sucrose gradient chromatogram (absorbance at 254 nm) for WT E. coli lysate. 30S peak fractions analyzed by qMS and EM are labeled. (C) R-proteins clustered by relative abundance in 30S particles across sucrose gradient fractions 1–5 with a blue to red gradient representing high to low relative abundance. Relative abundance of each r-protein was normalized to that of S4. Gray boxes indicate r-proteins for which no peptides were detected. Clusters of r-proteins from more abundant to less abundant across the gradient are highlighted on the right as blue, green, yellow, and red. (D) Negative stain EM class averages for sucrose gradient fractions 2–5 (labeled at bottom). Classes were obtained by reference-free maximum likelihood alignment and classification and are sorted by Group. Histogram at top shows the fractional contribution of particles from each dataset to each Group.
Figure 1—figure supplement 1
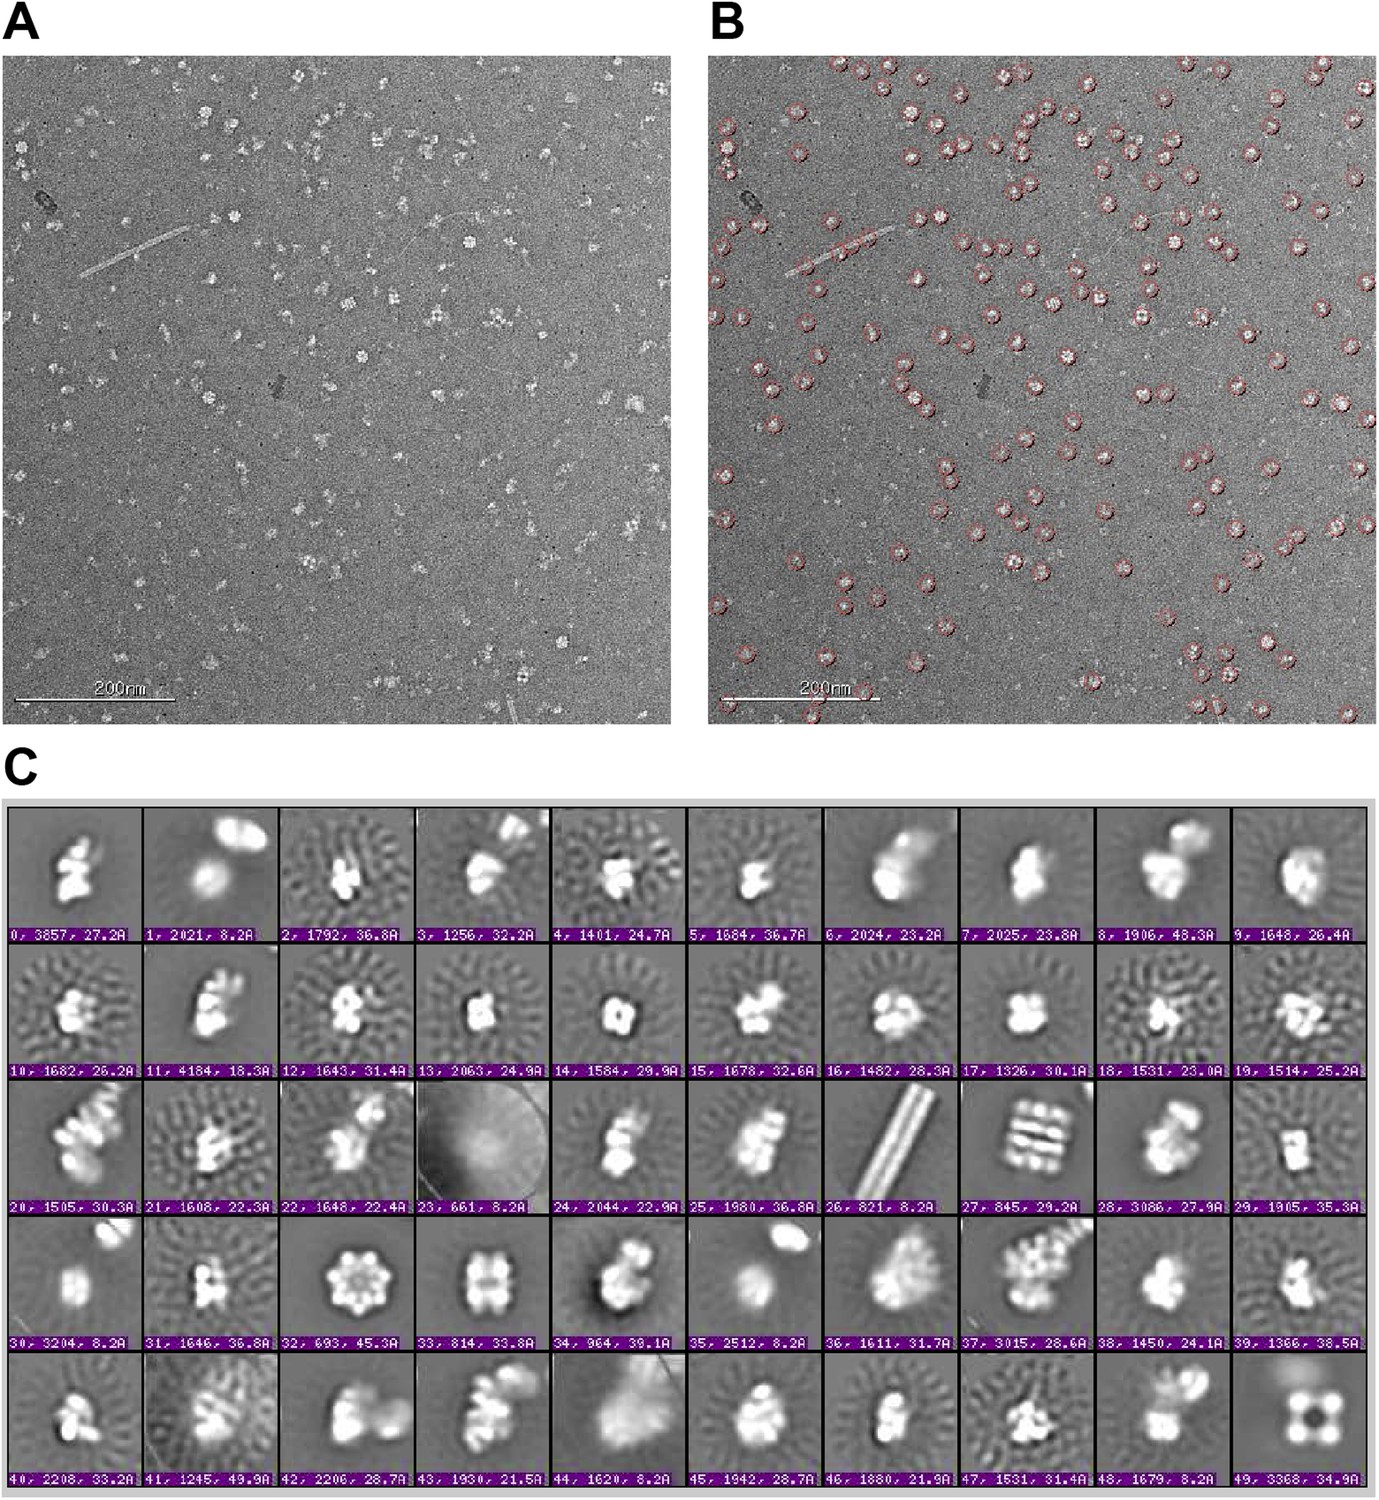
Raw micrographs and initial class averages for WT F2 negative stain EM data set.
(A) Exemplar image collected on FEI T12 transmission electron microscope operating at 120 keV and equipped with a Tietz TemCam-F416 4k × 4k CMOS camera at nominal magnification of 52000×. Scale bar represents 200 nm. (B) Particle picks selected by reference-free DoG picking. (C) Initial class averages obtained by reference-free maximum likelihood alignment and classification. Several E. coli complexes are readily observed, including pili (26), GroEL (27 and 32), glutamine synthetase complex (33) and pyruvate dehydrogenase and 2-oxoglutarate dehydrogenase complexes (49). Components of these complexes were detected by MS-MS analysis of the sucrose gradient fractions (Supplementary file 1). 30S intermediates were identified by comparison with previous EM studies (Mandiyan et al., 1991; Mulder et al., 2010), and by further experiments including affinity purification described in text.
Figure 1—figure supplement 2
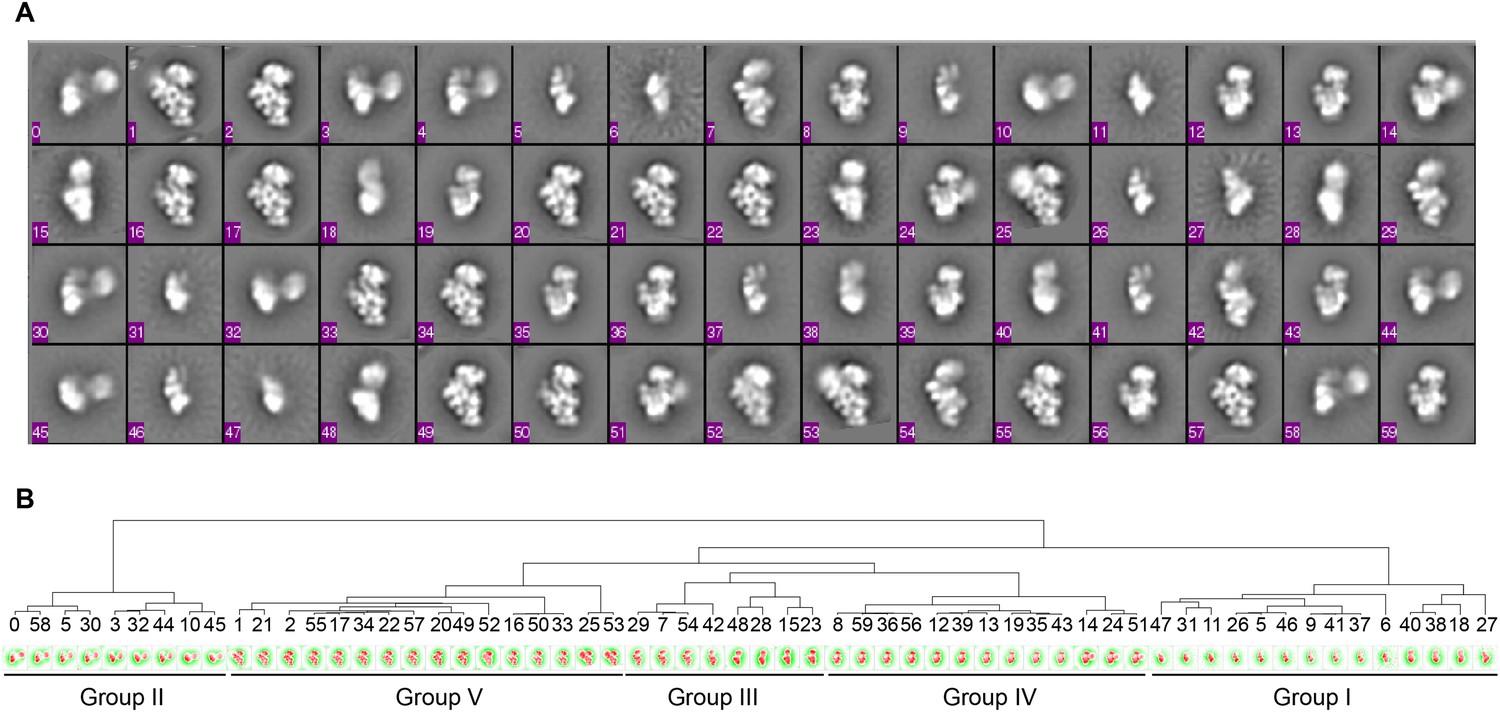
Hierarchical clustering of class averages.
(A) Class averages obtained from data sets for four WT sucrose gradient fractions (ML2D, 15 classes). The final classes were aligned to one another using EMAN align2d (Ludtke et al., 1999). (B) Dendrogram showing clustering of class averages from (A). Groups are labeled on bottom, and classes are ordered based on fraction and Group in Figure 1D.
Figure 2
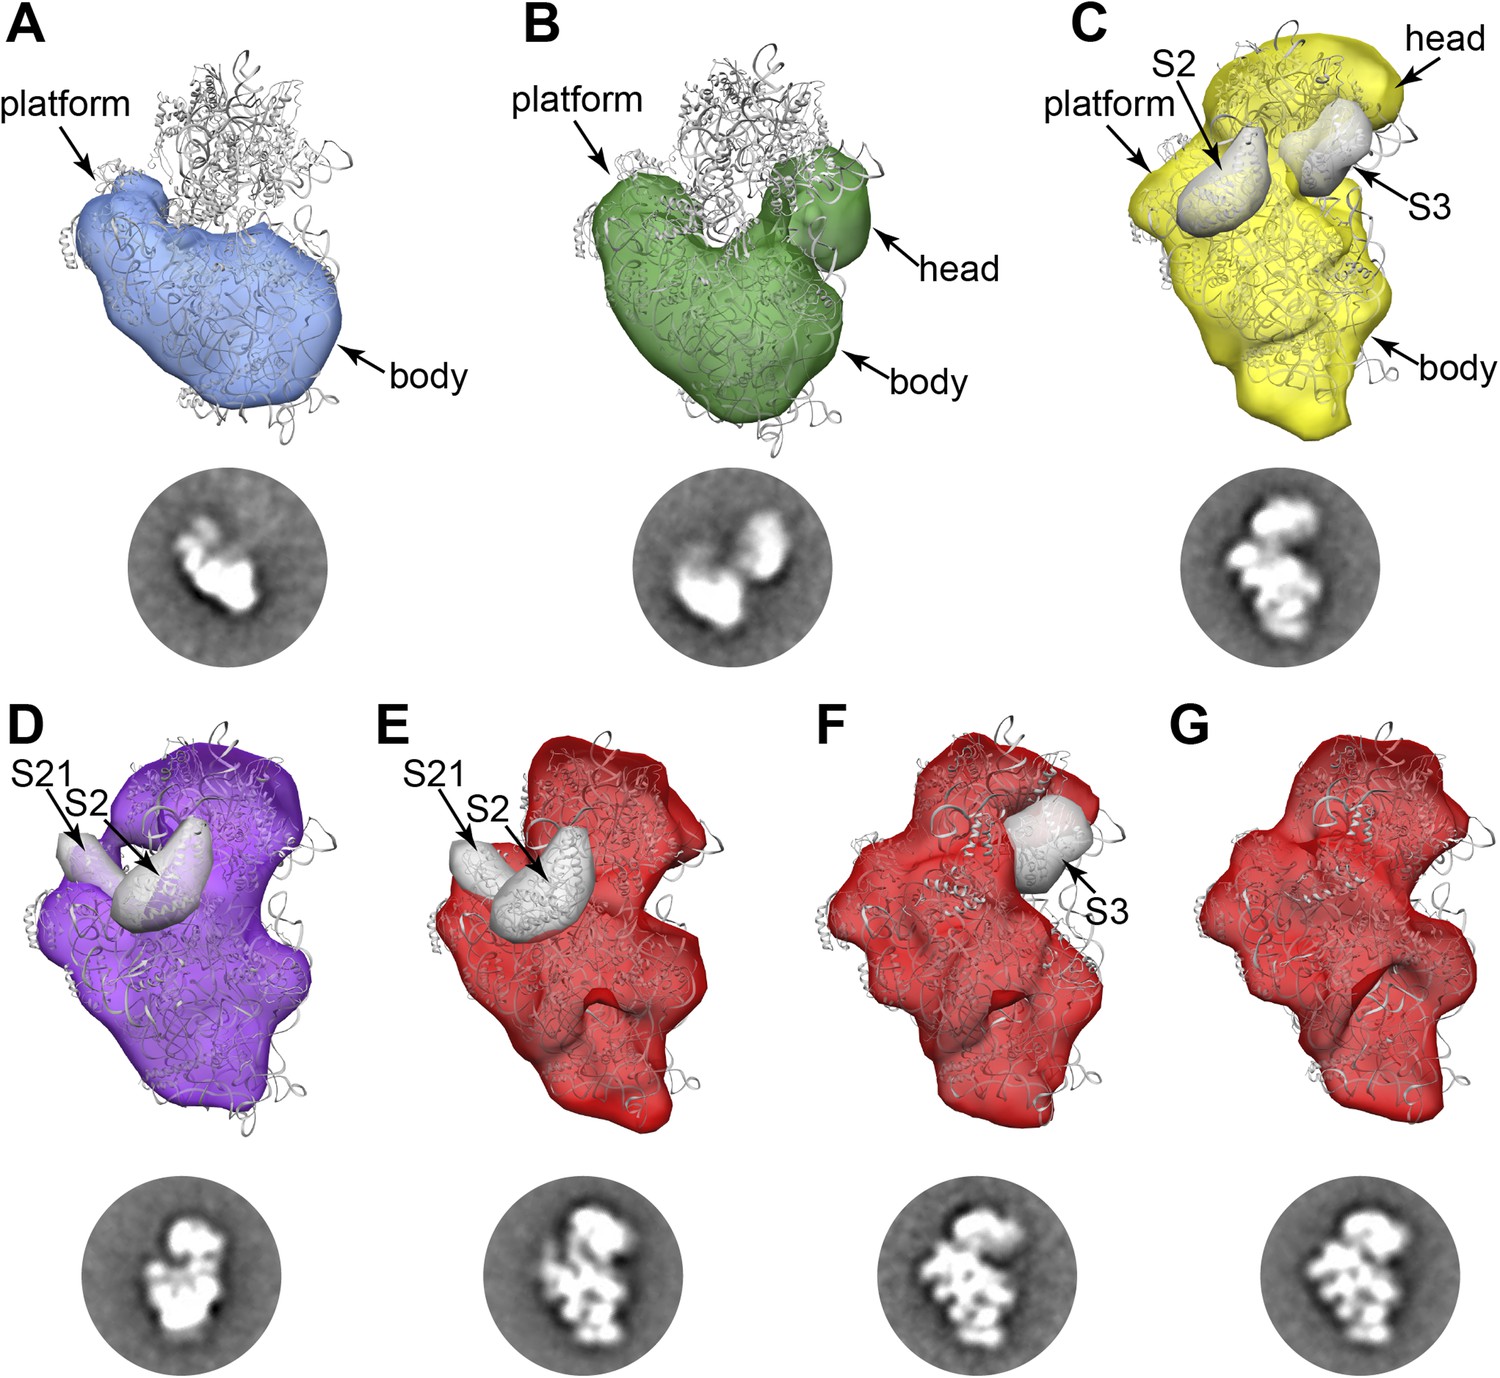
RCT reconstructions of assembly intermediates from WT E. coli.
Representative RCT reconstructions aligned with crystal structure of the mature 30S subunit (PDB 2AVY (Schuwirth et al., 2005) shown in gray). (A) Group I intermediate. All density for 3′-domain is missing. (B) Group II intermediate. Head domain density is detached from the body/platform domain. (C) Group III intermediate. The head density is angled away from the body domain, and density for S2 and S3 are missing. A 30 Å filter was applied to the PDB chains for S2 and S3, and the resulting volumes (gray surfaces) lie outside of the RCT volume. (D) Group IV intermediate. S2 and S21 density is missing, and the PDB chains for these proteins are shown as gray 30 Å filtered maps as in (C). (E) Group V intermediate missing S2 and S21, with the PDB chains for these proteins shown as gray 30 Å filtered maps as in (C). (F) Group V intermediate missing S3 density. The PDB chain for S3 is shown as a gray 30 Å filtered map as in (C). (G) Fully mature Group V.
Figure 3 with 2 supplements
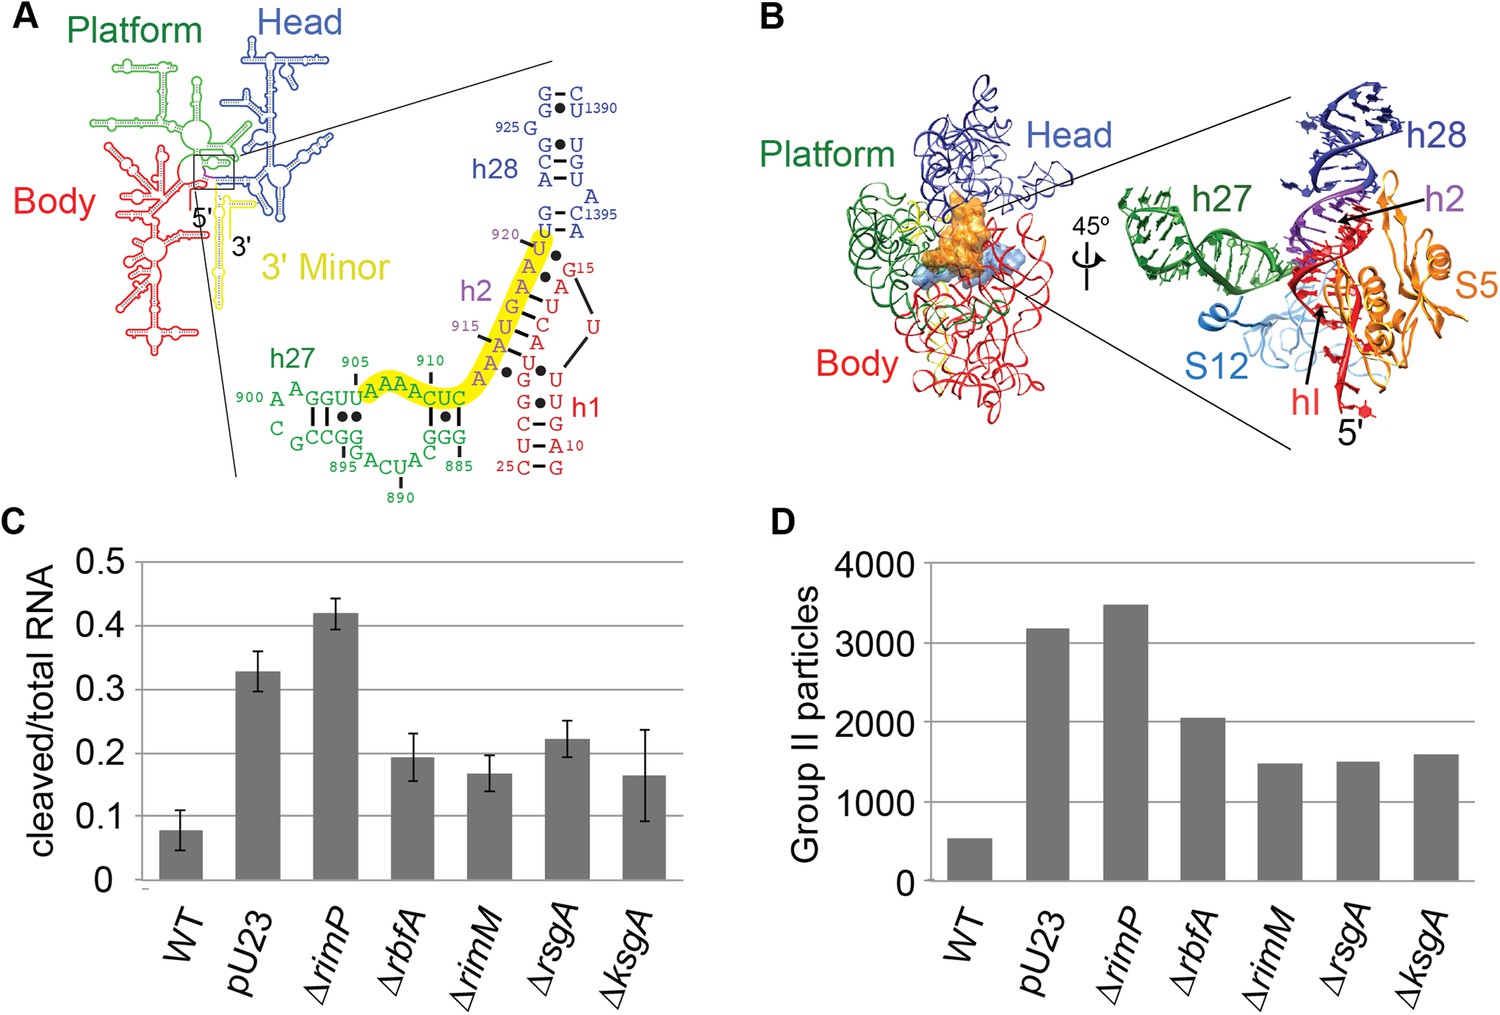
Survey of central pseudoknot stability upon deletion of assembly factors.
(A) 16S rRNA secondary structure (red: 5′-body; green: central; blue: 3′-head; yellow: 3′-minor), with central PK region boxed. The sequences of helix 2 (h2), which forms the central PK, and adjacent secondary structures helix 1 (h1), helix 27 (h27) and helix 28 (h28) are shown at right. The sequence targeted by an anti-sense DNA oligo (16S rRNA nt 906-920) is highlighted in yellow. (B) Crystal structure (PDB: 2AVY (Schuwirth et al., 2005)) of the 30S subunit from E. coli. 16S rRNA is shown as backbone ribbon and colored as in (A). Only r-proteins S5 (orange) and S12 (blue) are shown. A close-up of the central pseudoknot and adjacent rRNA helices and r-proteins is shown at right. (C) Anti-PK hybridization (500 pmol oligo)/RNase H cleavage of 16S rRNA from 30S peak sucrose gradient fractions for seven different E. coli strains. The average fraction of rRNA cleaved (product/total RNA) from three replicates is plotted. Error bars represent the standard deviation of fraction cleaved between the three replicates. (D) Abundance of Group II particles in seven E. coli strains as measured by negative stain EM. 10000 30S assembly intermediate particles from each strain were combined into a single stack of 70,000 particles. The stack was subjected to reference-free maximum likelihood alignment (Figure 3—figure supplement 2). The number of particles from each strain contributing to Group II classes is plotted in the histogram.
Figure 3—figure supplement 1
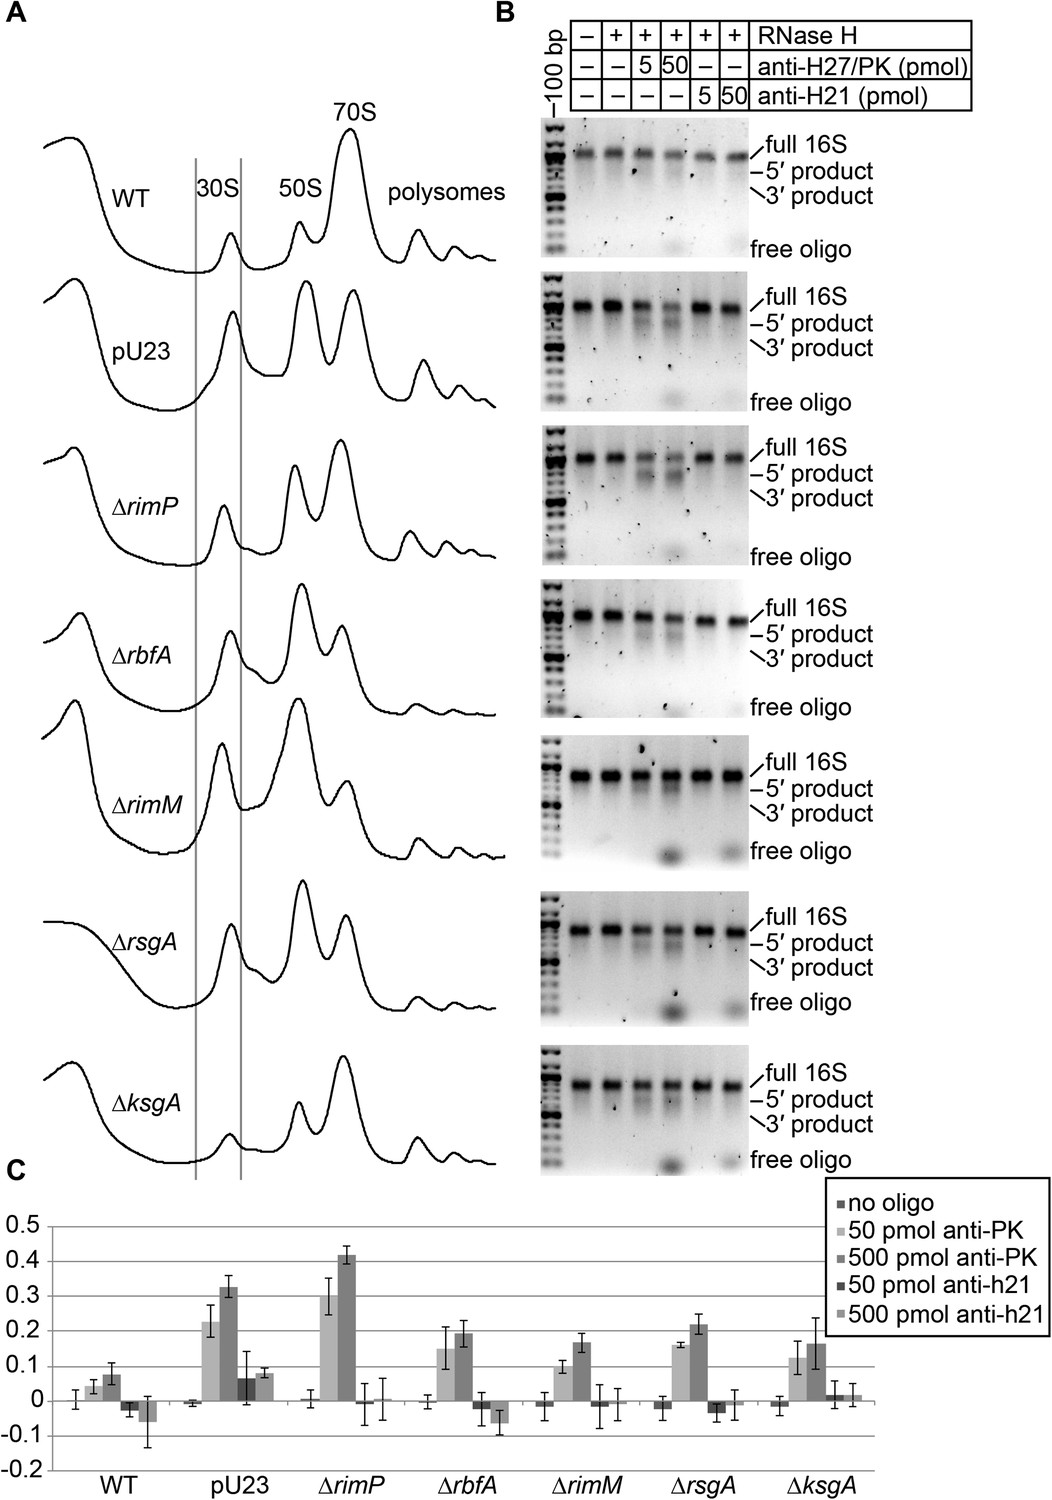
Oligo hybridization/RNase H assay.
(A) Sucrose gradient chromatograms (absorbance at 254 nm) for seven strains. Lines indicate the portion of the 30S peak that was collected and used for RNase H assay and EM analysis. (B) RNase assay cleavage detected on 2% agarose gel stained with ethidium bromide. Products are labeled on right. The anti-h21 oligo was used as a control, targeting a region of the rRNA that should be stable and inaccessible in all strains. (C) Quantitation of RNase H cleavage (average of three replicates, error bars represent standard deviation). For each lane, the intensity of intact 16S rRNA and cleavage products was measured using image quant. Cleavage products detected in the ‘no oligo’ lane were subtracted from other lanes for the same strain, to account for background cleavage that may have occurred before or during the cleavage assay.
Figure 3—figure supplement 2
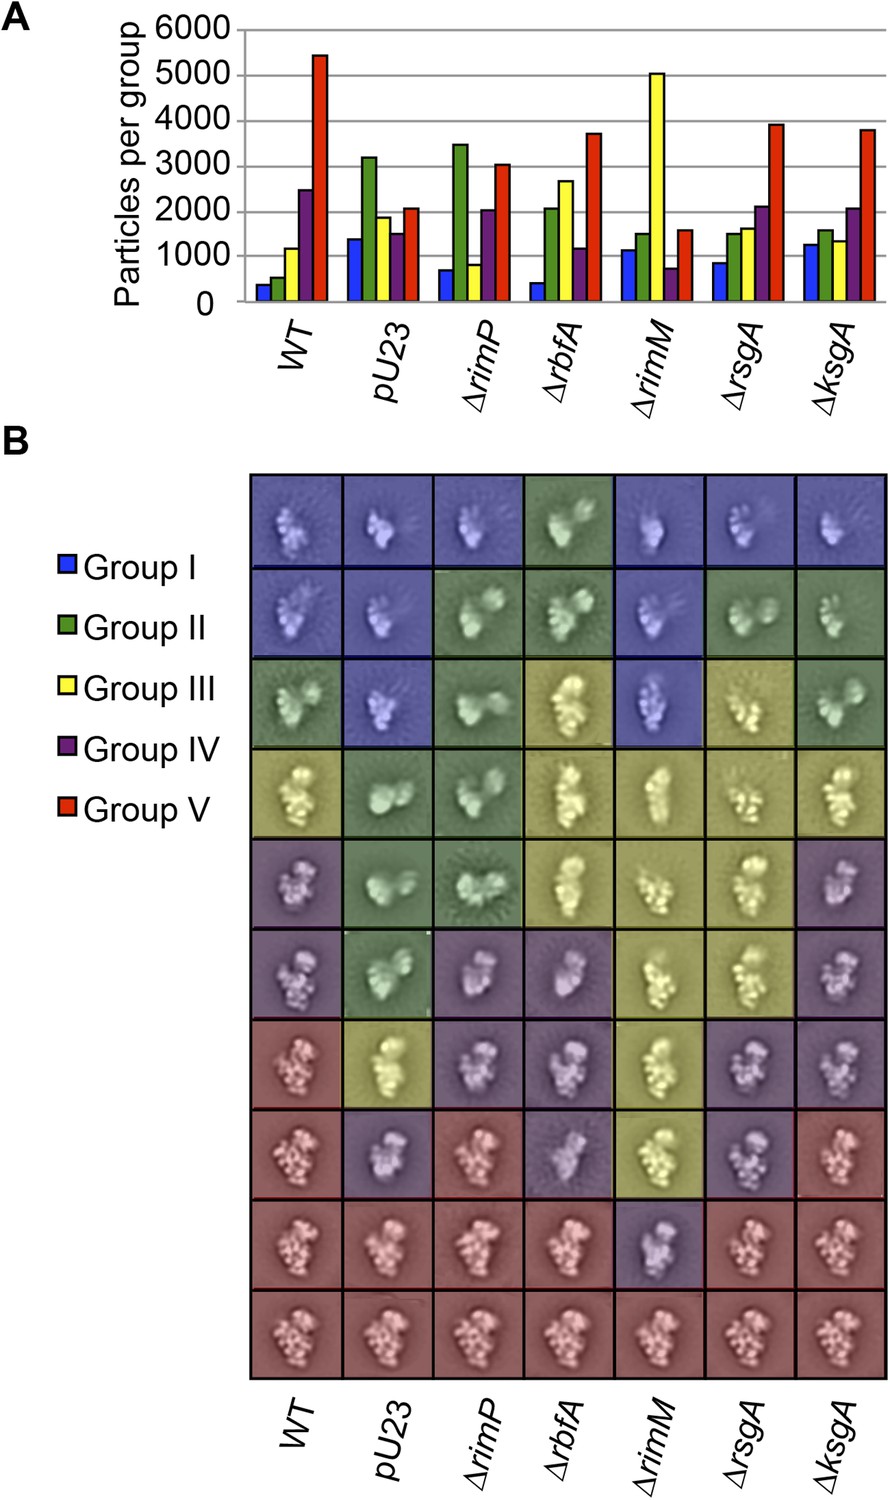
Class averages from seven E. coli strains.
(A) Direct comparison of the distribution of assembly intermediate Groups in data sets collected for samples from seven different strains. A combined stack of 70,000 particles (10,000 particles from each strain) was subjected to reference-free maximum likelihood alignment. The resultant classes were aligned to one another, then clustered using the Mathematica script described in the experimental methods. The number of particles from each strain contributing to each Group is plotted in the histogram. (B) Reference-free maximum likelihood class averages obtained from individual data sets collected for each sample from Figure 3—figure supplement 1A. The classes are sorted by Group within each strain.
Figure 4 with 1 supplement
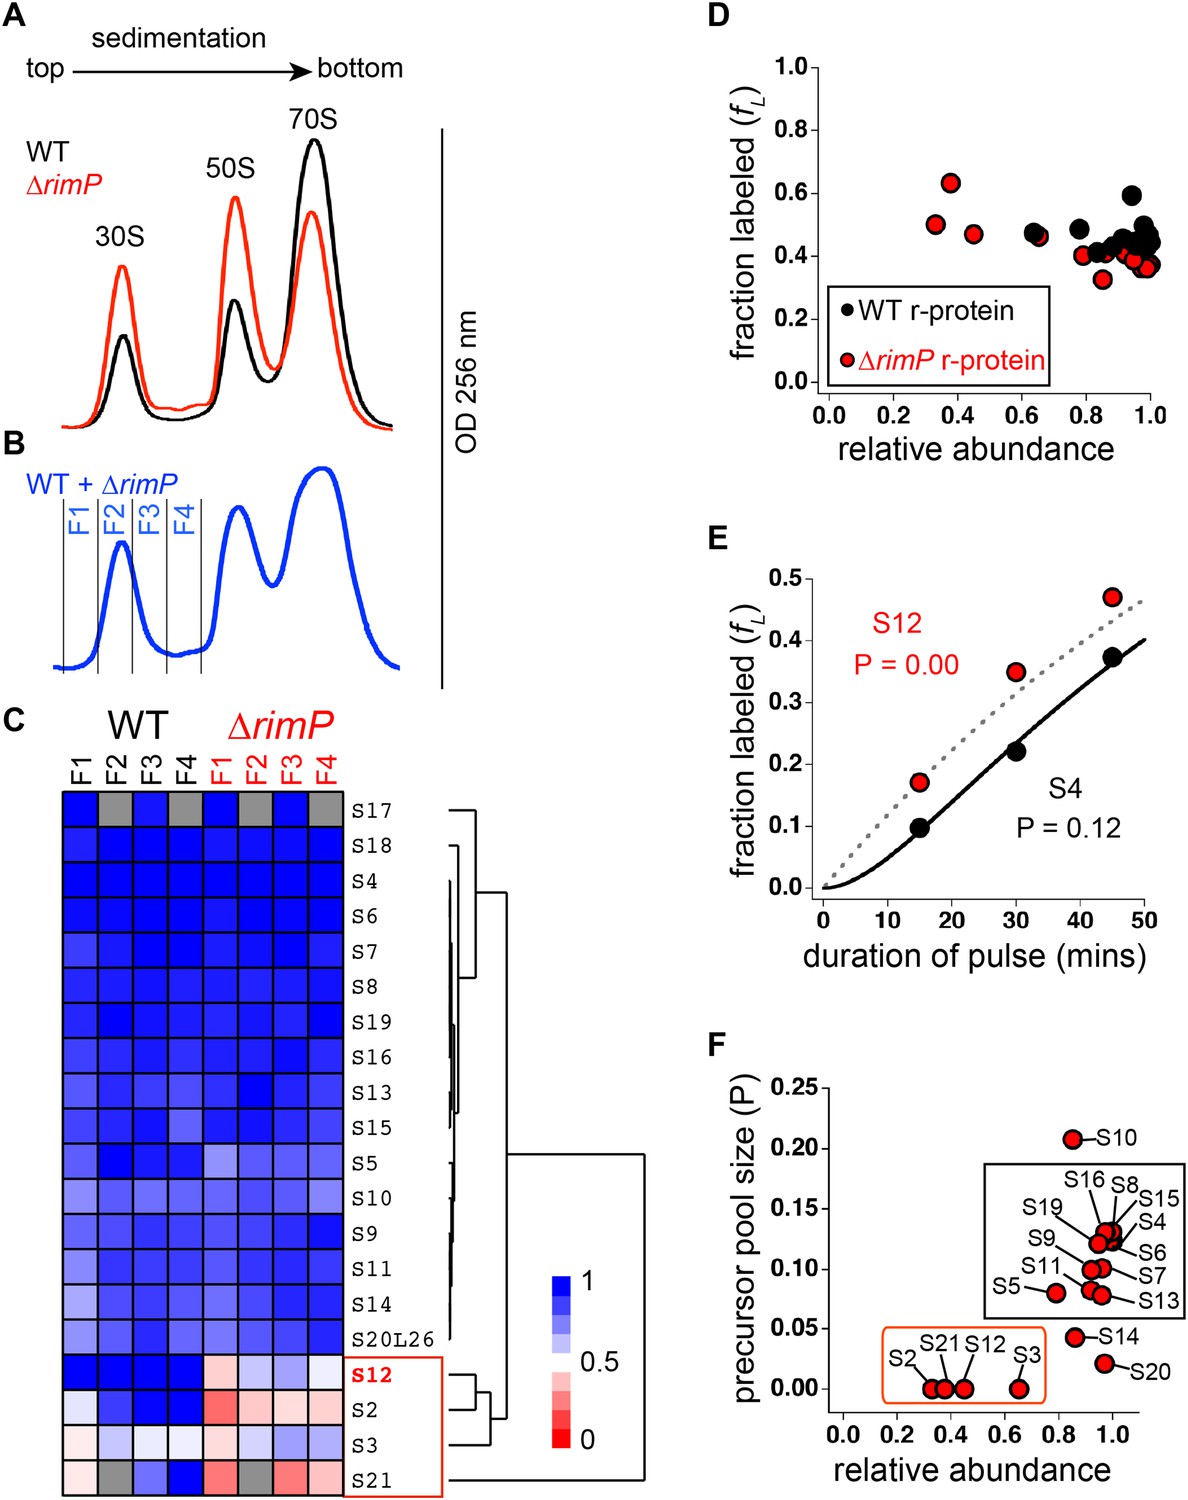
Comparison of 30S assembly in WT and ΔrimP by qMS.
(A) Overlay of sucrose gradient chromatograms (absorbance at 254 nm) for WT (black) and ΔrimP (red). (B) Sucrose gradient chromatogram of combined WT and ΔrimP (blue) lysates, with fractions analyzed by qMS labeled 1–4. (C) R-proteins in 30S particles in WT (black) and ΔrimP (red), across fractions 1–4 (labeled at top) clustered by relative abundance, with a red to blue gradient representing high to low relative abundance. Relative abundance of each r-protein was normalized to that of S4. Gray boxes indicate r-proteins for which no peptides were detected. The cluster comprising r-proteins that are the least abundant in both strains (S3 and S21) and preferentially depleted in ΔrimP (S2 and S12) is highlighted by a red box. (D) Fraction labeling of 30S r-proteins in 70S particles versus their relative abundance in 30S particles in WT (black) compared to ΔrimP (red). Data collected from cells labeled for 45 min. (E) Representative labeling kinetics for an early binder, S4 (black) compared to late binder, S12 (red) in ΔrimP. The maximum expected labeling rate is represented by the dashed grey line. Time course of experiment was fit (bold black line for S4) to a previously reported pulse-labeling model to determine the precursor pool size (P) of each r-protein (Chen et al., 2012). (F) Precursor pool size compared to relative abundance of r-proteins in 30S assembly intermediates in ΔrimP. R-proteins with large pool sizes and high abundance in 30S assembly intermediates are boxed in black while those with small pool sizes and low abundance in 30S assembly intermediates are boxed in red.
Figure 4—figure supplement 1
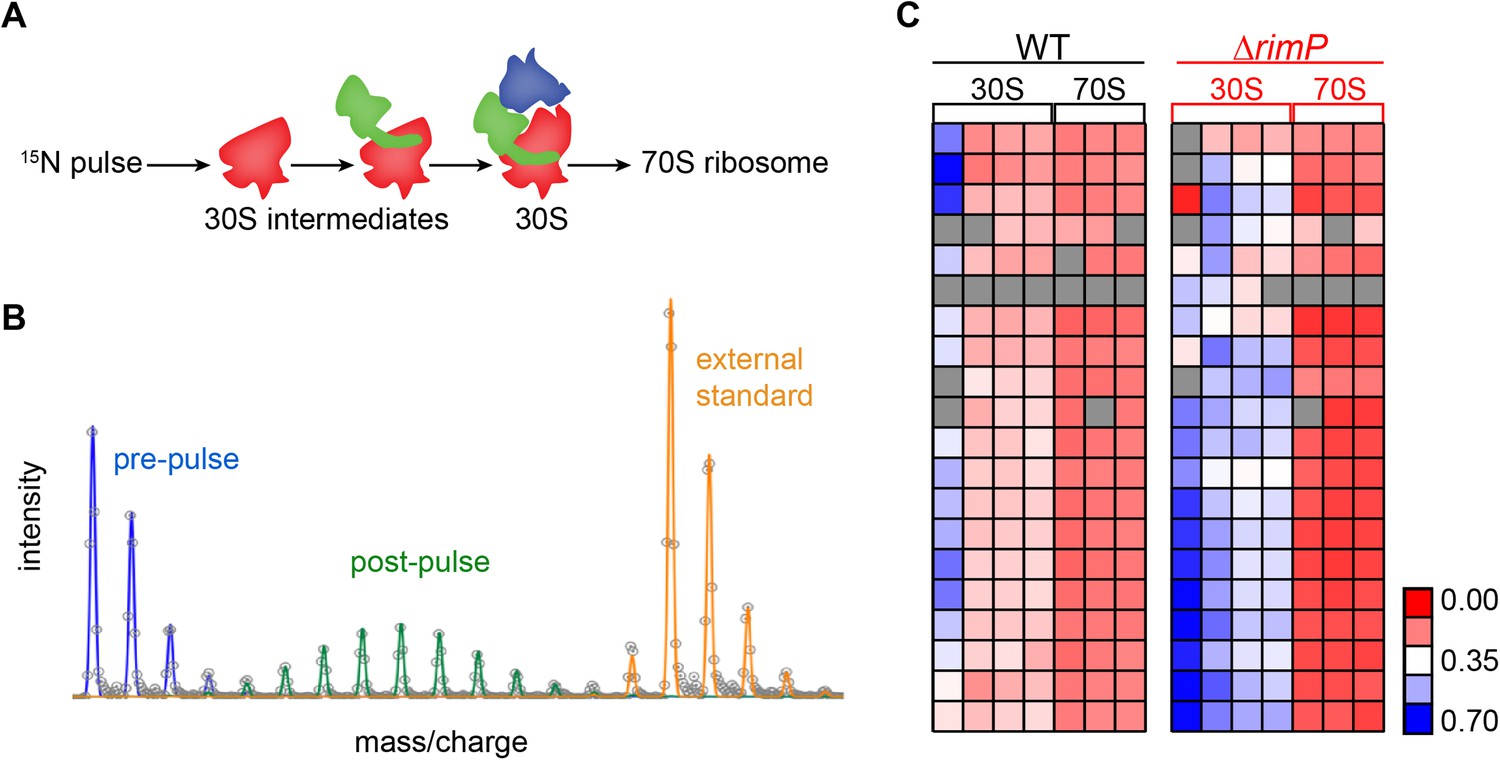
Pulse labeling experiment to monitor 30S assembly.
(A) Model of flow of 15N-label in 30S subunits during 70S assembly highlighting domain formation (body-red, platform-green, head-blue). (B) Isotope distribution of representative peptide with material synthesized pre-pulse (100% 14N) in red, material synthesized post-pulse (50% 15N) in green and material from the reference (100% 15N), used for peptide identification in orange. (C) Fraction labeled values of r-proteins in 30S particles compared to 70S particles for WT (black) and ΔrimP (red) with a blue to red gradient representing high to low fraction labeled value.
Figure 5
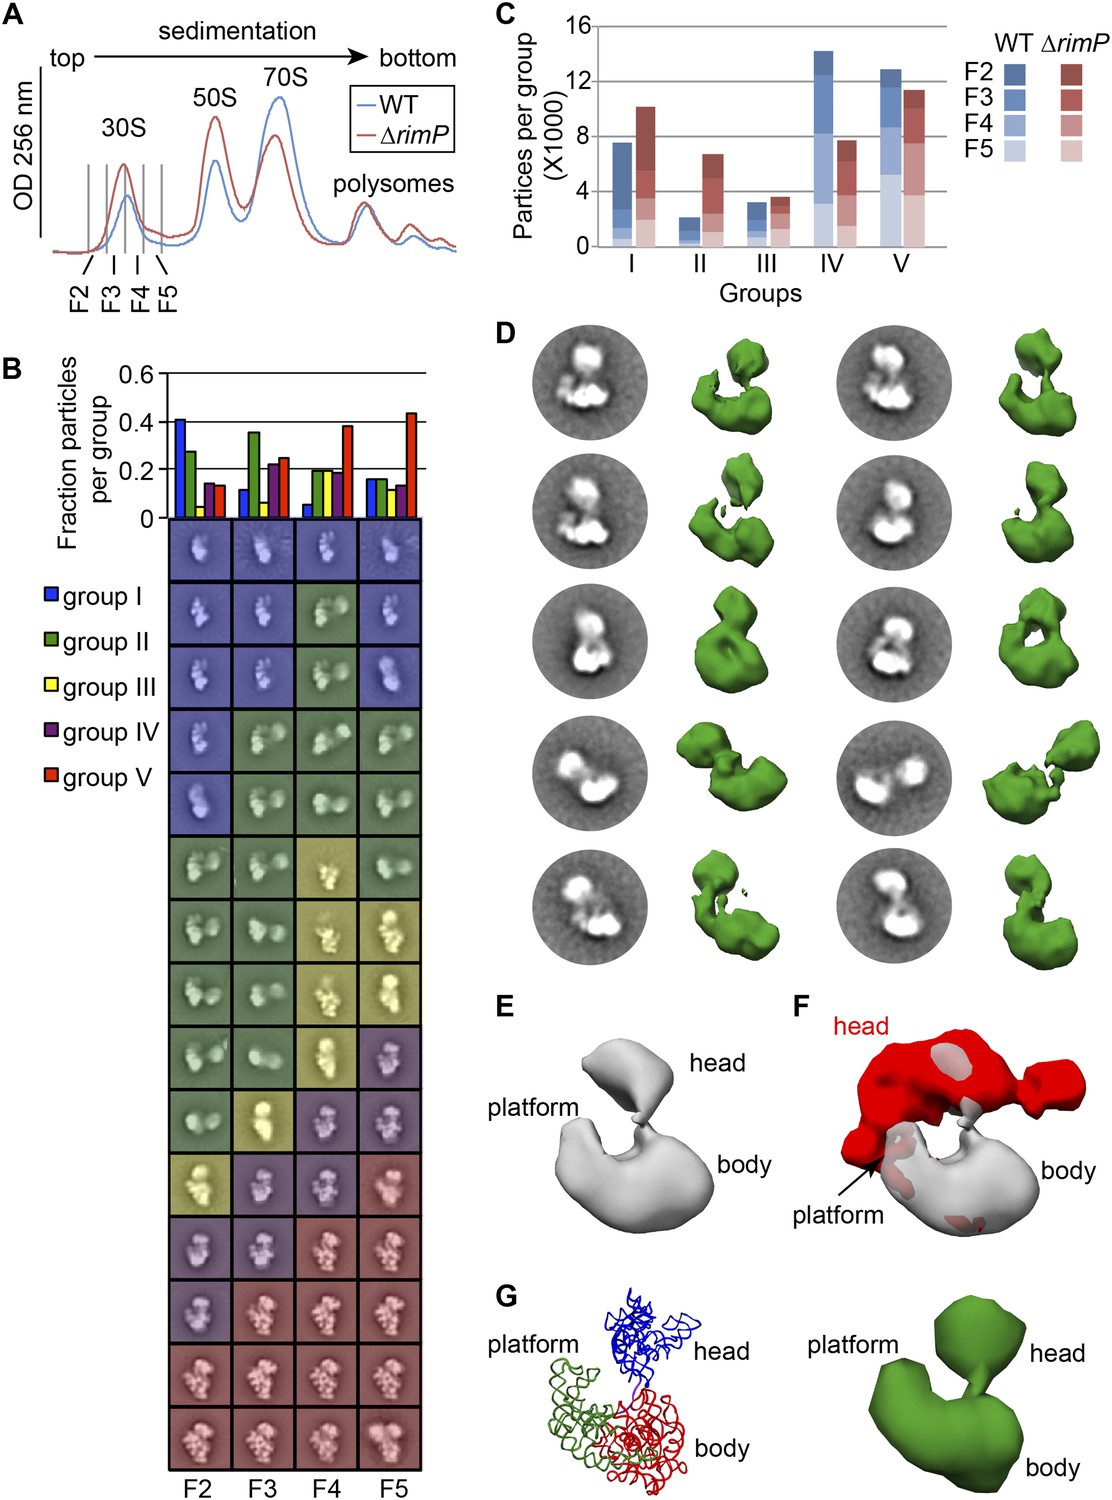
Direct comparison of WT and ΔrimP assembly intermediates by EM.
(A) Overlay of sucrose gradient chromatograms (absorbance at 254 nm) for WT (blue) and ΔrimP (red) lysates, with 30S peak fractions analyzed by EM indicated. (B) Negative stain EM class averages for fractions 2–5 of ΔrimP sucrose gradient (labeled at bottom). Classes were obtained by reference-free maximum likelihood alignment and classification and are sorted by Group. Histogram at top shows the fractional contribution of particles from each dataset to each Group. (C) Direct comparison of assembly intermediate abundance in WT (shades of blue) and ΔrimP (shades of red) strains. 10000 particles from each fraction for each strain were combined into a single stack with 80,000 particles. The stack was subjected to reference-free maximum likelihood alignment. For each strain, the number of particles from each fraction contributing to each Group are plotted as a stacked bar in the histogram, showing the contribution from each fraction and the overall number of particles in each group throughout the 30S peak. (D) Two-dimensional class averages and resulting 3D RCT volumes of Group II intermediates from the ΔrimP strain. The 3′-head domain location is highly variable between the different volumes. (E) Average density of the ten RCT volumes shown in (D). (F) Variance analysis of the 10 RCT volumes shown in (D). The average density from (E) is shown in gray, and the variance map is shown in red. (G) PDB model of the unanchored head conformation based on location of head in average density of RCT volumes. The 16S rRNA is shown and colored as in Figure 3A–B. A 50 Å filter was applied to the PDB, and the density is shown at right.
Figure 6 with 2 supplements
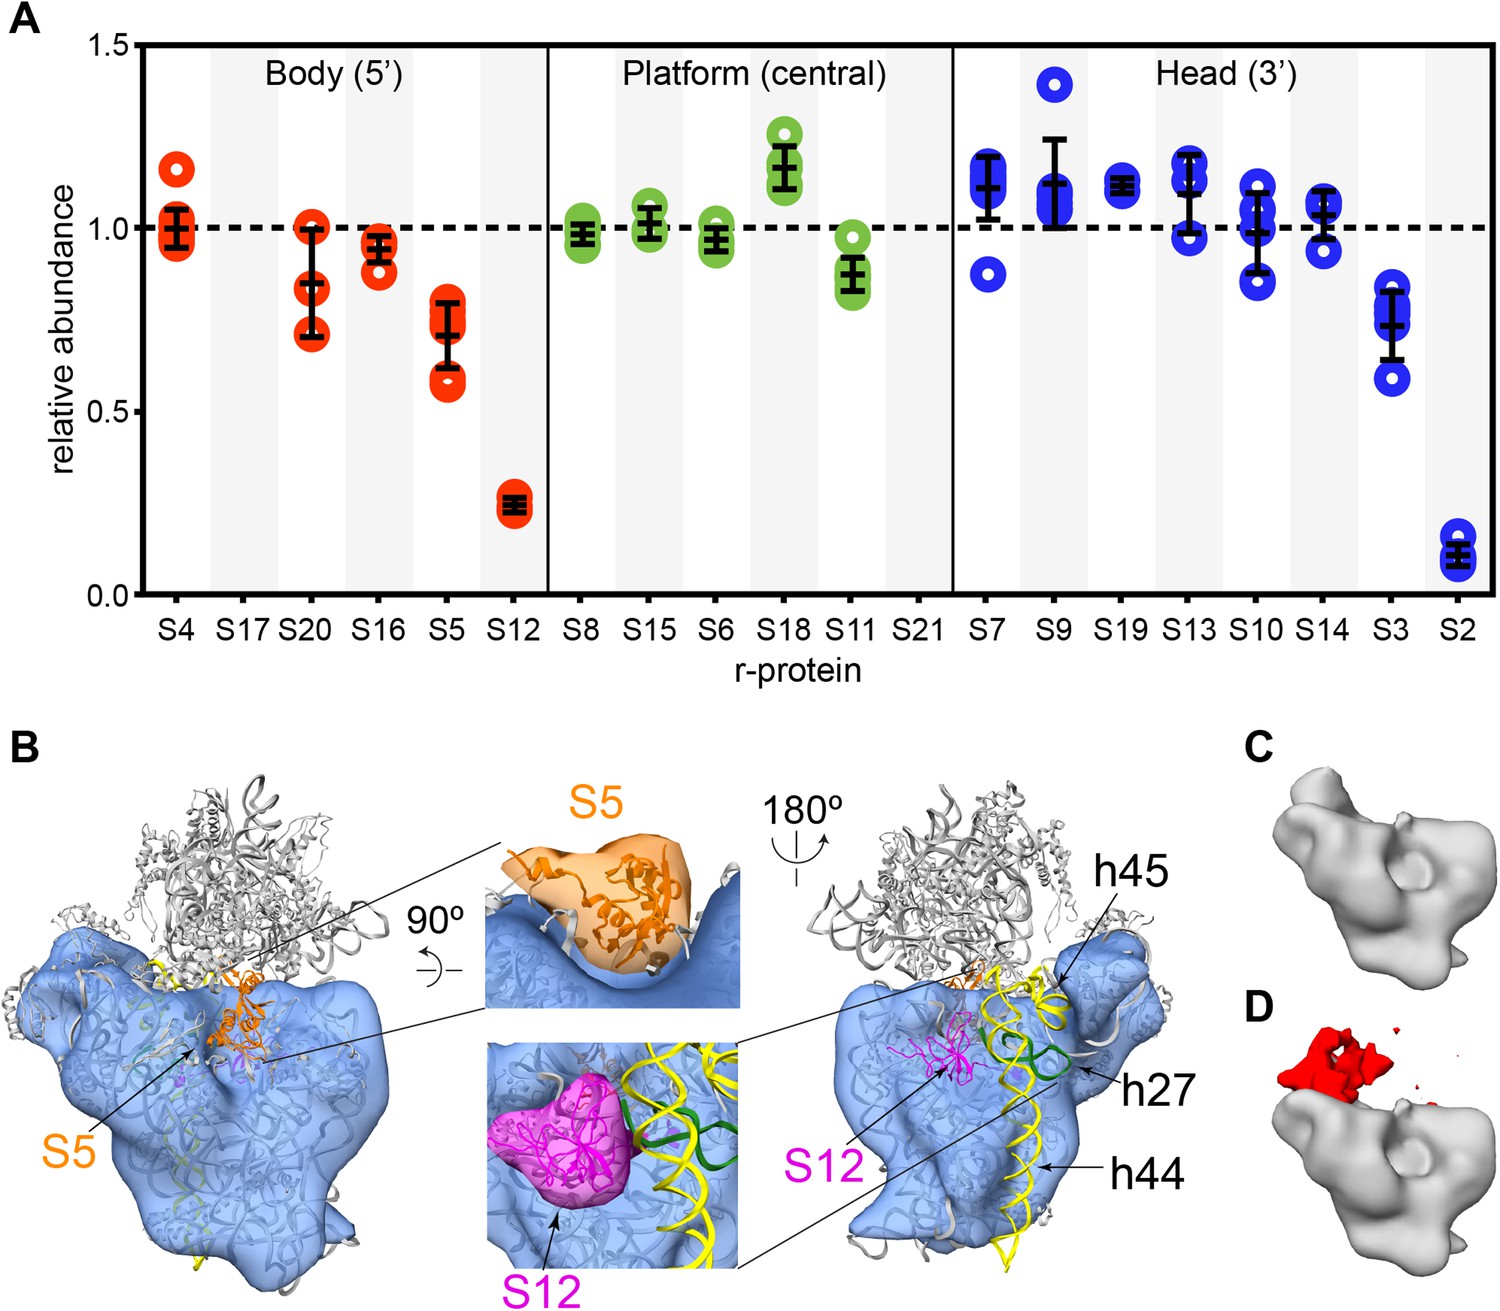
Cryo-EM and qMS analysis of affinity purified pre-central PK intermediates.
(A) Relative abundance of 30S r-proteins grouped by domain bound (body-red, platform-green, head-blue). Relative abundance of each r-protein was normalized to that of S4. No peptides were detected for S17 and S21. (B) Representative cryo-EM structure of Group I intermediate. All 3′-domain density is missing, beginning with h27 (green) and continuing through the head and the 3′-minor domain (h44 and h45, yellow). Close-ups of missing body domain r-proteins S5 (orange) and S12 (magenta) are shown at center. The PDB chains for S5 and S12 were filtered to 20 Å, and the resulting maps are located outside of the cryo-EM density. (C and D) Codimensional PCA variance analysis for Group I cryo-EM particles. (C) The average density for all 12,425 Group I cryo-EM particles. (D) Variance map for Group I cryo-EM particles (red) overlaid on average map (gray). Regions of high variance are mainly localized in the platform domain.
Figure 6—figure supplement 1
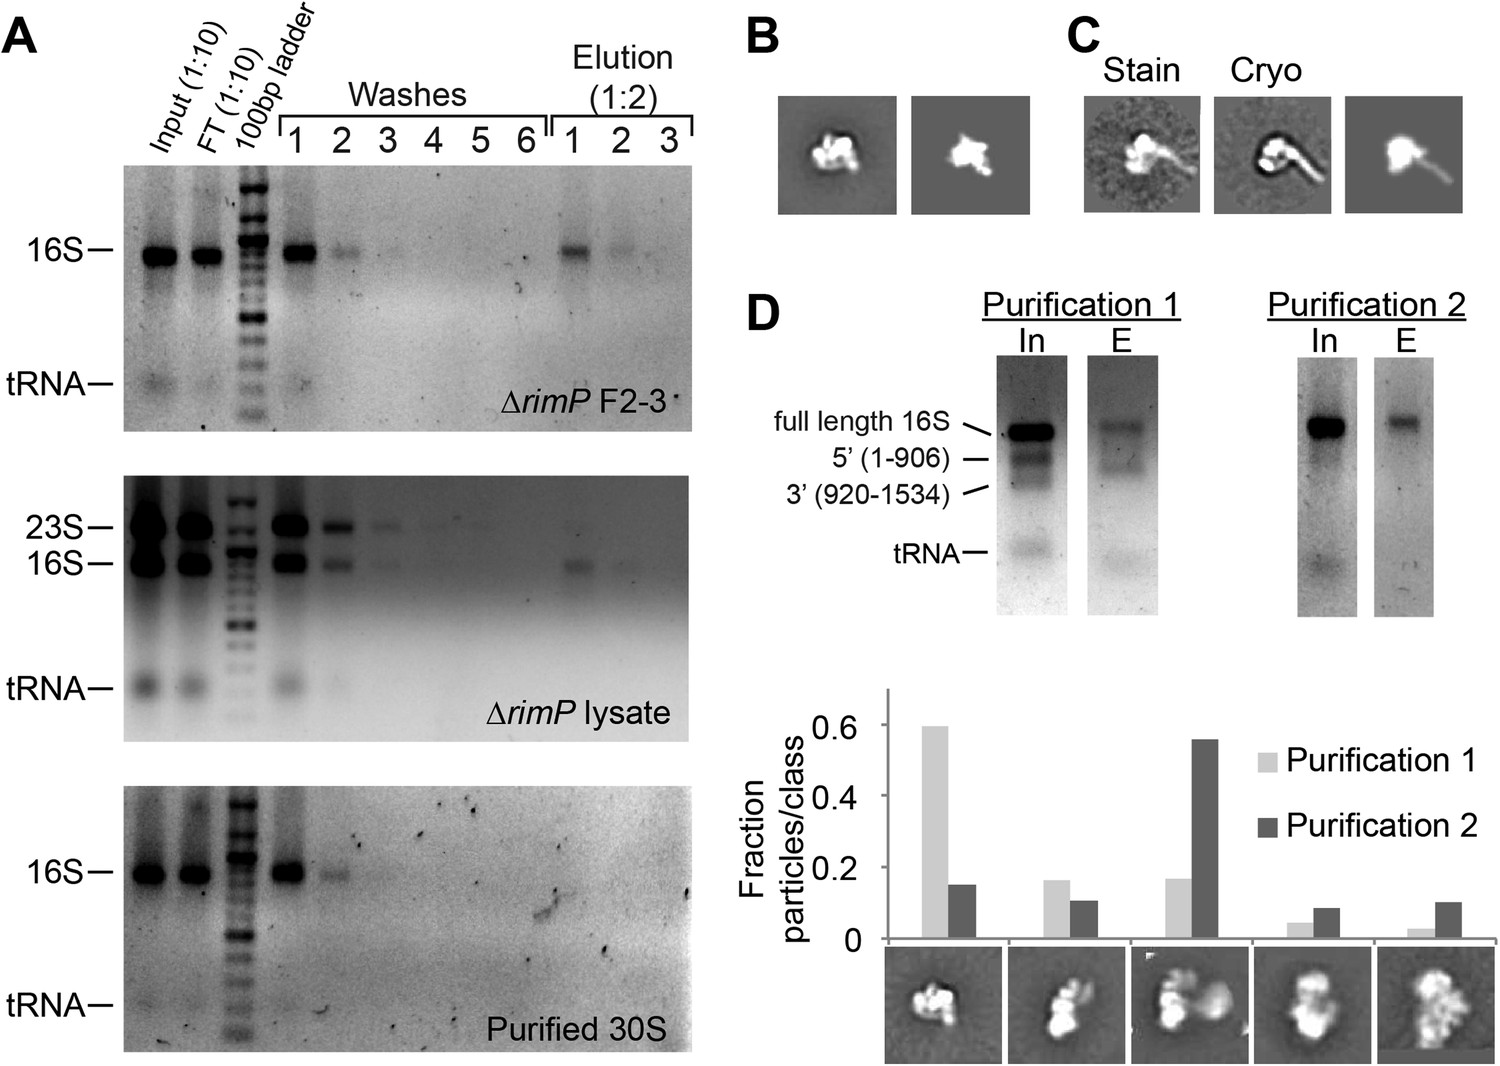
Affinity purification of pre-central PK intermediates using an anti-PK capture oligo.
(A) Agarose gels (stained with ethidium bromide) showing results for affinity purification for ΔrimP sucrose gradient fractions 2–3, ΔrimP lysate, and purified 30S subunits. 16S rRNA is not visible in later washes, but is visible in elution fractions for ΔrimP samples. (B) Class average of 3′-domain degradation product versus a forward projection of the 3′-domain filtered to 30 Å resolution. (C) Class averages from negative stain and cryoEM data sets with helix 44 density clearly visible, compared with a similar forward projection of the 3′-domain model. (D) Comparison of particle distribution between two affinity purification samples. In sample 1, the input 16S rRNA was already heavily degraded, and the 3′-domain was preferentially enriched based on agarose gel analysis. In sample 2, degradation was limited by the addition of RNasin (Promega) and reducing the amount of time for sample preparation. 5000 particles from negative stain data sets for each sample were combined into a single stack (10,000 particles), and subjected to reference-free maximum likelihood classification. The fraction of particles from each data set contributing to various conformations is plotted in the histogram. Putative 3′-domain classes are enriched in the degraded sample 1, while Group II classes are enriched in the intact sample 2.
Figure 6—figure supplement 2
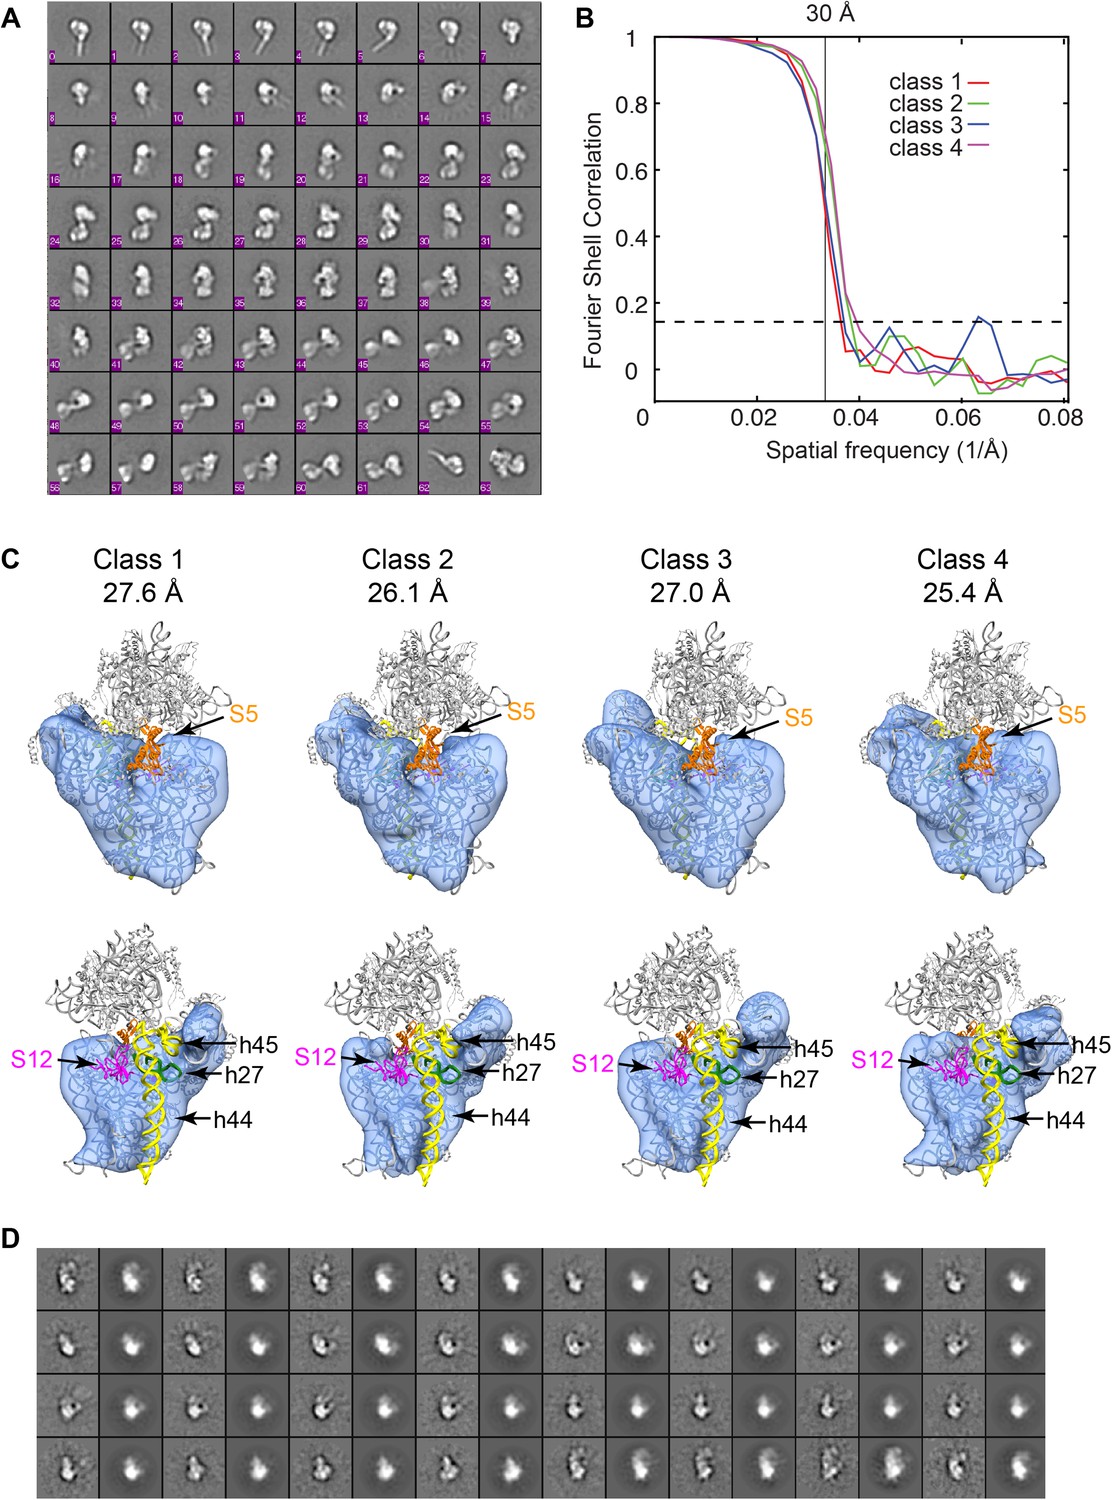
3D classification of Group I particles from cryo-EM data set of affinity-purified sample.
(A) Reference-free class averages for all cryo-EM particles. Despite improvement of heterogeneity, several species are present including 3′-domain degradation products (for example, classes 0–5). (B) Fourier shell correlation curves for the four Frealign 9 classes. Resolutions are reported in (C). The values are based on the 0.143 cutoff criterion. (C) Comparison of four structures obtained from classification using Frealign 9, as in Figure 6B of the main text. The resolution of each structure is reported below the class number. In the bottom row, the structures are rotated by 180°. Differences are observed in the platform region, suggesting that protein content and rRNA structure may vary in this region. All structures lack density for S5 (orange) and S12 (magenta) and all rRNA residues starting with h27 (green) and including h44-45 (yellow). (D) Comparison of reference-free class averages (odd columns) with re-projections (even columns) of Class 4 model from (C).
Figure 7

A model for 3′-domain formation during in vivo 30S biogenesis.
Co-transcriptional folding and binding of 5′-body (red) and central domain (green) r-proteins results in the formation and accumulation of Group I intermediates. The 3′-head domain (blue) can fold and r-proteins, including both primary and secondary binders, can bind prior to or following formation of the central PK, resulting in the accumulation of Group II and Group III intermediates, respectively. In the absence of RimP, the central PK is destabilized and the flux of 30S intermediates flows mainly through the Group II pathway, in which the 3′ domain is nearly fully formed prior to formation of the central PK. These intermediates are on pathway and eventually all remaining r-proteins, including S5 and S12, are incorporated into the mature 30S subunit.
Videos
Video 1
Analysis of Group III head density movement using Maskiton.
A total of 3490 Group III particles were aligned to a reference image using SPIDER (Frank et al., 1996). The aligned stack was uploaded to the Maskiton server (www.maskiton.scripps.edu, [Yoshioka et al., 2013]), and the Maskiton web interface was used to apply a mask to the head region of the averaged stack. Classifications of the masked region were run for 1000 iterations. The resulting 16 class average images were compiled into a movie using QuickTime Pro 7 (Apple).
Video 2
Analysis of Group II head density movement using Maskiton.
Movie was generated as described for Video 1, using a total of 3660 Group II particles.
Additional files
-
Supplemental file 1
- https://doi.org/10.7554/eLife.04491.019
Download links
A two-part list of links to download the article, or parts of the article, in various formats.
Downloads (link to download the article as PDF)
Open citations (links to open the citations from this article in various online reference manager services)
Cite this article (links to download the citations from this article in formats compatible with various reference manager tools)
A combined quantitative mass spectrometry and electron microscopy analysis of ribosomal 30S subunit assembly in E. coli
eLife 3:e04491.
https://doi.org/10.7554/eLife.04491


