Dynamic F-actin movement is essential for fertilization in Arabidopsis thaliana
- National University of Singapore, Singapore
- Nagoya University, Japan
- Nagoya University Graduate School of Science, Japan
Figures
Figure 1
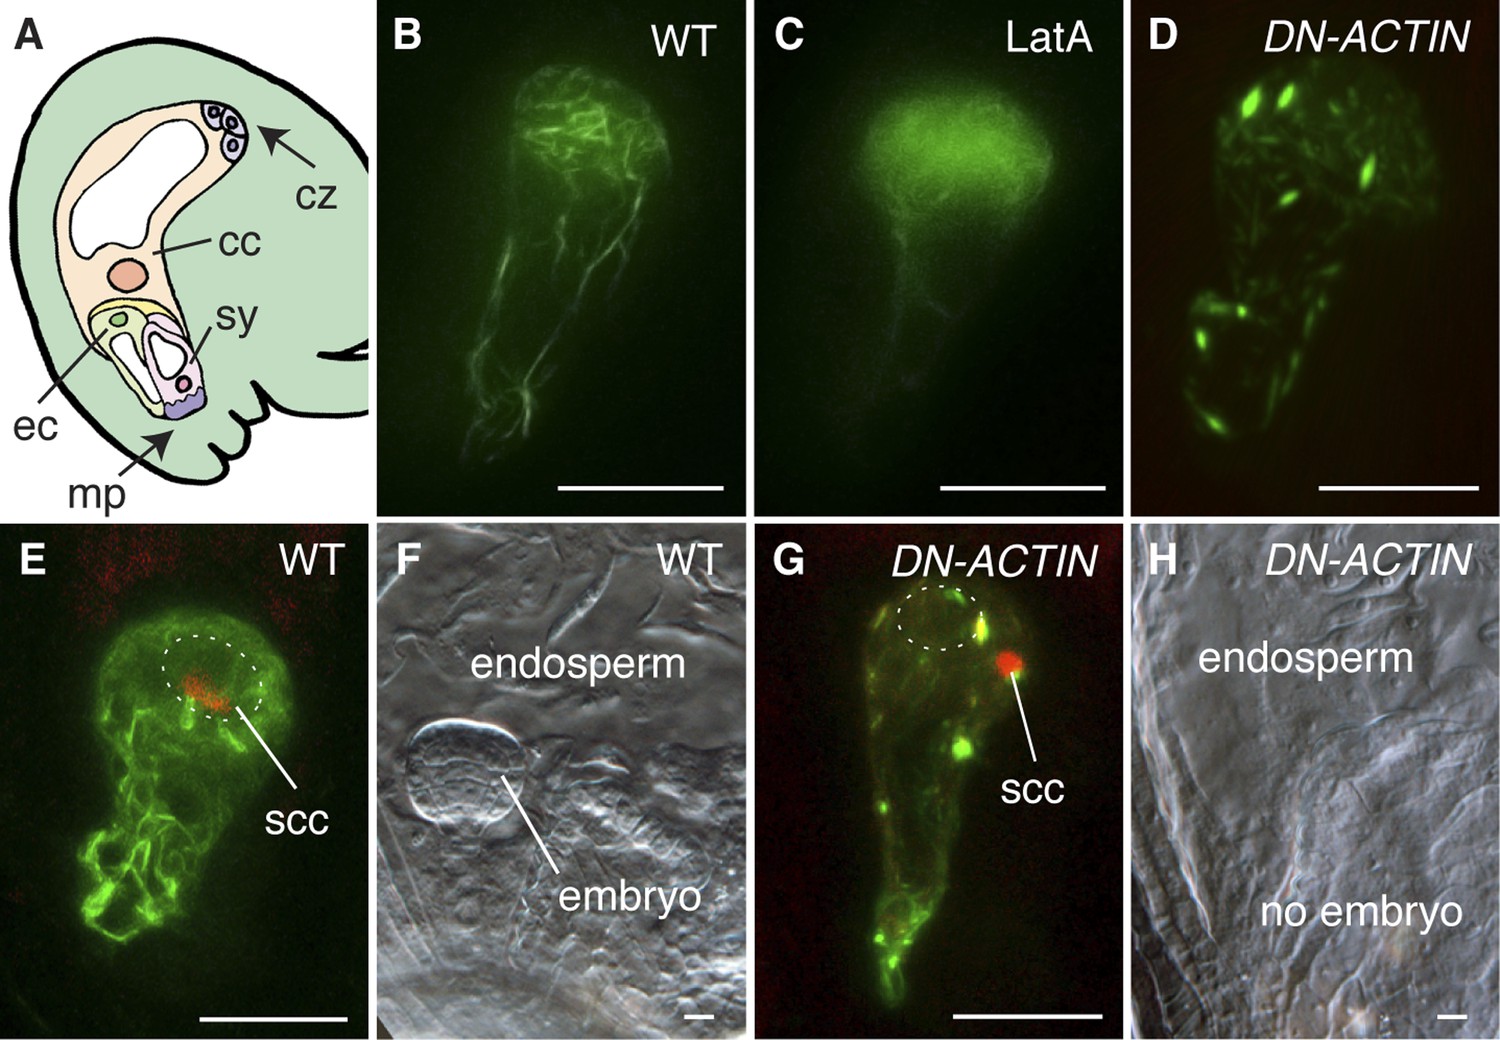
F-actin is required for egg cell fertilization.
(A) Cartoon of Arabidopsis mature ovule. cc, central cell; cz, chalaza; ec, egg cell; mp, micropyle; sy, synergid. (B–D) Egg cell actin cables (B) become disassembled in LatA treatment (C) and in DN-ACTIN (D). (E and F) Successful fertilization marked by decondensation of the sperm cell chromatin (ssc, red) into the egg cell nucleus (dashed oval) (E), resulting in a normal embryo in WT (F). (G and H) Egg cell expressing DN-ACTIN shows arrests in sperm cell nuclear migration (G) and embryo development (H). Scale bar = 10 µm.
Figure 2 with 2 supplements
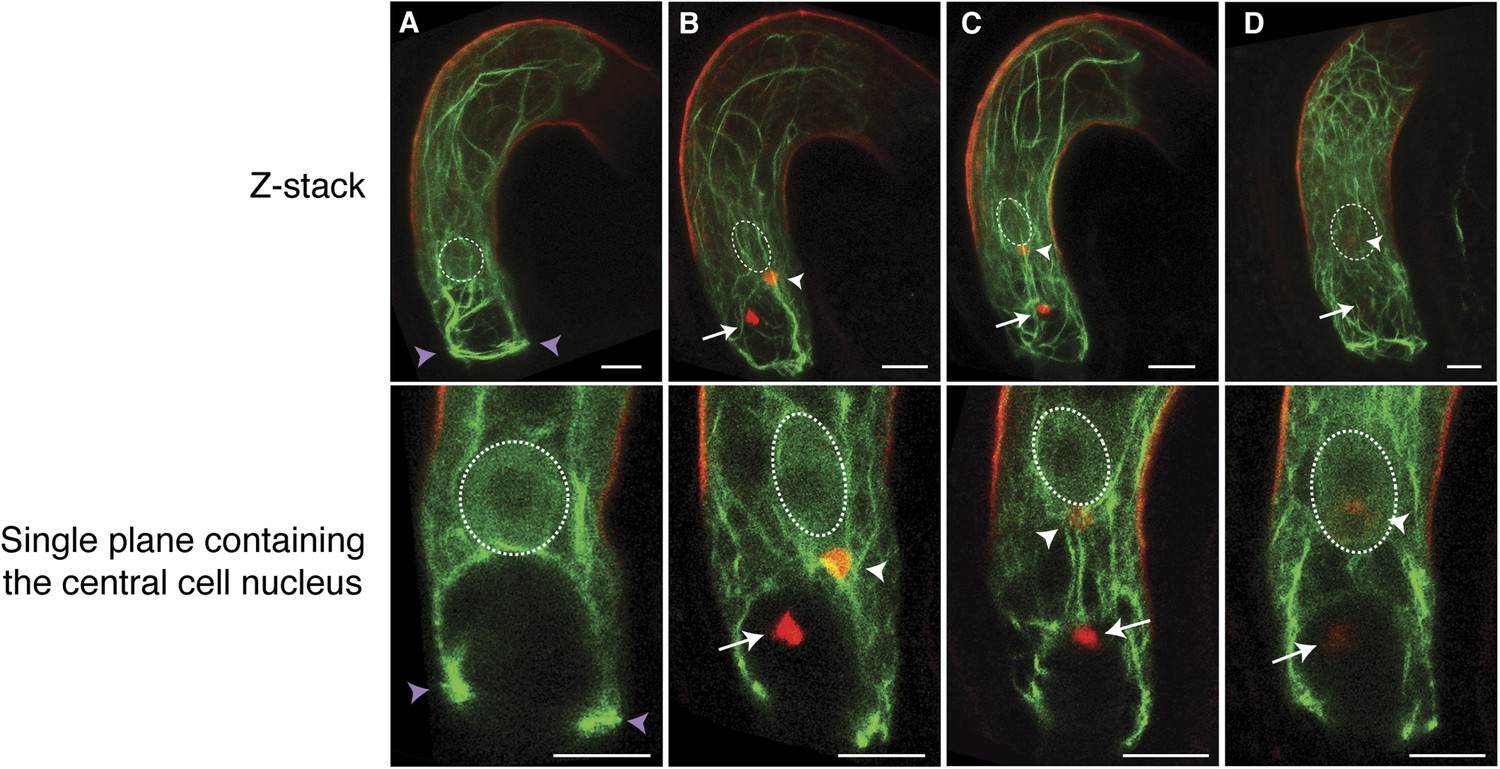
F-actin in the central cell associates with the sperm cell nucleus during migration.
(A–D) Z-Stacked (top) and single plane (bottom) images of F-actin in the WT central cell during fertilization. The central cell F-actin before fertilization (A), at the onset (B), and completion (C) of nuclear migration, and karyogamy (D) were shown. White arrows and arrowheads point to sperm chromatins in the egg and central cells, respectively. White-dashed ovals display the position of the central cell nucleus. Purple arrowheads point to the F-actin ring structure present at the micropylar end of the central cell. Scale bar = 10 µm.
Figure 2—figure supplement 1

Unique F-actin structures in the mature central cell before fertilization.
F-actin structures of a ring-shaped network at the micropylar end of the central cell (purple), long cables at the periphery of the central cell and extending from the chalazal region to the boundary with the egg cell (cyan), and tracks running from the micropylar actin ring to the central cell nucleus (red) are marked on the duplicated image on the right. White-dashed oval displays the position of the central cell nucleus. Scale bar = 10 µm.
Figure 2—figure supplement 2
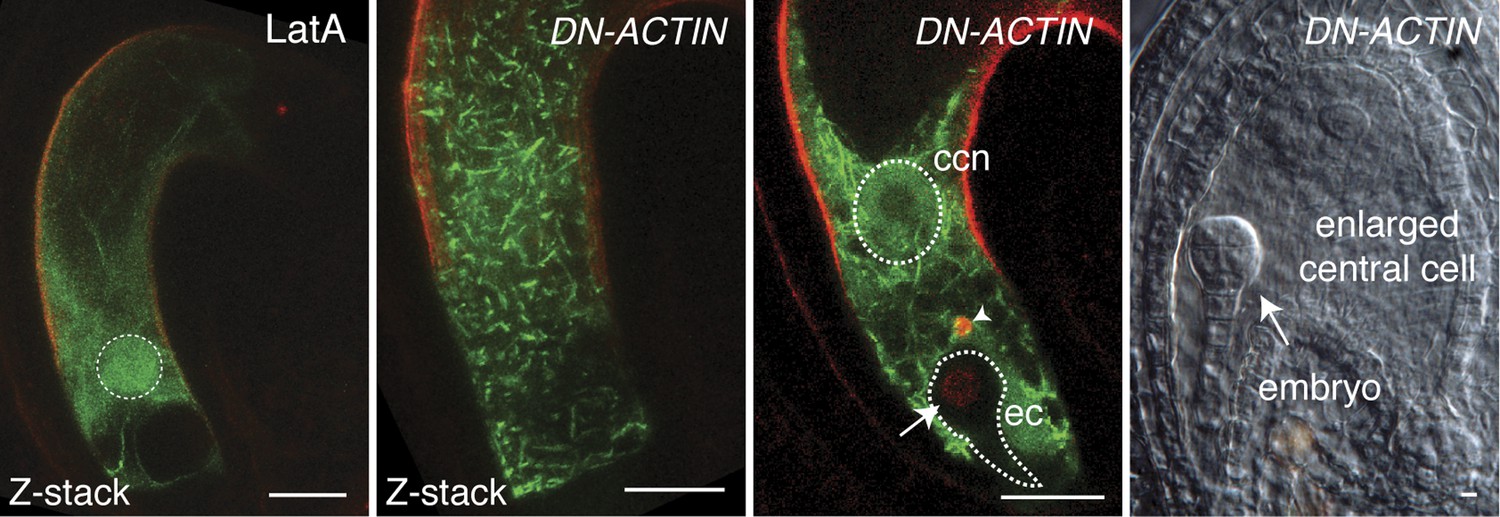
Effects of LatA and DN-ACTIN on F-actin and fertilization in the central cell.
Unlike LatA treatment, DN-ACTIN generates short fragmented F-actin cables and aggregates. Sperm cell nuclear migration becomes disrupted in the central cell (arrow head), whereas sperm chromatin already becomes decondensed in the egg nucleus (arrow), the sign of successful fertilization. As a result, no endosperm development is initiated, although the central cell becomes enlarged. ccn, central cell nucleus; ec, egg cell. Scale bar = 10 µm.
Figure 3
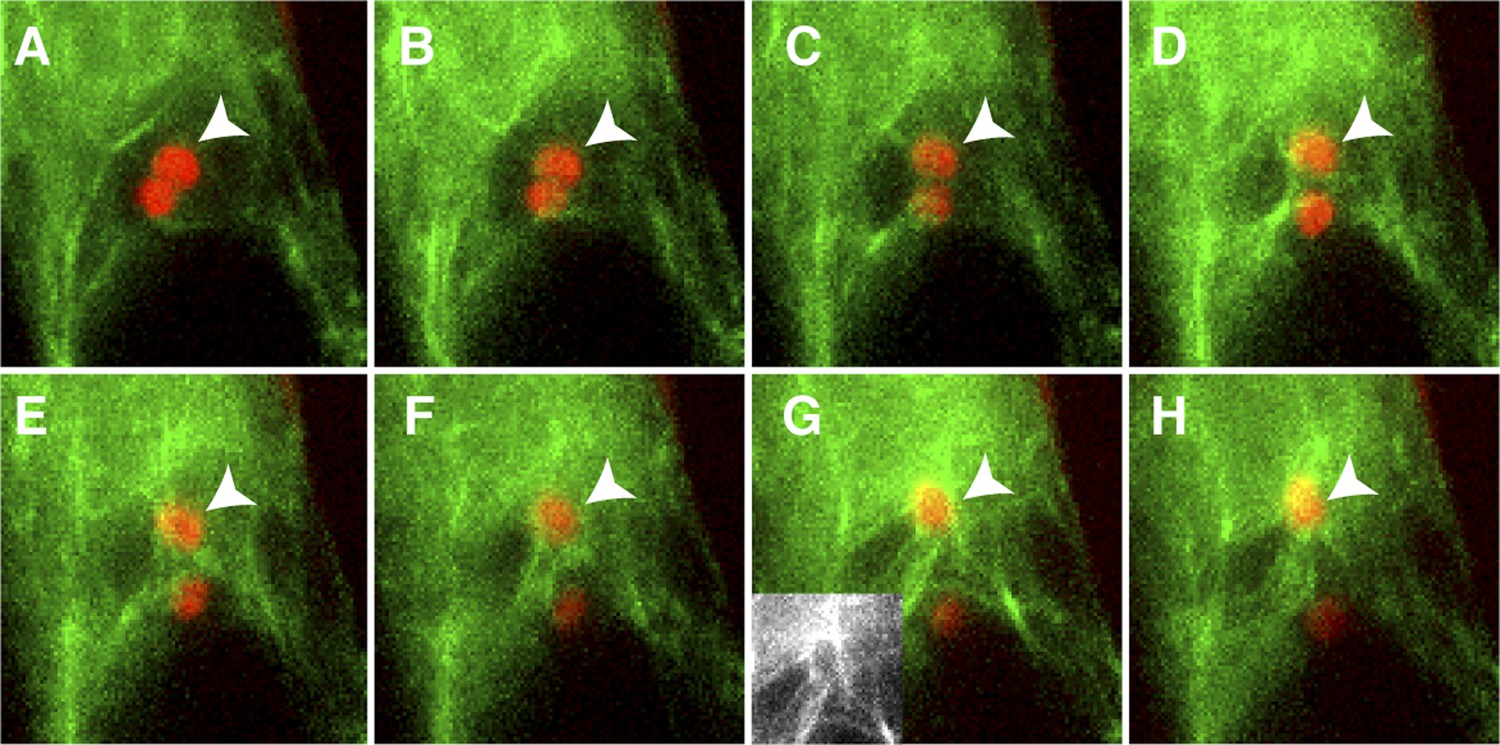
Actin cables generate an aster-like structure around the sperm cell nucleus during migration in the central cell.
(A–H) 1-min interval time-lapse image montage during sperm cell nuclear migration. After gamete fusion, the sperm cell nuclei (red ovals) start moving towards opposite directions (A–C). In the central cell, actin cables (green) become associated with the sperm cell nucleus (arrowhead) after its entry (D and E) and assemble an aster-like structure around the sperm cell nucleus (F–H). Inlet in panel G shows actin cables (white) around the sperm cell nucleus in the central cell without sperm chromatin fluorescence. See also Video 1.
Figure 4
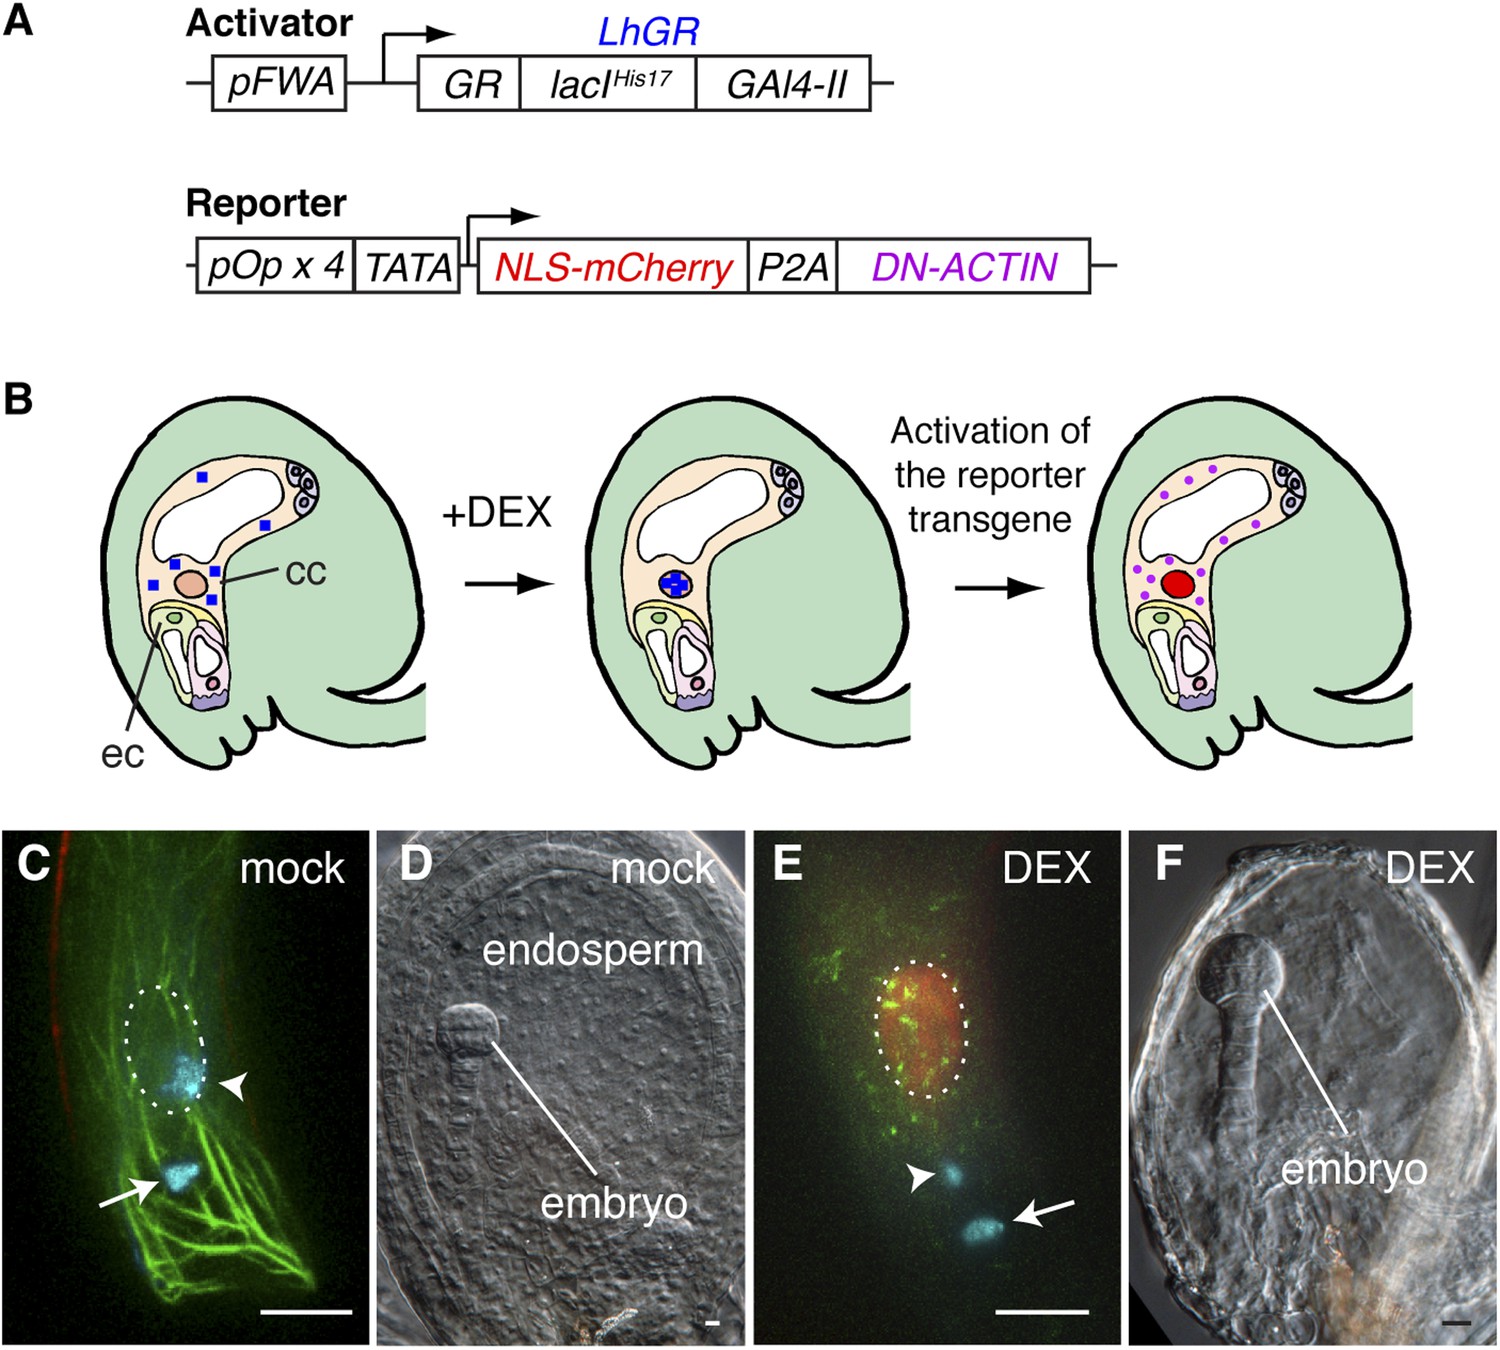
Spatio-temporal control of F-actin disruption demonstrates importance of F-actin for fertilization.
(A) Schematic representations of the transcription activator (top) and reporter (bottom) constructs of DEX inducible expression strategy. The transcription activator LhGR is placed under the control of the FWA promoter. The reporter construct consists of NLS-mCherry and DN-ACTIN genes, connected by a self-cleaving 2A peptide derived from porcine teschovirus-1 (P2A), flanked by the four lac operators with the CaMV 35S minimal promoter (TATA). (B) Schematic representations of DN-ACTIN induction in the mature central cell by DEX. When DEX is applied, LhGR (blue square) localizes to the central cell nucleus. As a result, the reporter transgene becomes activated specifically in the central cell. During translation, the P2A peptide is recognized for the ribosomal skip, resulting in two separate proteins: NLS-mCherry and DN-ACTIN. NLS-mCherry proteins are transferred to the nucleus (red nucleus), and DN-ACTIN (purple ovals) functions in the same cell for F-actin disruption. cc, central cell; eg, egg cell. (C–F) DN-ACTIN induction in the mature central cell disrupts nuclear migration and endosperm development. Mock treatment showing sperm chromatin decondensation (cyan) in both the egg and central cells (C), leading to normal embryo and endosperm development (D). Central cell DN-ACTIN induction marks specifically the central cell nucleus (dashed oval) and causes F-actin disruption (E), preventing sperm cell nuclear migration (arrowhead) while karyogamy takes place in the egg cell (arrow), resulting in embryo but no endosperm development (F). Scale bar = 10 µm.
Figure 5 with 2 supplements
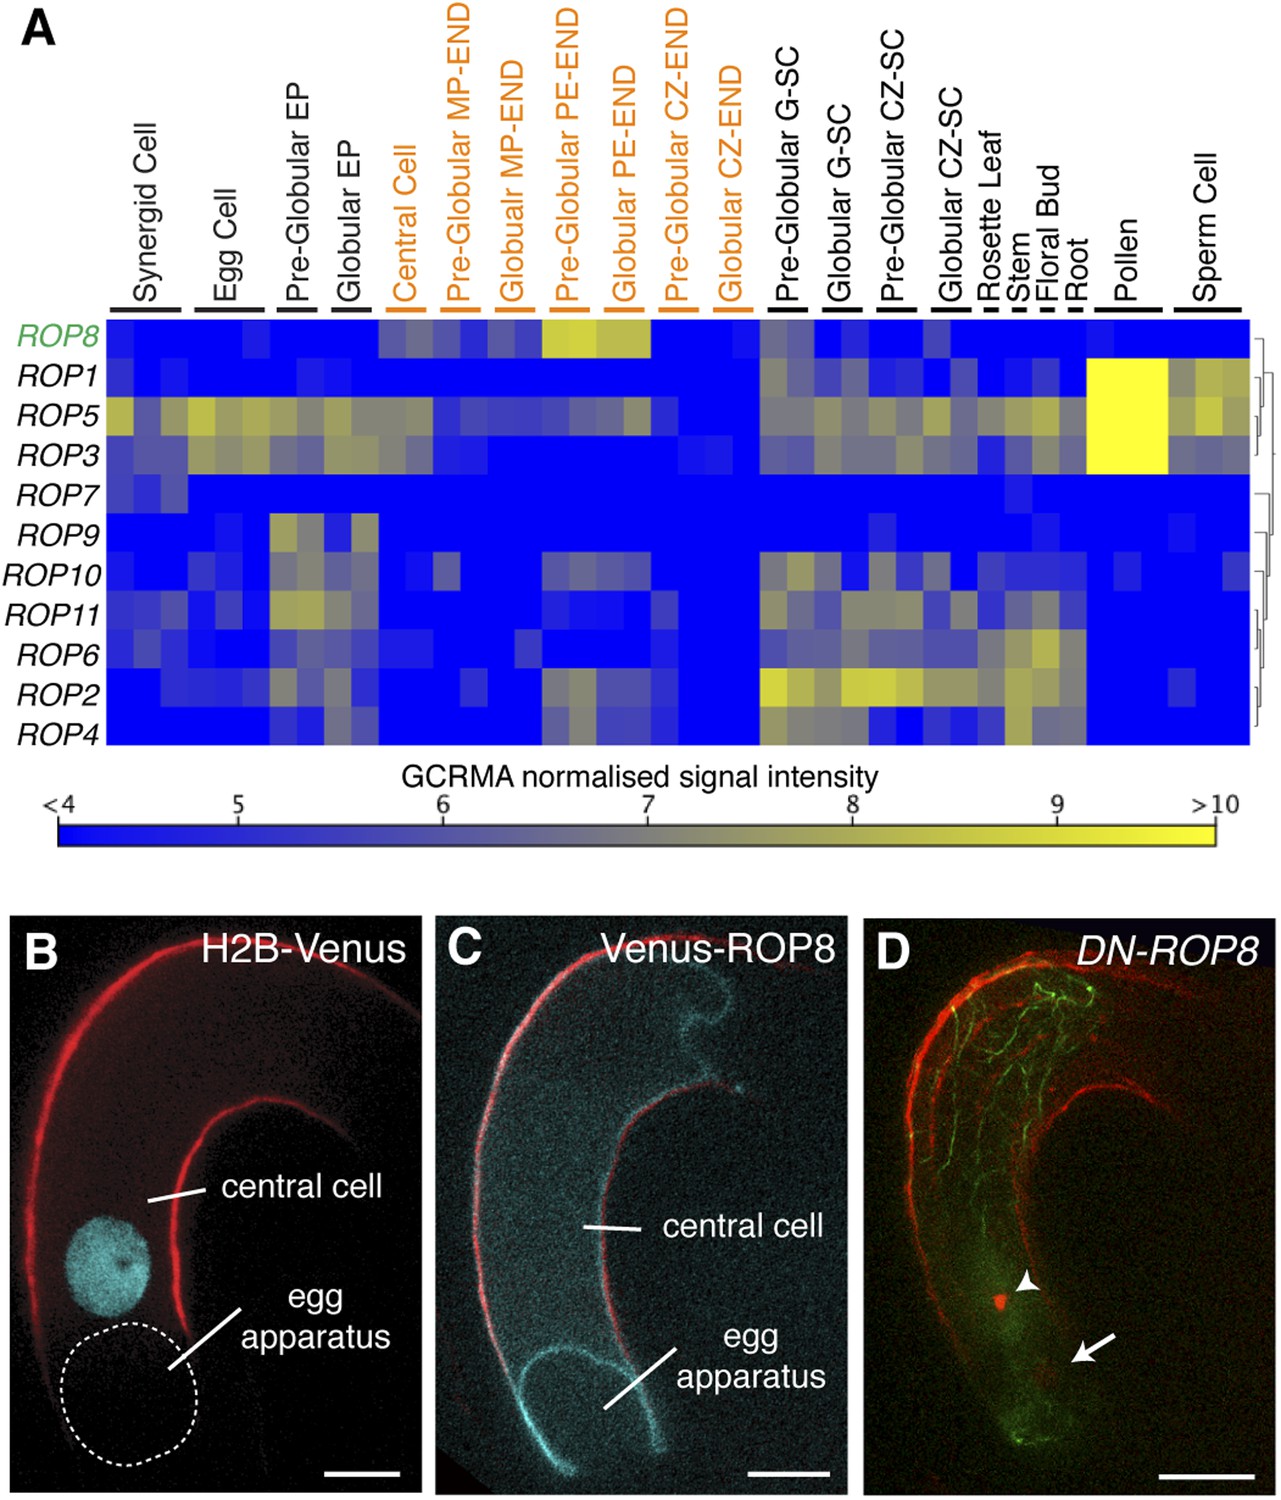
ROP8 is specific to the central cell and involved in fertilization.
(A) Arabidopsis ROP encoding genes expression heat map constructed from public data. CZ-END, chalazal endosperm; CZ-SC, chalazal seed coat; EP, embryo proper; G-SC, general seed coat; MP-END, micropylar endosperm; PE-END, peripheral endosperm. (B and C) H2B-Venus (B) and Venus-ROP8 (C) under the ROP8 promoter show expression specifically in the central cell and its association to the plasma membrane (cyan), respectively. Autofluorescence marks the central cell outline (red line). (D) DN-ROP8 shows central cell fertilization defect. Sperm chromatin in the egg cell (arrow) is already decondensed, but sperm chromatin remains condensed in the central cell (arrowhead). Scale bar = 10 µm.
Figure 5—figure supplement 1

Ectopic expression of ROP8 in the root also shows its association to the plasma membrane.
sGFP:ROP8 expression under the control of the CaMV35S promoter in root epidermal cells. BF, bright field. Scale bar = 10 µm.
Figure 5—figure supplement 2
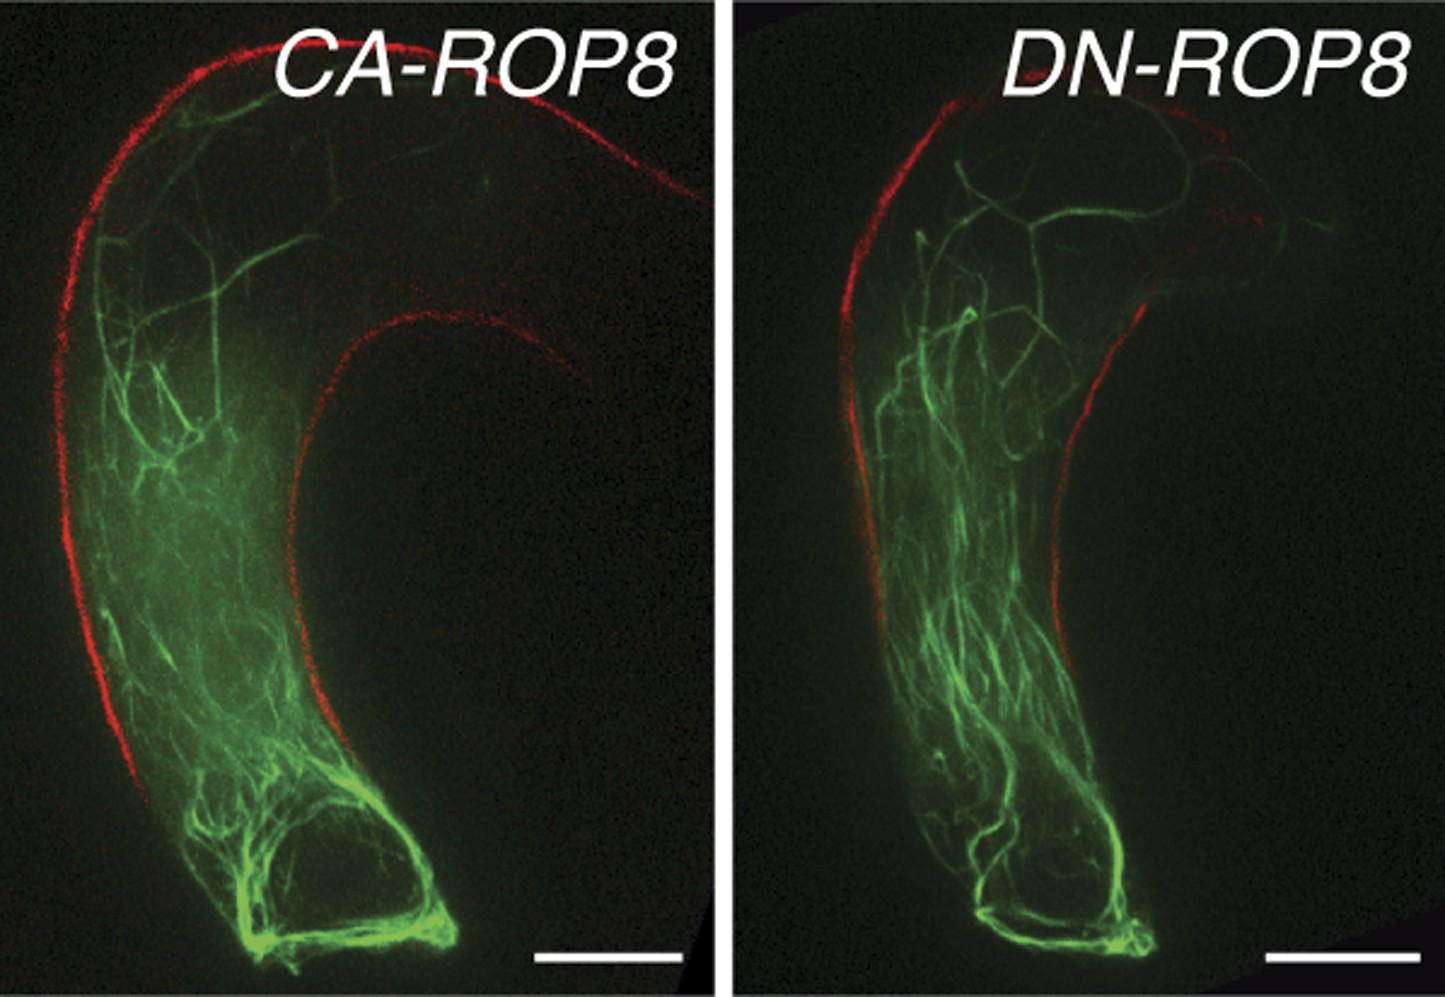
The expression of neither constitutively-active ROP8 (CA-ROP8) nor dominant-negative ROP8 (DN-ROP8) under the control of the ROP8 promoter affect the F-actin structure (green) in the central cell.
Autofluorescence marks the central cell outline (red line). Scale bar = 10 µm.
Figure 6

Controls of F-actin dynamics in the central cell.
(A) A scheme of the mature Arabidopsis ovule. F-actin (light green cables) velocities of the entire central cell and around the nucleus (dashed box) were analyzed. ccn, central cell nucleus; cz, chalaza; ec/sy, egg/synergid cells complex; mp, micropyle. (B) F-actin velocity around the central cell nucleus. Inward and outward represent F-actin movement direction towards and away from the nucleus, respectively. a.u., arbitral unit. (C) The representative probability distributions of velocities integrated over the entire central cell area and time. Solid lines represent the fitted gamma distribution. (D) The mean velocities of central cell F-actin movement. Error bars represent the standard deviation of five to seven biological replicates. n.s., not significant; ***, p < 0.001; **, p < 0.01, student t-test. (E) Stacks of central cell F-actin time-lapse. F-actin movements are marked by rainbow colors while white color results from overlapping multiple colors, indicating less movement. Scale bar = 10 µm.
Figure 7
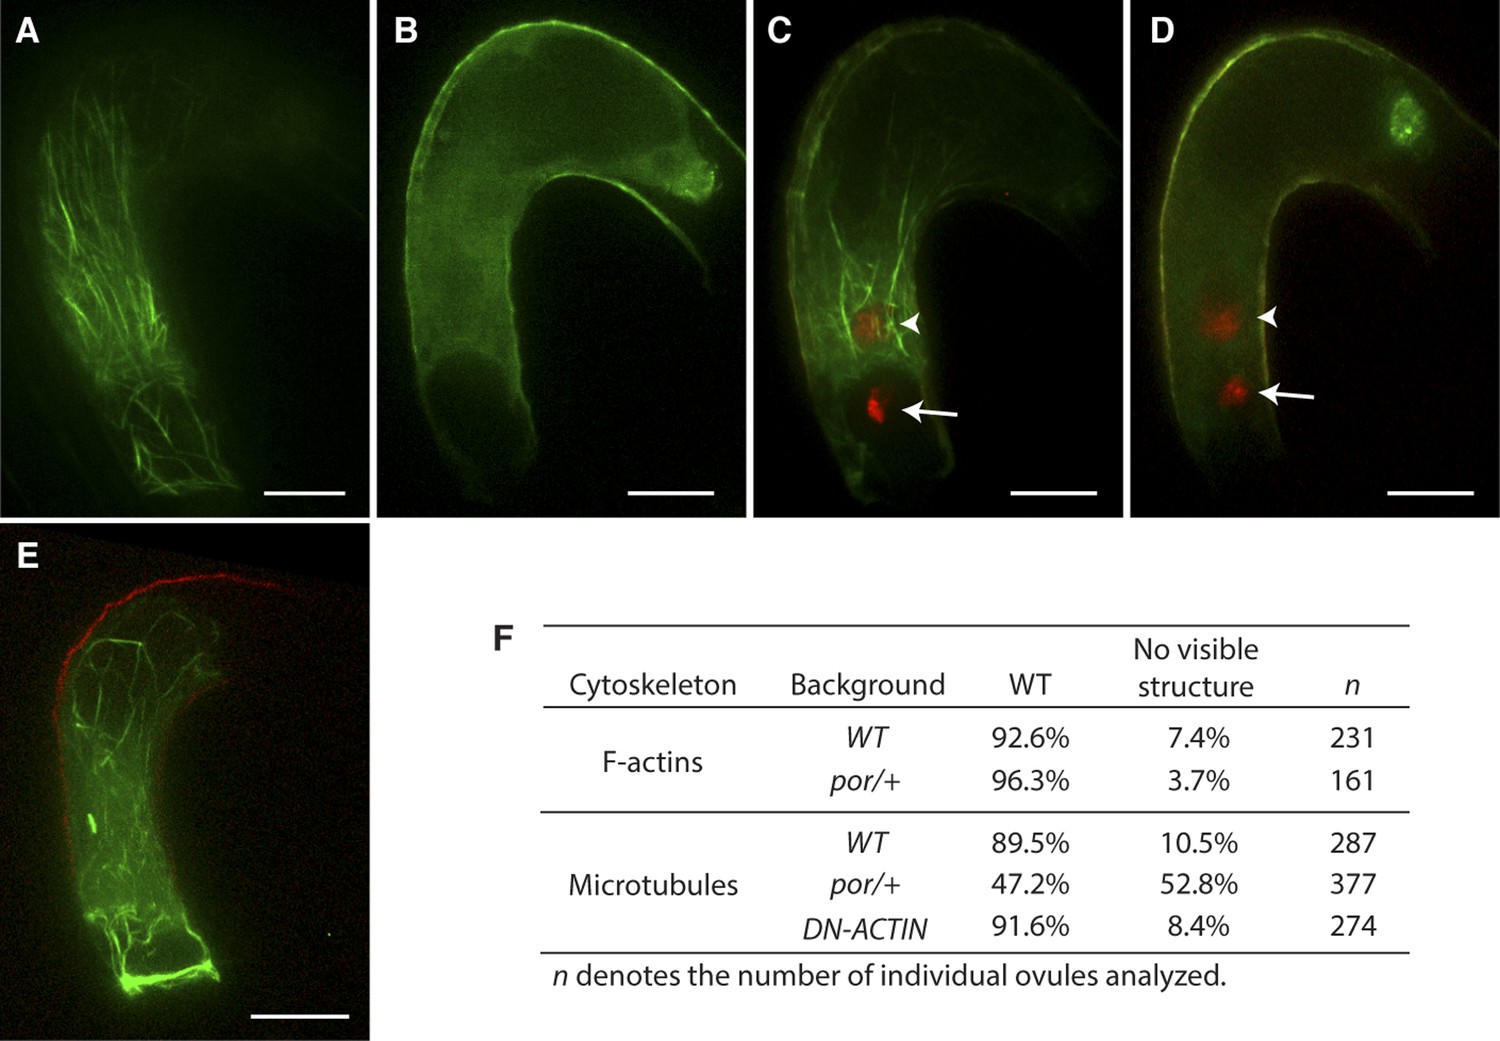
Effect of microtubule disruption on cytoskeleton in the central cell.
(A and B) Microtubule structures (green) in the mature WT (A) and the tubulin folding cofactors c (por)/+ heterozygous mutant (B) central cells marked by TagRFP-TUA5 under the control of the AGL80 promoter. (C and D) In por/+ plants, fertilization is successful in all ovules even though they do not display organized microtubules (D) like WT (C). Arrows and arrowheads point to the sperm cell chromatin (red), already decondensed in the egg cell and central cell nucleus, respectively. (E) F-actin in por/+ heterozygous mutant visualized by the Lifeact-Venus under the control of the FWA promoter. (F) Percentages of ovules that show cytoskeleton structures in the mature central cell of different genetic backgrounds. Scale bar = 10 µm.
Videos
Video 1
Time-lapse image of F-actin dynamics and sperm cell nuclear migration in the WT central cell.
Sperm cell chromatins (red ovals) are marked by pH3.10::H3.10-mRFP1 and F-actin in the central cell (green) is marked by pFWA::Lifeact-Venus. Autofluorescence marks the central cell outline (red line). Images were taken at 30 s intervals.
Video 2
Time-lapse image of F-actin micropylar ring-like structure in the central cell during fertilization.
Sperm cell chromatins (red ovals) are marked by pH3.10::H3.10-mRFP1 and F-actin in the central cell (green) is marked by pFWA::Lifeact-Venus. Arrowheads point the micropylar F-actin ring in the central cell. Autofluorescence marks the central cell outline (red line). Images were taken at 1-min intervals.
Video 3
Time-lapse image of F-actin dynamics in the mature WT central cell.
F-actin in the central cell (white) were marked by pFWA::Lifeact-Venus. Images were taken at 30-s intervals.
Video 4
Time-lapse image of F-actin dynamics in the mature CA-ROP8 central cell.
F-actin in the central cell (white) was marked by pFWA::Lifeact-Venus. Images were taken at 30-s intervals.
Video 5
Time-lapse image of F-actin dynamics in the mature DN-ROP8 central cell.
F-actin in the central cell (white) is marked by pFWA::Lifeact-Venus. Images were taken at 30-s intervals.
Video 6
Time-lapse images of F-actin dynamics in the mature WT central cell in the presence of the myosin inhibitor BDM (50 mM).
F-actin in the central cell (white) is marked by pFWA::Lifeact-Venus. Images were taken at 30-s intervals.
Video 7
Time-lapse images of F-actin dynamics in the mature WT central cell in the presence of the myosin inhibitor NEM (0.35 mM).
F-actin in the central cell (white) is marked by pFWA::Lifeact-Venus. Images were taken at 30-s intervals.
Additional files
-
Supplementary file 1
(A) The list of primer sequences used for construct generation. (B). The list of Gateway vector constructs generated in this work.
- https://doi.org/10.7554/eLife.04501.021
Download links
A two-part list of links to download the article, or parts of the article, in various formats.
Downloads (link to download the article as PDF)
Open citations (links to open the citations from this article in various online reference manager services)
Cite this article (links to download the citations from this article in formats compatible with various reference manager tools)
Dynamic F-actin movement is essential for fertilization in Arabidopsis thaliana
eLife 3:e04501.
https://doi.org/10.7554/eLife.04501


