Enhanced stability and polyadenylation of select mRNAs support rapid thermogenesis in the brown fat of a hibernator
- University of Colorado School of Medicine, United States
- Colorado School of Mines, United States
- HudsonAlpha Institute for Biotechnology, United States
Figures
Figure 1

The hibernating phenotype as a model for studying BAT metabolic regulation.
(A) Schematic depicting the metabolic suppression and activation cycle of BAT during the highly recruited, winter hibernation phase (blue shading) of the annual cycle. Cartoon squirrels represent general phenotypic changes among annual and torpor–arousal cycles (Hindle and Martin, 2014). (B) Relationship of sample groups to body temperature over time. Blue highlighting on months indicates hibernation.
Figure 2 with 1 supplement
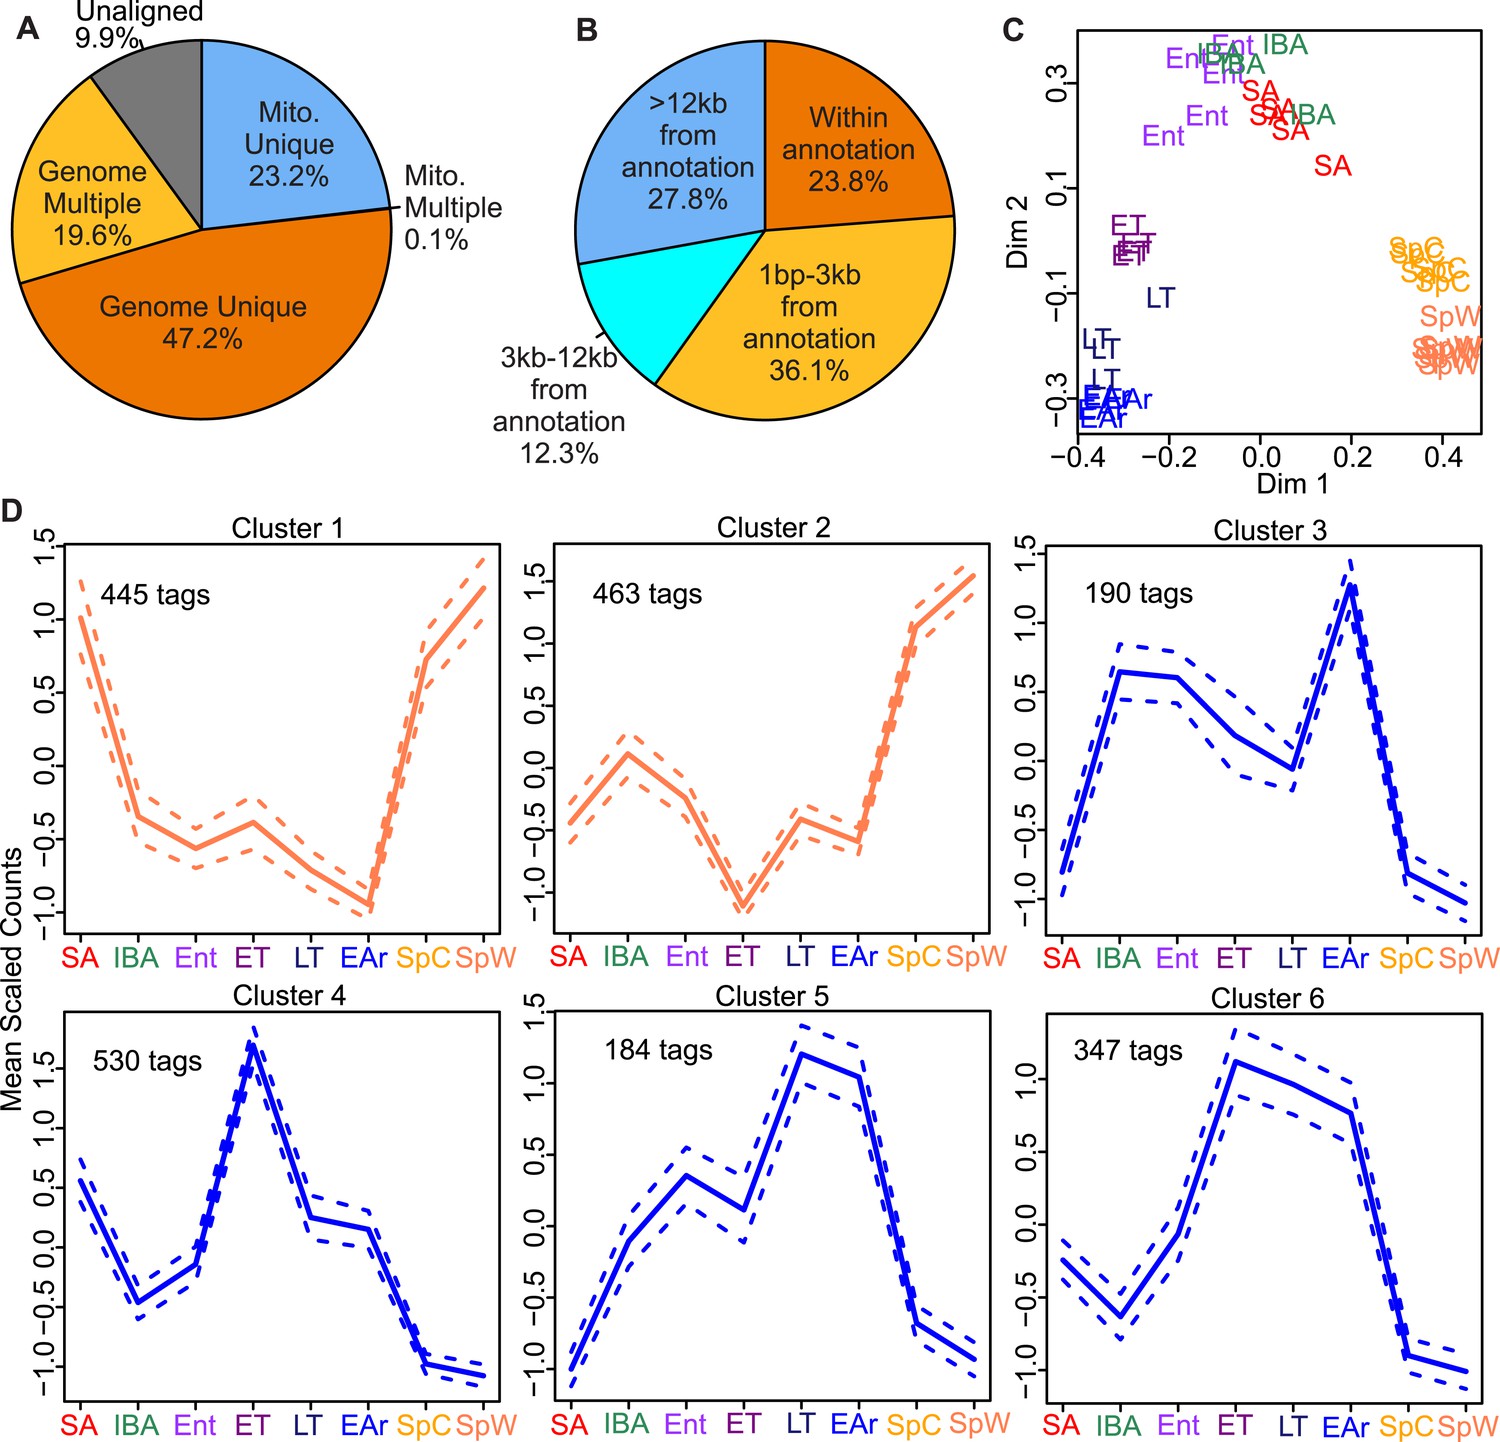
EDGE-tag library properties.
Pie charts of EDGE tags mapped: (A) uniquely to 13-lined ground squirrel nuclear (Genome Unique) or mitochondrial (Mito. Unique) DNA; multiple locations (Genome or Mito. Multiple); or unmapped (Unaligned); or (B) the indicated distances from the nearest annotated Ensembl feature (either overlapping or 3′ to the feature in kilobases). (C) Two-dimensional scaling plot showing Random Forests (RF) clustering of individual samples labeled by group symbol: spring warm (SpW), spring cold (SpC), summer active (SA), interbout aroused (IBA), entrance (Ent), early torpor (ET), late torpor (LT), and early arousal (EAr), as depicted in Figure 1. (D) Line plots of EDGE-tag expression patterns for all 2,159 significant differentially expressed tags; mean scaled counts, solid line, ±SEM, dotted line. Total tags in each cluster are indicated.
Figure 2—figure supplement 1
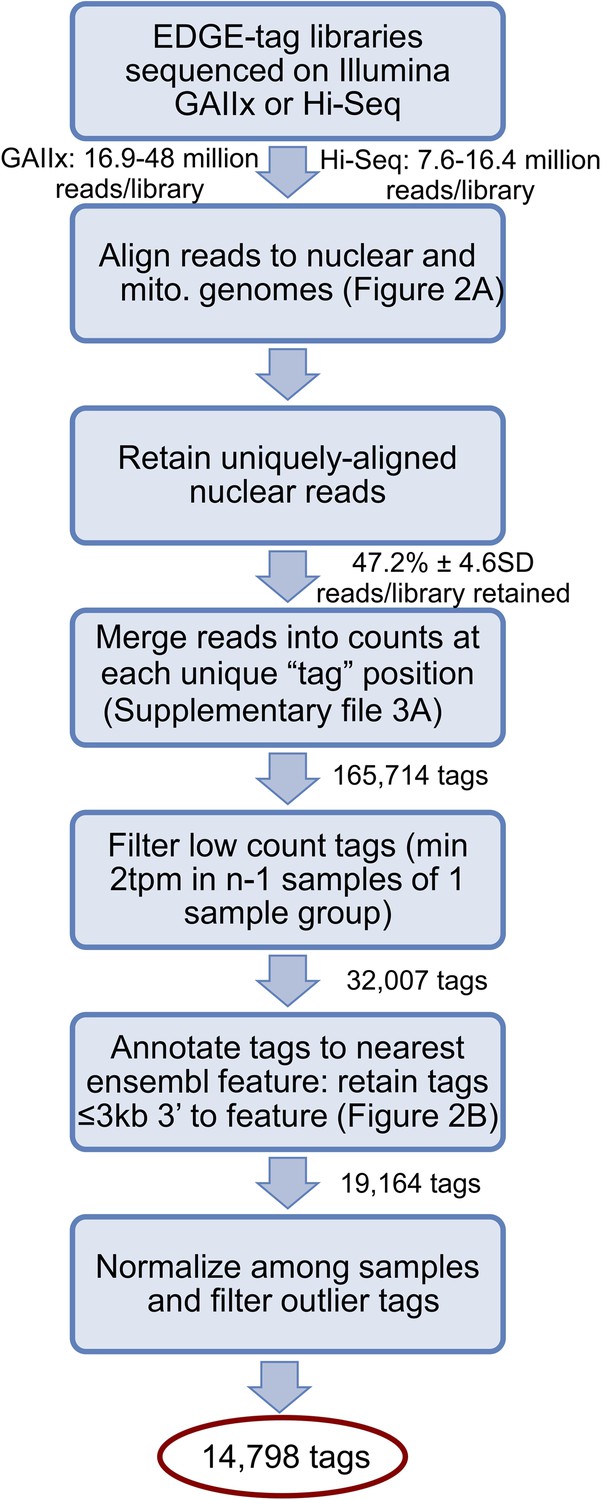
Schematic illustrates library sequencing, read processing, tag annotation, and filtering after the creation of the EDGE-tag transcriptome libraries (see ‘Materials and methods’).
Sequential actions are listed in each box, while the number of resulting reads/EDGE-tags are labeled between boxes. tpm = ‘Tags per million’.
Figure 3

Increased RPPH1 abundance is explained by the addition of a poly(A) tail.
(A) Box plot of normalized tag counts for RPPH1 by state, triangle marks the mean. (B) Gel showing RPPH1 RT-PCR products from 3′ RACE (3′ R, lanes 1 and 3) and random hexamer (RH, lanes 2 and 4) primed cDNA from early arousal (EAr; lanes 1–2) and spring warm (SpW; lanes 3–4) total RNA. Marker sizes are indicated on the left (50-bp ladder, lane M). (C) Multiple alignment of the RPPH1 genomic DNA and four 3′ end cDNA sequences from cloned 3′ RACE (EAr) products in B: uppercase, annotated RPPH1 RNA; lowercase, genomic DNA; underline, non-templated nucleotides.
Figure 4 with 4 supplements
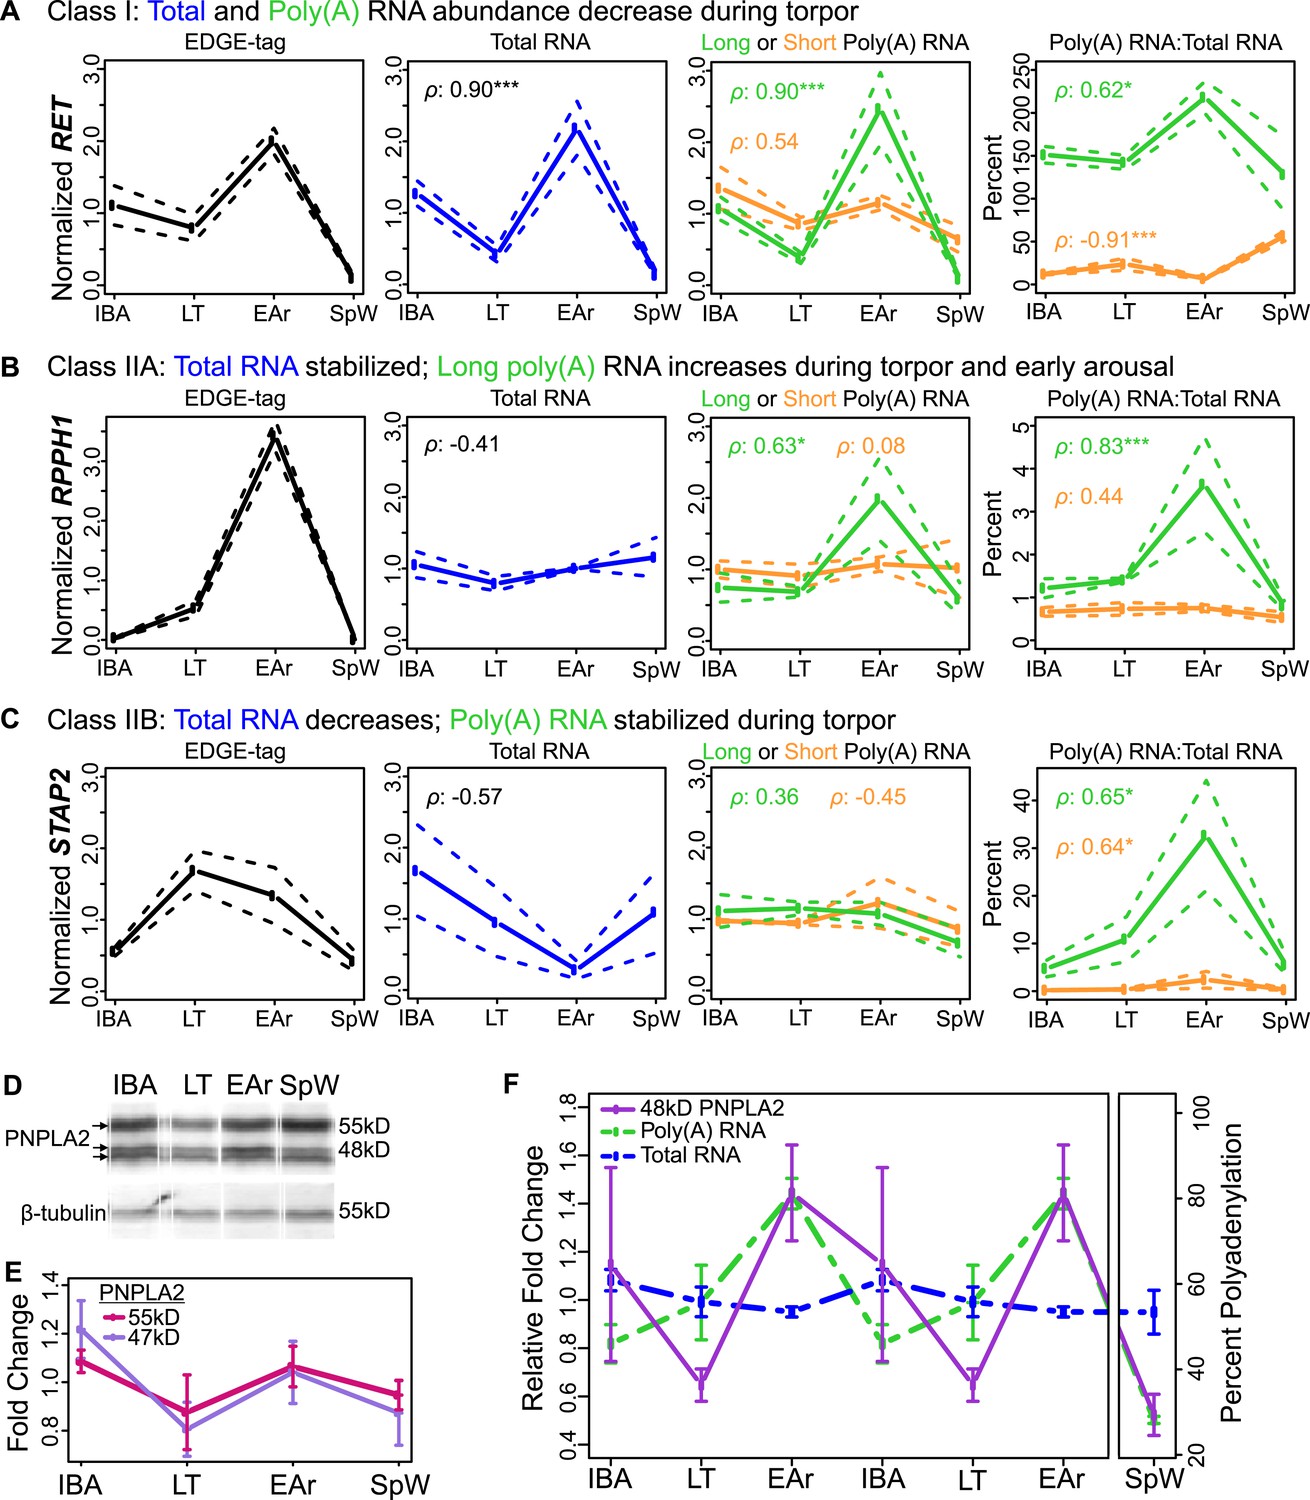
Bulk RNA degradation with stabilization of selected transcripts and cycles of re-adenylation at low body temperature.
(A) Class I, represented by RET proto-oncogene. Relative expression levels (solid line; ±SEM, dotted line; y-axis) of EDGE-tag counts (far left), total RNA (middle-left), poly(A) RNA (green = long poly(A) RNA; orange = short poly(A) RNA; middle-right), and percent recovery (y-axis) of poly(A) RNA relative to total RNA (far right) among physiological states: interbout aroused (IBA), late torpor (LT), early arousal (EAr), and spring warm (SpW). Spearman correlations (ρ) to EDGE-tag expression labeled in three right boxes; *p ≤ 0.05, **p ≤ 0.01, ***p ≤ 0.005. (B–C) Labeling is as in panel A. (B) Class IIA, represented by RPPH1. (C) Class IIB, represented by STAP2. (D) Western blot reveals three isoforms of the PNPLA2 protein (left arrows) among indicated (top) sample states; marker sizes are denoted on right, β-tubulin, below, served as a loading control. (E) Relative abundance (solid lines; ±SEM, bars) of the 55 and 47 kD PNPLA2 proteins among samples states. (F) Relative abundance pattern of the PNPLA2 48 kD protein, PNPLA2 long poly(A) and total RNA; hibernation states are double-plotted to reveal cyclical pattern of torpor and arousal.
Figure 4—figure supplement 1
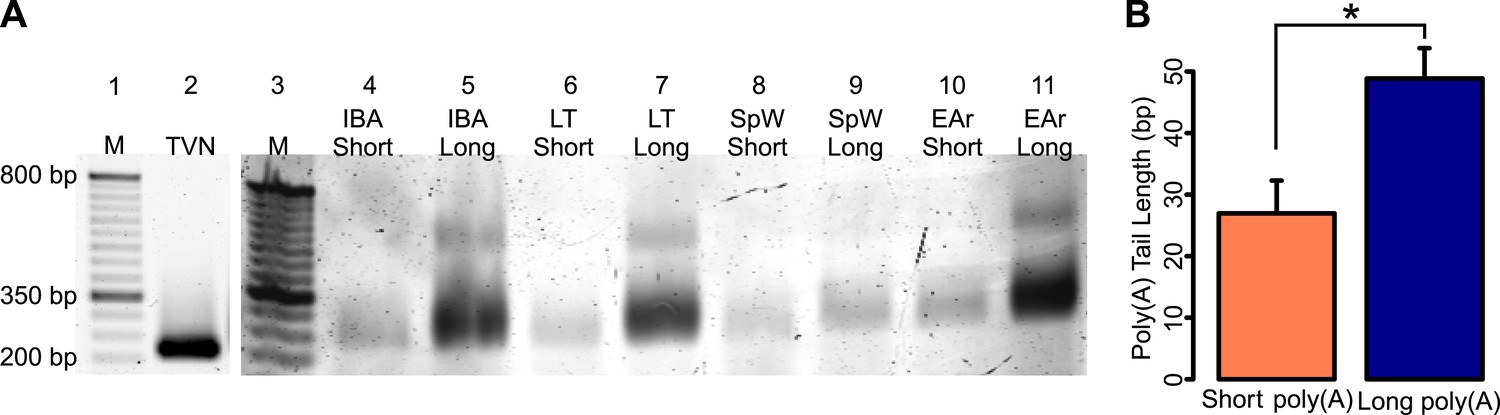
ePAT confirmation of RNA fractionation by poly(A) tail length.
(A) A gel showing RT-PCR amplified CKB from TVN (lane 2) and ePAT primed cDNA of one IBA, LT, SpW, and EAr short and long poly(A) RNA samples (lanes 4–11; labeled along the top). A 50-bp ladder is shown in lanes 1 and 3 (with M marked on top and several sizes denoted to the left of lane 1). The TVN band marks the first 12 adenosines of the poly(A) tail, while all other bands from ePAT cDNA represent the total length of the poly(A) tail. (B) The mean (+SEM) short and long poly(A) tail lengths calculated from the ePAT(-TVN) band sizes of the samples within each RNA fraction. The short poly(A) tail is approximately 26 bp, while the long poly(A) tail is approximately 48 bp. *p < 0.05 by two-tailed Student's t-test.
Figure 4—figure supplement 2
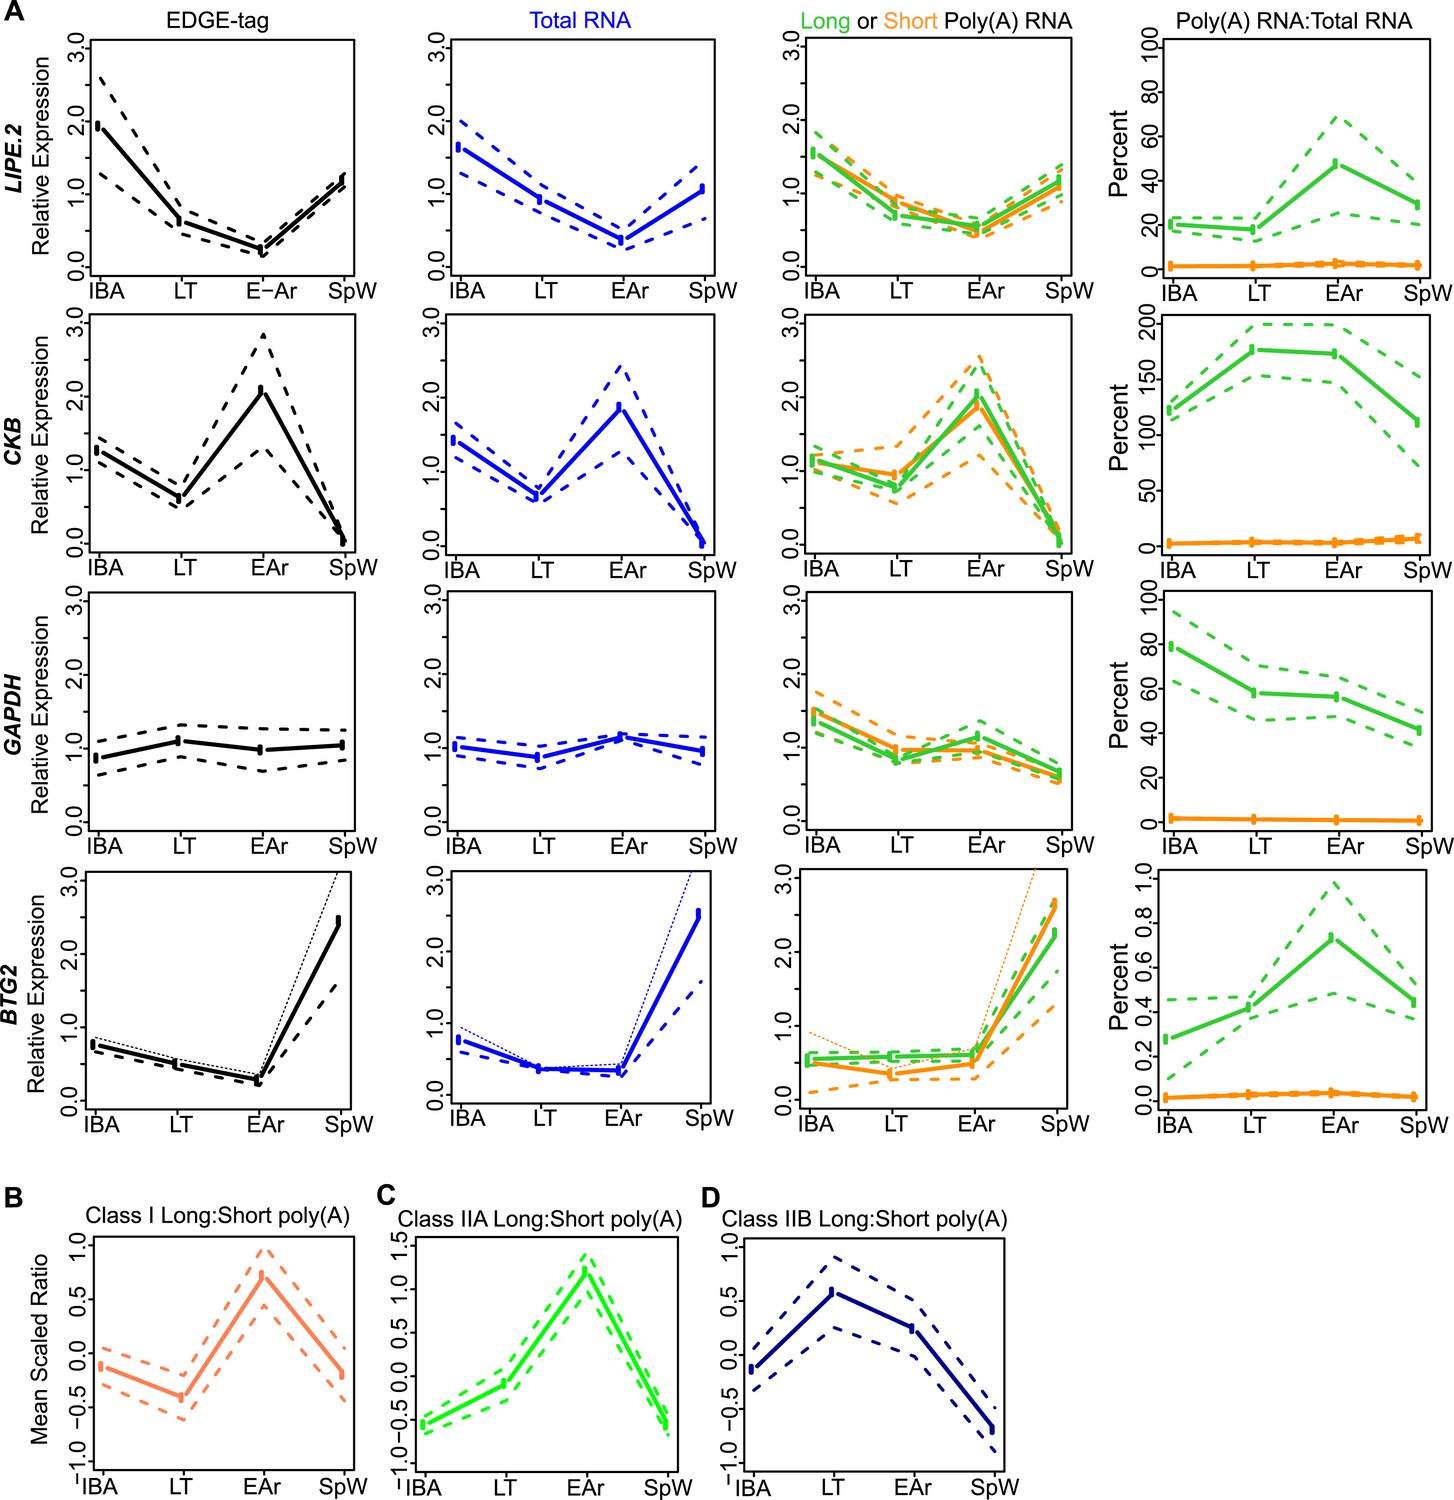
Class I RNA and poly(A) tail dynamics.
(A) Class I RNA dynamics. In addition to RET (Figure 4A), the measurements for the other transcripts (labeled on left x-axis) that belong to Class I are shown along horizontal panels. Relative expression levels (n = 3; solid line; ±SEM, dotted line; y-axis) of EDGE-tag counts (far left), total RNA (middle-left), poly(A) RNA (green = long poly(A) RNA; orange = short poly(A) RNA; middle-right), and percent recovery (y-axis) of poly(A) RNA relative to total RNA (far right) among physiological states. See Supplementary file 1B,C for additional details of transcript classification and specific measurements. (B) The mean long:short poly(A) RNA ratios (mean-scaled, solid line; ±SEM, dotted line; y-axis) for all transcripts in Class I among the four sample states. Increased long:short poly(A) RNA ratio = lengthened poly(A) tail, while decreased ratio = shortened poly(A) tail. (C and D) Same as in B, except plots show mean poly(A) tail length changes for transcripts in Class IIA (C) and Class IIB (D). All classes exhibited significant poly(A) tail length changes among sample states (One-Way ANOVA; p = 0.003 for Class I; p < 10–9 for Class IIA; p = 0.006 for Class IIB).
Figure 4—figure supplement 3
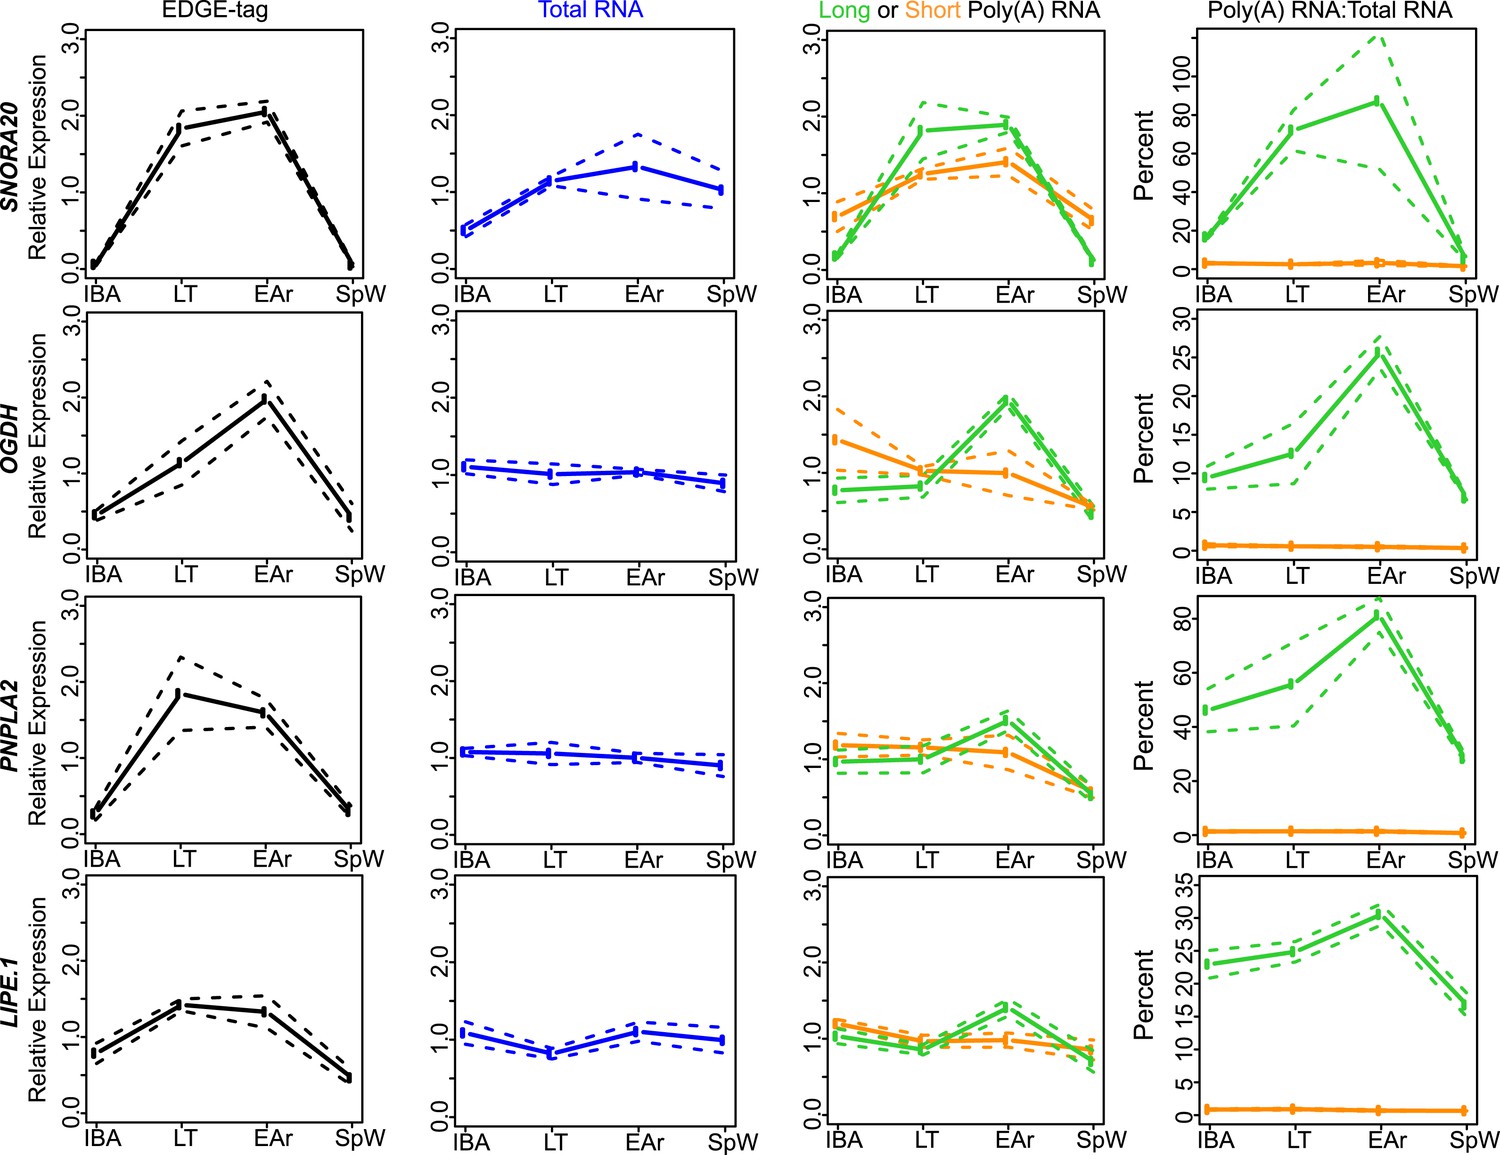
Class IIA RNA dynamics.
In addition to RPPH1 (Figure 4B), the measurements for the other transcripts (labeled on left x-axis) that belong to Class IIA are shown along the horizontal panels. Labeling is the same as in Figure 4—figure supplement 2A. See Supplementary file 1B,C for additional details of transcript classification and specific measurements.
Figure 4—figure supplement 4
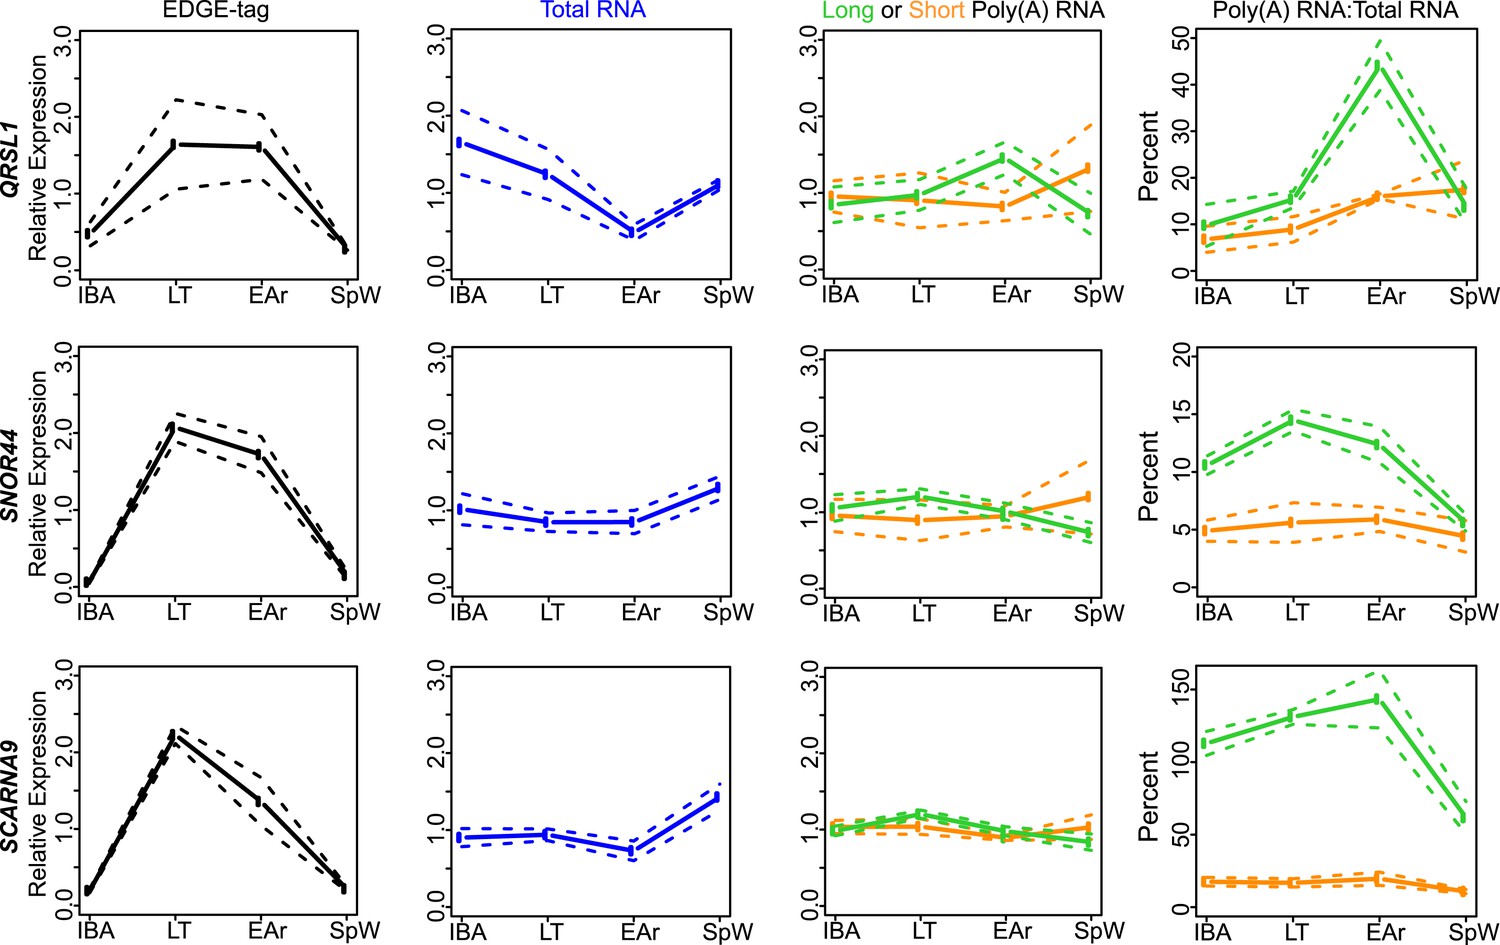
Class IIB RNA dynamics.
In addition to STAP2 (Figure 4C), the measurements for the other transcripts (labeled on left x-axis) that belong to Class IIB are shown along the horizontal panels. Labeling is the same as in Figure 4—figure supplement 2A. See Supplementary file 1B,C for additional details of transcript classification and specific measurements.
Figure 5 with 3 supplements
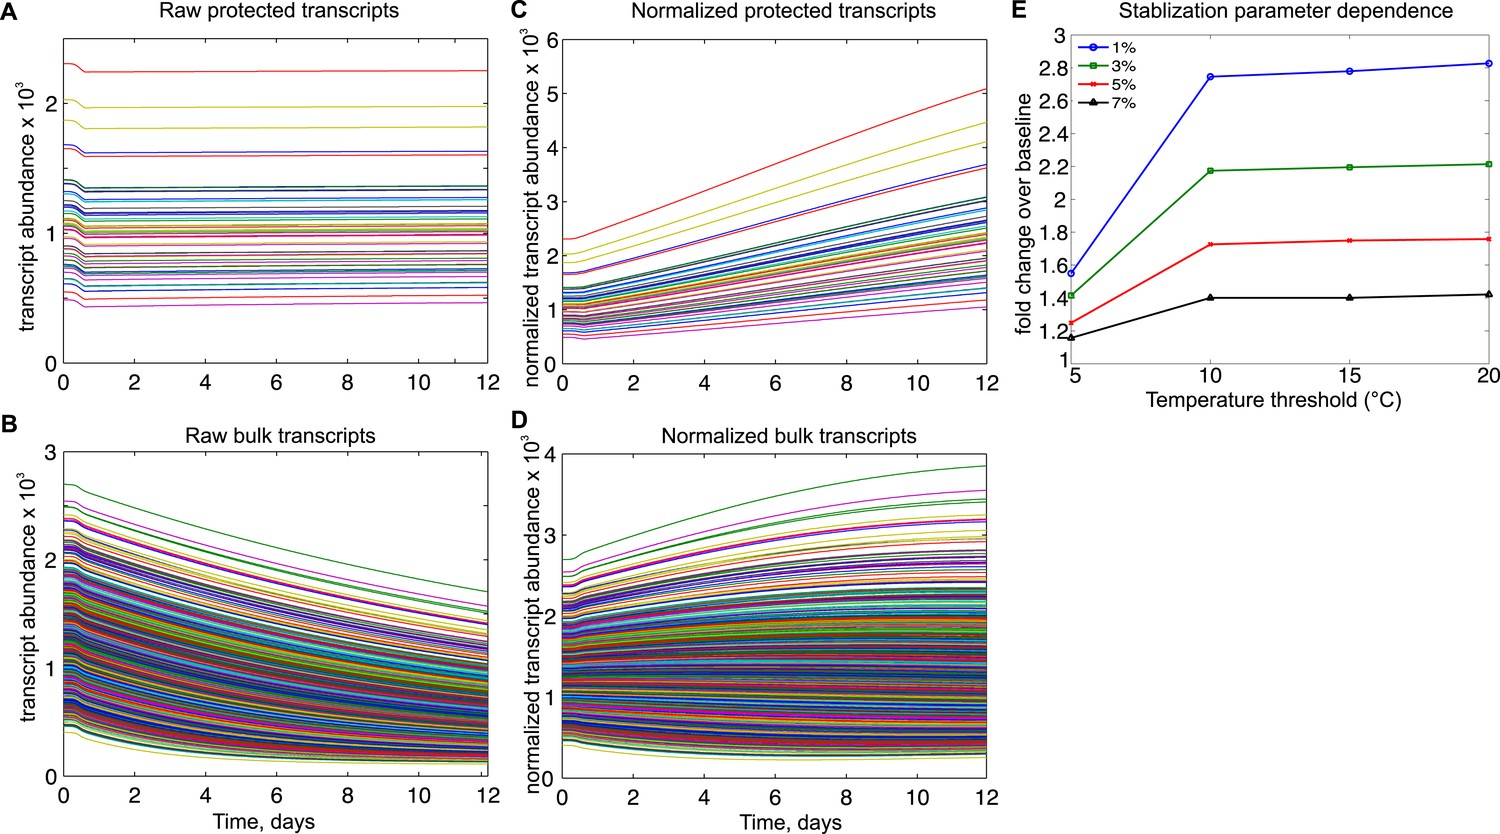
Mathematical modeling dynamics for 1,400 bulk and 50 protected transcripts simulated over the 12-day torpor–arousal cycle.
A temperature-dependent protective mechanism against degradation is implemented for protected transcripts: for body temperature below 10°C, degradation is set to 3% of its rate in the warm animal. Transcription rates for both population and degradation rates for bulk transcripts are adjusted for Q10 effects. Low body temperature during torpor causes the raw abundance of both (A) protected and (B) bulk transcripts to decrease. When abundances are normalized across the population, (C) protected transcripts appear to increase approximately twofold while the majority of (D) bulk transcripts still appear to degrade. (E) Systematically varying the temperature threshold and the percentage of the warm degradation rate associated with the protective mechanism reveals a dose-dependent relationship in which higher temperature thresholds and lower percentages are associated with larger fold increases over baseline in the protected subset.
Figure 5—figure supplement 1
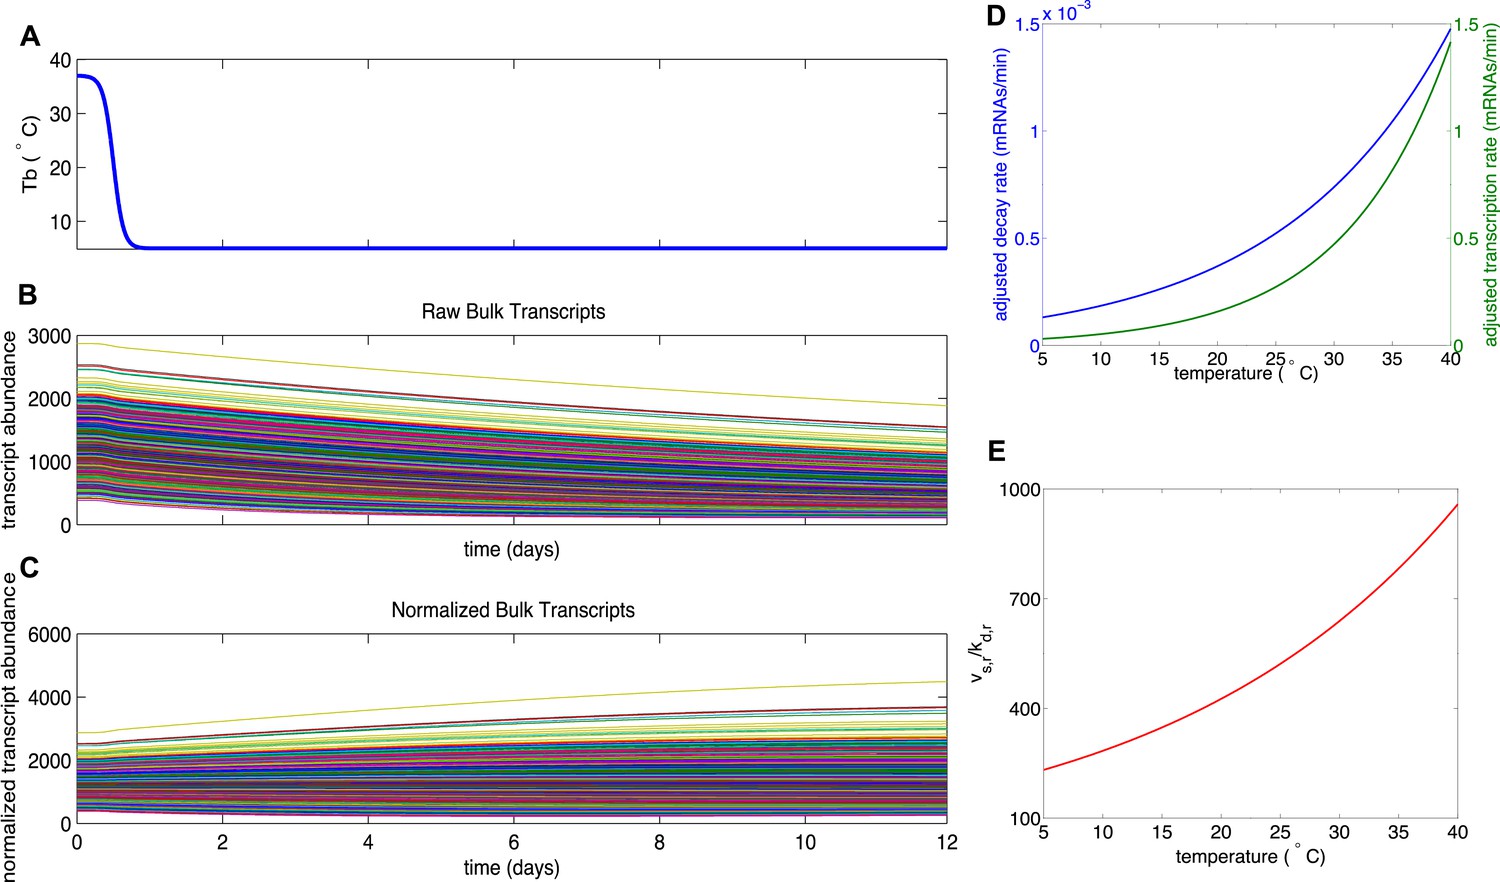
Mathematical modeling of transcript degradation.
(A) Body temperature (Tb) over a 12 day torpor–arousal cycle drives transcript dynamics for 1,400 simulated transcripts. (B) The distributions of transcription and degradation rates result in an overall degradation of transcript abundance in all transcripts. (C) When transcript abundance is normalized, differences in rates cause some transcripts to appear to increase under baseline conditions. (D) Representative transcription and degradation rates are adjusted for Q10 effects as Tb varies. (E) Differential Q10 effects cause the ratio of transcription rate (vsr) to degradation rate (kdr) to vary with Tb and favor degradation at low Tb. This ratio specifies the temperature-dependent steady state abundance for each transcript.
Figure 5—figure supplement 2
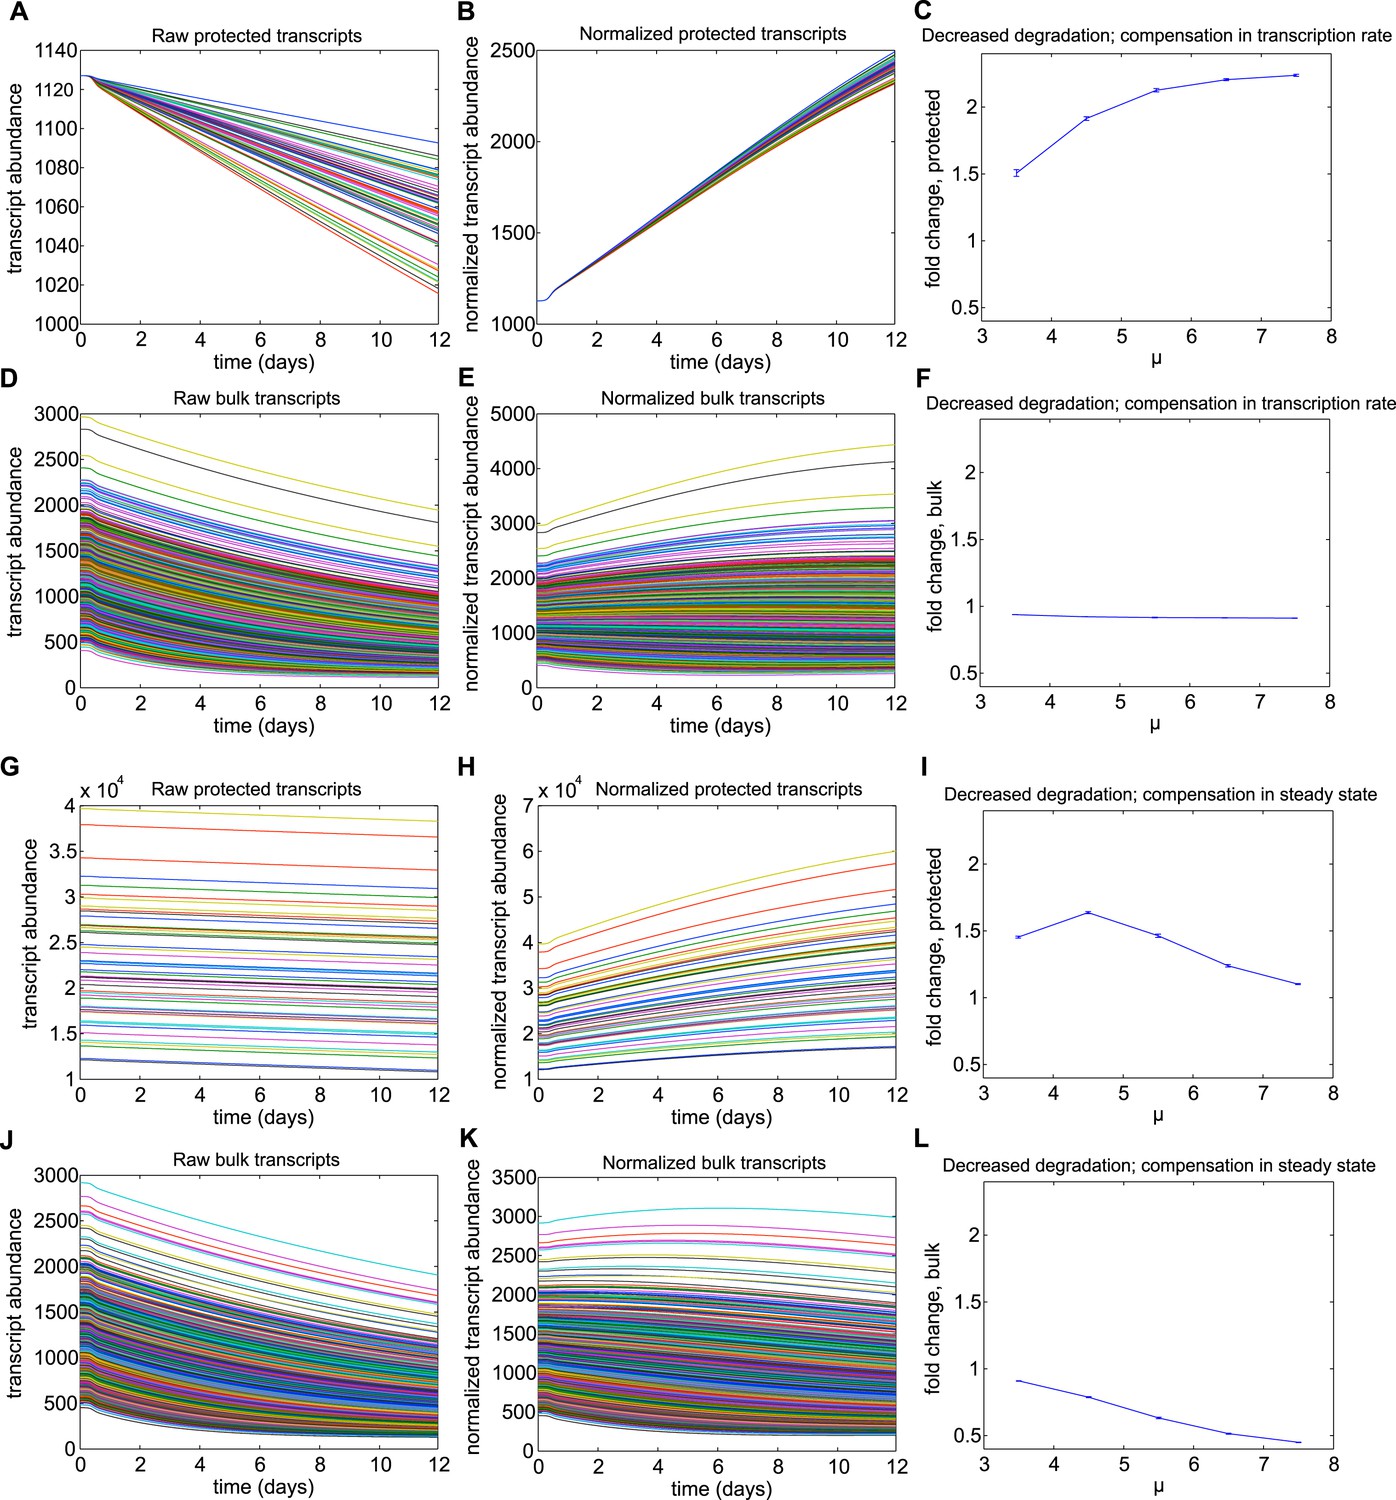
Results for Mechanism 2.
When lower rates of degradation were implemented for the subset of protected transcripts, the relative abundances of this subset were increased over the torpor–arousal cycle compared to baseline levels. This increase is illustrated by representative transcript time traces for raw and normalized abundance of 50 protected transcripts (A, B; G, H) and 1,400 bulk transcripts (D, E; J, K) where log mean mu for the distribution of half-lives is 5.5 for the protected transcripts compared to 2.5 for the bulk transcripts. This increase was more pronounced when the lower degradation rate was compensated by a lower transcription rate (A–F) compared to compensations in steady state abundance (G–L). To quantify the dependence on degradation rate, we varied the log mean mu for the distribution of half-lives from 3.5 hr to 7.5 hr (baseline mu value for bulk population was 2.5 hr). This corresponded to a change in average degradation rate from 3.63e-04 mRNAs/min to 6.69e-06 mRNAs/min. For lower degradation rates compensated by lower transcription rates, fold increase over baseline for protected transcripts showed a saturating dose dependent relationship with mu (C). This mechanism had a minimal effect on bulk transcripts (F). For lower degradation rates compensated by high steady state, fold increase over baseline for protected transcripts showed an inverted U-dependence on mu (I): although this mechanism could produce large increases in the subset of protected transcripts, this effect was attenuated as small degradation rates caused large steady state abundances since degradation, but not transcription, is proportional to steady state values. The fold change in bulk transcripts decreased dose-dependently for this mechanism (L). For mechanism 2, the differential Q10 effect enhanced the effect of the decreased degradation rate at low body temperature.
Figure 5—figure supplement 3

Results for mechanism 1.
When higher rates of transcription were implemented for the subset of protected transcripts, the relative abundances of this subset were decreased over the torpor–arousal cycle compared to baseline levels. This decrease is illustrated by representative transcript time traces for raw and normalized abundance of 50 protected transcripts (A, B; G, H) and 1,400 bulk transcripts (D, E; J, K) where log mean mu for the distribution of transcription rates is 1.33 for the protected transcripts compared to 0.033 for the bulk transcripts. The decrease in relative abundance was more pronounced when the increased transcription rate was compensated by an increased degradation rate (A–F) compared to compensations in steady state abundance (G–L). To quantify the dependence on transcription rate, we varied the log mean mu for the distribution of transcription rates from 0.33 mRNAs/min to 3.33 mRNAs/min (baseline mu value for bulk population was 0.033 mRNAs/min). This corresponded to a change in average transcription rate from 1.3967 mRNAs/min to 27.93 mRNAs/min. For increased transcription rates compensated by increased degradation rates, fold change over baseline for protected transcripts showed a saturating dose dependent relationship with mu (C). Increased transcription rates compensated by steady state had a minimal effect on relative abundance of protected transcripts across mu values (I). For both compensation mechanisms, increased transcription rates had a minimal effect on the abundance of bulk transcripts (F and L). For Mechanism 1, the differential Q10 effect prevented temperature-independent increases in transcription rates from increasing the relative abundance of protected transcripts.
Figure 6
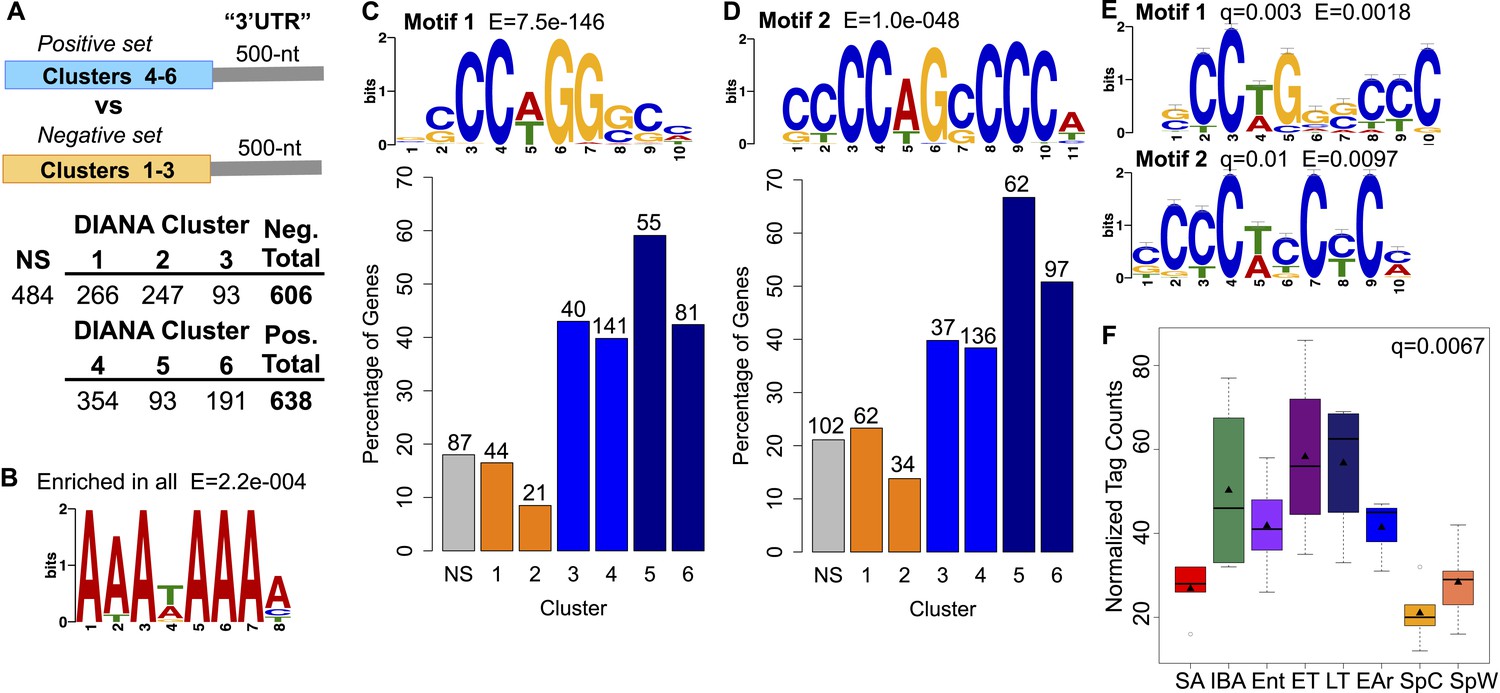
Motif enrichment in the 3′ ends of protected transcripts.
(A) Schematic shows methodology for identifying motifs enriched in the 3′ UTR regions (500-nt) of transcripts increased or stabilized in torpor (positive set; transcripts in DIANA Clusters 4–6) compared to transcripts decreased in torpor (negative set; transcripts in DIANA Clusters 1–3). The table below lists the number of unique transcripts within each DIANA Cluster used in the analysis, the sum of those in the negative or positive set and the number of non-significantly changed transcripts (NS) used in later comparisons. (B) The motif closely resembling the AAUAAA polyadenylation signal (Colgan and Manley, 1997) identified by a random sampling of 3′ UTR sequences in all clusters compared to a scrambled background set. (C) Motif 1: the most significant motif identified in the positive set of transcripts when compared to the negative set. Bar plot below shows the percentage of transcripts in each DIANA Cluster or in the non-significant group (NS) that contains Motif 1. Actual numbers of transcripts containing Motif 1 are labeled above bars (see table in A for comparison). (D) Motif 2: the second and the only other significant motif identified in the positive set of transcripts when compared to the negative set. Labeling is the same as in C. (E) The top RNA-binding protein motif matches for Motif 1 and 2 using TOMTOM (Gupta et al., 2007). These correspond to the poly(C) binding protein motifs reported by Ji et al. (2013). (F) Box plot of normalized tag counts for PCBP3 by state, triangle marks the mean.
Figure 7
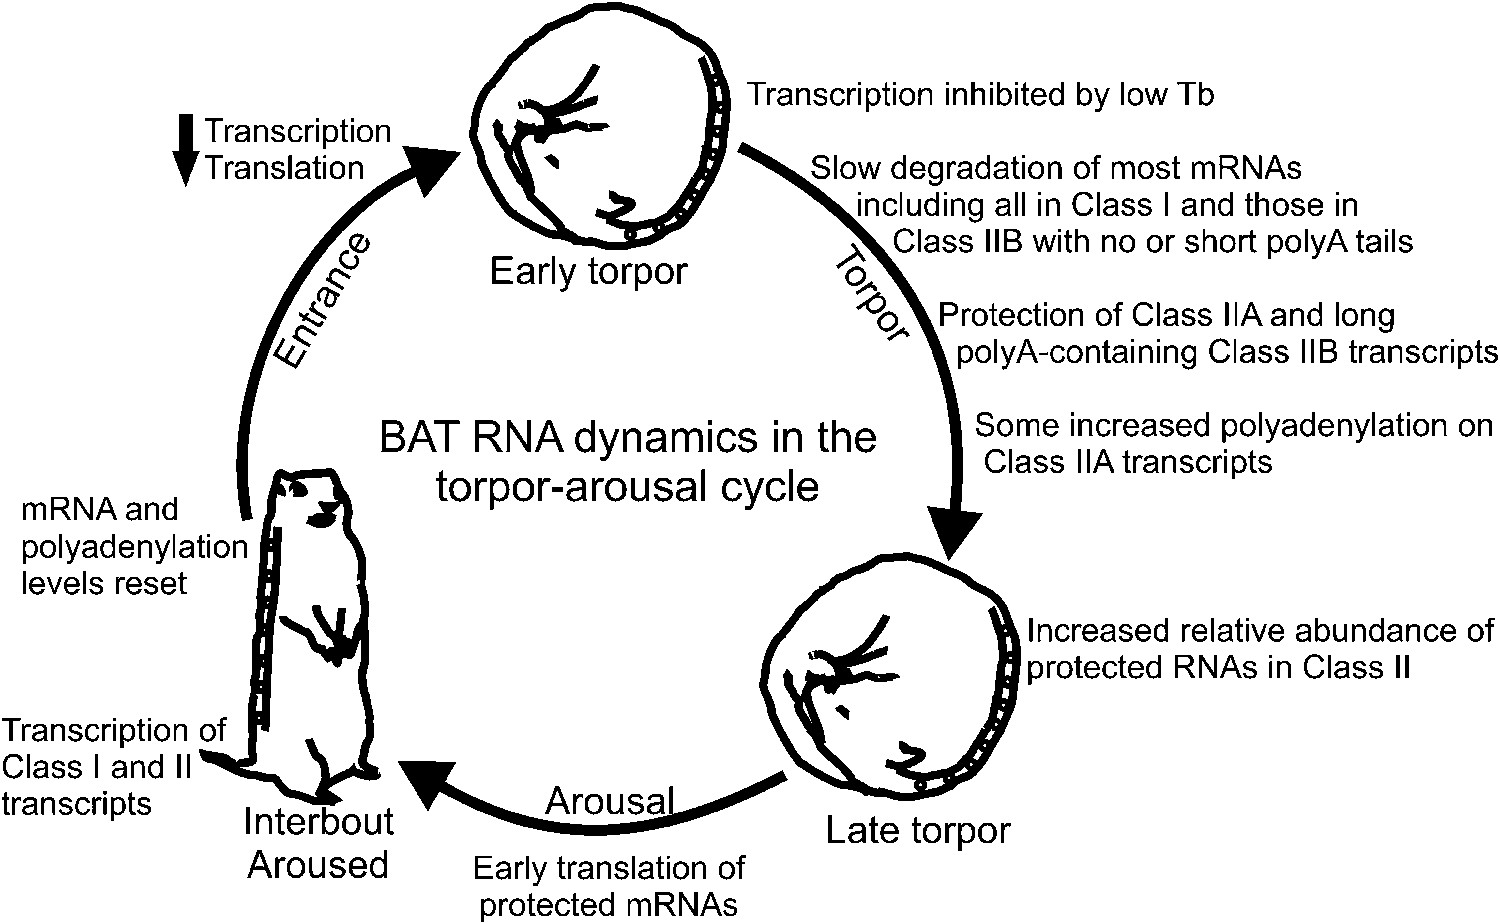
Model of BAT RNA dynamics in hibernation.
Physiological stages of the torpor–arousal cycle are listed inside of the arrows and underneath representative animals. Key RNA changes are noted. See text for detailed explanation.
Author response image 1
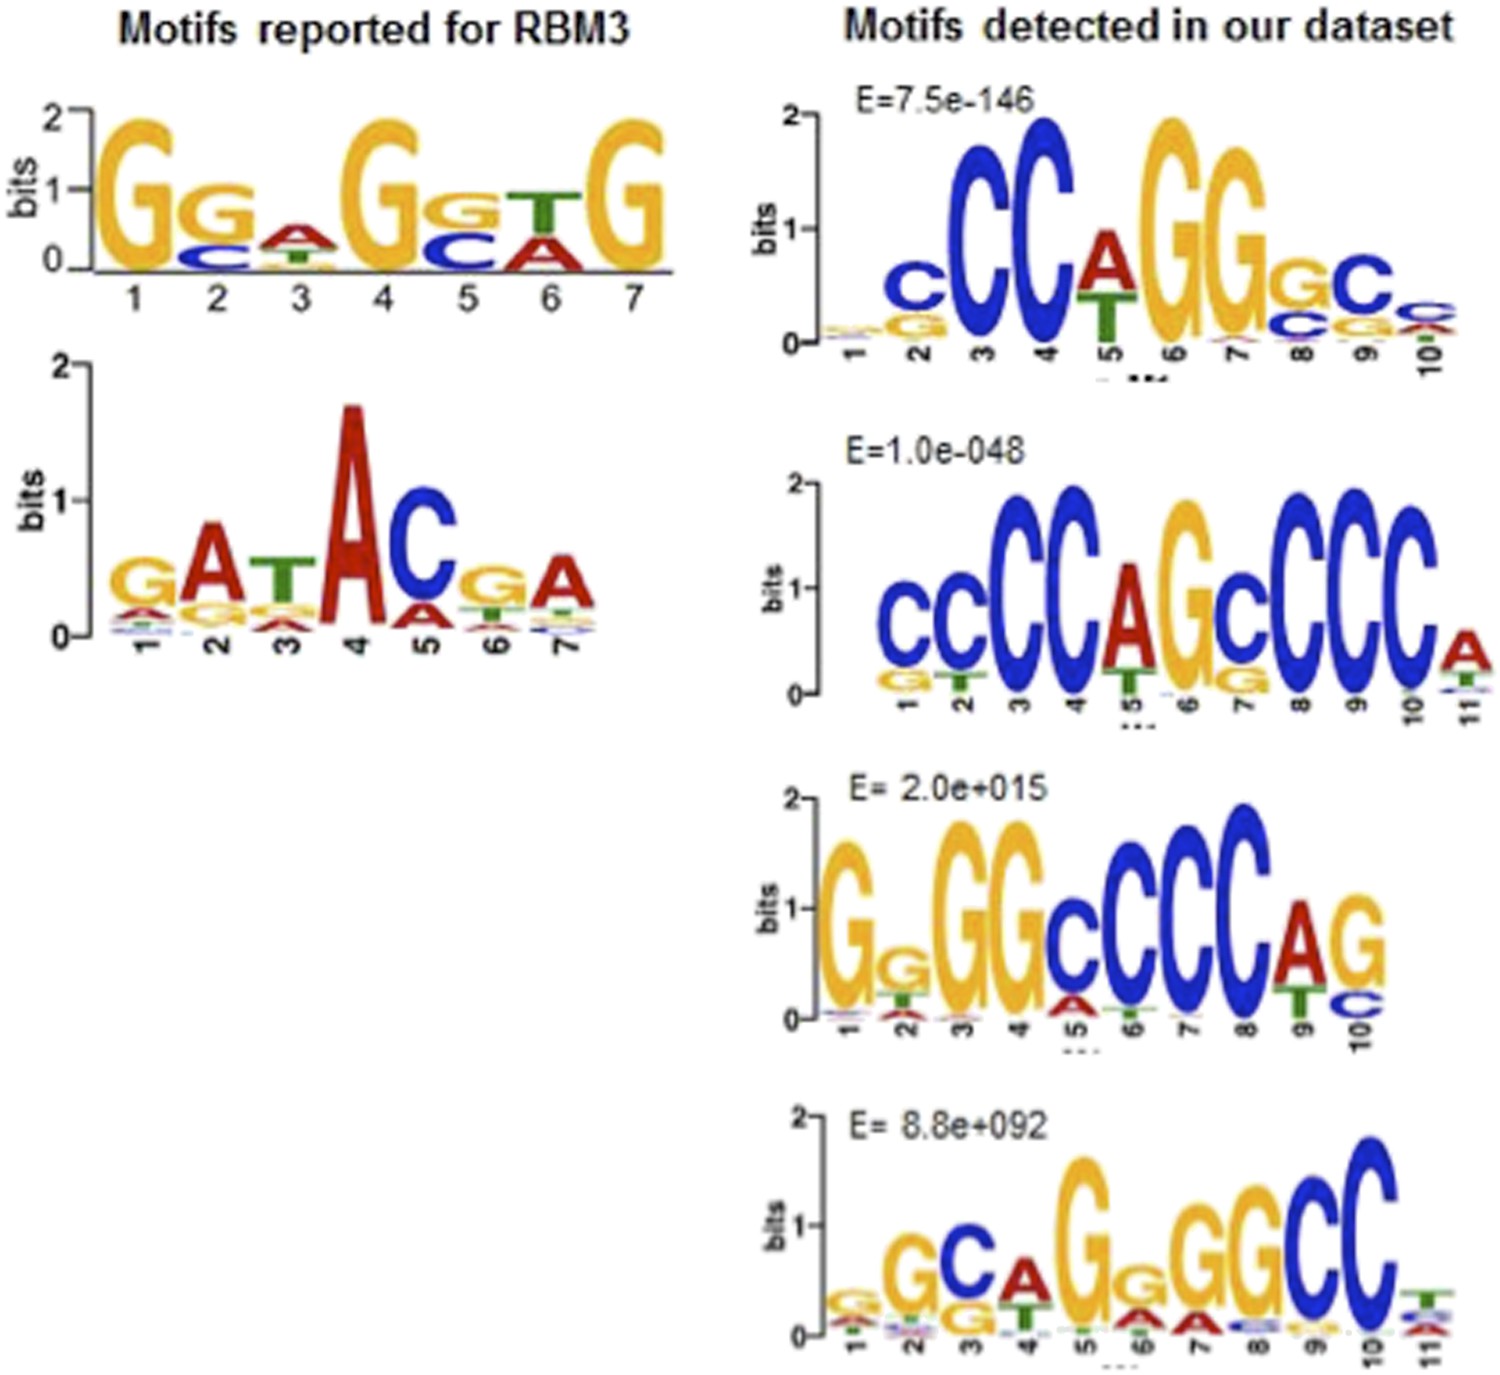
Motif comparisons: Left side, RBM3 motifs reported by (top) Liu, Y. et al. (2013) Sci. Rep. 3, doi:10.1038; (bottom); Ray, D. et al. (2013), Nature 499, 172. Right side, top four motifs in the hibernation-increased subset of RNAs in our dataset. Note only the top two, as reported in the new Figure 6 of our manuscript, are significantly enriched.
Tables
Table 1
DAVID functional annotations for each DIANA cluster
| DIANA cluster | Functional annotation cluster | Enrichment score | Annotations, n | Genes, n |
|---|---|---|---|---|
| 1 | Cytosolic ribosome | 4.09 | 11 | 12 |
| Zinc finger, C2H2-type | 2.19 | 8 | 30 | |
| Heme | 1.8 | 3 | 8 | |
| Ribosome biogenesis | 1.68 | 4 | 9 | |
| Transcription | 1.67 | 4 | 57 | |
| 2 | Transcription | 6.03 | 4 | 80 |
| Nuclear lumen | 5.91 | 4 | 57 | |
| RNA recognition motif, RNP-1 | 5.18 | 3 | 18 | |
| mRNA processing | 3.39 | 4 | 17 | |
| Transcription from RNA polymerase II promoter | 3.21 | 3 | 17 | |
| 3 | Mitochondrion outer membrane | 3.07 | 4 | 6 |
| Triglyceride biosynthetic process | 1.78 | 12 | 3 | |
| Glutathione S-transferase, C-terminal-like | 1.41 | 4 | 3 | |
| Long-chain fatty acid transport | 1.37 | 5 | 3 | |
| 4 | Mitochondrial membrane | 5.84 | 30 | 30 |
| Endoplasmic reticulum membrane | 3.94 | 20 | 20 | |
| Lipid particle | 2.73 | 5 | 5 | |
| Glucose metabolic process | 2.16 | 11 | 11 | |
| Peroxisome | 2.15 | 9 | 9 | |
| 5 | Mitochondrion | 5.61 | 24 | 24 |
| Generation of precursor metabolites and energy | 2.66 | 14 | 14 | |
| Lipid droplet | 2.38 | 3 | 3 | |
| Lipid metabolism | 2.31 | 7 | 7 | |
| Oxidative phosphorylation | 2.25 | 4 | 4 | |
| 6 | Mitochondrion | 4.04 | 17 | 27 |
| Neutral lipid biosynthetic process | 2.74 | 14 | 4 | |
| Glucose metabolic process | 2.54 | 3 | 10 | |
| Lipid catabolic process | 2.33 | 13 | 11 | |
| Adipocytokine signaling pathway | 2.17 | 11 | 9 |
-
The top five Functional Annotation Clusters, ordered by enrichment score (>1.3), are listed for each DIANA cluster. See Figure 2D for DIANA clusters and Supplementary file 3D in Grabek et al., 2014 for all Functional Annotation Clusters.
Additional files
-
Supplementary file 1
RT-qPCR Measurements. (A) Oligonucleotide primers used in RT-qPCR. (B) Spearman's rank correlations of RT-qPCR abundance measurements to EDGE-tag abundance measurements. (C) One-way ANOVA p-values of RT-qPCR measured RNA abundance changes among sample states.
- https://doi.org/10.7554/eLife.04517.019
-
Supplementary file 2
Mathematical Modeling of Transcript Dynamics.
- https://doi.org/10.7554/eLife.04517.020
Download links
A two-part list of links to download the article, or parts of the article, in various formats.
Downloads (link to download the article as PDF)
Open citations (links to open the citations from this article in various online reference manager services)
Cite this article (links to download the citations from this article in formats compatible with various reference manager tools)
Enhanced stability and polyadenylation of select mRNAs support rapid thermogenesis in the brown fat of a hibernator
eLife 4:e04517.
https://doi.org/10.7554/eLife.04517


