RNA virus attenuation by codon pair deoptimisation is an artefact of increases in CpG/UpA dinucleotide frequencies
- University of St Andrews, United Kingdom
- University of Edinburgh, United Kingdom
- University of Warwick, United Kingdom
Figures
Figure 1 with 4 supplements
(A) CP usage in human coding sequences arranged in a 64 x 64 grid.
CP frequencies relative to those expected from nucleotide and amino acid frequencies (CP bias) are colour coded in a heat map. The primary division on the x-axis is by identity of the 3–1 dinucleotide as annotated. Within these, further divisions within each of the 16 columns show the identity of the nucleotide at position 2 (A, C, G or U). The y-axis records nucleotides at positions 4 (4 main divisions on the y-axis), 1 (4 subdivisions of position 4) and 6 (4 subdivisions of position 1). Positions of unused codon pairs containing a 5′ stop codon (translated as *|x) are shaded in grey. CP usage heat maps for A. thaliana, C. elegans and E. coli coding sequences are shown in Figure 1—figure supplement 2A–2C. (B) Distribution of codon pair bias scores in human coding sequences; separate labelling of the 64 codon pairs with CpG (red) or UpA (blue) across the codon junction (3–1) demonstrates their consistent under-representation based on their component nucleotide and amino acid frequencies. The distribution of codon pair scores for A. thaliana, C. elegans and E. coli are shown in Figure 1—figure supplement 3A–3C. Correlations between codon pair scores between human coding sequences and those of A. thaliana, C. elegans and E. coli are shown in Figure 1—figure supplement 4.
Figure 1—figure supplement 1
Distribution of relative synonymous codon usage values for degenerate codons in the human genome (stop codons were excluded).
Codons with CpG and UpA at the 1–2 or 2–3 codon position are shaded as indicated in the key (data derived from http://bioinformatics.weizmann.ac.il/databases/codon).
Figure 1—figure supplement 2
CP scores of codon pairs of (A) A. thaliana, (B) C. elegans and (C) E.coli ORFeomes.
The primary division on the x-axis is by identity of the 3–1 dinucleotide (labelled on y-axis), divisions within each column show the identity of codon position 2. The y-axis records codon positions 5 (1 cycle), 1 (4 cycles) and 6 (16 cycles). Positions of codon pairs translated as *|x are shaded grey.
Figure 1—figure supplement 3
Distribution of codon pair scores for other organisms-(A) A thaliana, (B) C. elegans and (C) E. coli, with separate representation of codon pairs with CpG and UpA across the codon junction.
https://doi.org/10.7554/eLife.04531.007
Figure 1—figure supplement 4
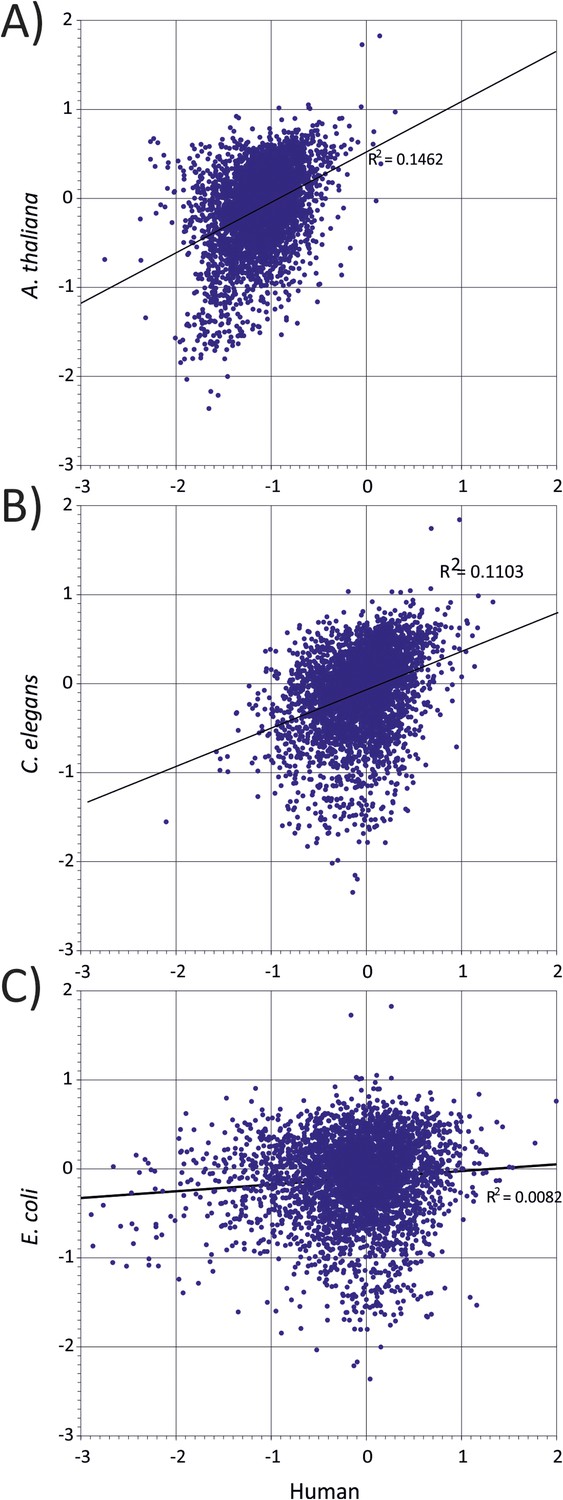
Correlation between representations of human codon pairs (x-axis) with those of other organisms-(A) A thaliana, (B) C. elegans and (C) E. coli (y-axis).
https://doi.org/10.7554/eLife.04531.008
Figure 2
Codon pair scores and numbers of CpG and UpA dinucleotides in native (WT) and mutated regions of E7.
Mean CP scores for Regions 1 and 2 combined are shown on the x-axis; the total numbers of CpG and UpA dinucleotides in each sequence are shown on the y-axis. The histogram shows CP scores for the 35,170 human mRNA sequences >200 bases in length (mean 0.072; standard deviation ±0.031).
Figure 3

Replication of WT and mutants of E7 with altered CP and dinucleotide frequencies.
Bars are shaded diagrammatically based on their relative CpG/UpA composition. RD cells were infected with E7 WT, at an MOI of 0.03 and infectious titres quantified at 8, 18 and 30 hr time points post inoculation (p.i.) by TCID50 determination. Results are the mean of three biological replicates; error bars show standard errors of the mean.
Figure 4 with 1 supplement
RD cells were co-infected with pairs of WT (W|W) and E7 mutants at equal MOI and the supernatant serially passaged through cells after development of CPE. RNA was isolated and the composition of each virus determined through selective restriction digests using enzymes listed in Table 3.
(A) Examples of three competition assays showing cleavage patterns of individual viruses (lanes 1, 2), the starting inoculum (lane 3) and two biological replicates after 10 (panels 1, 2) or 5 (panel 3) passages in lanes 4 and 5. Results from the other competition assays are shown in Figure 4—figure supplement 1. (B) Summary of pairwise fitness comparisons of viruses with outcomes for the viruses listed in columns at passages 5 and 10 indicated by colour shading. For example, Min-E and WT showed equal fitness (yellow shading) and cu|cu outcompeted WT by passage 5 (red) and Max-U by passage 10.
Figure 4—figure supplement 1
Competition assays between E7 mutants showing competing variants (lanes 1 and 2) andout at indicated passage number (lane 3) for each.
https://doi.org/10.7554/eLife.04531.013
Figure 5 with 1 supplement
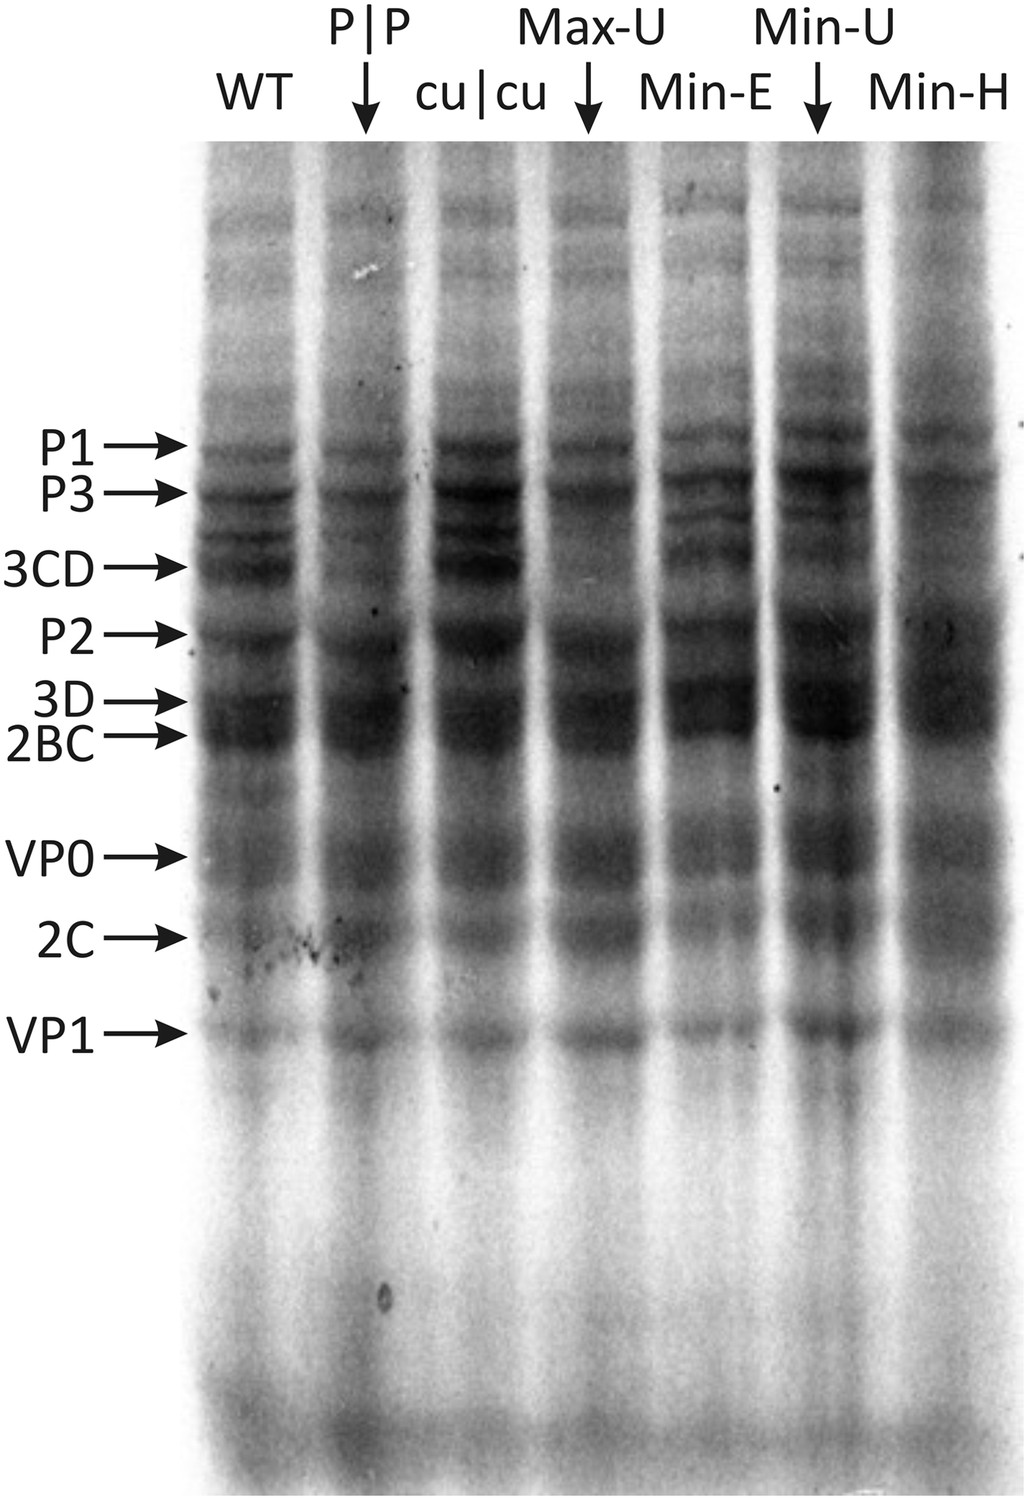
Translation of RNA templates generated from WT and mutant E7 cDNAs in a rabbit reticulocyte cell free assay.
Assignments of bands to E7 proteins were based on molecular weights on SDS-PAGE. A comparison of densitometry values for viral proteins is shown in Figure 5—figure supplement 1.
Figure 5—figure supplement 1
Translation efficiencies estimated by densitometry of band intensities of viral proteins translated in a rabbit reticulocyte cell free assay.
Translation efficiencies of mutant E7 cDNAs were quantified relative to expression from the WT template. Bars show mean values for seven viral proteins; error bars show standard errors of the mean.
Figure 6

Comparison of codon pair scores generated by SSE using a dataset of 35,770 human mRNA sequences (y-axis) with those used in a previous analysis (Coleman et al., 2008).
https://doi.org/10.7554/eLife.04531.018Tables
Table 1
Relationship between codon pair de-optimisation, CpG and UpA frequencies and virus fitness reduction
| WT | CPD | |||||||||
|---|---|---|---|---|---|---|---|---|---|---|
| Virus | Gene | Prop'n | CP bias | CpG | UpA | CP bias | CpG | UpA | Replication Reduction | Ref |
| Poliovirus | ||||||||||
| PV-X | Capsid | 14.8% | −0.03 | 0.52 | 0.75 | −0.46 | 1.34 | 1.25 | ×25 | Coleman et al., 2008 |
| PV-XY | Capsid | 25.9% | −0.03 | 0.54 | 0.75 | −0.46 | 1.31 | 1.27 | ×400 | |
| Influenza A virus* | ||||||||||
| HAMin | Segs.4 | 11.4% | 0.02 | 0.43 | 0.64 | −0.42 | 1.65 | 1.11 | ×3.5 | Mueller et al., 2010 |
| HA/NPMin | Segs.4,5 | 21.3% | 0.02 | 0.44 | 0.55 | −0.42 | 1.56 | 1.14 | ×14 | |
| PR83F | Segs.1,4,5 | 29.1% | 0.01 | 0.43 | 0.53 | −0.41 | 1.55 | 1.07 | ×35 | |
| HIV-1 | ||||||||||
| A | gag | 4.6% | 0.03 | 0.47 | 1.04 | −0.43 | 1.43 | 1.25 | ×7 | Martrus et al., 2013 |
| B | gag | 4.7% | 0.08 | 0 | 0.91 | −0.37 | 1.22 | 1.15 | ×3 | |
| C | gag | 4.8% | 0.03 | 0.31 | 1.00 | −0.38 | 1.50 | 1.09 | × 8 | |
| D | gag | 2.1% | −0.02 | 0 | 0.49 | −0.42 | 1.47 | 0.99 | ×1.5 | |
| PRRSV | ||||||||||
| SAVE5 | gp5 | 2.6%† | −0.06 | 0.63 | 0.73 | −0.38 | 1.37 | 1.14 | ×4‡ | Ni et al., 20142 |
-
*
Codon pair minimised sequences of IAV were not provided in (Coleman et al., 2008) and for the purposes of comparison these have been reconstructed in SSE. Note that the CP scores described in Table 1 of that paper (−0.386, −0.420 and −0.421 for PB1, HA and NP respectively) are not minimum scores; these are in fact −0.533, −0.585 and −0.602. Therefore, for the purposes of comparison, CP score minimisation in the current study was targeted to the former values. Although the sequences generated by SSE were not identical to those obtained previously, they would demonstrate a similar distortion of dinucleotide frequencies to those used in the previous study (Coleman et al., 2008).
-
†
Mutated region only (positions 147–542 in gp5).
-
‡
Data from replication assay in PAM cells.
Table 2
Composition and codon usage of E7 wt and mutant insert sequences
| Region | Sequence (Symbol) | G+C content | CpG Total* | O/E ratio†,‡ | UpA Total* | O/E ratio†,‡ | Codon Usage | ||
|---|---|---|---|---|---|---|---|---|---|
| CAI¶ | ENc | CP Bias | |||||||
| 1 | Native (WT) | 47.6% | 51 (−) | 0.730 | 62 (−) | 0.742 | 0.685 | 56.5 | −0.043 |
| Permuted (P) | 47.6% | 51 (0) | 0.730 | 2 (0) | 0.742 | 0.694 | 55.8 | −0.025 | |
| CpG/UpAL (cu) | 47.5% | 0 (−51) | 19 (−43) | 0.686 | 43.5 | 0.087 | |||
| Max-U | 50.1% | 47 (−4) | 0.610 | 43 (−19) | 0.573 | 0.708 | 49.6 | ||
| Min_E | 47.5% | 51 (0) | 0.736 | 62 (0) | 0.735 | 0.748 | 54.3 | ||
| Min_U | 47.5% | 69 (+18) | 0.992 | 76 (+14) | 0.939 | 0.709 | 58.3 | ||
| Min_H | 49.8% | 106 (+55) | 1.400 | 79 (+17) | 0.981 | 0.696 | 49.2 | ||
| 2 | Native (WT) | 47.1% | 18 (−) | 0.320 | 48 (−) | 0.695 | 0.743 | 53.2 | 0.015 |
| Permuted (P) | 47.6% | 18 (0) | 0.320 | 48 (0) | 0.695 | 0.739 | 49.0 | 0.013 | |
| CpG/UpAL (cu) | 48.5% | 0 (−18) | 48 (0) | 0.739 | 47.2 | 0.118 | |||
| Max-U | 46.3% | 24 (+6) | 0.440 | 43 (−3) | 0.601 | 0.750 | 46.1 | ||
| Min-E | 45.7% | 18 (0) | 0.343 | 48 (0) | 0.657 | 0.785 | 53.3 | ||
| Min-U | 47.4% | 37 (+19) | 0.649 | 50 (+2) | 0.738 | 0.767 | 57.6 | ||
| Min-H | 47.8% | 68 (+50) | 1.172 | 65 (+15) | 0.970 | 0.715 | 49.7 | ||
-
*
Total number of CpG and UpA dinucleotides in sequence. Changes in numbers between mutated and original WT sequence are indicated in parentheses.
-
†
Ratio of observed dinucleotide frequency (O) to that expected based on mononucleotide composition (E) that is, f(CpG)/f(C) × f(G).
-
‡
Values deliberately changed are shown in red (maximised) and blue (minimised).
-
¶
Calculated from http://genomes.urv.es/CAIcal/ (Puigbo et al., 2008).
Table 3
Enzymes used in selective digests for competition ASSAYS
| Virus 1 | Virus 2 | Region | Enzyme | Target |
|---|---|---|---|---|
| W|W | P|P | 1 | SpeI | Permuted |
| W|W | Max-U | 1 | SacI | Max |
| W|W | Min-E | 1 | NcoI | WT |
| W|W | Min-U | 1 | NcoI | WT |
| W|W | Min-H | 1 | EcoRV | WT |
| W|W | cu|cu | 1 | EcoRV | WT |
| P|P | cu|cu | 1 | SpeI | Permuted |
| Max-U | P|P | 1 | SpeI | Permuted |
| Max-U | cu|cu | 1 | SacI | Max |
| Min-E | Min-U | 1 | ClaI | Min-U |
| Min-E | Min-H | 1 | EcoRV | Min-E |
| Min-U | Min-H | 1 | ClaI | Min-U |
Table 4
Correlation between fitness ranking and sequence composition
| Variable | Spearman R | p value† |
|---|---|---|
| CpG/UpA* | 1.0 | <0.001 |
| CP bias | −0.70 | 0.1 (n.s.‡) |
| CAI | −0.334 | >0.5 (n.s.) |
| ENc | 0.593 | >0.5 (n.s.) |
| G + C content | 0.075 | >0.5 (n.s.) |
| Translation efficiency | −0.074 | >0.5 (n.s.) |
-
*
Number of CpG and UpA dinucleotides in insert region.
-
†
From values tabulated in (Ramsey, 1989).
-
‡
n.s. : not significant.
Additional files
-
Supplementary file 1
Nucleotide sequences of mutants used in the study. Supplementary file 1.docx http://dx.doi.org/10.7488/ds/188.
- https://doi.org/10.7554/eLife.04531.019
Download links
A two-part list of links to download the article, or parts of the article, in various formats.
Downloads (link to download the article as PDF)
Open citations (links to open the citations from this article in various online reference manager services)
Cite this article (links to download the citations from this article in formats compatible with various reference manager tools)
RNA virus attenuation by codon pair deoptimisation is an artefact of increases in CpG/UpA dinucleotide frequencies
eLife 3:e04531.
https://doi.org/10.7554/eLife.04531


