Mushroom body output neurons encode valence and guide memory-based action selection in Drosophila
- Janelia Research Campus, Howard Hughes Medical Institute, United States
- Yale School of Medicine, United States
- Max Planck Institute of Neurobiology, Germany
- Tohoku University, Japan
- Centre National de la Recherche Scientifique, ESPCI, France
Figures
Figure 1
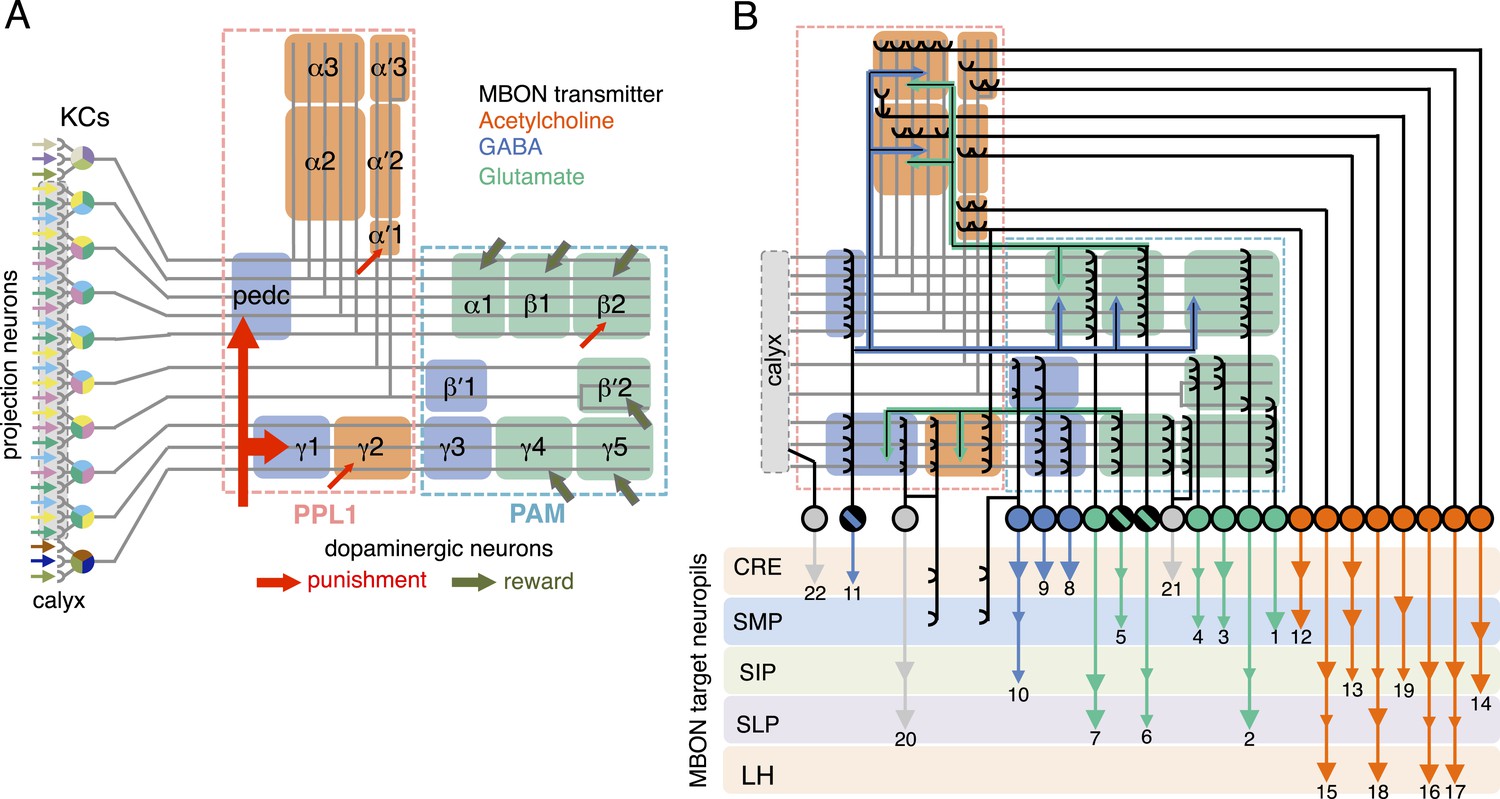
Circuit diagrams of the mushroom body.
(A) The innervation patterns of extrinsic neurons define 15 compartments in the MB lobes and one compartment in the core of distal pedunculus (pedc); the compartments are represented by rectangles that are color-coded based on the neurotransmitter used by the mushroom body output neurons (MBONs) having dendrites in that compartment (green, glutamate; blue, GABA; orange, acetylcholine). Projection neurons (far left, colored arrows) from the antennal lobe convey olfactory sensory information to the MB calyx where they synapse on the dendrites of Kenyon cells (KCs). The parallel axon fibers of the KCs (gray lines) form the lobes (α/β, α′/β′ and γ) where KCs terminate onto the dendrites of the MBONs. Each of the seven types of KCs innervates a specific layer within a given lobe. The dendrites of individual MBON types and the terminals of dopaminergic neurons (DANs) intersect the longitudinal axis of KC axon-bundles in specific compartments along the lobes. MBONs using the same transmitter are spatially co-localized in the lobes (See Figure 1B). Innervation areas of PPL1 and PAM cluster DANs axons in the MB lobes are indicated by the rectangles outlined in dashed lines. Activation of subsets of DANs can convey punishment or reward, respectively inducing aversive or appetitive memory when activation is paired with odor presentation. The size of arrows indicates magnitude of memory induced by DAN activation. See text for references. (B) Schematic representation of the 21 cell types of MBONs in the lobes and one cell type of MBON in the calyx based on the data presented in the accompanying manuscript (Aso et al., 2014): circles, cell bodies; semicircles, dendrites; arrowheads, axon terminals; color-coding is by neurotransmitter as in panel (A) Three MBON cell-types (GABAergic MBON-γ1pedc>α/β, glutamatergic MBON-γ4>γ1γ2 and MBON-β1>α; marked as 11, 5 and 6 respectively) send axons into the MB lobes. Axons of MBON-γ4>γ1γ2 project from γ4 to γ1 and γ2, and thus have the potential to affect activity of MBON-γ1pedc>α/β. From γ1, the axon of MBON-γ1pedc>α/β projects to compartments in the α/β lobes including β1, where dendrites of MBON-β1>α arborize. Axons of both MBON-γ1pedc>α/β and MBON-β1>α project to the compartments in the α lobe. Therefore activity of MBONs in the α lobe can be regulated by these layered inter-compartmental connections. These three types of MBONs (11, 5 and 6) do not project back to their own dendrites. Therefore, the organization of the MBONs can be viewed as forming a multilayered feed-forward network (Aso et al., 2014). MBONs project to a small number of brain areas: the crepine (CRE; a region surrounding the horizontal/medial lobes), the superior medial protocerebrum (SMP), superior intermediate protocerebrum (SIP) and superior lateral protocerebrum (SLP) and the lateral horn (LH). The size of the arrowhead reflects the relative number of termini in each area. The MBONs are numbered and listed in Table 1. See the accompanying manuscript (Aso et al., 2014) and Table 1 for details.
Figure 2
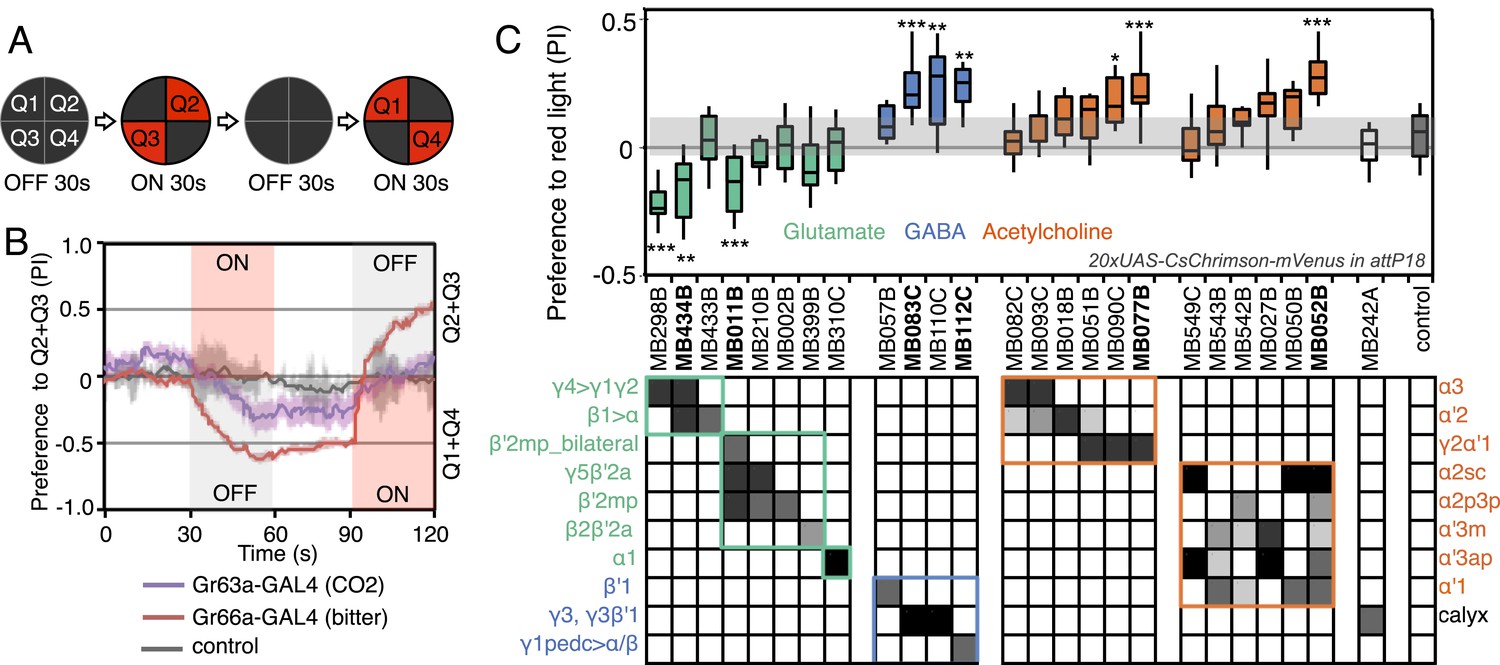
Screening MBONs for behavioral valence.
(A) Behavioral valence assay. Approximately twenty female flies were placed in a 10 cm circular arena in a dark chamber and allowed to distribute themselves freely among the four quadrants. From 30–60 s, two of the quadrants (Q2&3) were illuminated with 617 nm peaked red LED lights to activate CsChrimson-containing neurons; from 90–120 s, the other two quadrants (Q1 & 4) were illuminated instead. No quadrants were illuminated from 0–30 s or from 60–90 s. The flies were video recorded and their locations in the arena were used to calculate behavioral preferences. (B) For these time-domain plots, the quadrant preference at each point in time was calculated as [(number of flies in Q2&3) - (number of flies in Q1&4)]/(total number of flies). Flies expressing CsChrimson in receptor neurons for CO2 or for bitter taste (using the indicated drivers and 20xUAS-CsChrimson-mVenus in attP18) avoided the illuminated quadrants, whereas the control genotype (empty driver, pBDPGAL4U in attP2/20xUAS-CsChrimson-mVenus in attP18) showed a very slight preference for illuminated quadrants. Lighter colored areas around lines indicate the standard error of the mean. (C) Screening of MBON drivers for behavioral valence. The red-light preference index (PI) was defined as: [(number of flies in illuminated quadrants) - (number of flies in non-illuminated quadrants)]/(total number of flies). For each 2-min experiment, the overall PI was calculated by averaging the PIs from the final 5 s of each of the two red-lights-on conditions (namely, 55–60 s and 115–120 s). MBON cell types expressed in each driver are shown in the matrix below the graph; collectively all the drivers covered 20 of the 22 MBON types. MBON-γ3 and MBON-γ3β′1 are listed together, because these MBON cell types are always labeled together in our split-GAL4 lines. Driver lines shown in bold were selected for more detailed experiments. MBONs have been grouped by cell body cluster, neurotransmitter and color-coded as indicated (see Table 1). The bottom and top of each box represents the first and third quartile, and the horizontal line dividing the box is the median. The whiskers represent the 10th and 90th percentiles. The gray rectangle spanning the horizontal axis indicates the interquartile range of the control. Relative expression levels in individual cell types were estimated by confocal microscopy of brains stained for CsChrimson-mVenus and are shown in gray scale (See ‘Materials and methods’; Figure 3 and Figure 3—figure supplements 1,2 show confocal images). Statistical tests are described in methods: *, p < 0.05; **, p < 0.01; ***, p < 0.001; n = 11–29 for GAL4/CsChrimson; n = 67 for control.
Figure 3 with 2 supplements
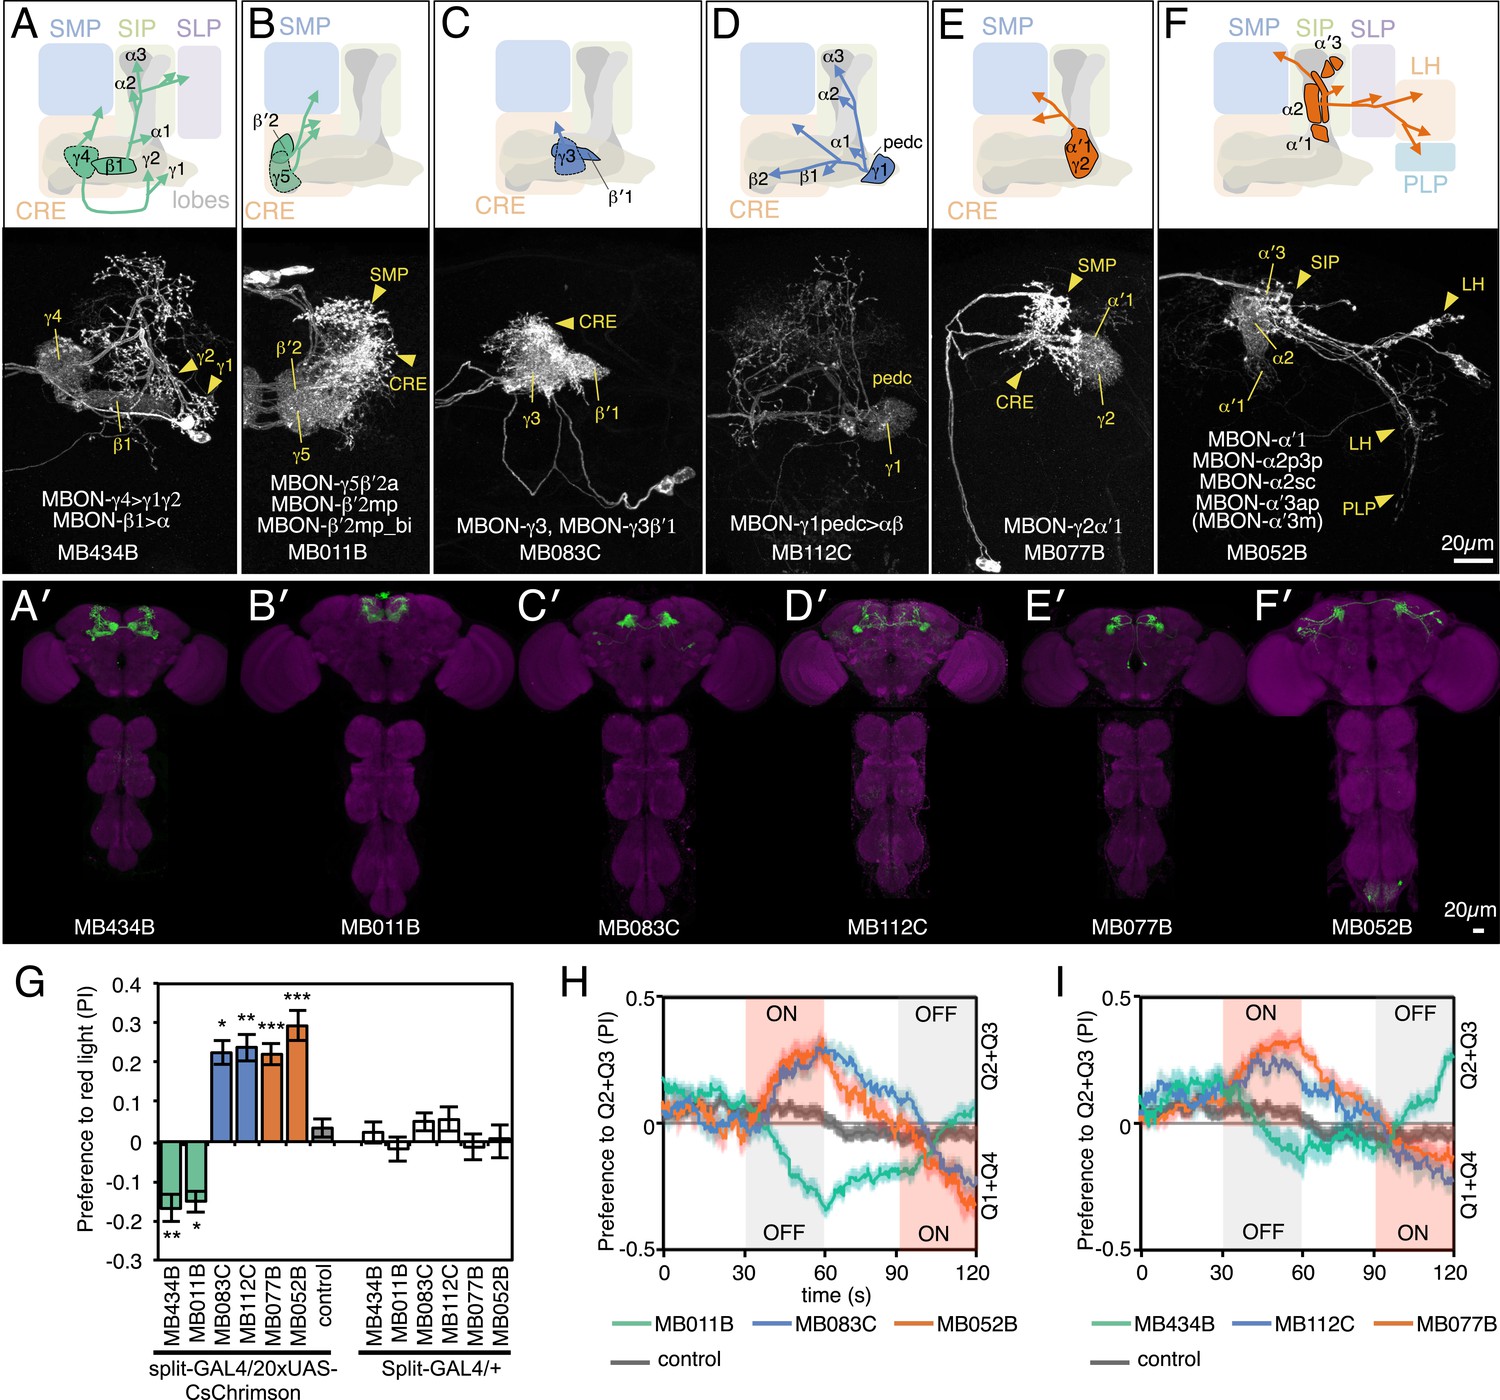
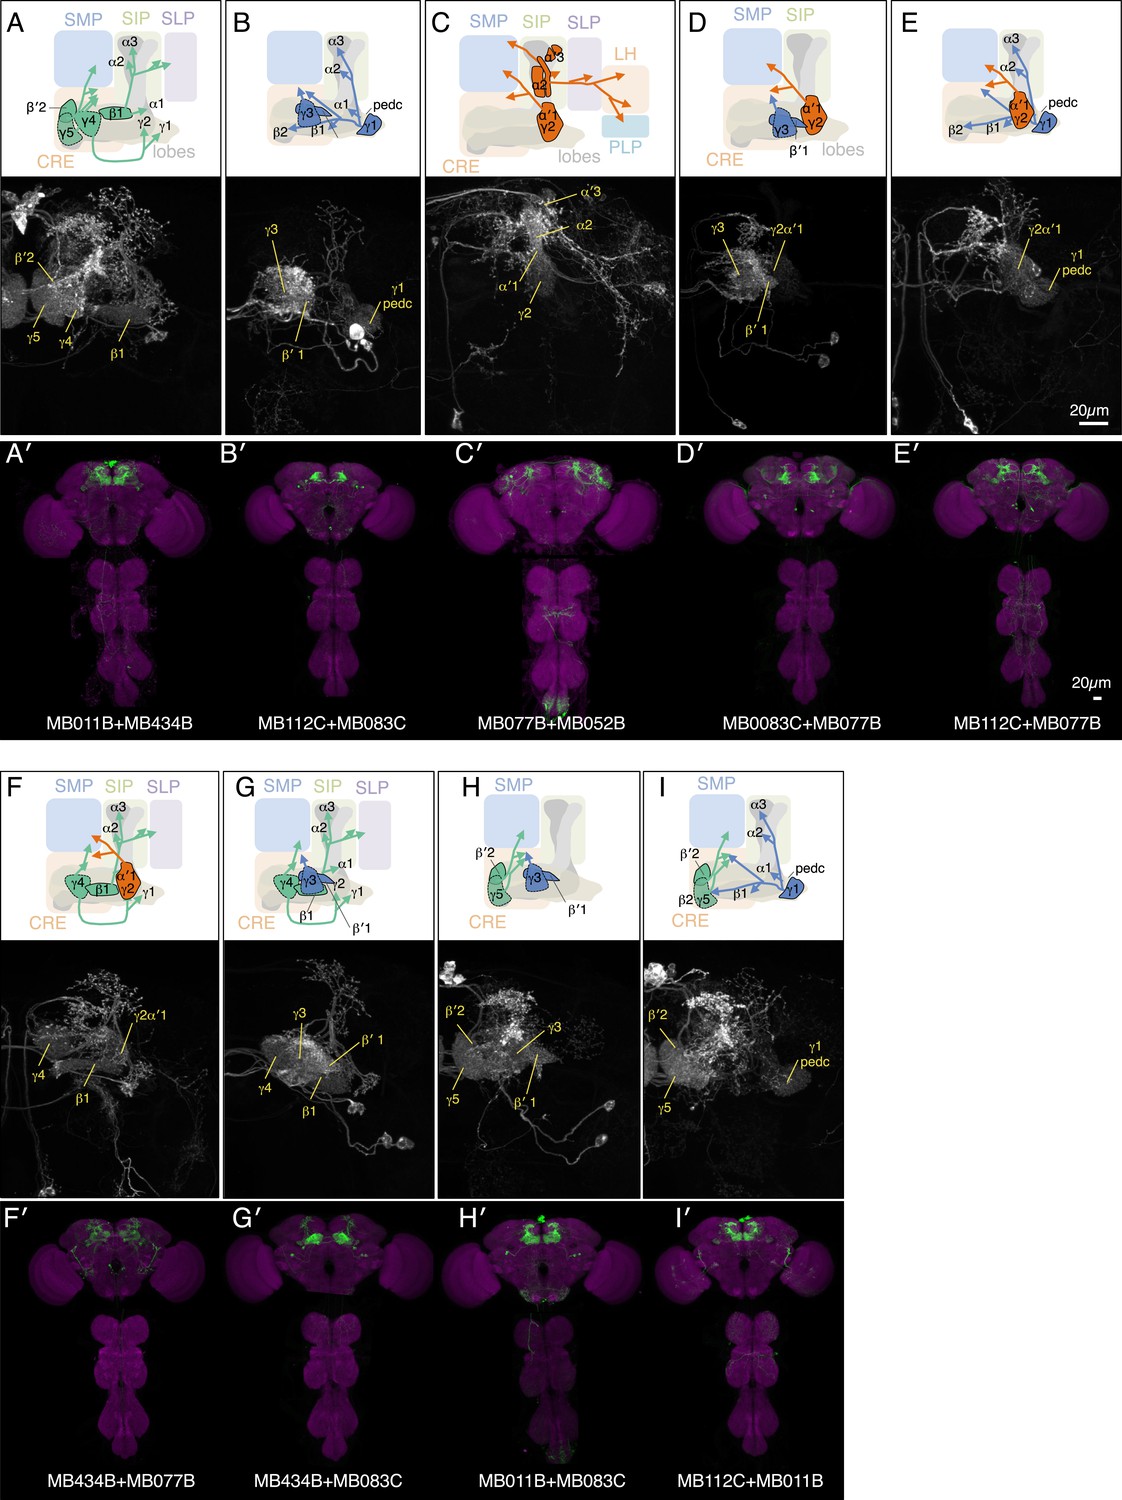
MBONs for attraction and repulsion.
(A–F) Anatomy of MBONs in six selected drivers. Top: Diagrams of the cell types that show expression with each driver, color-coded by neurotransmitter. The name of the split-GAL4 driver line and the cell type(s) in which it expresses are given at the bottom of each panel. The positions of their dendrites in the MB lobes are indicated; the arrows show the projections of their axons. Bottom: Confocal images of a single brain hemisphere for each line; MB compartments occupied by the dendrites of the MBONs in each line are labeled and the arrowheads indicate the sites of their synaptic terminals. See Figure 1 legend for abbreviations. Full confocal stacks of these images are available at www.janelia.org/split-gal4. (A′–F′) Expression patterns of the same drivers shown in a complete brain and ventral nerve cord: green, expression of CsChrimson-mVenus; magenta, neuropil reference stain (nc82 antibody). Frontal views of maximum intensity projections are shown. See the accompanying manuscript (Aso et al., 2014) for a detailed description of the morphology of each cell type. (G) The preference index (PI) for each experimental group (split-GAL4/CsChrimson) was compared with split-GAL4/+ and pBDPGAL4U/CsChrimson controls. Bars and error bars indicate mean and standard error of the mean respectively. Asterisk indicates significance: *, p < 0.05; **, p < 0.01; ***, p < 0.001. (H–I) Time course of the preference index. See legend to Figure 2 for more explanation. Data for six drivers and control are displayed in two panels for clarity, color-coded as indicated.
Figure 3—figure supplement 1

Expression patterns of split-GAL4s with UAS-CsChrimson.
(A–I) Anatomy of MBONs in additional split-GAL4 drivers. See legend to Figure 3A–F for explanation. The neurotransmitter used by MBON-calyx has not been determined. Full confocal stacks of these images are available at www.janelia.org/split-gal4.
Figure 3—figure supplement 2

Expression patterns of split-GAL4s with UAS-CsChrimson.
(A–J) Anatomy of MBONs in additional split-GAL4 drivers. See legend to Figure 3A–F for explanation. Full confocal stacks of these images are available at www.janelia.org/split-gal4.
Figure 4 with 1 supplement
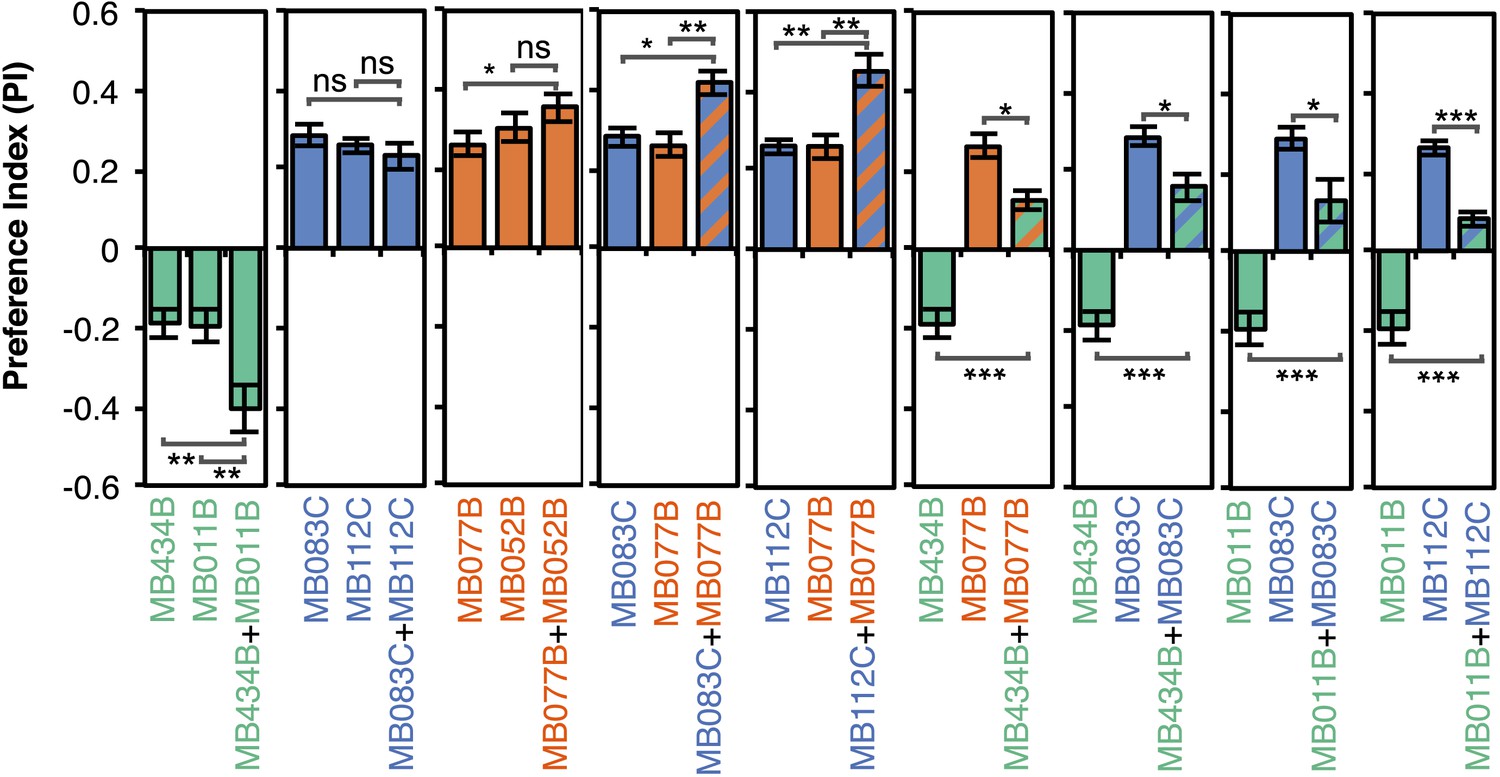
Additive effects of MBONs for attraction and repulsion.
PIs of individual drivers and combinations of drivers are shown when tested by the protocol shown in Figure 2A. The expression patterns of the combination drivers are shown in Figure 4—figure supplement 1. Bar graphs are color coded by the transmitter of the MBONs. To facilitate comparisons, data for some genotypes are shown in more than one panel. Asterisk indicates significance: *, p < 0.05; **, p < 0.01; ***, p < 0.001.
Figure 4—figure supplement 1
Expression patterns of split-GAL4 combinations.
(A–I) Expression patterns of combined split-GAL4 drivers. See legend to Figure 3A–F for explanation. Combination drivers carry four hemi-drivers, the two found in each of the two indicated split-GAL4 lines. In the cases shown, all the MBON cell types seen in each of the parent split-GAL4 lines are seen in the combination lines. However, the combination lines can also form dimers of hemi-drivers not found in either parent and additional off-target cells are observed in most combination lines.
Figure 5 with 1 supplement
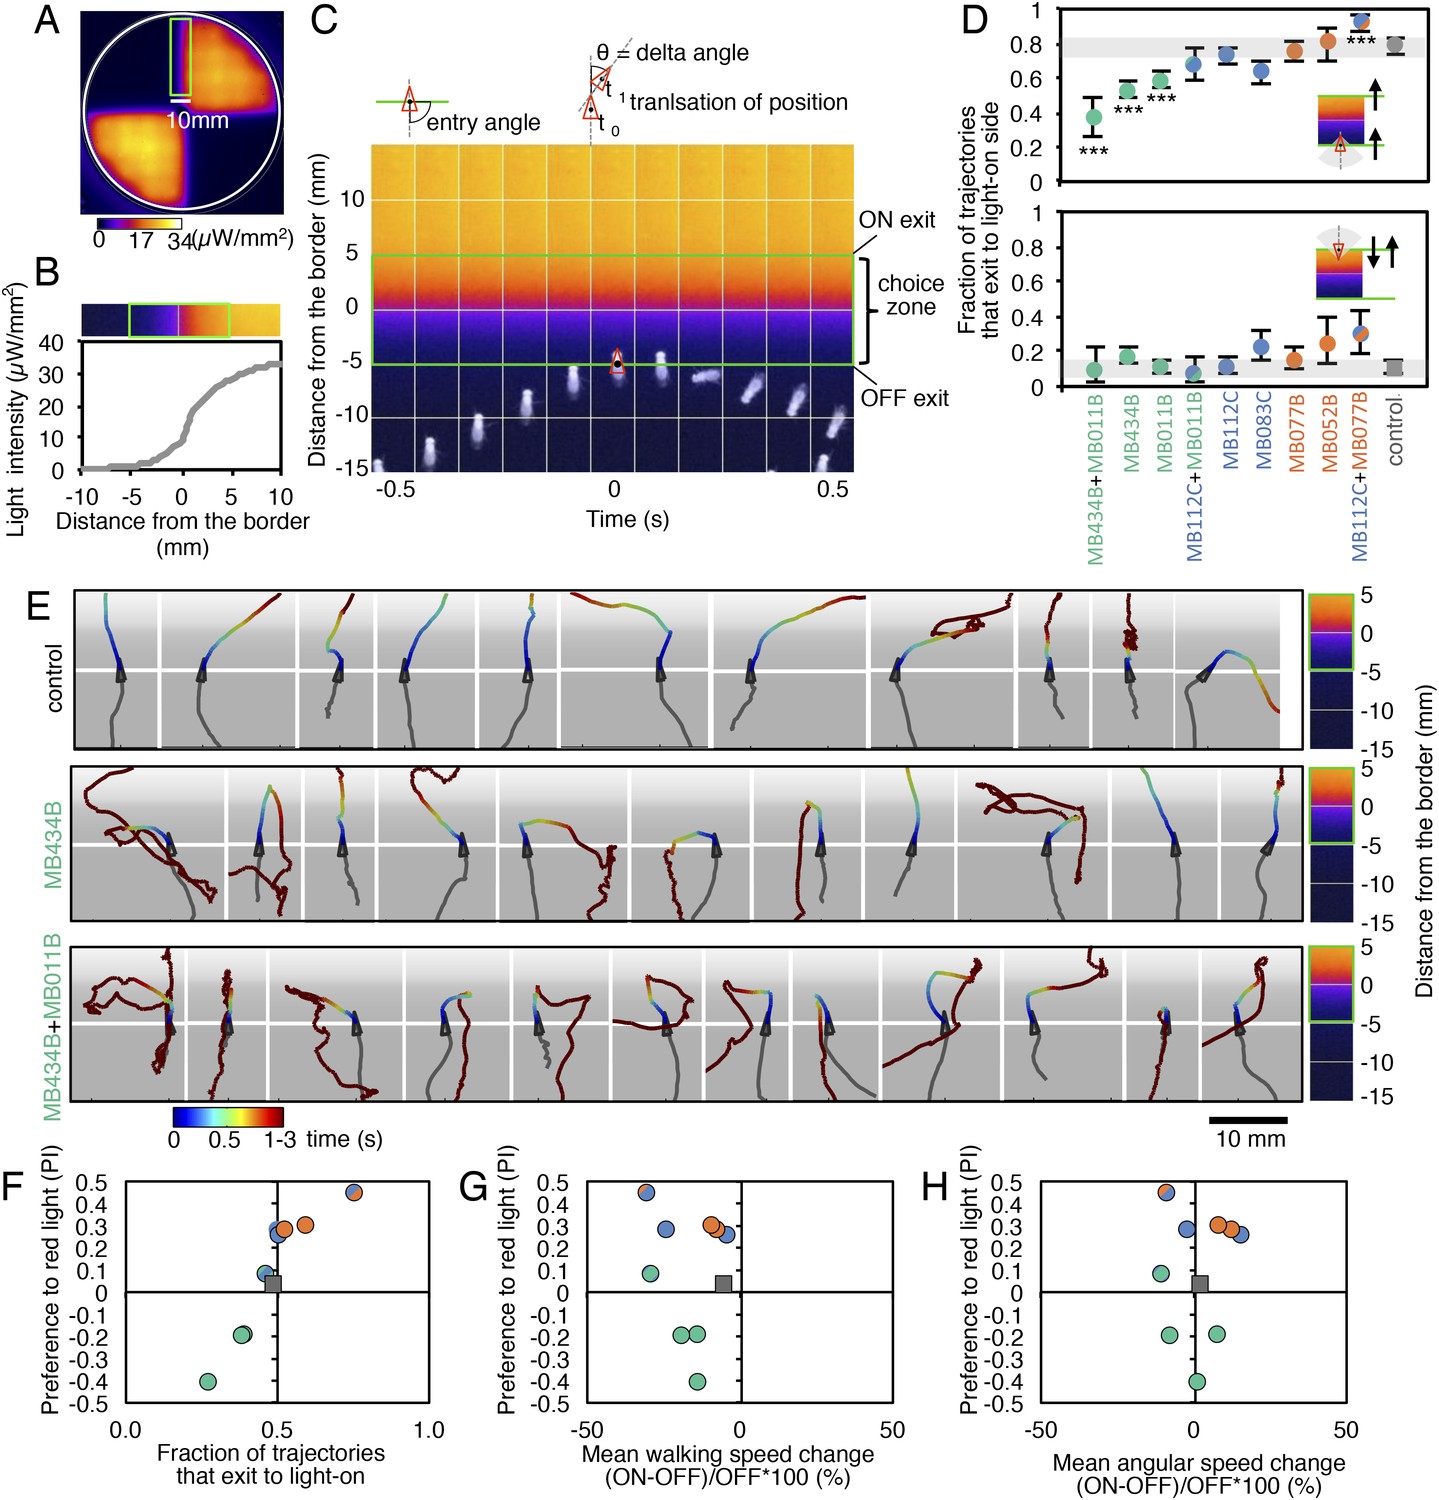
MBONs bias choice at the border.
(A) Pseudo-colored light intensity in the behavioral arena. The choice zone was defined as ± 5 mm from the light ON/OFF border (green box). (B) Gradient of light intensity across the light ON/OFF border axis shown. (C) An example of MB434B + MB011B/UAS-CsChrimson fly that entered the choice zone from the light-off side at time = 0 and then stopped and quickly turned around to exit the choice zone, going back into the light-off side. Eleven images taken at 0.1 s intervals have been superimposed. Entry angle to the choice zone was defined as diagramed (top left). Speed and angular speed was calculated based on the difference in the position of a fly in successive frames of 30 frames per second video recordings. (D) The fraction of trajectories entering the choice zone from the dark side and then exiting to the illuminated side is plotted for the indicated drivers in combination with CsChrimson (top). The control genotype was the empty driver, pBDPGAL4U, in attP2 in combination with 20xUAS-CsChrimson-mVenus in attP18. Only flies that entered the choice zone at an entry angle of between 45 and 135° (facing to the light ON/OFF border) and had moved more than 5 mm in the 1 s prior to entering the choice zone were analyzed. The error bars show the 95% confidence interval. Between 79 and 410 trajectories were analyzed per genotype. Compared to the control, MB434B + MB011B, MB434B and MB011B showed a significantly lower fraction of trajectories that exit to the light-on side (more avoidance of light), whereas significantly higher fraction of trajectories of MB112C + MB077B flies exit to the light-on side (more attraction to the light); multiple comparisons with the Dunn-Sidak correction: ***, p < 0.001. Similarly, the fraction of trajectories entering the choice zone from the illuminated side and then changing direction so as to also exit to the illuminated side is plotted for the indicated drivers in combination with CsChrimson (bottom). Between 43 and 280 trajectories were analyzed per genotype. (E) Representative trajectories are shown for the indicated genotypes. The trajectories are color-coded to indicate the position of the fly in the trajectory as a function of time after entering the choice zone. The triangle shows the position of the fly at time = 0, when flies entered into the choice zone (indicated by the white line at −5 mm from the light ON/OFF border). The gray scale background in the panels and pseudo-color scale on the right indicate the intensity of CsChrimson activating light. (F) Preference index to the CsChrimson-activating light (Figure 4) was plotted against the fraction of trajectories that exit from the choice zone to the illuminated side irrespective of side of entry: [(number of trajectories enter to the choice zone from dark side and then exit to illuminated side) + (number of trajectories enter to the choice zone from illuminated side and then exit to illuminated side)] divided by total number of trajectories that entered into the choice zone. They were highly correlated (Spearman's rank-order correlation: Pearson r = 0.91; R square = 0.83; p < 0.001). Genotypes are the same as in panel D and are shown with same color code. (G) Preference index to the CsChrimson light (Figure 4) was plotted against the mean walking speed change in the illuminated quadrants compared to dark quadrants (see Figure 5—figure supplement 1). There was no significant correlation (Spearman's rank-order correlation: Pearson r = 0.13; R square = 0.01; p = 0.72). Genotypes are the same as in panel D and are shown with same color code. (H) Preference index to the CsChrimson light (Figure 4) was plotted against mean angular speed in the illuminated quadrants compared to dark quadrants (see Figure 5—figure supplement 1). There was no significant correlation (Spearman's rank-order correlation: Pearson r = 0.12; R square = 0.001; p = 0.75). Genotypes are the same as in panel D and are shown with same color code.
Figure 5—figure supplement 1
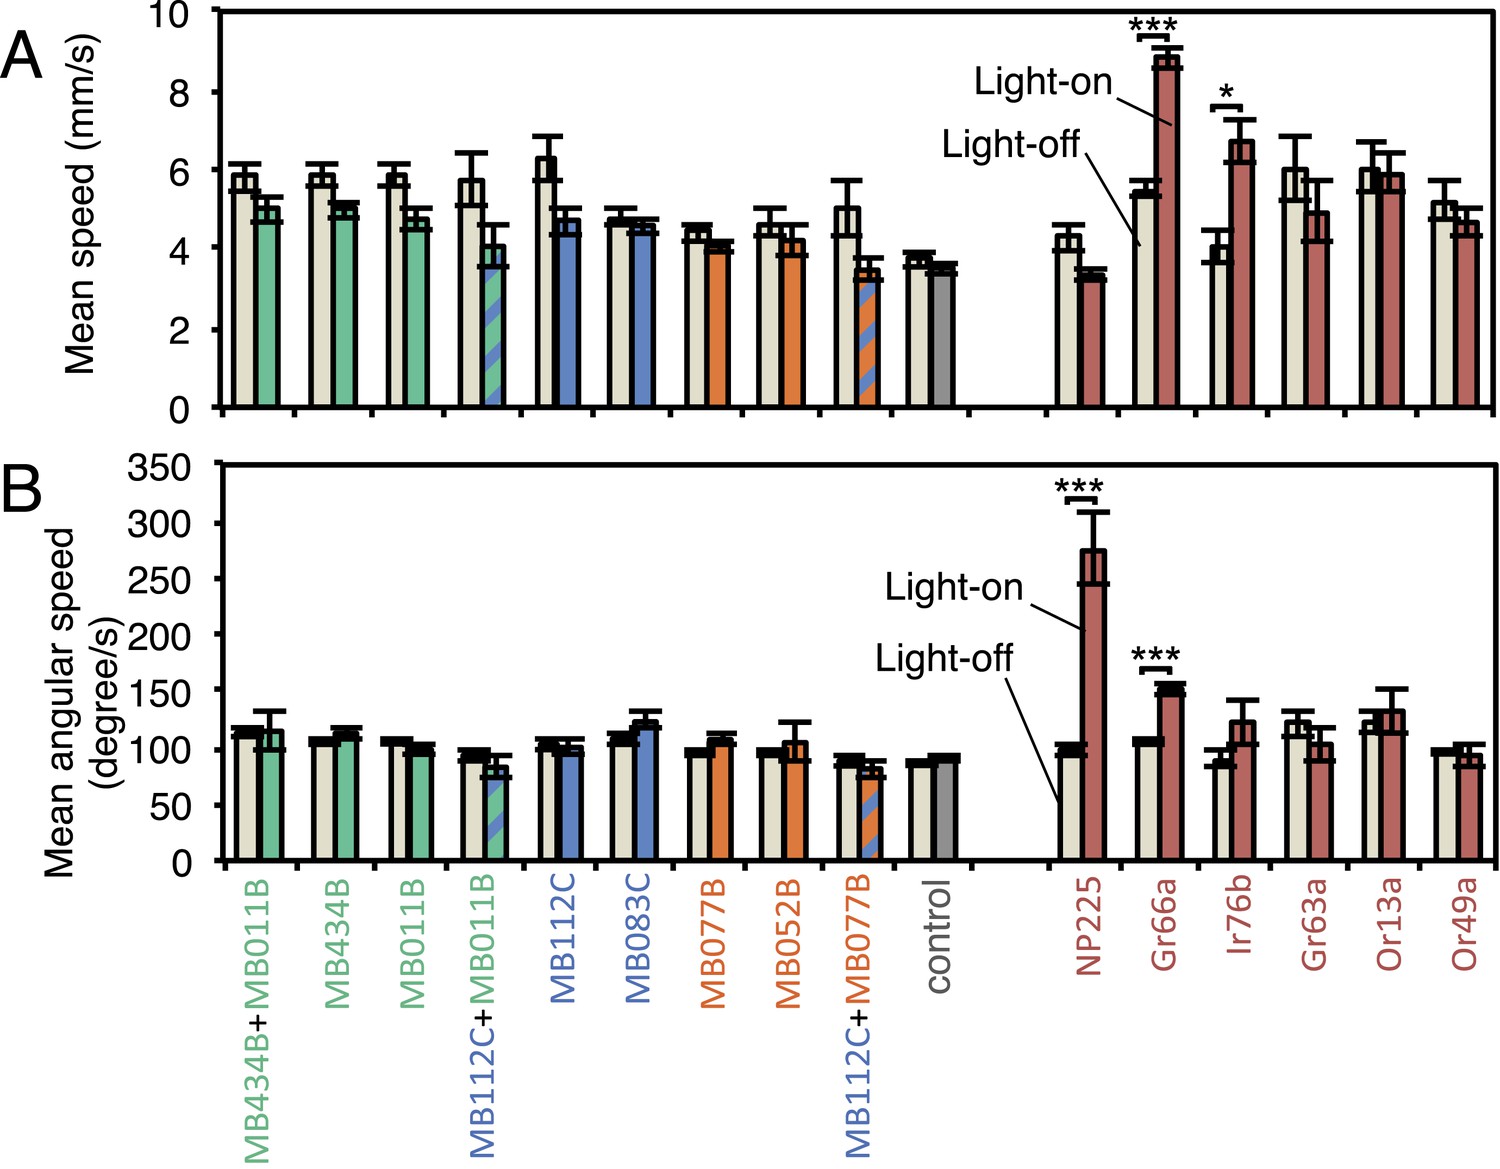
MBON activation has only small effects on walking and angular speeds.
Walking speed (A) and angular speed (B) was calculated for individual trajectories, then averaged separately for all flies on dark and all flies on illuminated quadrants during the two 30 s light-on segments of one video (see Figure 2A). Approximately 20 flies were analyzed in each video. Bars and error bars show mean and standard error of the mean for videos (n = 11-43 for experimental groups; n = 66 for the pBDPGAL4U empty driver control). For comparison to the MBONs, values obtained with GAL4 drivers for other cell-types are shown: NP225, broad expression in antennal lobe projection neurons (Tanaka et al., 2004); Gr66a-GAL4, bitter taste receptor neurons (Dunipace et al., 2001); Ir76b-GAL4, co-receptor for ionotorpic receptors (Benton et al., 2009; Silbering et al., 2011); Gr63a-GAL4, CO2 receptor neurons (Dunipace et al., 2001); Or13a-GAL4 and Or49a-GAL4, olfactory receptor neurons (Fishilevich and Vosshall, 2005). Asterisk indicates significance (Kruskal–Wallis one-way analysis of variance followed by Dunns post-test) for comparison between light-off (left bar) and light-on (right bars) for the same genotype: *, p < 0.05; ***, p < 0.001. We found a weak correlation (Spearman's rank-order correlation: Pearson r = −0.60; R square = 0.36; p = 0.06) between absolute mean walking speed in illuminated quadrants and preference index to red light (Figure 4).
Figure 6 with 1 supplement
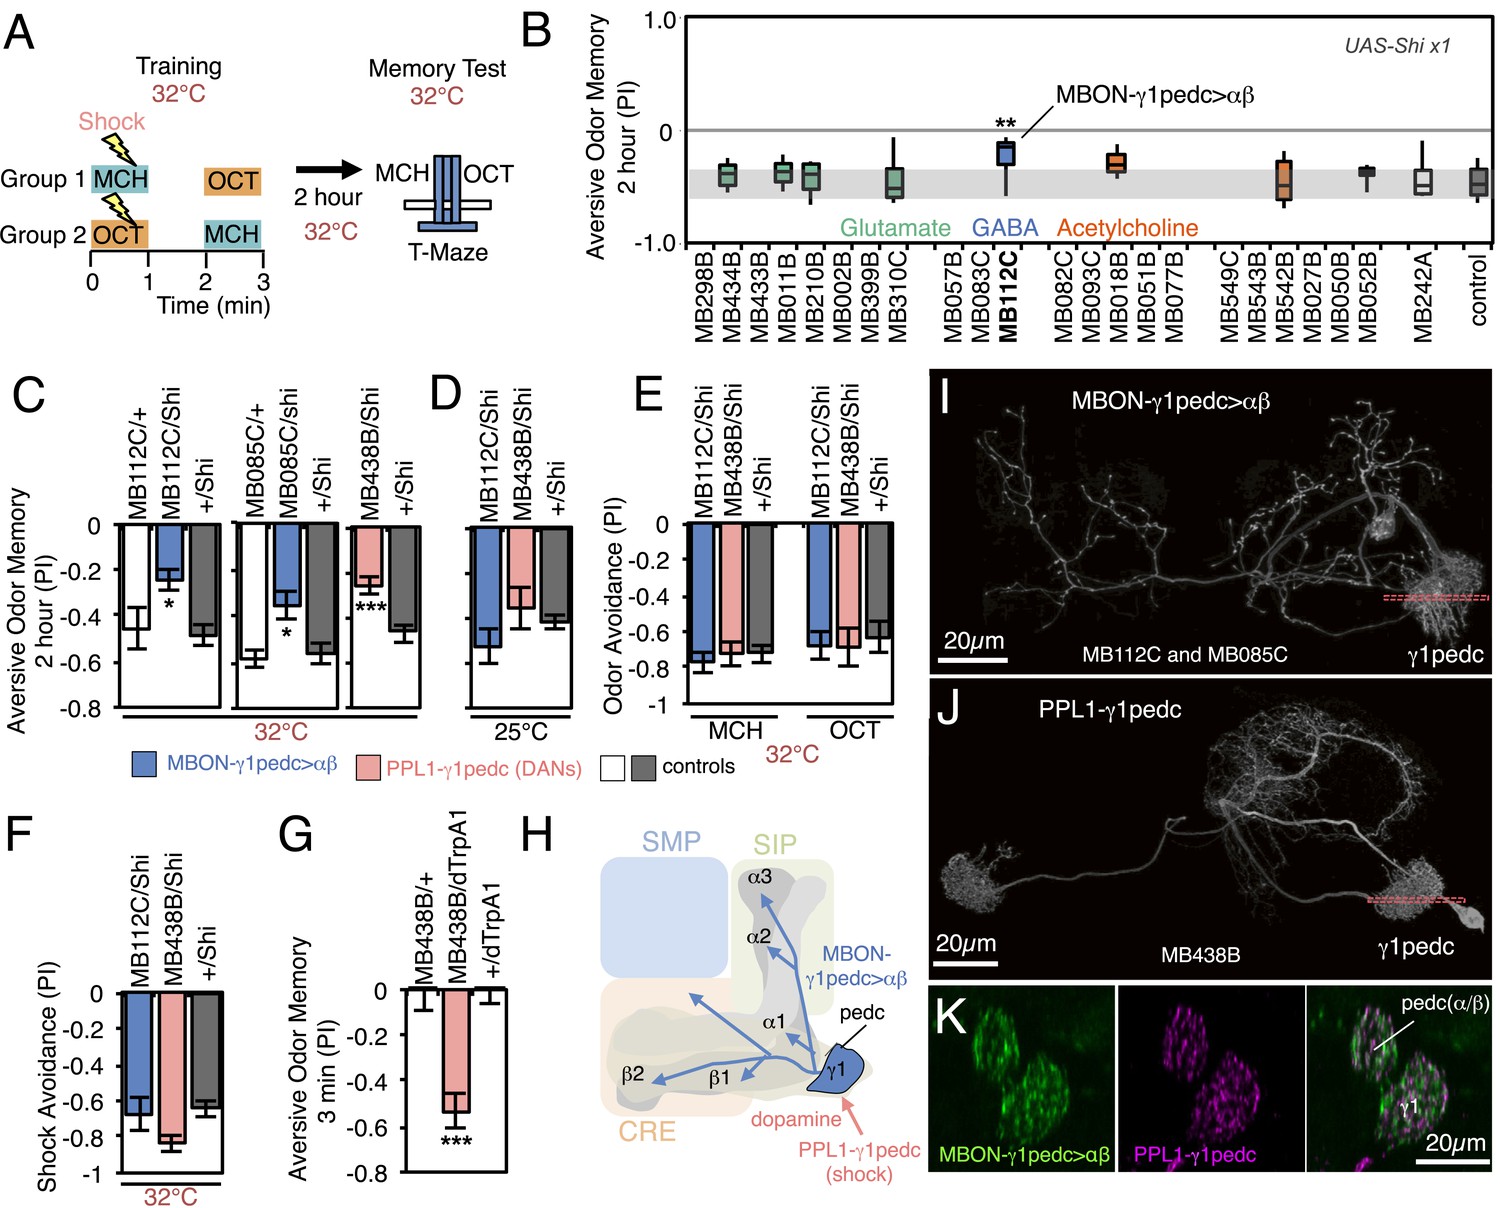
Requirement of MBONs for 2-hr aversive odor memory.
(A) Schematic of the T-maze apparatus. In one group of flies, 4-methylcyclohexanol (MCH) was paired with electric shocks for 60 s. After a 60 s pause, 3-octanol (OCT) was delivered without electric shock. For the reciprocal group, OCT was paired with electric shock, and MCH was delivered without shock. 2 hr after training, flies were given a choice between the two odors in a T-maze and their distribution was used to calculate a performance index (PI). The PI corresponds to the mean of the [(number of flies in the OCT tube minus number of flies in the MCH tube)/total number of flies when OCT was paired with electric shock] and [(number of flies in the MCH tube minus number of flies in the OCT tube)/total number of flies when MCH was paired with electric shock]. The set of 23 driver lines was first screened using pJFRC100-20XUAS-TTS-Shibire-ts1-p10 (VK00005) as the Shits effector; lines that showed a strongly decreased PI in this initial screen were retested with the UAS-Shi x1 effector. (B) Results of secondary screening of MBONs for 2-hr aversive memory using UAS-Shi x1. MBONs have been grouped by neurotransmitter and color-coded. The bottom and top of each box represents the first and third quartile, and the horizontal line dividing the box is the median. The whiskers represent the 10th and 90th percentiles. The gray rectangle spanning the horizontal axis indicates the interquartile range of the control. Statistical tests are described in methods: **, p < 0.01. (C) 2-hr aversive odor memory at the restrictive temperature. In addition to confirming the result obtained with MB112C in the screening assays, a second driver line for MBON-γ1pedc>α/β, (MB085C) was tested and found to have a similar impairment. Blocking dopaminergic input to the MB compartments where the dendrites of MBON-γ1pedc>α/β reside, using MB438B, also impairs 2-hr aversive odor memory. UAS-Shi x1 was used as the effector. See Figure 6—figure supplement 1 for the expression patterns of the MB112C, MB085C and MB438B drivers. Bars and error bars show mean and standard error of the mean (SEM). Statistical tests are described in methods: *, p < 0.05; ***, p < 0.001. (D) 2-hr aversive odor memory in MB112C/Shi and MB438B/Shi flies is not impaired at the permissive temperature. UAS-Shi x1 was used as the effector. (E) Avoidance of MCH and OCT in untrained MB112C/Shi and MB438B/Shi flies is not impaired at the restrictive temperature, indicating that these genotypes can detect and respond to the odors. UAS-Shi x1 was used as the effector. (F) Shock avoidance in untrained MB112C/Shi and MB438B/Shi flies is not impaired at the restrictive temperature. UAS-Shi x1 was used as the effector. (G) Activation of the PPL1-γ1pedc dopaminergic neurons can substitute for electric shock as the unconditioned stimulus (US). Flies trained using thermoactivation of MB438B/dTrpA1 as the US showed robust 3 min aversive memory. (H) Diagram of a circuit module for aversive odor memory. MBON-γ1pedc>α/β is shown in blue. PPL1-γ1pedc conveys the US of electric shock (pink arrow). (I) Morphology of MBON-γ1pedc>α/β. A frontal view of maximum intensity projection of an image of a single cell generated by stochastic labeling using the multicolor flip-out technique (MCFO; Nern et al., in prep.) is shown. MBON-γ1pedc>α/β has dendrites in γ1 and the core of pedunclulus (pedc), where α/β KCs project. Its axon bilaterally innervates the α/β lobes and the pedc, and neighboring neuropils (SMP, SIP and CRE); see Figure 6—figure supplement 1 for more anatomical details. The orange dashed line indicates the plane of the cross section shown in (K) of the γ1 and the pedc. (J) Morphology of PPL1-γ1pedc. A frontal view of maximum intensity projection of an image of a single cell generated by MCFO is shown. PPL1-γ1pedc extends dendrites unilaterally in the SMP, SIP and CRE, and bilaterally innervates the γ1 and the pedc. The orange dashed line indicates the plane of the cross section of γ1 and the pedc shown in (K). (K) Double labeling of MBON-γ1pedc>α/β (green; R12G04-LexA, pJFRC216-13XLexAop2-IVS-myr::smGFP-V5 [su(Hw)attP8] and PPL1-γ1pedc (magenta; MB320C, pJFRC200-10XUAS-IVS-myr::smGFP-HA (attP18)). A coronal section is shown. The dendrites of MBON-γ1pedc>α/β and the terminals of PPL1-γ1pedc precisely overlap in γ1 and the pedc.
Figure 6—figure supplement 1
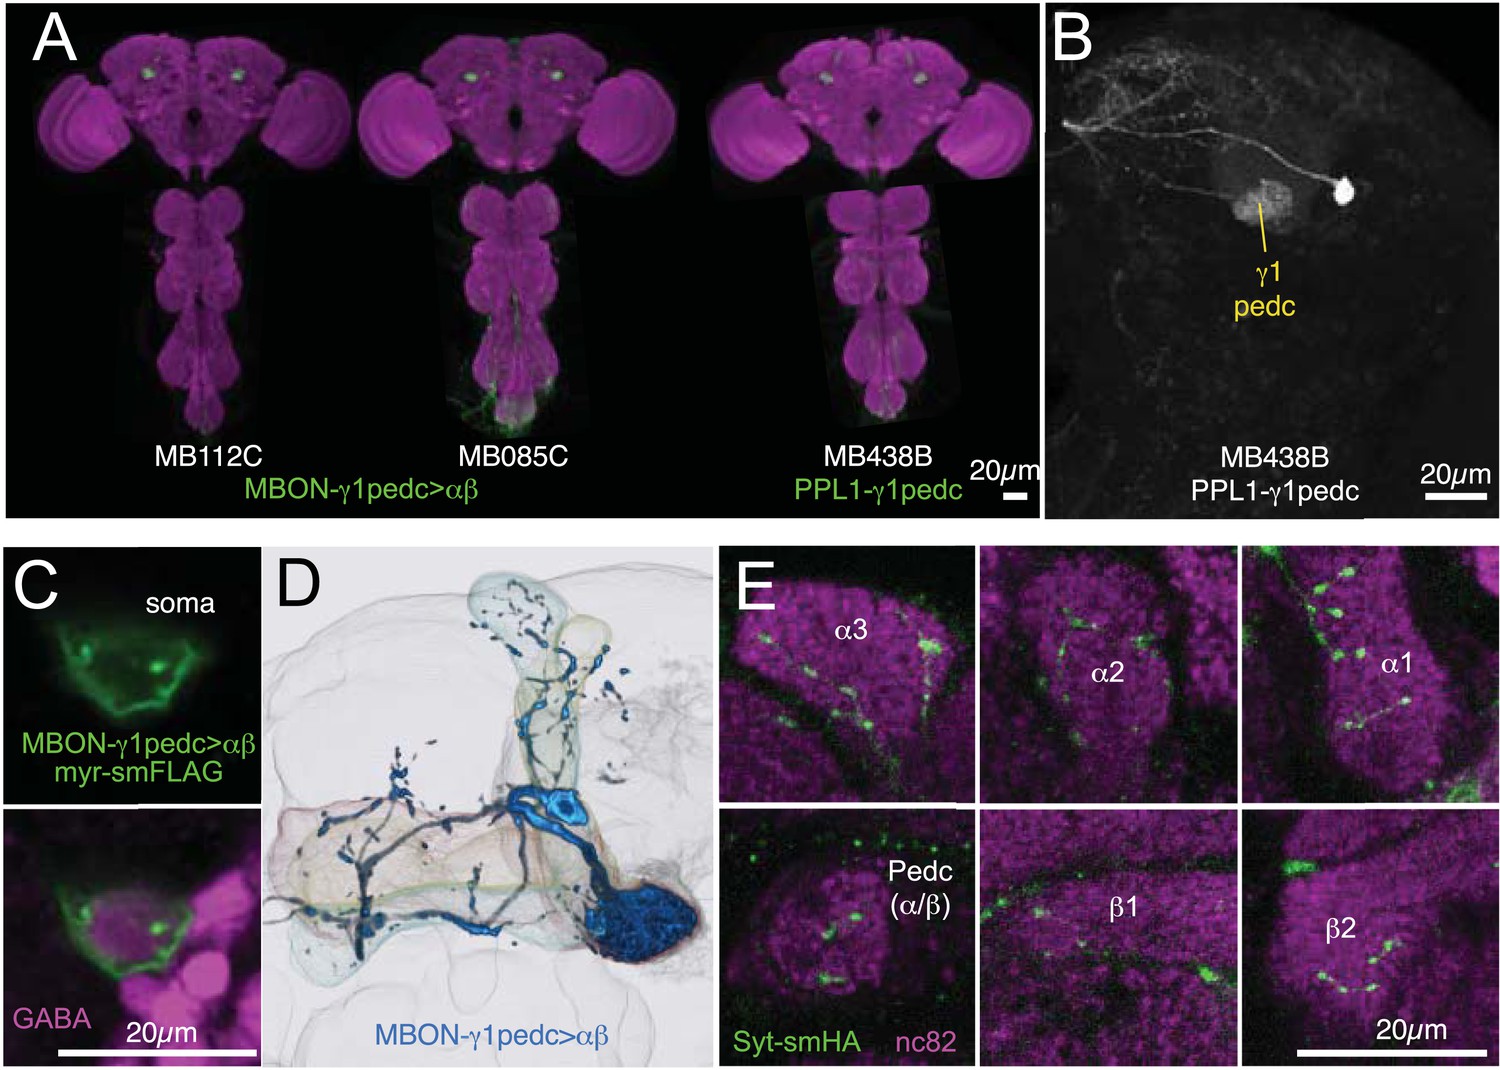
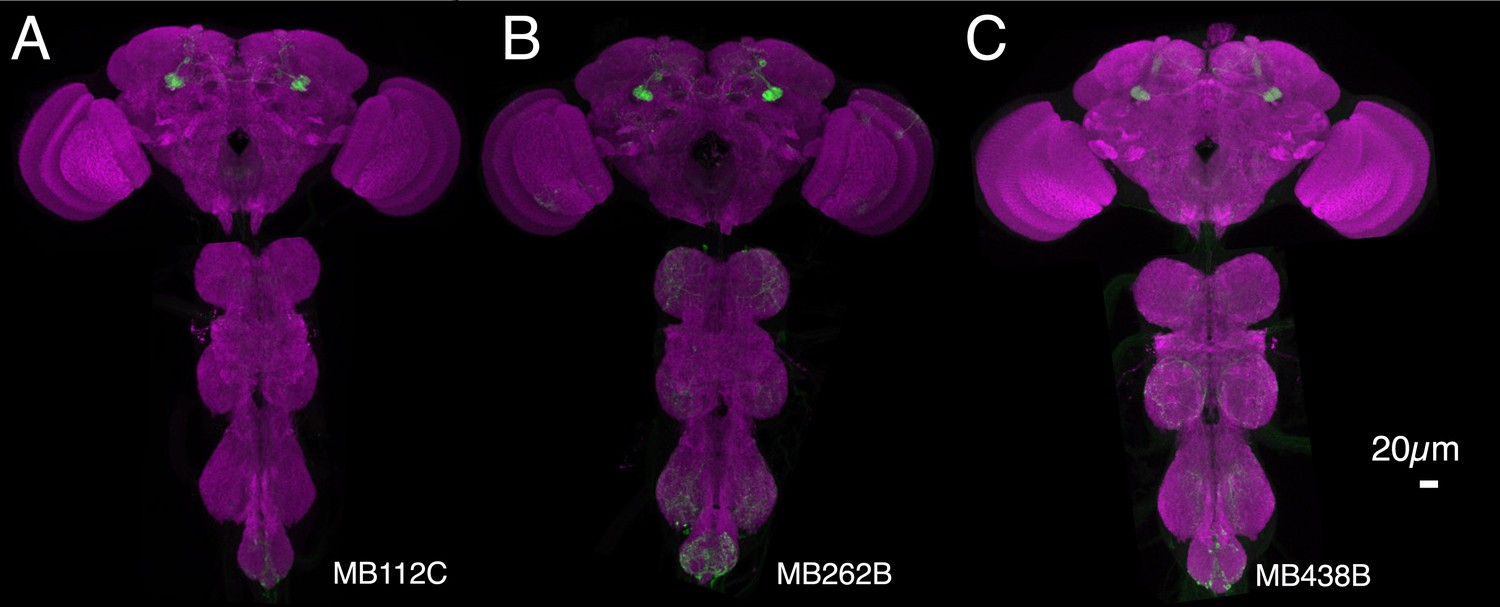
Anatomy of MBON-γ1pedc>α/β and PPL1-γ1pedc, an MBON-DAN pair essential for aversive memory.
(A) Expression patterns of MB112C and MB085C (MBON-γ1pedc>α/β) and MB438B (PPL1-γ1pedc; MB-MP1) as assessed with pJFRC2-10XUAS-IVS-mCD8::GFP (VK00005). The scale bar is 20 µm. Full confocal stacks of these images are available at www.janelia.org/split-gal4. (B) Confocal image of a single brain hemisphere showing the expression pattern of MB438B. (C) A cell body of MBON-γ1pedc>α/β (green; pJFRC225-5XUAS-IVS-myr::smGFP-FLAG (VK00005)) is immunoreactive to antibody to GABA (magenta). This result confirms the conclusion that this cell is GABAergic, as reported in the accompanying manuscript (Aso et al., submitted), based on anti-GAD1 staining. (D) Morphology of MBON-γ1pedc>α/β. (E) Terminals of MBON-γ1pedc>α/β in the α/β lobes and the core of distal pedunculus (green; pJFRC67-3XUAS-Syt-smHA [su(Hw)attP1]). Mushroom body lobes were visualized with nc82 (magenta).
Figure 7 with 1 supplement
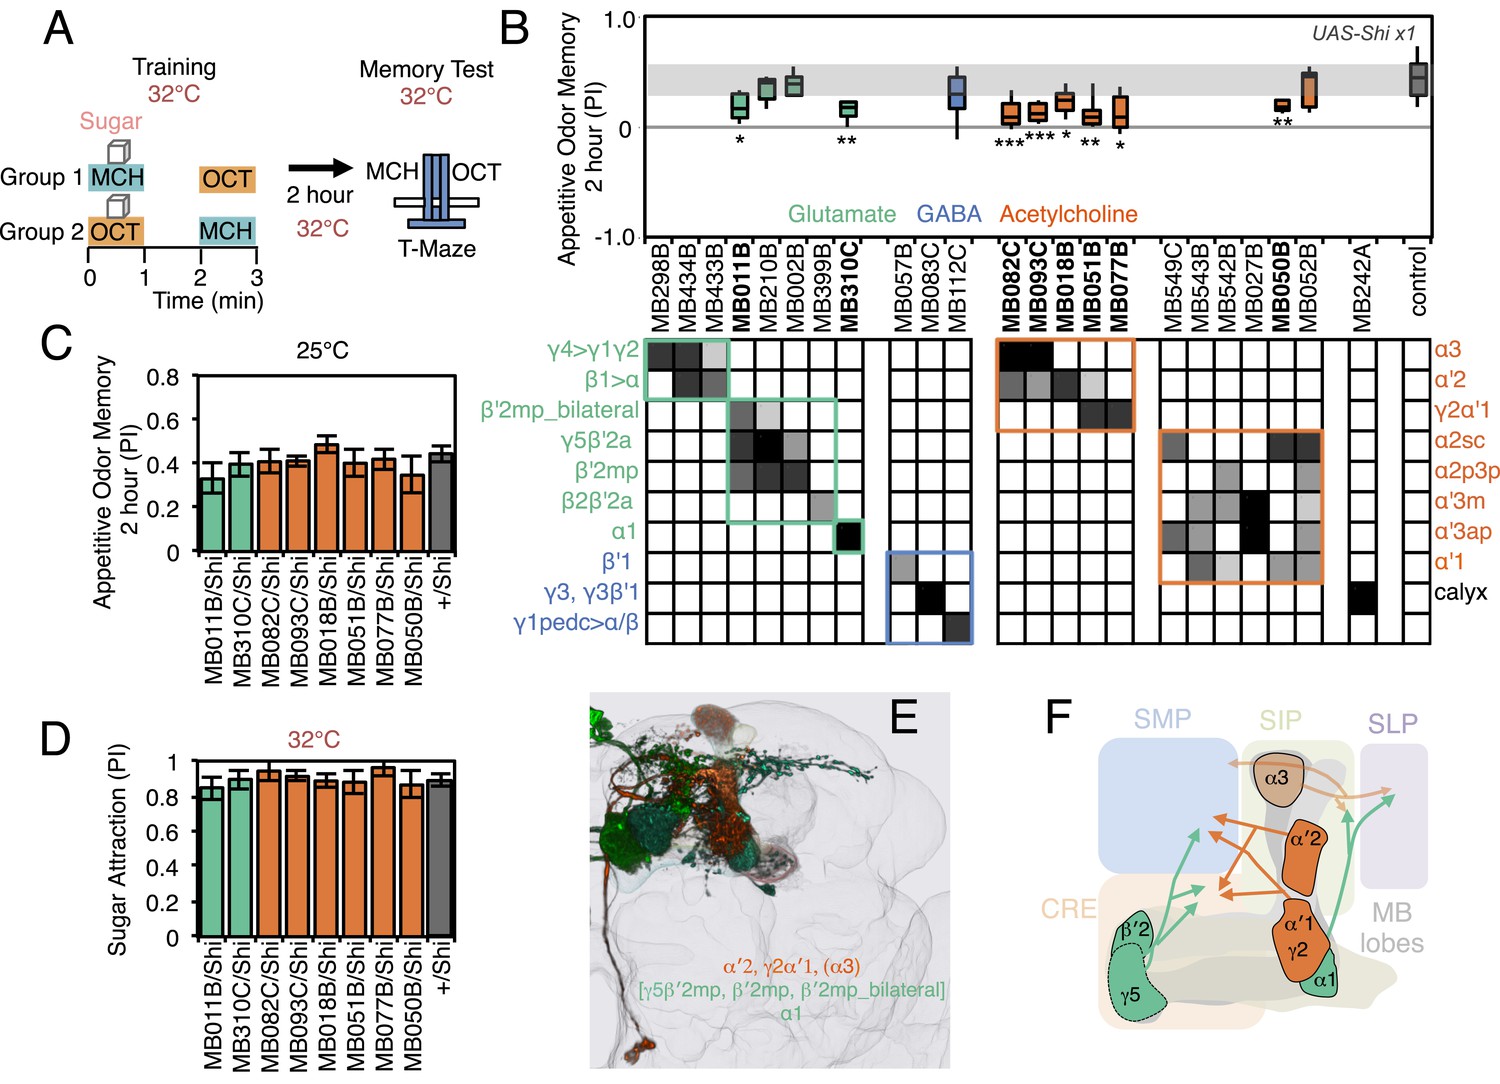
Requirement of MBONs for 2-hr appetitive odor memory.
(A) Flies were trained and tested in a similar way as in Figure 6A, except that flies were starved for 28–40 hr prior to experiments and trained with a reward consisting of a tube covered with sugar absorbed filter paper. (B) Results of secondary screening of MBONs for 2-hr appetitive memory using UAS-Shi x1. MBONs have been grouped by neurotransmitter and color-coded. The bottom and top of each box represents the first and third quartile, and the horizontal line dividing the box is the median. The whiskers represent the 10th and 90th percentiles. The gray rectangle spanning the horizontal axis indicates the interquartile range of the control. Statistical tests are described in methods: *, p < 0.05; **, p < 0.01; ***, p < 0.001. The relative expression levels produced by the split-GAL4 driver lines in each cell type (indicated by the gray scale) are based on imaging with pJFRC2-10XUAS-IVS-mCD8::GFP (VK00005). Images of the expression patterns of selected drivers are shown in Figure 7—figure supplement 1. MB082C and MB093C label the cholinergic MBON-α3; however, these lines also show weak labeling in MBON-α′2. As blocking MBON-α′2 alone also gave a significant phenotype (MB018B/Shi), we cannot rule out the formal possibility that the phenotype observed with MB082C and MB093C results from blocking MBON-α′2. MB050B labels MBON-α2 and MBON-α′1; however, because MB052B, which labels the same cell types in addition to others, did not give a phenotype, the requirement for these cell types is not resolved. (C) 2 hr appetitive odor memory at permissive temperature. (D) Sugar attraction in untrained flies at restrictive temperature. (E) Rendering of MBONs with outline of MB lobes and brain. MBONs grouped by square brackets represent cases where the available set of driver lines do not allow assigning an effect to a single cell type, but only to that set of MBONs. MBONs in parentheses represent cases where the data implicating them are only suggestive. (F) Diagram of MBONs for appetitive odor memory. MBONs are shown in lighter colors when data implicating them are only suggestive.
Figure 7—figure supplement 1
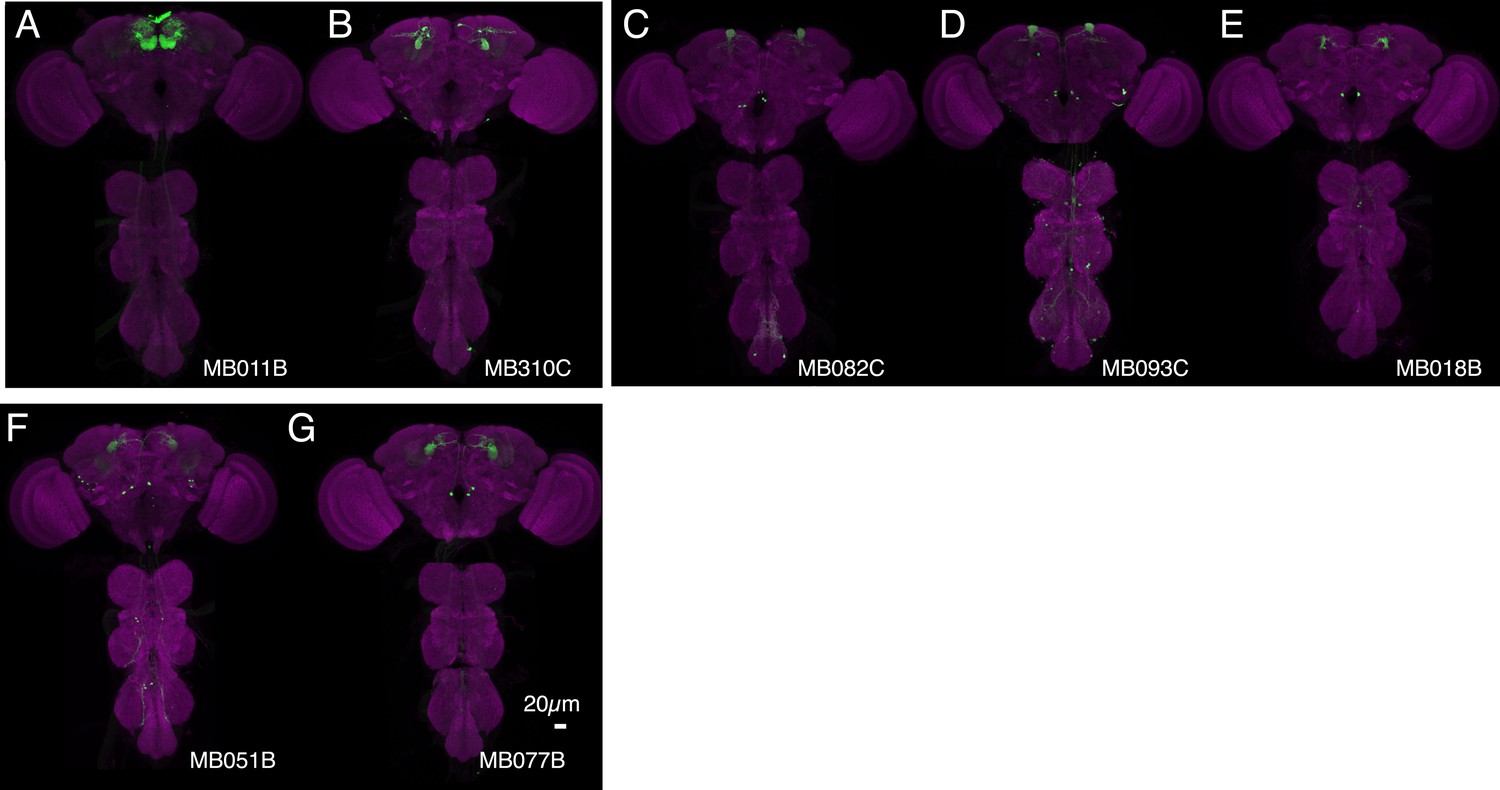
Expression patterns of split-GAL4s that caused appetitive odor memory phenotypes.
(A–G) Expression patterns of the indicated split-GAL4 driver lines as assessed with pJFRC2-10XUAS-IVS-mCD8::GFP (VK00005). Full confocal stacks of these images are available at www.janelia.org/split-gal4.
Figure 8 with 1 supplement
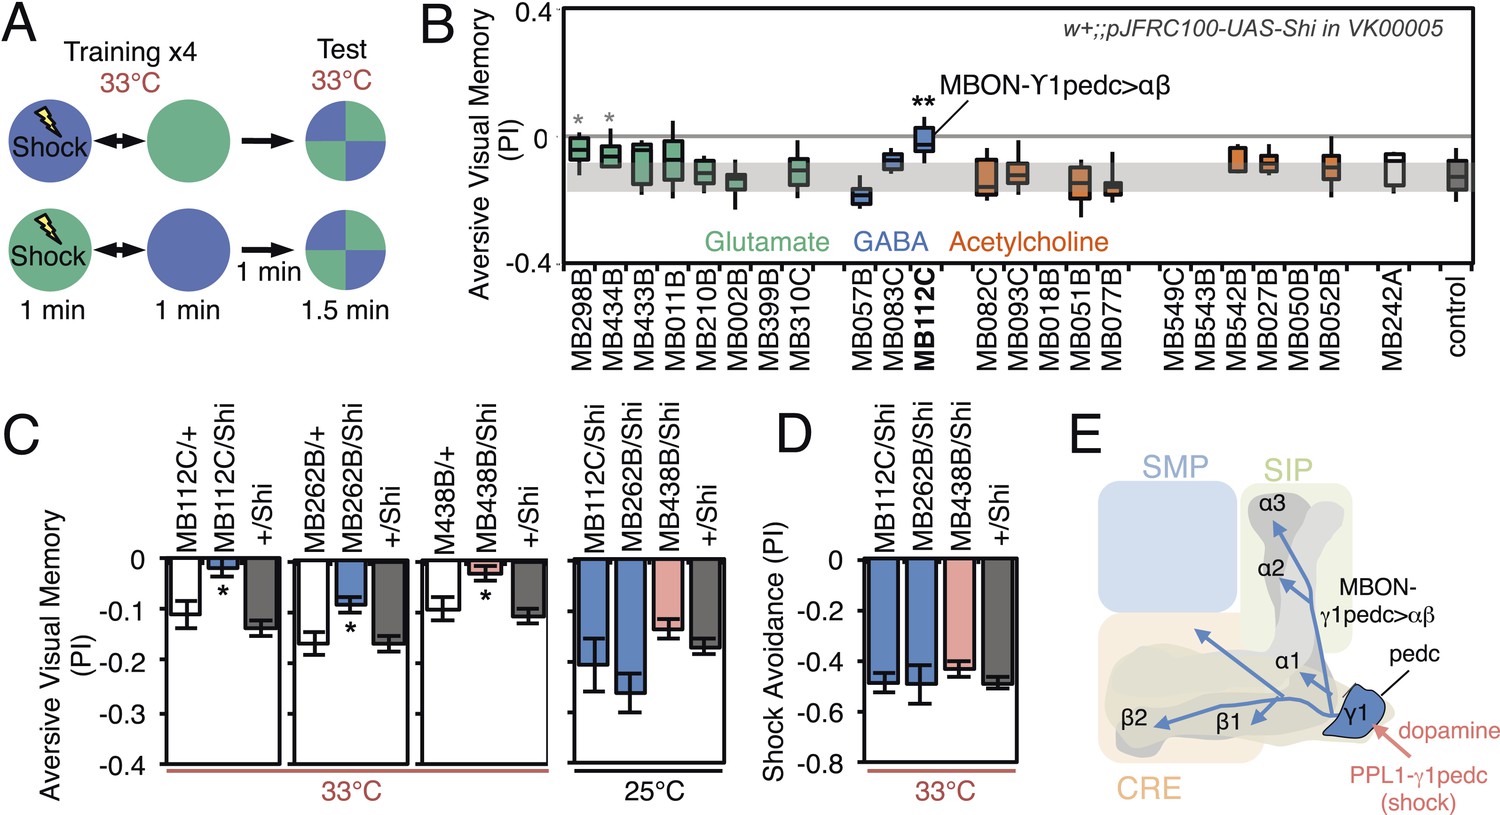
Requirement of MBONs for aversive visual memory.
(A) Diagram of the training protocol used for aversive visual conditioning. Groups of 30–40 flies were trained in a circular arena with green or blue LED light and electric shock in a reciprocal manner, as in olfactory conditioning. Training was repeated four times and memory was tested immediately after the last training session. The PI corresponds to the mean of the [(number of flies in the blue quadrant minus number of flies in green quadrant)/total number of flies when blue was paired with electric shock] and [(number of flies in the green quadrant minus number of flies in the blue tube)/total number of flies when green was paired with electric shock]; See ‘Materials and methods’ for more detail. (B) Results for the requirement of MBONs in aversive visual conditioning. pJFRC100-20XUAS-TTS-Shibire-ts1-p10 (VK00005) was used to block synaptic transmission. Flies were trained and tested at the restrictive temperature. MBONs have been grouped by neurotransmitter and color-coded. The bottom and top of each box represents the first and third quartile, and the horizontal line dividing the box is the median. The whiskers represent the 10th and 90th percentiles. The gray rectangle spanning the horizontal axis indicates the interquartile range of the control. Statistical tests are described in methods: *, p < 0.05; **, p < 0.01. The two lines marked with gray asterisks failed one of the control assays: MB434B/Shi did not differ significantly from MB434B/+ and MB298B had altered color preference. One line, MB112C, with significantly impaired memory passed all control assays (see panel C). (C) Blocking MBON-γ1pedc>α/β with either of two split-GAL4 lines (MB262B and MB112C) caused significant visual memory impairment compared to GAL4/+ and +/Shi controls. Blocking the output of PPL1-γ1pedc dopaminergic neurons (MB438B) also resulted in a strong defect. Split-GAL4/Shi flies were not impaired at the permissive temperature compared to +/Shi. Bars and error bars show mean and standard error of the mean. (D) Electric shock avoidance in untrained flies was not impaired at restrictive temperature compared to +/Shi. Bars and error bars show mean and standard error of the mean. (E) Diagram of the MB circuit for aversive visual memory. The GABAergic MBON-γ1pedc>α/β is required for conditioned color preference. The dopaminergic PPL1- γ1pedc neurons terminate in the same compartments where the dendrites of MBON-γ1pedc>α/β are found; they likely convey the electric shock punishment signal.
Figure 8—figure supplement 1
Expression patterns of split-GAL4s that caused aversive visual memory phenotypes.
(A–C) Expression patterns of the indicated split-GAL4 drivers as assessed with pJFRC2-10XUAS-IVS-mCD8::GFP (VK00005). Full confocal stacks of these images are available at www.janelia.org/split-gal4.
Figure 9 with 1 supplement
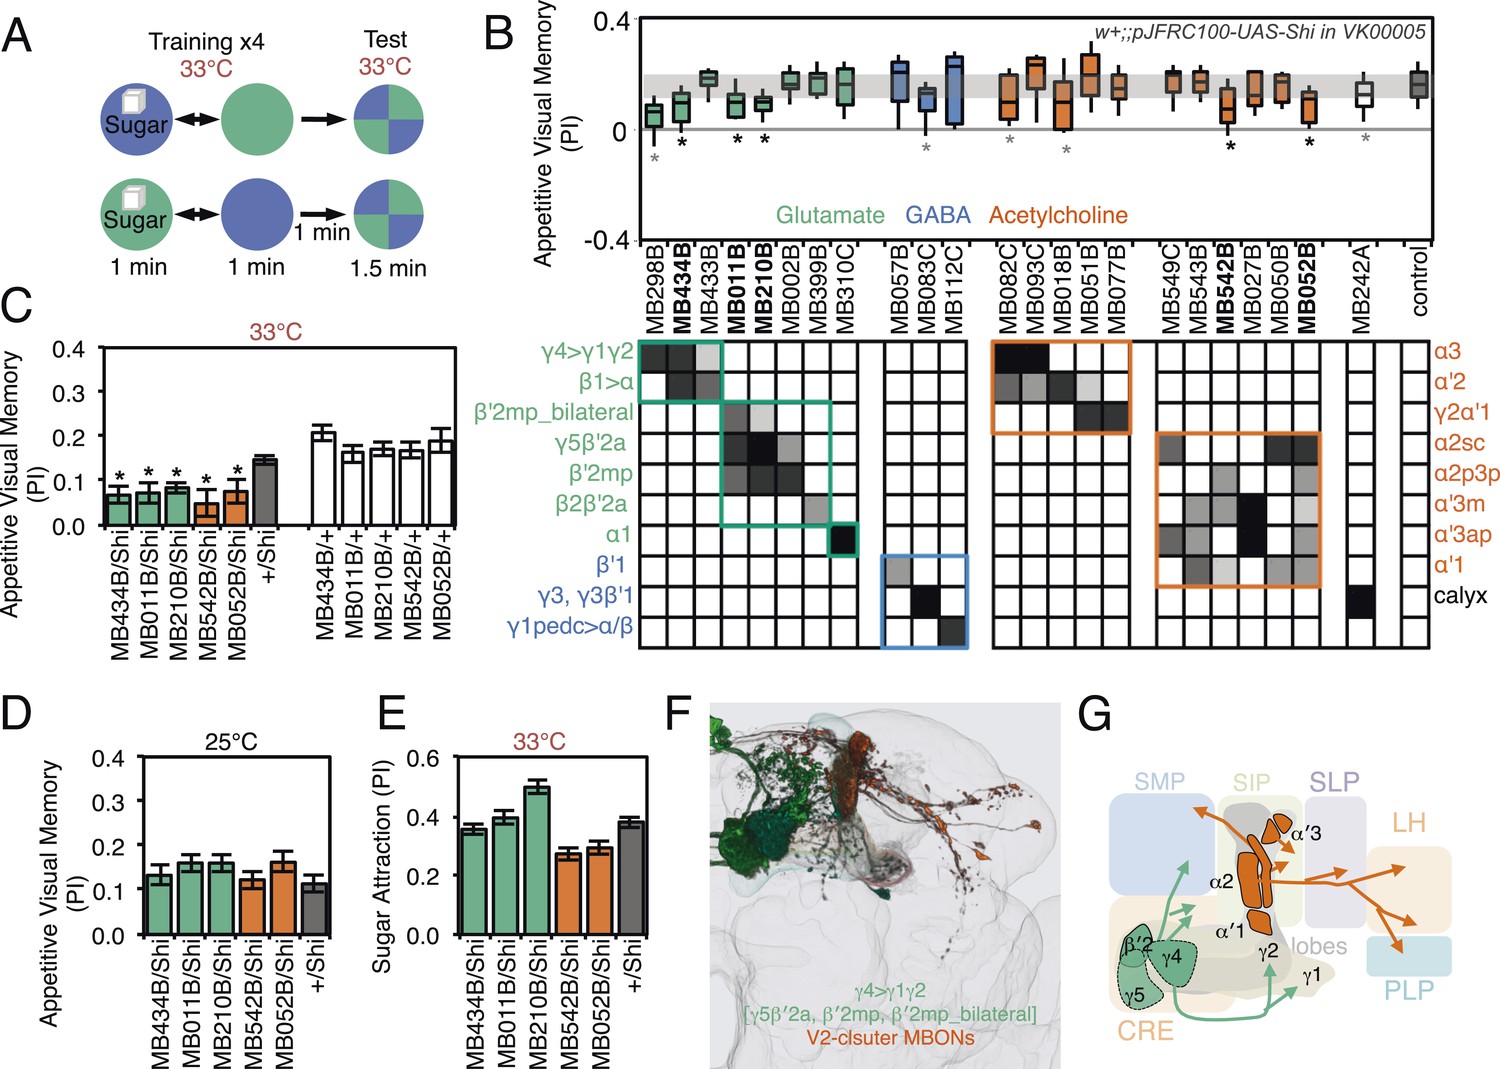
Requirement of MBONs for appetitive visual memory.
(A) Diagram of the training protocol used for appetitive visual conditioning. Starved flies were trained with sugar and the PI calculated in the same manner as in aversive visual conditioning (see Figure 8A). Flies were trained and tested at the restrictive temperature. (B) Screening for MBONs required for aversive visual conditioning. pJFRC100-20XUAS-TTS-Shibire-ts1-p10 (VK00005) was used to block synaptic transmission. MBONs have been grouped by neurotransmitter and color-coded. The bottom and top of each box represents the first and third quartile, and the line inside the box is the median. The whiskers represent the 10th and 90th percentiles. The gray rectangle spanning the horizontal axis indicates the interquartile range of the control. Statistical tests are described in methods: *, p < 0.05. Gray asterisks indicate lines that were not significantly different from GAL4/+ controls (MB083C, MB082C, MB018B and MB242A) or had altered color preference (MB298B). The relative expression levels produced by the split-GAL4 driver lines in each cell type (indicated in a gray scale) are based on imaging with pJFRC2-10XUAS-IVS-mCD8::GFP (VK00005). Images of the expression patterns of selected drivers are shown in Figure 9—figure supplement 1. (C) Visual appetitive memory was impaired at restrictive temperature by blocking the subsets of glutamate or acetylcholine MBONs labeled by MB434B, MB011B, MB210B, MB542B and MB052B compared to +/Shi and GAL4/+ controls. (D) No appetitive visual memory impairment was found at the permissive temperature compared to +/Shi. (E) Sugar attraction in untrained flies was not impaired at the restrictive temperature compared to +/Shi. (F) Rendering of MBONs implicated in appetitive visual memory. MBONs grouped by square brackets represent cases where the available set of driver lines do not allow assigning an effect to a single cell type, but only to the bracketed set. (G) Circuit diagram for appetitive visual memory. Glutamatergic MBONs (MBON-β′2mp and MBON-γ5β′2a) mediate visual appetitive memory. PAM neurons innervating these compartments of the MB lobes (see Figure 1A) are thought to convey the sucrose reward signal (Vogt et al., 2014). MBON-γ4>γ1γ2 feeds forward onto the dendrites of MBON-γ1pedc>α/β, a neuron required for aversive odor and aversive visual memory. Cholinergic V2 cluster neurons also appear to play a role.
Figure 9—figure supplement 1
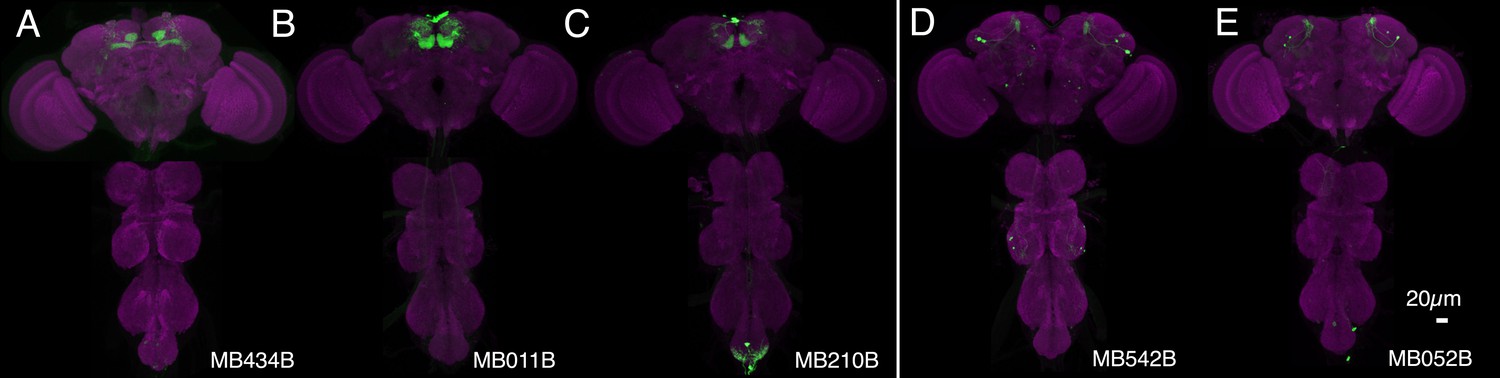
Expression patterns of split-GAL4s that caused appetitive visual memory phenotypes.
(A–E) Expression patterns of the indicated split-GAL4 drivers as assessed with pJFRC2-10XUAS-IVS-mCD8::GFP (VK00005). Full confocal stacks of these images are available at www.janelia.org/split-gal4.
Figure 10
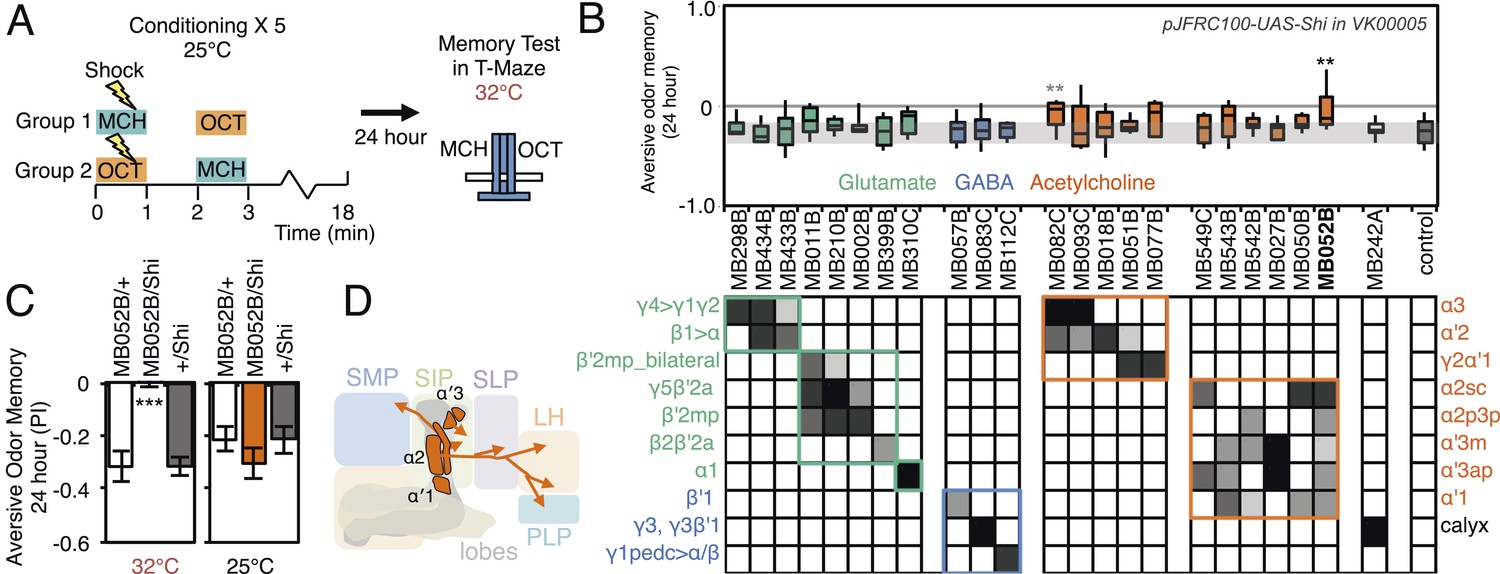
Requirement of long-term aversive odor memory.
(A) Diagram of the conditioning protocol. Training sessions with electric shocks were repeated five times with 15 min intervals between training, all at the permissive temperature (25°C). Following training, flies were kept for 24 hr at 18°C, then shifted to the restrictive temperature (32°C) 30 min prior to test. The PI corresponds to the mean of the [(number of flies in the OCT tube minus number of flies in the MCH tube)/total number of flies when OCT was paired with electric shock] and [(number of flies in the MCH tube minus number of flies in the OCT tube)/total number of flies when MCH was paired with electric shock]. (B) Results of the primary screening for MBONs required for long-term aversive memory retrieval. pJFRC100-20XUAS-TTS-Shibire-ts1-p10 (VK00005) was used to block synaptic transmission. The bottom and top of each box represents the first and third quartile, and the line inside the box is the median. The bottom and top of each box represents the first and third quartile, and the horizontal line dividing the box is the median. The whiskers represent the 10th and 90th percentiles. The gray rectangle spanning the horizontal axis indicates the interquartile range of the control. Statistical tests are described in methods: **: p < 0.01. The relative expression levels produced by the split-GAL4 driver lines in each cell type (indicated by the gray scale) are based on imaging with pJFRC2-10XUAS-IVS-mCD8::GFP (VK00005). Two lines, MB052B and MB082C showed significant memory impairment. MB082C drives expression in MBON-α3 and to a lesser extent in MBON-α′2. In subsequent control experiments, MB082C/Shits showed significant impairment compared to MB082C/+ and +/Shits (data not shown). However, we were unable to attribute this aversive LTM phenotype to MBON-α3, because blocking this cell type by other drivers did not result in a consistent phenotype (MB093C, Figure 10B; G0239, (Placais et al., 2013)). The requirement for MBON-α3 for aversive odor LTM has been reported, but it is unclear whether these neurons are required for canonical LTM after spaced training (Pai et al., 2013) or instead for so-called ‘fasting LTM’, a memory that mildly fasted flies can form after a single cycle of conditioning (Hirano and Saitoe, 2013; Placais and Preat, 2013; Placais et al., 2013). We note that these same two split-GAL4 driver lines for MBON-α3 (MB082C and MB093C) also showed discordant results in the ethanol memory assay (see below), suggesting some underlying difference between the two lines, perhaps in off-targeted expressions or genetic background. (C) MB052B/Shi showed memory impairment compared to MB052B/+ and +/Shi at the restrictive temperature but not at the permissive temperature. Statistical tests are described in methods: ***, p < 0.001. (D) Diagram of the output neurons that are required for long-term aversive odor memory. MB052B labels five cell types of cholinergic MBONs from the vertical lobes, four of them project to the lateral horn. Lines labeling only a subset of these MBONs gave only small effects when blocked.
Figure 11 with 1 supplement
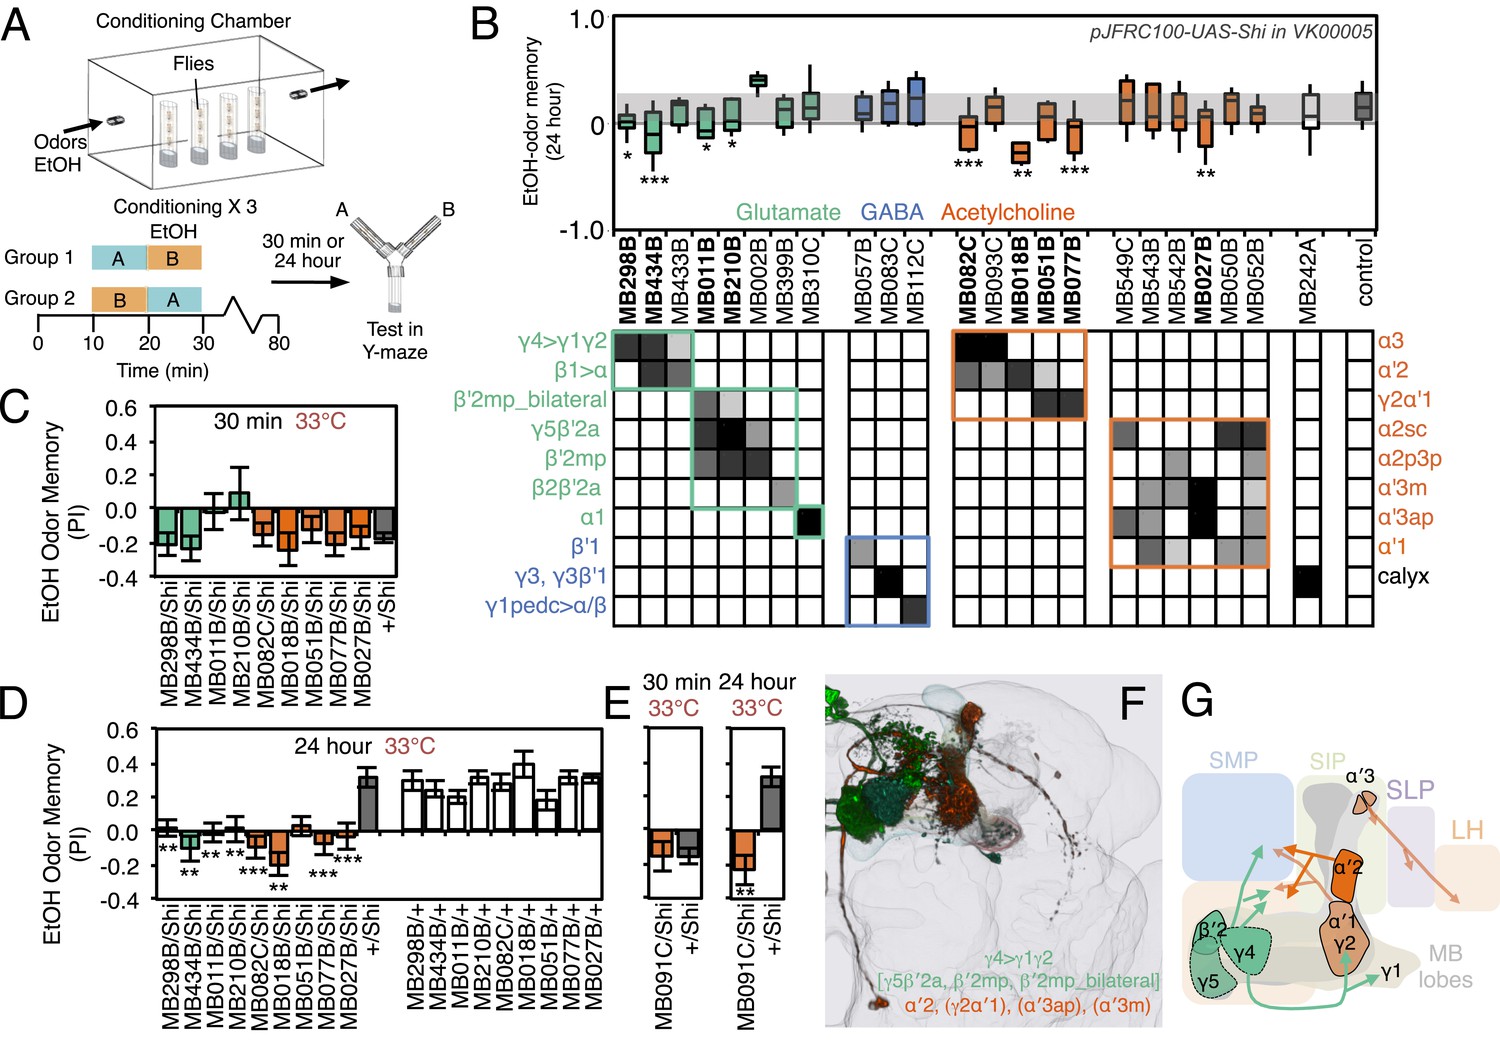
Requirement of MBONs for appetitive odor-ethanol intoxication memory.
(A) Diagram of odor conditioning using ethanol vapor. Conditioned ethanol preference is measured by presenting two odors in sequence, one in the presence of an intoxicating dose of ethanol, three times for 10 min with 50-min breaks between exposures, followed by testing for preference between the two odors in a Y-maze in the absence of ethanol either 30 min or 24 hr after training. Wild-type flies find the ethanol-paired odor to be aversive when tested 30 min after training, but appetitive 24 hr after training. (B) Results of assays for the requirement of MBONs in ethanol-induced appetitive odor memory. pJFRC100-20XUAS-TTS-Shibire-ts1-p10 (VK00005) was used to block synaptic transmission during training and test; flies were kept at the permissive temperature for the 24 hr between training and test. MBONs have been grouped by neurotransmitter and color-coded. The bottom and top of each box represents the first and third quartile, and the horizontal line dividing the box is the median. The whiskers represent the 10th and 90th percentiles. The gray rectangle spanning the horizontal axis indicates the interquartile range of the control. Statistical tests are described in methods: *, p < 0.05; **, p < 0.01; ***, p < 0.001. The relative expression levels produced by the split-GAL4 driver lines in each cell type (indicated by the gray scale) are based on imaging with pJFRC2-10XUAS-IVS-mCD8::GFP (VK00005). Images of the expression patterns of selected drivers are shown in Figure 11—figure supplement 1. (C) 30-min ethanol-induced odor memory. (D) 24-hr ethanol-induced appetitive odor memory compared to +/Shi and GAL4/+ genetic controls. (E) Blocking transmission in MBON-α′2 with MB091C resulted in a failure to switch from aversive to appetitive memory for ethanol intoxication, confirming the result seen with MB018B. (F) Renderings of the MBONs implicated in 24 hr ethanol odor memory. MBONs grouped by square brackets represent cases where the available set of driver lines do not allow assigning an effect to a single cell type, but only to that set of MBONs. MBONs cell types in parentheses indicate cases where the data implicating them are only suggestive. (G) Schematic of potential circuits for appetitive ethanol memory. Cholinergic outputs from the MBON-α′2 and MBON-γ2α′1, and glutamatergic MBON-γ4>γ1γ2, MBON-γ5β′2a and MBON-β′2mp are implicated in appetitive ethanol memory. MBONs for which the data shows inconsistency across driver lines (MBON-α3 and MBON-γ2α′1) are shown in a lighter color; additional experiments will be required to resolve the role of these MBONs.
Figure 11—figure supplement 1
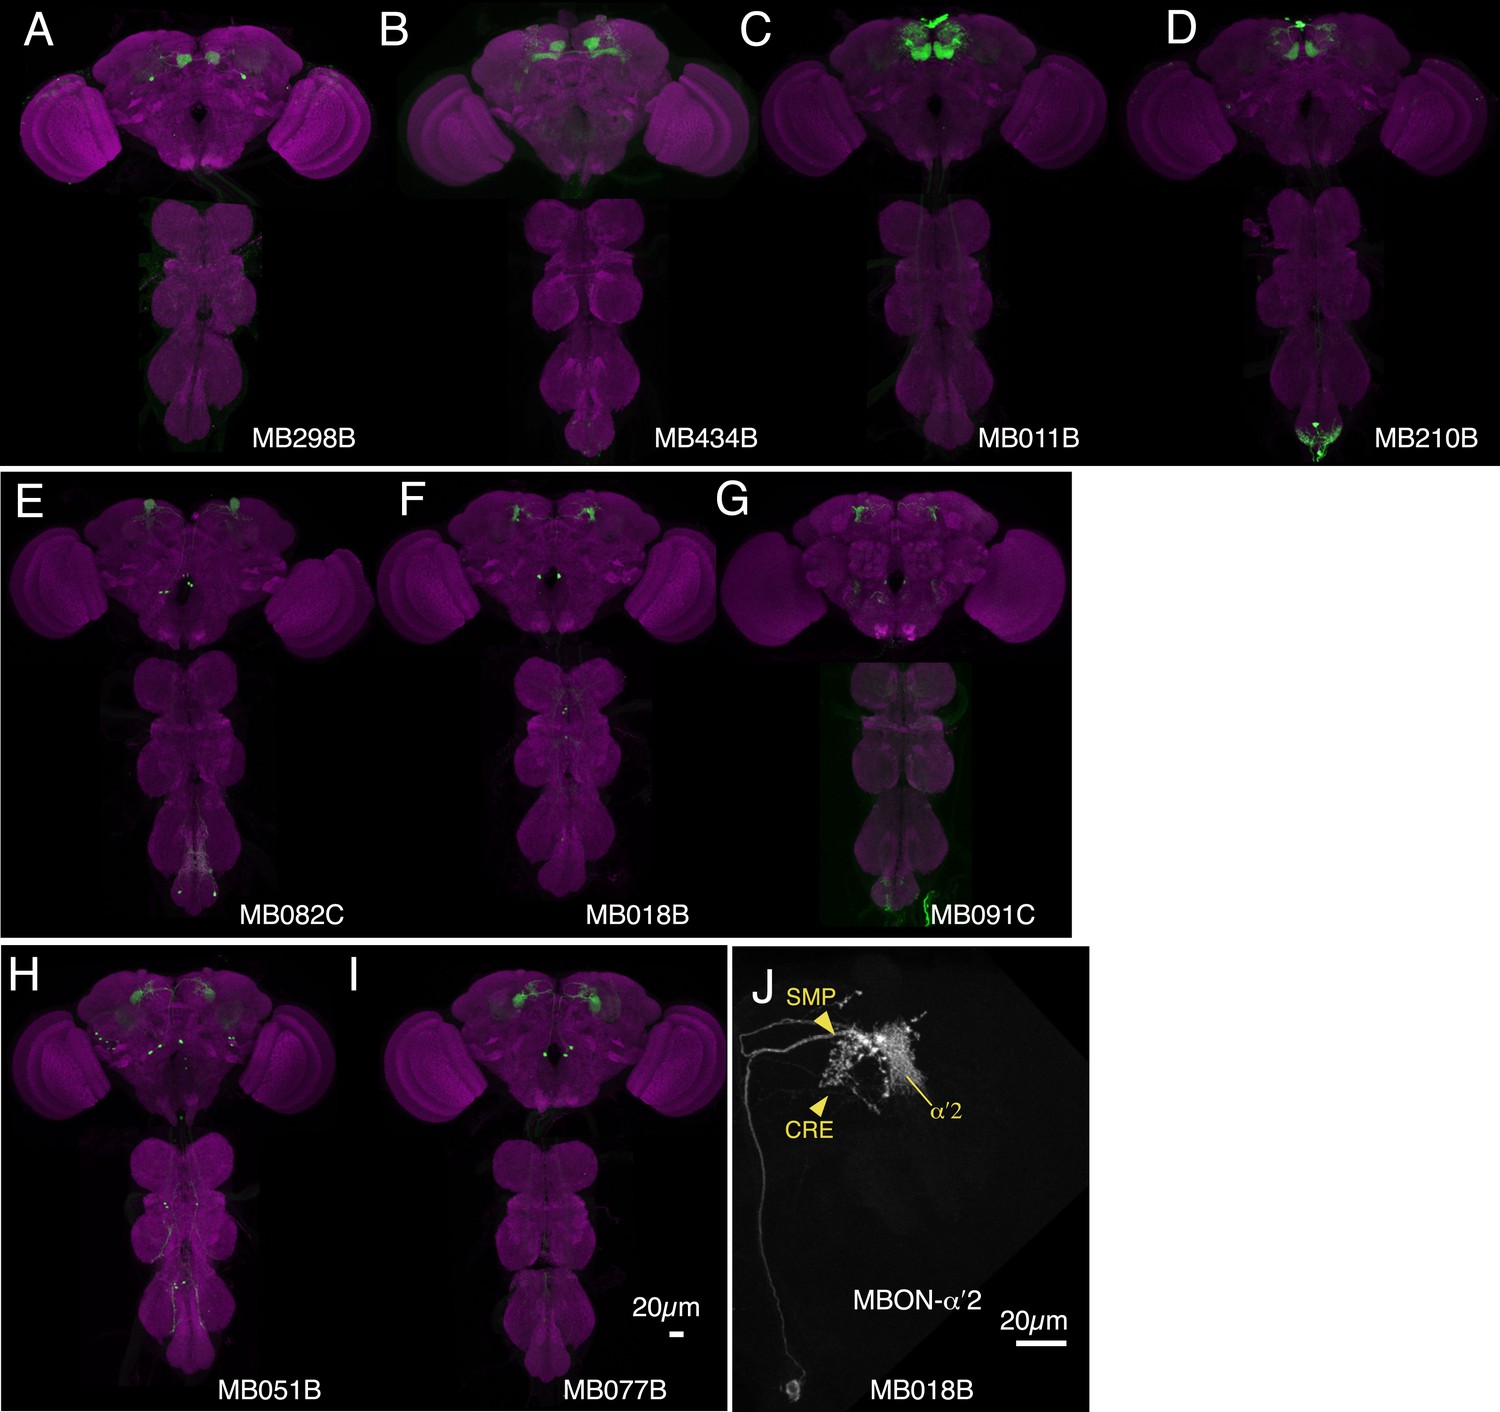
Expression patterns of split-GAL4s that caused odor-ethanol intoxication memory phenotypes.
(A–I) Expression patterns of selected split-GAL4 drivers as assessed with pJFRC2-10XUAS-IVS-mCD8::GFP (VK00005). Full confocal stacks of these images are available at www.janelia.org/split-gal4. (J) Confocal image of a single brain hemisphere of MB018B for the MBON-α′2.
Figure 12 with 1 supplement
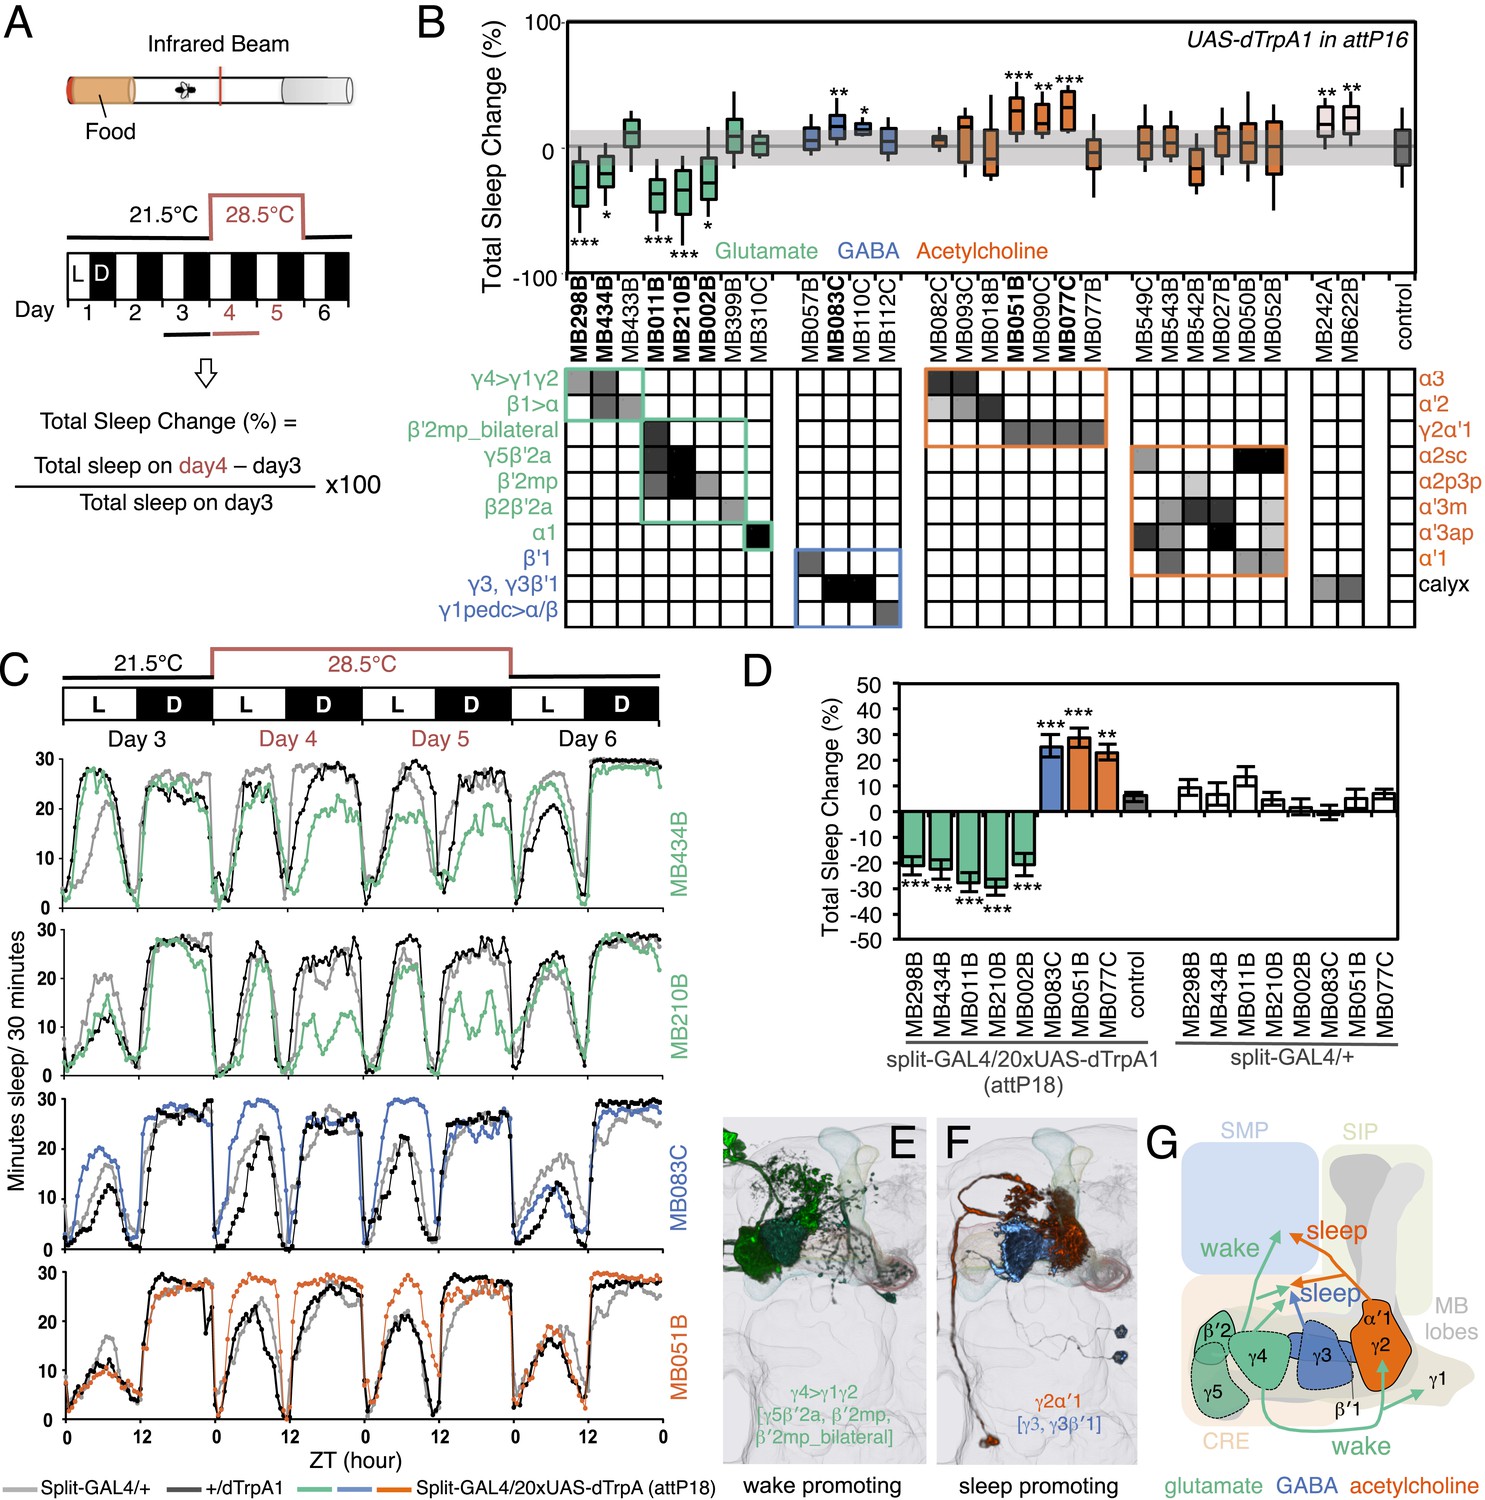
MBONs bi-directionally regulate sleep.
(A) Top: Schematic of the experimental apparatus used for assaying sleep. Single flies are placed in a tube and activity is measured by counting the number of times the fly crosses an infrared beam. Bottom: Diagram of the experimental assay. Sleep was measured at 21.5°C for 3 days to establish the baseline sleep profile. Flies were then shifted to 28.5°C for 2 days to increase activity of the targeted cells by activating the dTrpA1 channel, and then returned to 21.5°C after activation to assay recovery. The effect of MBON activation on sleep amount is quantified as percentage change in sleep. Negative and positive values indicate decreased and increased sleep, respectively. (B) Box plots of change in sleep induced by dTrpA1 [UAS-dTrpA1 (attP16); (Hamada et al., 2008)] mediated activation of the neurons targeted by each of the indicated split-GAL4 driver lines. MBONs are grouped by neurotransmitter and color-coded as indicated. The bottom and top of each box represents the first and third quartile, and the horizontal line dividing the box is the median. The whiskers represent the 10th and 90th percentiles. The gray rectangle spanning the horizontal axis indicates the interquartile range of the control. Statistical tests are described in methods: *, p < 0.05; **, p < 0.01; ***, p < 0.001. The matrix below the box plots shows the relative levels of expression (indicated by the gray scale) in the cell types observed with each driver line using pJFRC200-10XUAS-IVS-myr::smGFP-HA (attP18). Images of the expression patterns of selected drivers are shown in Figure 12—figure supplement 1. (C) Sleep profiles of four split-GAL4 lines are shown. Each plot shows a 4-day period starting with subjective dawn. Sleep duration (min/30 min) on day 3 (21.5°C; permissive temperature), days 4, 5 (28.5°C; non-permissive temperature) and day 6 (21.5°C; permissive temperature) are plotted (colored line, split-GAL4 line in combination with pJFRC124-20XUAS-IVS-dTrpA1 (attP18); black line, represents +/dTrpA1; gray line, split-GAL4/+). (D) Sleep phenotypes were replicated with pJFRC124-20XUAS-IVS-dTrpA1 (attP18) for the eight drivers shown, but not for MB242A (not shown). Corresponding split-GAL4/+ flies showed normal sleep. (E, F) Renderings of MBONs responsible for the decreasing (E) or increasing (F) sleep. MBONs are color-coded based on their putative transmitter. (G) Diagram of MBONs responsible for the sleep regulation. MBONs are color-coded based on their putative transmitter as indicated. The wake promoting glutamatergic MBON-γ5β′2a, MBON-β′2mp and MBON-β′2mp_bilateral converge with the sleep promoting cholinergic MBON-γ2α′1 and GABAergic MBON-γ3 and MBON-γ3β′1 in the SMP and CRE. The wake-promoting glutamatergic MBON-γ4>γ1γ2 terminates in the dendritic region of MBON-γ2α′1.
Figure 12—figure supplement 1
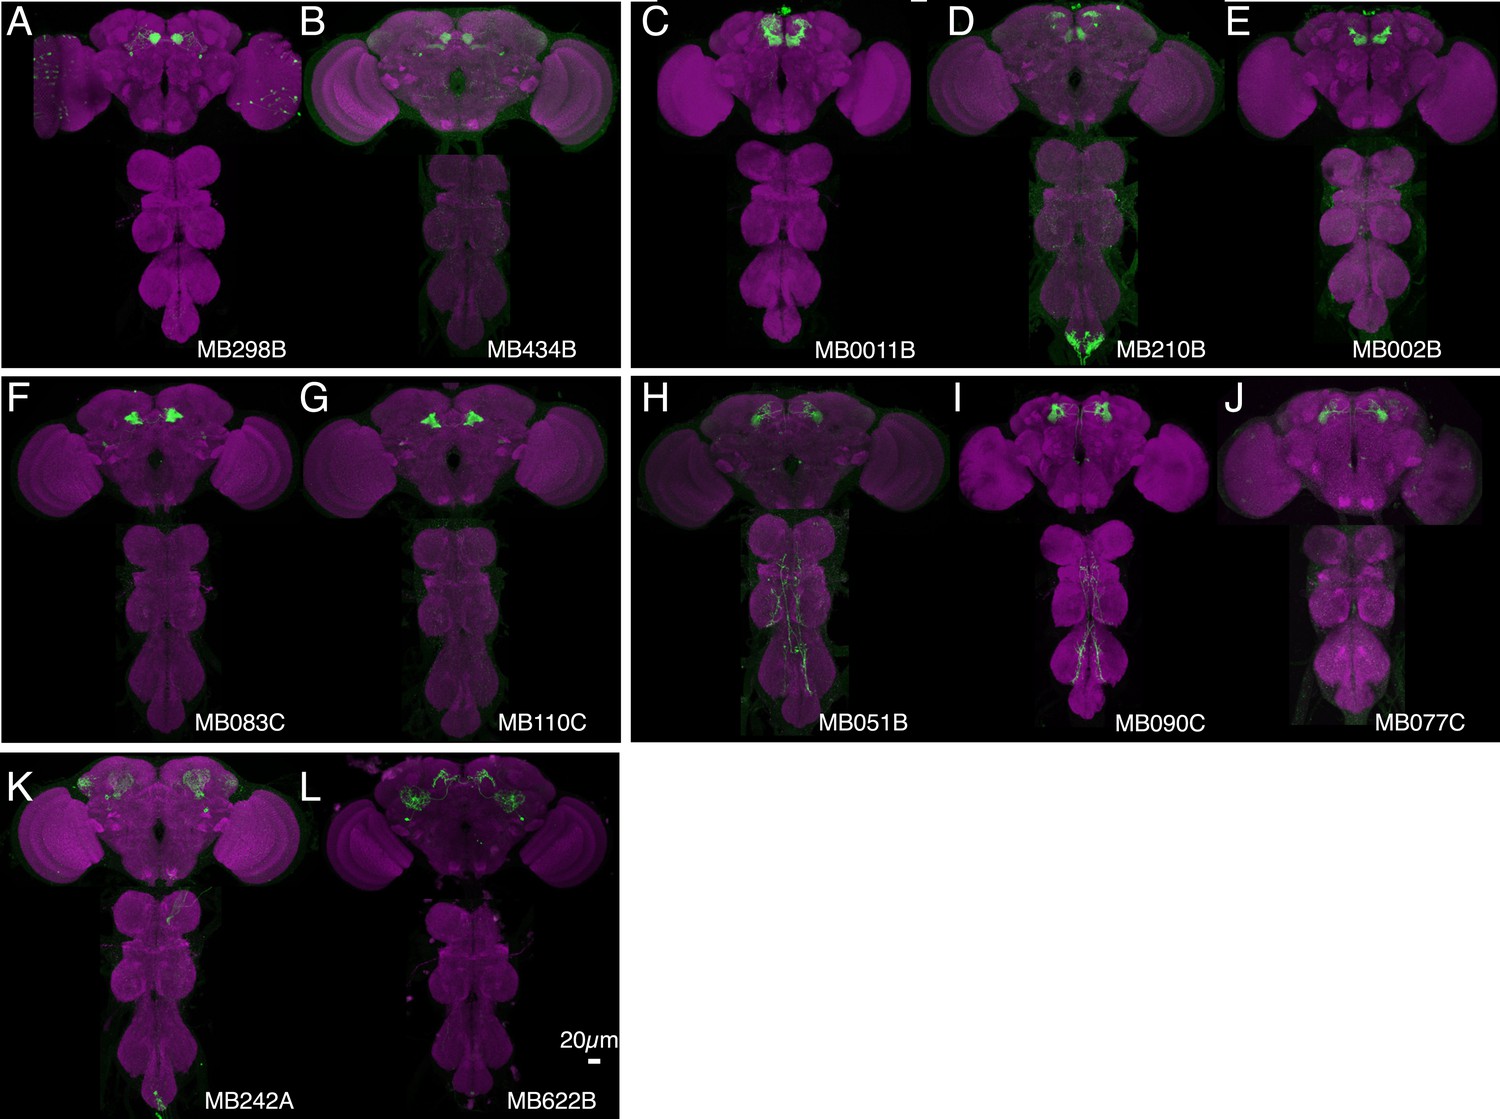
Expression patterns of split-GAL4s that caused sleep phenotypes.
(A–L) Expression patterns of selected split-GAL4 lines are shown, as assessed with pJFRC200-10XUAS-IVS-myr::smGFP-HA (attP18). Full confocal stacks of these images are available at www.janelia.org/split-gal4.
Figure 13
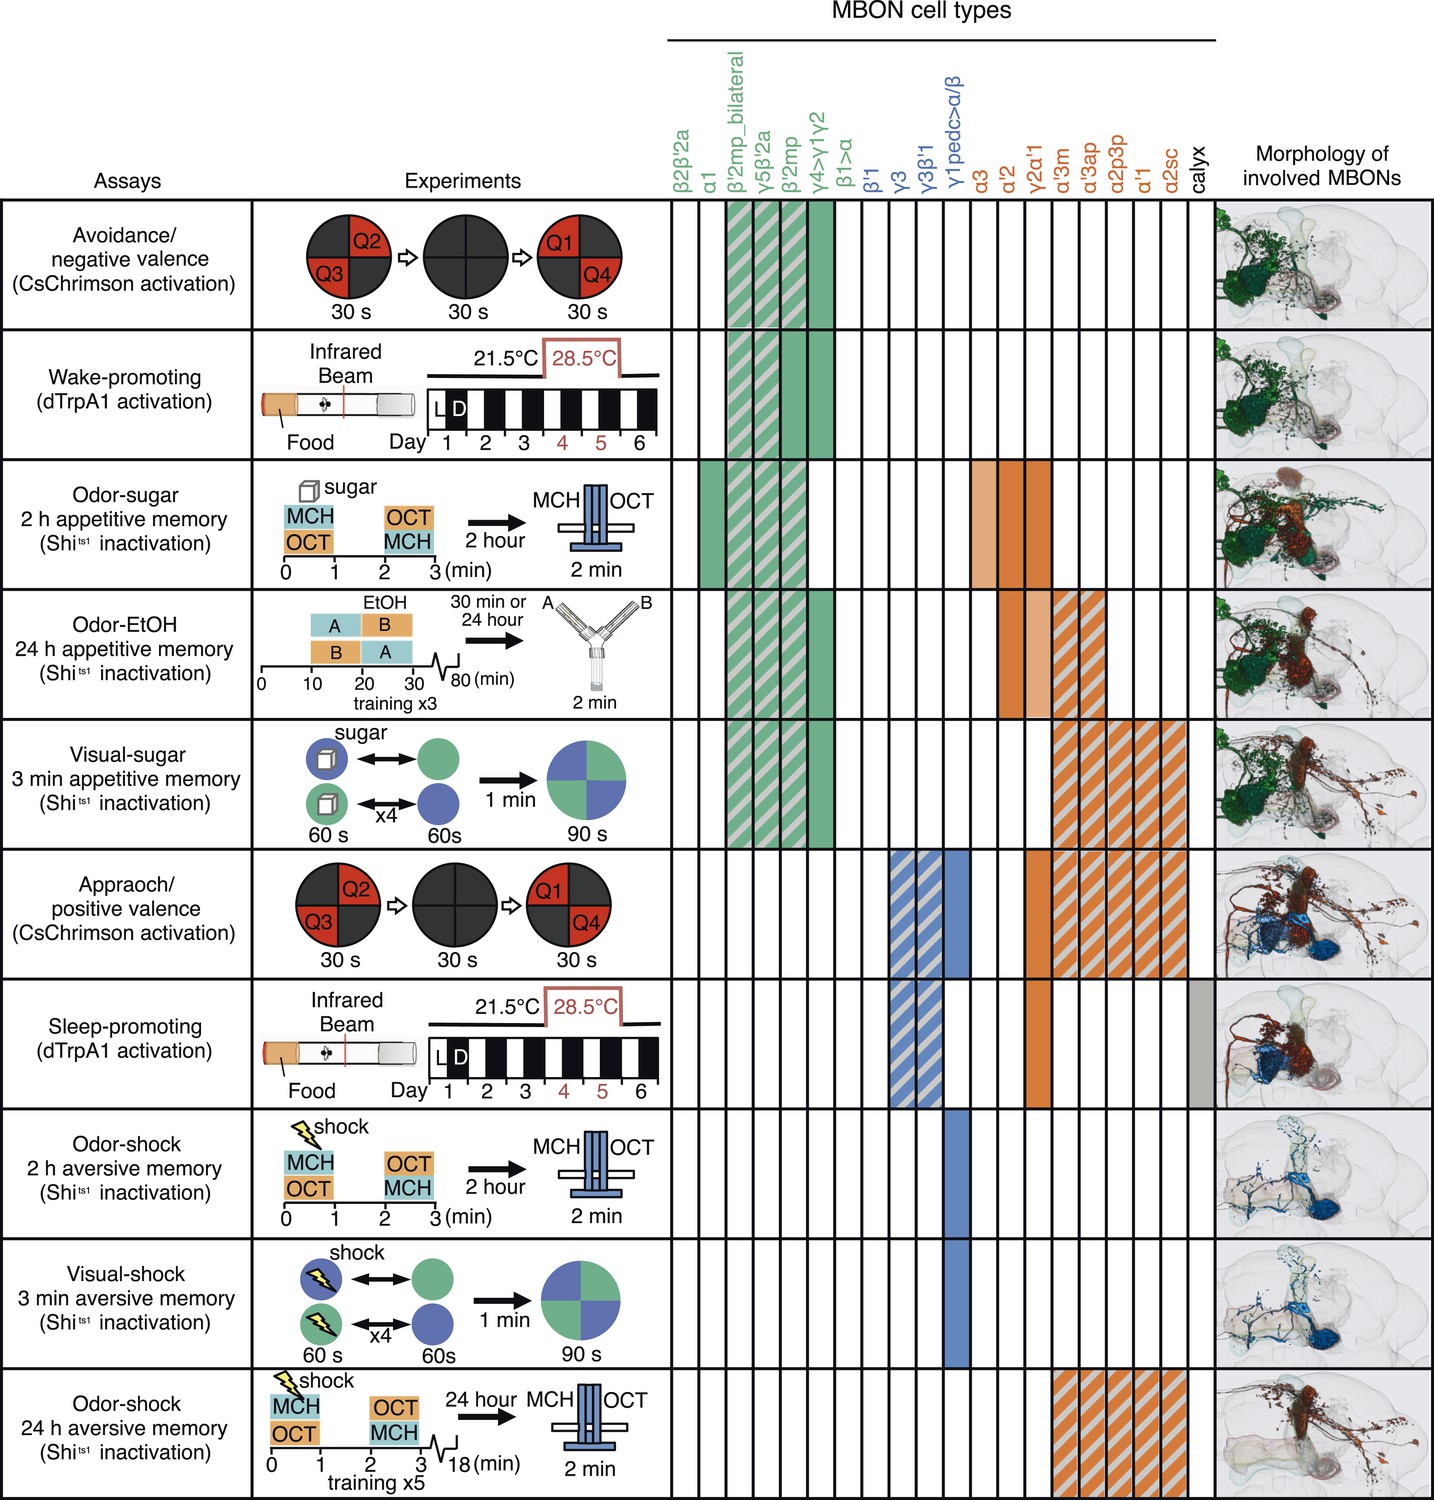
A map of MBON functions.
A matrix summarizing the MBON cell types identified in each of the behavior assays is shown. In the cells of the matrix representing MBON cell types, solid colors were assigned when manipulation of that cell type alone caused a significant behavioral phenotype. Hatched cells indicate cases where we observed a significant behavioral phenotype, but the driver line used labeled a combination of cell types. In these cases, our data only allow us to assign the phenotypic effect to that group of MBONs. The light colored cells indicate two cases where our data suggested the involvement of a cell type, but was not conclusive. See Results for details. Avoidance, attraction, wake-promoting and sleep-promoting phenotypes reflect the results of activating MBONs; the other assays measured the effects of blocking synaptic transmission. Activation of glutamatergic MBONs repelled flies and promoted wakefulness, whereas activation of GABAergic or cholinergic MBONs attracted flies and promoted sleep. In general, more cell types were involved in appetitive memory than in aversive memory. Partially overlapping set of cholinergic and glutamatergic MBONs were required for all three appetitive memory assays. The same GABAergic MBON-γ1pedc>α/β was required for short-term olfactory and visual memory in an assay protocol that did not distinguish between formation or retrieval, whereas long-term aversive odor memory retrieval required the V2 cluster MBONs.
Figure 14
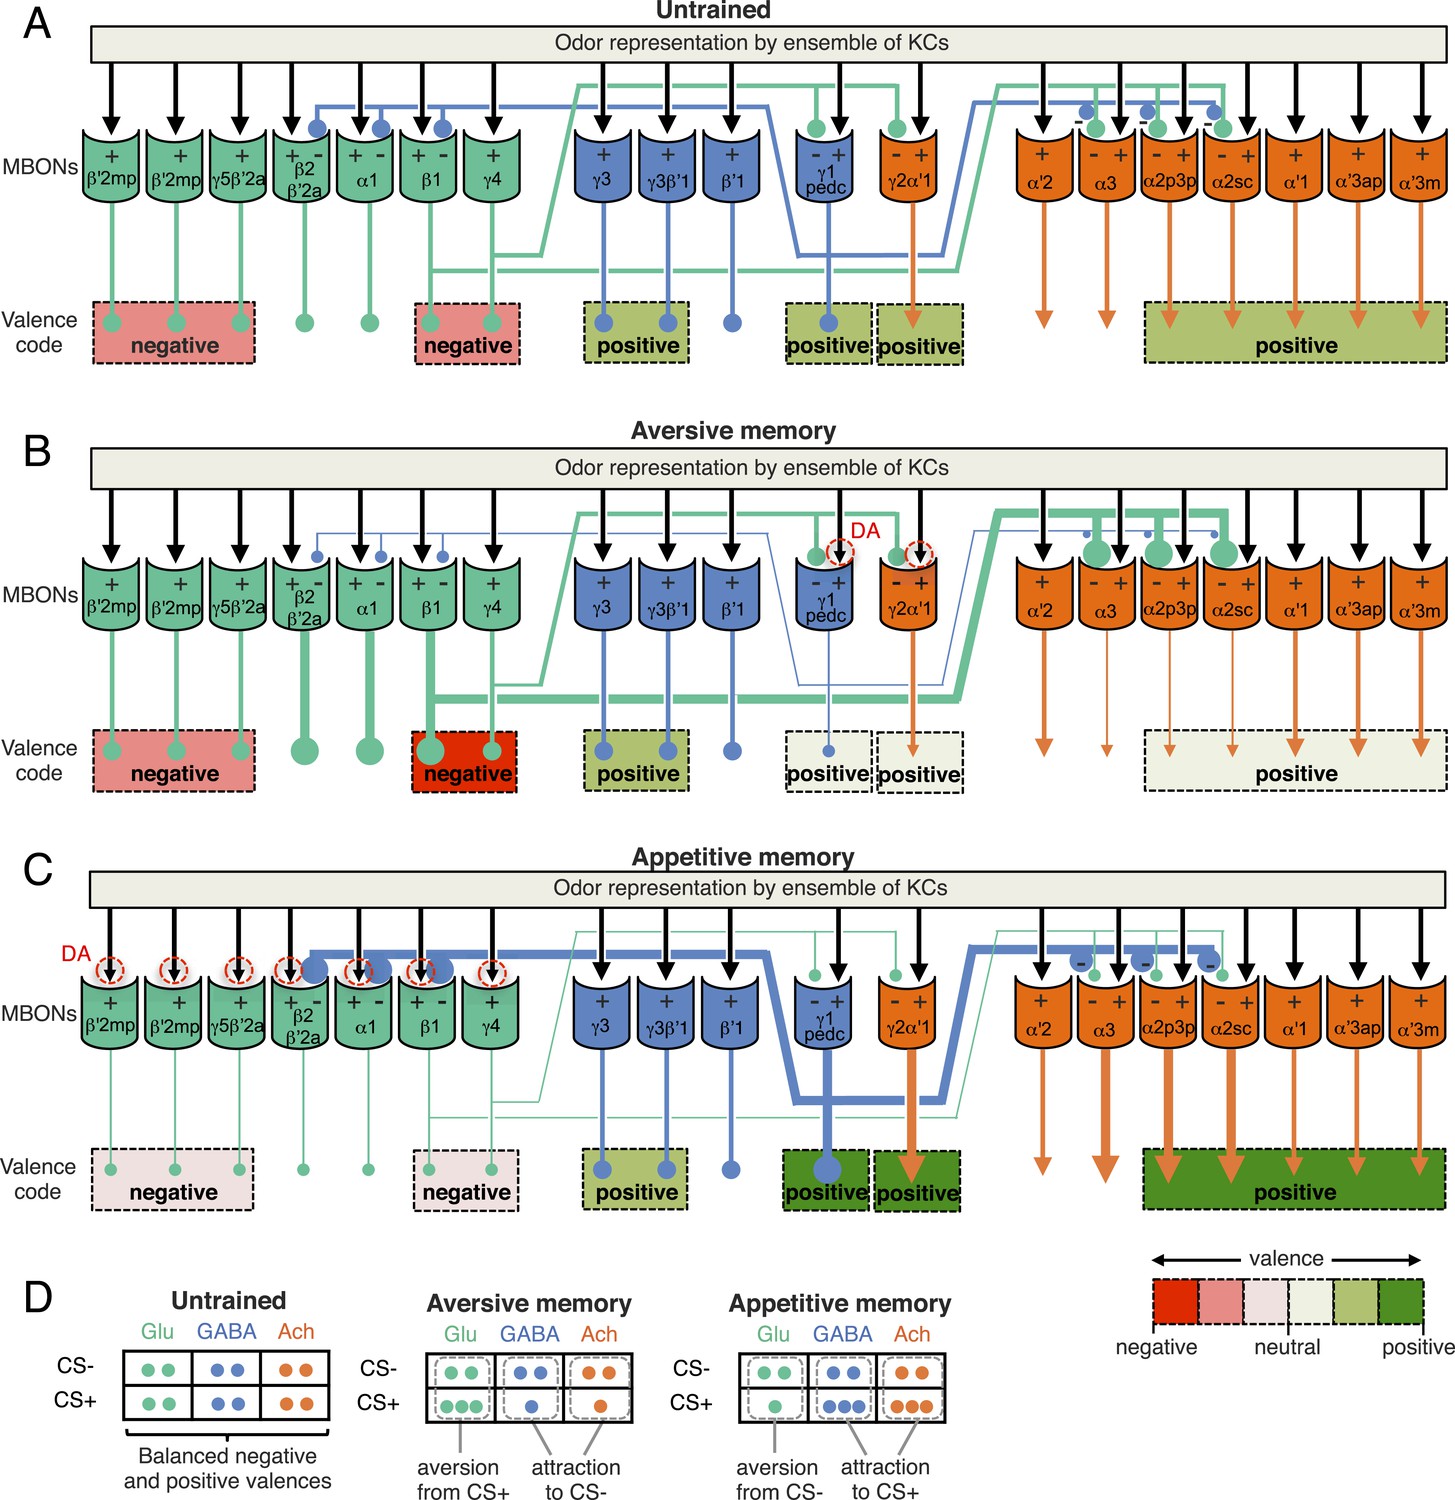
A simplified circuit model for the encoding of learned valence by MBONs ensemble and feedforward network.
(A) In response to an odor, a sparse ensemble of Kenyon cells provides excitatory synaptic input to MBONs (black arrows; Hige et al., unpublished) (Cassenaer and Laurent, 2007). Glutamatergic (Glu; green), GABAergic (GABA; blue) and cholinergic (Ach; orange) MBONs all receive KC input; the names of MBONs are based on the lobe compartment where their dendrites arborize. CsChrimson activation of some glutamatergic MBONs can be repulsive, whereas activation of GABA or cholinergic MBONs can be attractive (color coded as indicated by the scale at bottom right) (Figure 2C). We often only observed significant behavioral effect with combinations of cell types (indicated by dashed lines grouping multiple cell types). MBON-γ1pedc>α/β, and glutamatergic MBONs, MBON-β1>α and MBON-γ4>γ1γ2, have synaptic terminals inside the compartments of MB lobes (Aso et al., 2014). While the microcircuits within each MB compartment remain to be elucidated, our light level anatomical studies have enumerated the cell types present in each compartment. The α2 and α3 compartments contain the dendrites of cholinergic MBONs and are targeted by both the GABAergic MBON-γ1pedc>α/β and the glutamatergic MBON-β1>α. These MBONs cover only a small fraction of volume in their target compartments (see Figure 6—figure supplement 1); since they could contact only a fraction of Kenyon cells, we propose that they target MBONs directly. Here we hypothesize that glutamate is inhibitory to cholinergic and GABAergic MBONs, and GABA is inhibitory to glutamatergic MBONs (inhibitory connections are indicated by circles). The thickness of lines and size of their endings are meant to indicate activity levels. (B) PPL1- γ1pedc DANs play a major role to mediate punishment signals to the MB for formation of aversive memory together with minor contribution from other DANs including PPL1-γ2α′1 (Aso et al., 2012). If an aversive memory is formed by the simultaneous presentation of an odor and punishment and results in a synaptic depression of KC terminals by dopamine (represented by red dashed circles), the response of the GABAergic MBONs to the CS+ would be depressed (see text). Reduced GABAergic inhibitory input would then increase the CS+ response of glutamatergic MBONs, whereas the CS+ response of cholinergic MBONs would be reduced because of dis-inhibition of the inhibitory glutamatergic MBONs. The end result is enhanced activity of aversion-mediating glutamatergic MBONs together with the reduced activity of attraction-mediating GABAergic and cholinergic MBONs in response to CS+. The CS- is represented by a different set of KCs whose synaptic connections to the MBONs would not be expected to be modified by training and so the responses of the ensemble of MBONs to the CS- would remain balanced. The change in response of the MBONs to the CS+, relative to their unchanged response to the CS-, biases choice toward the CS+ (see diagram in panel D). This model is consistent with the essential role of MBON-γ1pedc>α/β in aversive memory. Also, cholinergic MBONs in V2 cluster have been shown to reduce their response to an odor after olfactory conditioning with electric shock (Séjourné et al., Nat. Neurosci., 2011), although we detected their requirement only for long-term memory, but not for 2 hr memory. This model predicts a role for glutamatergic MBONs, but we did not observe significant effect by blocking subsets of glutamtergic MBONs (Figures 6 and 8). Thus, to test this model, it will be necessary to block broader sets of glutamatergic MBON cell types by using combinations of split-GAL4 drivers. (C) In contrast to aversive memory in which one type of DAN (PPL1-γ1pedc) plays a major role in memory formation, reward signals are mediated by a distributed set of PAM cluster DANs that innervate the compartments of glutamatergic MBONs (Yamagata et al., in press) (Burke et al., 2012; Liu et al., 2012; Perisse et al., 2013). If an appetitive memory is formed by synaptic depression of KC terminals in response to dopamine release, the response of the glutamatergic MBONs to the CS + would be depressed. The resultant reduced glutamatergic inhibitory input to the GABAergic and cholinergic MBONs would increase their response to the CS+. In turn, increased GABAergic input to glutamatergic MBONs may further amplify and stabilize the initial effects of plasticity. The end result would be reduced activity of aversion-mediating glutamatergic MBONs together with the increased activity of attraction-mediating GABAergic and cholinergic MBONs in response to CS+. This model is consistent with requirement of glutamatergic MBONs: blocking the M4/M6 cluster MBONs (MBON-γ5β′2a, MBON-β′2mp and MBON-β′2mp_bilateral; Table 1) by MB011B resulted in memory impairment for all three appetitive memory assays (Figures 7, 9 and 11). Blocking the MBON-γ4>γ1γ2 and MBON-β1>α by MB434B resulted in memory impairment in two of three assays (Figures 9 and 11). While we did not detect a requirement for the GABAergic MBON-γ1ped>α/β in appetitive memory, previous study have shown that dopamine input to the γ1 and pedc suppresses expression of appetitive memory in fed flies (Krashes et al., 2009), indicating some role of MBON-γ1ped>α/β in appetitive memory. Blocking cholinergic MBONs in the V3/V4 cluster (MBON-γ2α′1, MBON-α′2 and MBON-α3) resulted in memory impairment in appetitive odor memories (Figures 7 and 11) (Placais et al., 2013) but not in appetitive visual memory (Figure 9). Some of driver lines for the cholinergic MBONs in the V2 cluster showed impairment of appetitive memory in all three assays (Figures 7, 9 and 11), although our data did not allow mapping to the resolution of specific cell types due to inconsistent results obtained using other lines. (D) In the matrix shown, the number of circles represents the activity levels of MBONs in response to the CS+ odor (the odor that is paired with the unconditioned stimulus during conditioning) and the CS− odor (a control odor). In untrained flies, the activities of MBONs for opposing effects are balanced. Dopamine modulation breaks this balance to bias the choice between CS+ and CS−.
Figure 15 with 1 supplement
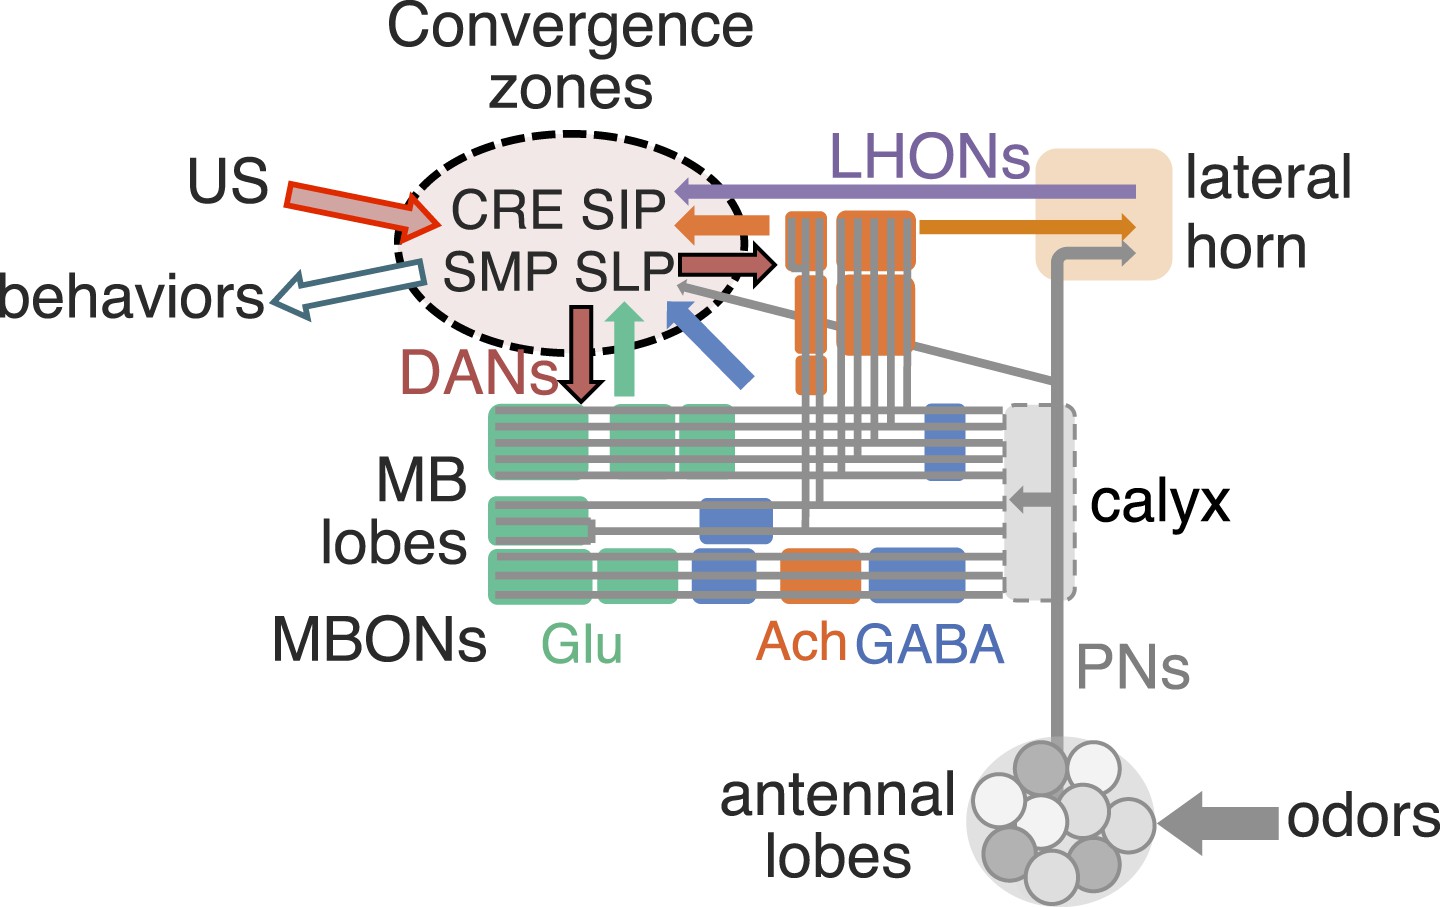
Convergence zone of MBON terminals as network nodes to integrate innate and learned valences.
MB lobes are consisted of three groups of compartments based on the putative transmitter of MBONs (glutamate, GABA and acetylcholine; color-coded as indicated), which are interconnected inside the lobes and send converging outputs to the lateral horn, CRE, SMP, SIP and SLP. These regions also receive input from the antennal lobes and the lateral horn, some of which appear to be in close apposition to the terminals of MBONs and likely target common downstream neurons (see Figure 15—figure supplement 1). Therefore, these convergence zones are well positioned to function as integration sites for selecting adaptive behaviors based on both innate and learned valences.
Figure 15—figure supplement 1
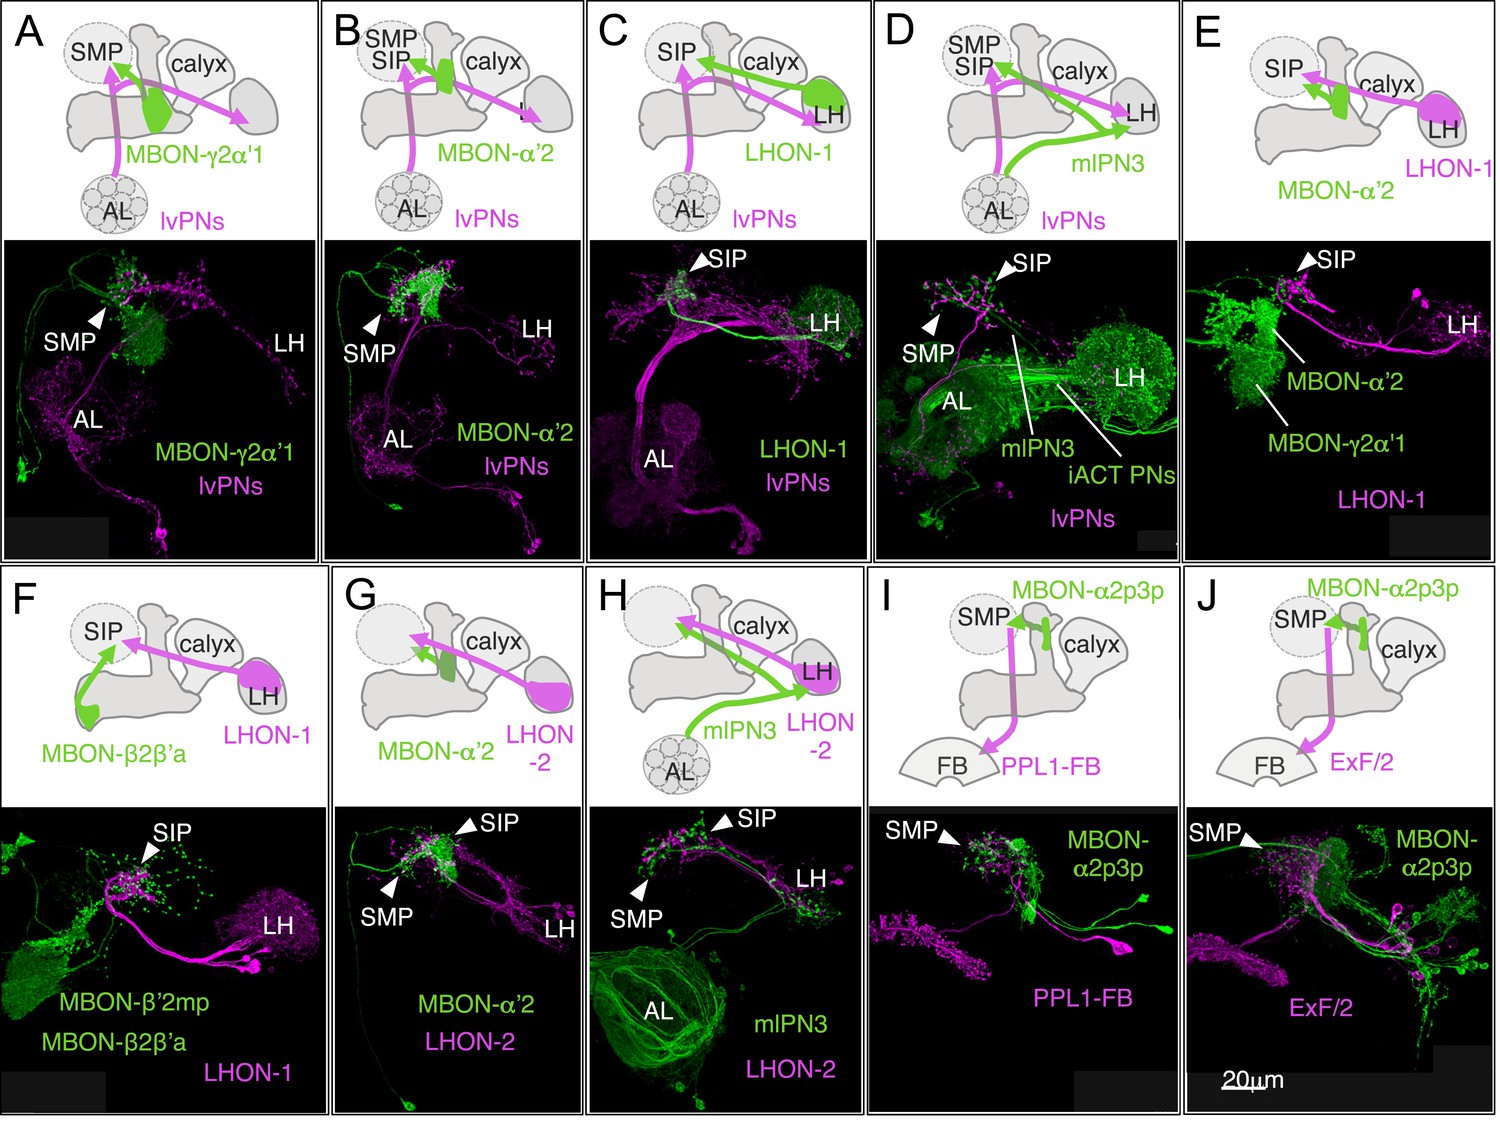
Convergence of olfactory pathways.
Double labeling of MBONs, antennal lobe (AL) projection neurons, and lateral horn (LH) output neurons (LHONs) reveals convergence of olfactory pathways in a subset of the SMP, SIP and SLP that surrounds the vertical lobes of the MB, a brain area resembling the ‘ring neuropils’ originally identified in the hymenopteran brain (Abel et al., 2001; Tanaka et al., 2012). These eight examples show sub-stack projections of confocal image data; we estimate that the terminals of the two types of neurons in each case are separated by less than a micron, as judged by examination of the original stacks. Only neurons of interest are shown for clarity; several of these GAL4 and LexA drivers label many other cell types. The reporter constructs pJFRC200-10XUAS-IVS-myr::smGFP-HA (attP18) and pJFRC216-13XLexAop2-IVS-myr::smGFP-V5 (su(Hw)attP8) were used. (A–B) One of clonal lineages in the antennal lobe, ALlv1, contains an atypical class of AL projection neurons, the ALlv1-PNs, which do not project to the MB calyx, but directly project to the SMP, SIP and SLP in addition to the lateral horn (Yu et al., 2013). ALlv1-PNs that are visualized in R35F02-LexA terminate in a specific region of the SMP (arrowhead), where MBON-γ2α′1 (A; MB077C) and MBON-α′2 (B; MB091C) also terminate. (C) The lateral horn output neurons (LHONs) in R47G10-LexA have dendrites in the dorsal region of the LH and axons that project to a confined region in the SIP, where ALlv1-PNs in R59G08-GAL4 also project (arrowhead). (D) The GAL4 enhancer trap line NP225 (Tanaka et al., 2004) expresses in mlPN3 neurons (Wong et al., 2002; Tanaka et al., 2012), another class of atypical AL projection neurons that do not project to the MB calyx, and in several types of projection neurons that terminate in the calyx and the LH (iACT PNs). The axons of mlPN3 neurons (magenta) project to the LH and the anterior SMP and SIP, where the ALlv1-PNs in R31G11-LexA also terminate (arrowheads). (E) Axons of LHONs in R47G10-LexA and MBON-α′2 (MB090C) converge in the SIP (arrowhead). MBON-γ2α′1 is also labeled in MB090C, but its terminals do not contact those of LHONs. The dendrites of MBON-α′2 and MBON-γ2α′1 in the MB lobes are indicated. (F) Axons of MBON-β2β′2a (MB074C) also converge with those of LHONs in R47G10-LexA in the SIP (arrowhead), whereas the two other MBON cell types in MB074C, MBON-β′2mp and MBON-γ5β′2a, do not project to this region. The dendrites of MBON-β2β′2a and MBON-β′2mp in the MB lobes are indicated. (G) LHONs in R13E04-LexA has dendrites in the ventral region of the LH and axons projecting to a confined region (arrowheads) spanning the SMP and SIP border, where MBON-α′2 (MB018B) also has terminals. (H) Axons of LHONs in R13E04-LexA and mlPN3 (from GAL4 line NP2331; (Tanaka et al., 2012)) converge in the SMP and SIP (arrowheads). NP2331 also expresses in olfactory receptor neurons. (I) Axons of MBON-α2p3p (MB062C) and dendrites of one of PPL1 cluster dopaminergic neurons (PPL1-FB; R40E08-LexA) (Mao and Davis, 2009) overlap in the SMP. (J) Axons of MBON-α2p3p (R71D08-GAL4) and dendrites of the fan-shaped body neurons (ExF/2; R84C10-LexA) (Young and Armstrong, 2010b) overlap in the SMP. ExF/2 neurons are also included in 104y and implicated in visual memory (Liu et al., 2006). R71D08-GAL4 also expresses in other MBONs and LHONs. MB062C in (I) use R71D08 enhancer for intersection.
Videos
Video 1
Choice behaviors of control flies.
A representative 12 trajectories for the control genotype (pBDPGAL4U/CsChrimson) showing flies that entered the choice zone from the light-off side at the 1-s time point and their subsequent behavior for 3 s. See legend of Figure 5E for more explanation. Time is shown in the upper right corner.
Video 2
Choice behaviors of MB434B/CsChrimson flies.
A representative 12 trajectories for MB434B/CsChrimson flies showing flies that entered the choice zone from the light-off side at the 1-s time point and their subsequent behavior for 3 s. When two glutamatergic MBONs (MBON-γ4>γ1γ2 and MBON-β1>α) were activated using MB434B/CsChrimson, flies tended to avoid entering light-on quadrants. The motor patterns they used for avoiding the light-on quadrants were not stereotyped, as illustrated by the randomly selected examples shown in this video.
Video 3
Choice behaviors of MB434B + MB011B/CsChrimson flies.
A representative 12 trajectories for MB434B + MB011B/CsChrimson flies showing flies that entered the choice zone from the light-off side at the 1-s time point and their subsequent behavior for 3 s. When five glutamatergic MBONs (MBON-γ4>γ1γ2, MBON-β1>α, MBON-γ5β′2a, MBON-β′2mp and MBON-β′2mp_bilateral) were activated using MB434B + MB011B/CsChrimson, the avoidance response is observed in a slightly higher fraction of flies than in Video 2.
Video 4
Choice behaviors of Gr66a-GAL4/CsChrimson flies.
A representative 12 trajectories for Gr66a-GAL4/CsChrimson flies showing flies that entered the choice zone from the light-off side at the 1-s time point and their subsequent behavior for 3 s. When the Gr66a sensory neurons for bitter taste were activated using Gr66a-GAL4/CsChrimson, flies increased their velocity when they entered the illuminated area, which facilitated their escape from light-on quadrants (see Figure 2B).
Video 5
Choice behaviors of NP225-GAL4/CsChrimson flies.
A representative 12 trajectories for NP225-GAL4/CsChrimson flies showing flies that entered the choice zone from the light-off side at the 1-s time point and their subsequent behavior for 3 s. When this broad set of antennal lobe projection neurons was activated using NP225-GAL4/CsChrimson, flies showed a stereotyped backward walking behavior when they approached the illuminated area; a response was observed at lower light intensities than with the other driver lines. Flies that were already in the illuminated quadrants when the light turned on showed continuous rotation that typically lasted for entire light-on period (30 s) and often extended a few seconds after the red light was turned off (not shown).
Video 6
Convergence of glutamatergic and cholinergic MBONs.
Rendering of two-color labeling for the glutamatergic MBON-β′2mp and weakly labeled MBON-γ5β′2a (MB074C; green) and cholinergic MBON-γ2α′1 (R25D01-LexAp65 in attP40; magenta). A small area dorsal to the MB medial lobes (an area that includes part of the CRE and the SMP) is shown.
Tables
Table 1
The list of MBON cell types
| cell type name | cell body cluster | putative transmitter | Number of cells | short names (number in Figure 1B) | names in previous publications |
|---|---|---|---|---|---|
| MBON-γ5β′2a | M4/M6 cluster | glutamate | 1 | MBON-01 | MB-M6 |
| MBON-β2β′2a | 1 | MBON-02 | |||
| MBON-β′2mp | 1 | MBON-03 | MB-M4 | ||
| MBON-β′2mp_bilateral | 1 | MBON-04 | MB-M4? | ||
| MBON-γ4>γ1γ2 | MV2 cluster | 1 | MBON-05 | ||
| MBON-β1>α | 1 | MBON-06 | MB-MV2 | ||
| MBON-α1 | 2 | MBON-07 | |||
| MBON-γ3 | γ3 cluster | GABA | 1 | MBON-08 | |
| MBON-γ3β′1 | 1 | MBON-09 | |||
| MBON-β′1 | 8 | MBON-10 | |||
| MBON-γ1pedc>α/β | 1 | MBON-11 | MB-MVP2 | ||
| MBON-γ2α′1 | V3/V4 cluster | acetycholine | 2 | MBON-12 | |
| MBON-α′2 | 1 | MBON-13 | MB-V4 | ||
| MBON-α3 | 2 | MBON-14 | MB-V3 | ||
| MBON-α'1 | V2 cluster | 2 | MBON-15 | ||
| MBON-α′3ap | 1 | MBON-16 | MB-V2α′ | ||
| MBON-α′3m | 2 | MBON-17 | MB-V2α′ | ||
| MBON-α2sc | 1 | MBON-18 | MB-V2α | ||
| MBON-α2p3p | 2 | MBON-19 | |||
| MBON-γ1γ2 | N.D. | 1 | MBON-20 | ||
| MBON-γ4γ5 | 1 | MBON-21 | |||
| MBON-calyx | 1 | MBON-22 | MB-CP1 |
-
The name of each cell type is given. For MBONs, we use MBON plus the name of MB lobe compartment(s) in which their dendrites arborize (for example, MBON-α1 for the MB output neurons that have dendrites in the α1 compartment; MBON-γ5β′2a for the MB output neurons that have dendrites in the γ5 compartment and the anterior layer of the β′2 compartment). For the three classes of MBONs which also have axon terminals in the MB lobes, the ‘>’ symbol is followed by the compartments (or lobes) in which the axons terminate (for example, MBON-β1>α for the MB output neuron with dendrites in β1 and synaptic terminals in the α lobe.). Subsets of MBONs have their cell bodies clustered, presumably reflecting their common developmental origin; these clusters are indicated. The neurotransmitter used by each MBON (where known) is indicated as is the number of cells of that type found per brain hemisphere (data from the accompanying manuscript; (Aso et al., 2014). We also provide a short cell type name based on simple numbering; the number of an MBON corresponds to number shown in Figure 1B. Many of these cell types have been previous described under alternative names, as indicated (Tanaka et al., 2008).
Table 2
Split GAL4 drivers for MBONs
| Driver | Cell types | p65ADZp DNA | ZpGdbd DNA |
|---|---|---|---|
| MB002B | (MBON-γ5β′2a), MBON-β′2mp | R12C11 | R14C08 |
| MB011B | MBON-γ5β′2a, MBON-β′2mp, MBON-β′2mp_bilateral | R14C08 | R15B01 |
| MB018B | MBON-α′2 | R20G03 | R19F09 |
| MB027B | MBON-α′3m, MBON-α′3ap | R24H08 | R53F03 |
| MB050B | MBON-α2sc, MBON-α′1 | R65B09 | R11F03 |
| MB051B | MBON-γ2α′1, (MBON-α′2) | R70B10 | R19F09 |
| MB052B | MBON-α2sc, (MBON-α2p3p), (MBON-α′3m), MBON-α′3ap, MBON-α′1 | R71D08 | R11F03 |
| MB057B | MBON-β′1 | R80G12 | R53H03 |
| MB077B | MBON-γ2α′1 | R25D01 | R19F09 |
| MB077C | MBON-γ2α′1 | R25D01 | R19F09 |
| MB082C | MBON-α3, MBON-α′2 | R40B08 | R23C06 |
| MB083C | MBON-γ3, MBON-γ3β′1 | R52G04 | R94B10 |
| MB085C | MBON-γ1pedc>α/β | R52H01 | R52B07 |
| MB090C | MBON-γ2α′1, (MBON-α′2) | R73H08 | R19F09 |
| MB091C | MBON-α′2 | R73H08 | R20G04 |
| MB093C | MBON-α3, (MBON-α′2) | R73H08 | R40B08 |
| MB110C | MBON-γ3, MBON-γ3β′1 | R20A02 | R94B10 |
| MB112C | MBON-γ1pedc>α/β | R93D10 | R13F04 |
| MB210B | MBON-γ5β′2a, MBON-β′2mp, (MBON-β′2mp_bilateral) | R15B01 | R27G01 |
| MB242A | MBON-calyx | R64F07 | R57C10 |
| MB262B | MBON-γ1pedc>α/β | R52B07 | R52H01 |
| MB298B | MBON-γ4>γ1γ2 | R53C03 | R24E12 |
| MB310C | MBON-α1 | R52G04 | R17C11 |
| MB399B | MBON-β2β′2a | R21D02 | R22C12 |
| MB433B | (MBON-γ4>γ1γ2), MBON-β1>α | R30E08 | R11C07 |
| MB434B | MBON-γ4>γ1γ2, MBON-β1>α | R30E08 | R53C10 |
| MB438B | PPL1-γ1pedc, (PPL1-α2α′2) | R30E11 | R22B12 |
| MB542B | MBON-α2p3p, (MBON-α′3m), MBON-α′1 | R65B09 | R51D04 |
| MB543B | MBON-α′3m, (MBON-α′3ap), MBON-α′1 | R65B09 | R81E11 |
| MB549C | MBON-α2sc, MBON-α′3ap | R71D08 | R49C12 |
| MB622B | MBON-calyx | R64F07 | R64F07 |
-
For each of 31 driver lines used in this study, the MBON cell types in which expression is seen as well as the enhancer fragments used for the activation domain (p65ADZp) and DNA binding domain (ZpGAL4DBD) hemi-driver constructs are given. All ZpGAL4DBD constructs were inserted in attP2. The insertion sites of the p65ADZp constructs are indicated by the letter at the end of the driver name as follows: A, su(Hw)attP8; B, attP40; C, VK00027. The cell types shown in brackets indicate expression in those cells was weak, stochastic or was only observed with a subset of UAS-reporters.
Additional files
-
Supplementary file 1
Significance of behavioral differences for Fly Bowl assay. For each line, we compared the fraction of time the split-GAL4/dTrpA1 line does each of 14 behaviors to two controls: empty GAL4 crossed to dTrpA1 (pBDPGAL4U/dTrpA1) and split-GAL4/+. Each data point corresponds to the fraction of time that all 20 flies in a given video performed the given behavior. The table contains a dash if the behavioral differences to both controls had different signs. Otherwise, we use the Wilcoxon rank-sum test to compare to each control separately, adjust the p-value using the Benjamini-Hochberg correction for controlling the false discovery rate to 0.05, and report the (conservative) maximum adjusted p-value of the comparison to each control. The average number of videos (n) analyzed for each split-GAL4/TrpA1 line was 5.0, for each split-GAL4/+ line was 4.2, and for the pBDPGAL4U/TrpA1 line was 143.
- https://doi.org/10.7554/eLife.04580.037
Download links
A two-part list of links to download the article, or parts of the article, in various formats.
Downloads (link to download the article as PDF)
Open citations (links to open the citations from this article in various online reference manager services)
Cite this article (links to download the citations from this article in formats compatible with various reference manager tools)
Mushroom body output neurons encode valence and guide memory-based action selection in Drosophila
eLife 3:e04580.
https://doi.org/10.7554/eLife.04580


