Molecular insights into RNA and DNA helicase evolution from the determinants of specificity for a DEAD-box RNA helicase
- University of Texas at Austin, United States
Figures
Figure 1 with 1 supplement

Structure, specificity, and mechanisms of the helicase core of Mss116 and other SF1 and SF2 helicases.
(A) Domain architecture and characteristics of helicases belonging to different SF1 and SF2 families (Fairman-Williams et al., 2010). Two other SF1 (Pif1-like and Upf1-like) and four other SF2 (Ski2-like; RecG-like; T1R; and Rad3/XPD) families have been identified (Fairman-Williams et al., 2010). Helicase core domains 1 and 2 are colored light blue and green, respectively, while appended domains and insertions, which vary in size, composition, and function, are colored orange; domains are not to scale. (B) Schematic of the domain architecture of the helicase core of Mss116 (D1, blue; D2, green; C-terminal extension of D2 [CTE], orange) showing the location of conserved DEAD-box sequence motifs (Fairman-Williams et al., 2010). Full-length Mss116 contains additional unstructured N-terminal (residues 37–87) and C-terminal (residues 598–664) extensions that are not required for helicase activity (Cao et al., 2011; Mohr et al., 2011). (C) Structure of the closed-state helicase core of Mss116 (PDB accession 3I5X) (Del Campo and Lambowitz, 2009) bound to ssRNA (U10-RNA; yellow) and adenosine nucleotide (AMP-PNP; black). (D) Model for RNA duplex binding and unwinding by Mss116. The helicase core domains of Mss116 have modular roles in substrate loading (Mallam et al., 2012). D1 captures ATP in the open-state enzyme using the Q-motif, which coordinates the adenine base, and motifs I and II, which are the conserved triphosphate-binding loop and Mg2+-binding aspartic acid motifs, respectively, present in many other ATP-binding enzymes (Walker et al., 1982; Rudolph et al., 2006; Schutz et al., 2010; Mallam et al., 2012). D2 recognizes duplex RNA (Mallam et al., 2012). When ATP and dsRNA are bound to D1 and D2, respectively, core closure occurs, leading to unwinding of the dsRNA bound to D2 by bending one RNA strand and displacing the other. During unwinding and formation of the closed-state helicase core complex, ATP bound to D1 makes additional interactions with motifs Va and VI in D2. The closed-state helicase core bound to ssRNA and ATP represents the ‘post-unwound’ state of the enzyme (Figure 1C). ATP hydrolysis occurs in the closed state, followed by dissociation of Pi and ADP, which leads to the reopening of the core and the release of the bound ssRNA, thereby regenerating the enzyme (Henn et al., 2010; Cao et al., 2011).
Figure 1—figure supplement 1
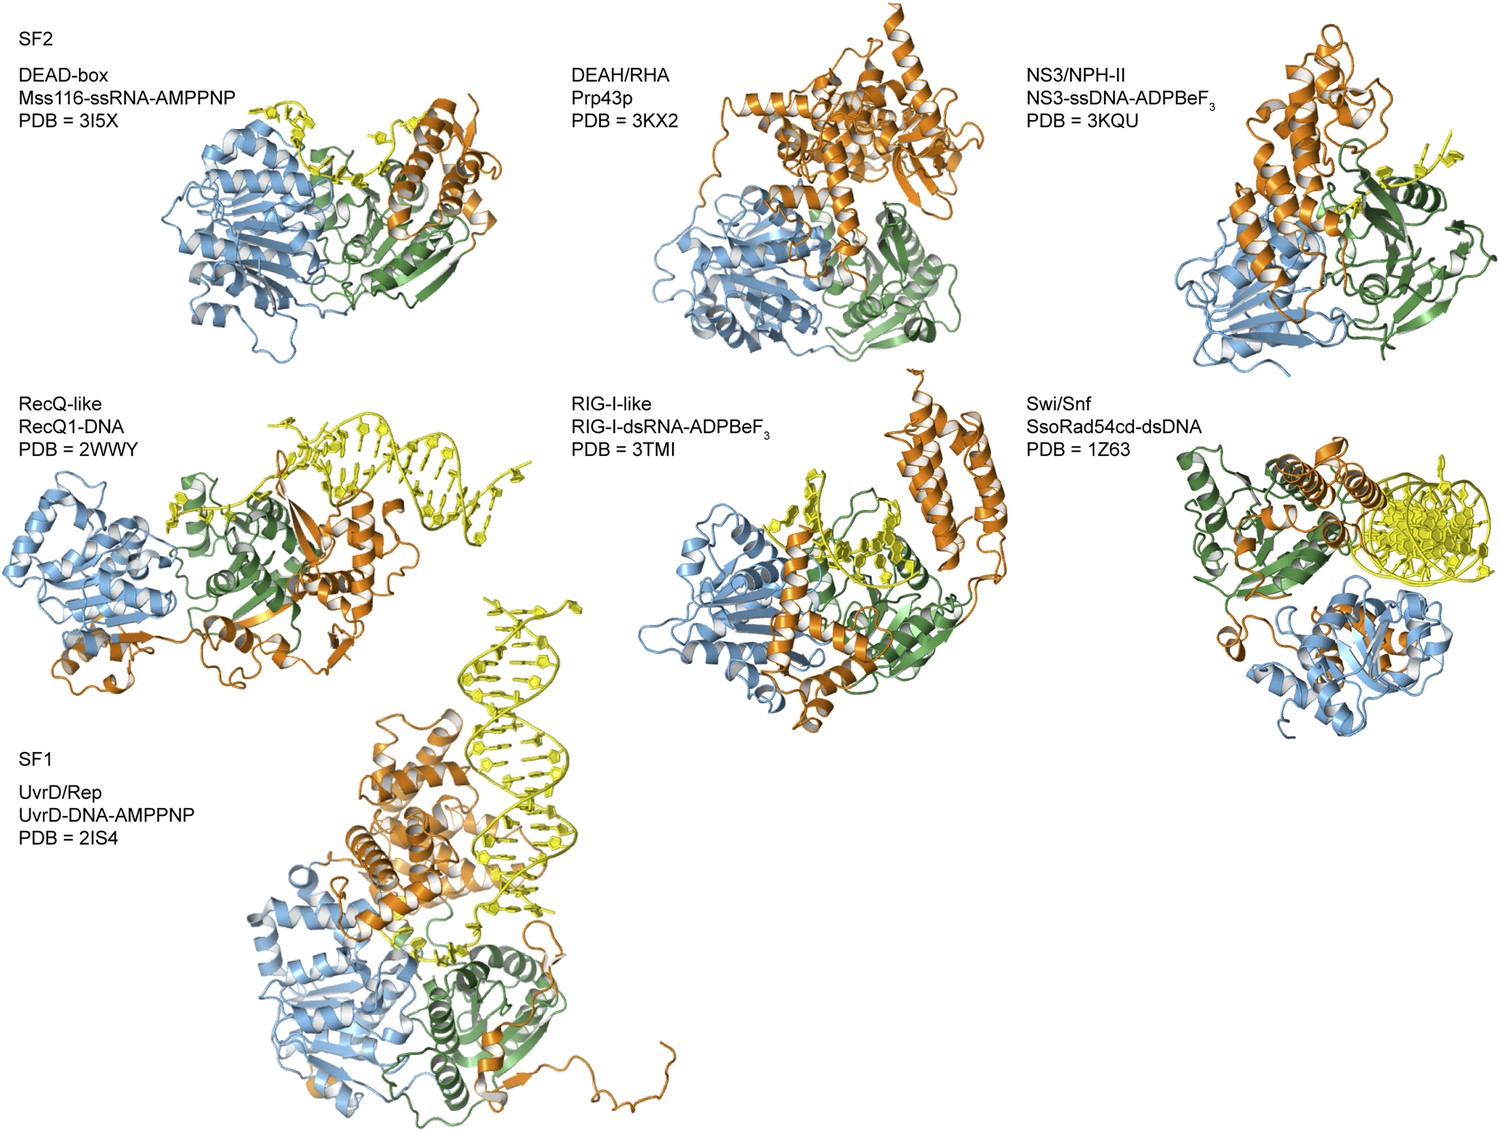
Crystal structures of helicases belonging to different SF1 and SF2 families.
Examples are taken from the helicase families shown in Figure 1A. Most are in complex with nucleic acid (yellow) and domains are colored as in Figure 1A. The composition and PDB accession code are given for each structure.
Figure 2 with 2 supplements
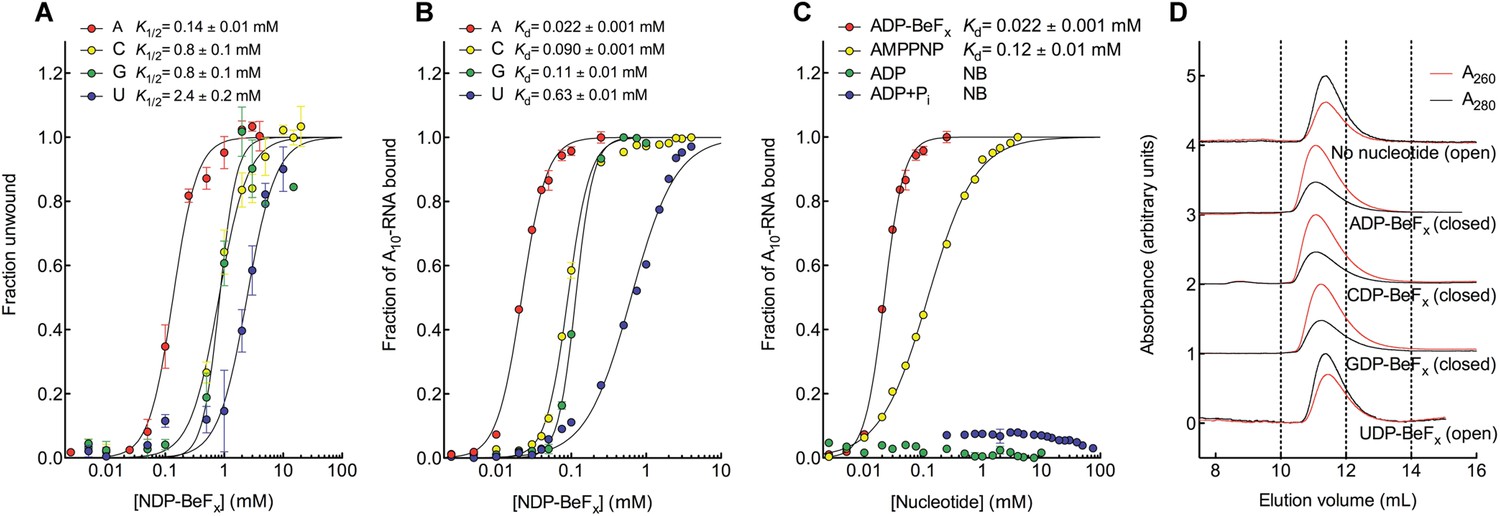
The biochemical basis for the ATP specificity of the helicase core of Mss116.
(A) dsRNA unwinding by the MBP-tagged helicase core measured under equilibrium conditions using a gel-based fluorescence assay to monitor the formation of a closed-state complex containing bound ssRNA at increasing concentrations of NDP-BeFx, N = A, C, G, or U (Figure 2—figure supplement 1). The fraction of unwound duplex was obtained by normalizing the band intensities separately for each gel using the parameters from the fit to a one-site binding model, as the change in fluorescence upon unwinding is different under each condition. The extent of unwinding with UDP-BeFx was less than that for the other nucleotide analogs, and the maximum concentration of UDP-BeFx used in this assay was insufficient to drive unwinding to completion (Figure 2—figure supplement 1). This could be because UDP-BeFx bound at saturating concentrations to D1 cannot efficiently induce a closed state. (B) Equilibrium binding of A10-RNA to the MBP-tagged helicase core determined by fluorescence anisotropy measurements at increasing concentrations of NDP-BeFx, N = A, C, G, or U. (C) Equilibrium binding of A10-RNA to the MBP-tagged helicase core determined as in (B) at increasing concentrations of ADP-BeFx, AMP-PNP, ADP, and ADP + Pi. Error bars in (A–C) represent the standard error for at least three independent measurements, and the error in the K1/2 or Kd represents the standard error of the non-linear regression. NB, no appreciable binding. In (B and C), the fraction of A10-RNA bound was calculated by normalizing against the anisotropy signal for unbound and fully bound substrate obtained from the fit to a one-site binding model. (D) Normalized SEC profiles monitored by absorbance at 260 nm (red) and 280 nm (black) for the helicase core in the absence of all substrates and in the presence of A10-RNA + NDP-BeFx, N = A, C, G, or U. An A260/A280 >1 at the maximum absorbance indicates the formation of a closed-state complex.
Figure 2—figure supplement 1
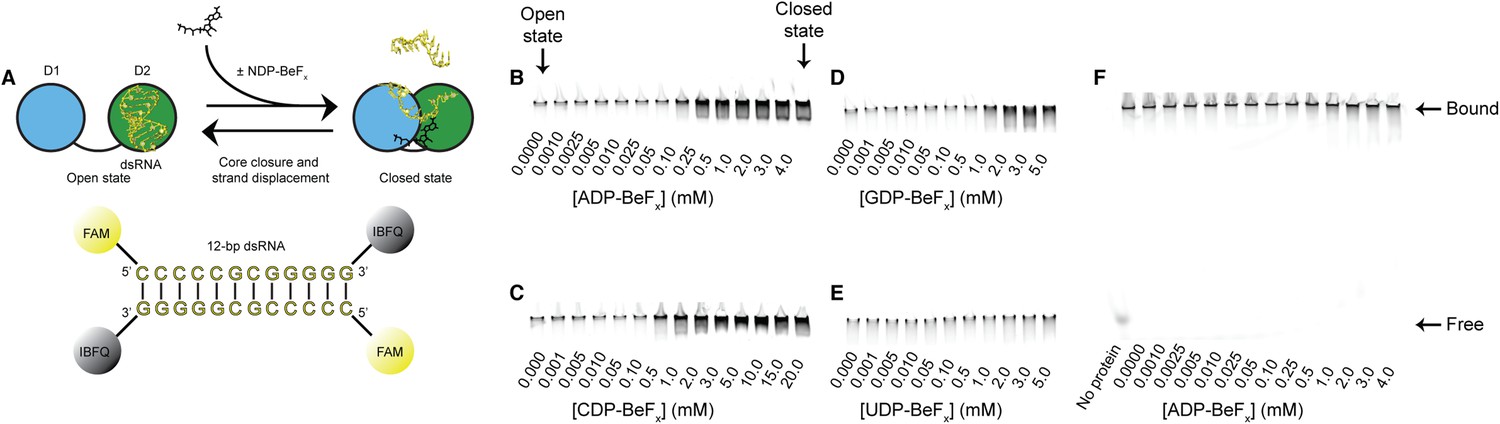
RNA unwinding measured by using a gel-based fluorescence assay to monitor the formation of a closed-state complex containing bound ssRNA.
(A) Schematic representation of the equilibrium unwinding reaction measured in this assay. Unwinding was probed by using a 12-bp dsRNA substrate labeled with a fluorophore (6-carboxyfluorescein; FAM) and quencher (Iowa Black FQ; IBFQ) probes at the 5′ and 3′ ends, respectively. An increase in fluorescence of this substrate occurs when the helicase core unwinds the dsRNA and forms a closed-state bound to ssRNA. (B–E) Representative unwinding assays for dsRNA (100 nM) by the helicase core of Mss116 (2 μM) measured at increasing concentrations of NDP-BeFx with N = A, C, G, and U for B–E, respectively. Samples were loaded in the reaction medium and resolved in a non-denaturing 6% polyacrylamide gel run at 4°C in 0.5× Tris/Borate/EDTA buffer (pH 8.3). Arrows mark complexes corresponding to the open- (in the absence of NDP-BeFx) and closed-state protein bound to RNA. Proteins have an N-terminal MBP tag to increase solubility under the EMSA conditions. The double band seen in some lanes could be the result of one or two protein molecules bound to a partially unwound duplex or to a closed-state with or without a partially unwound second strand. (F) Control unwinding assay using an equivalent 12-bp 5′ FAM-dsRNA with no quencher to demonstrate that, under the assay conditions, the RNA is always bound to the helicase core and widely separated from free substrate.
Figure 2—figure supplement 2
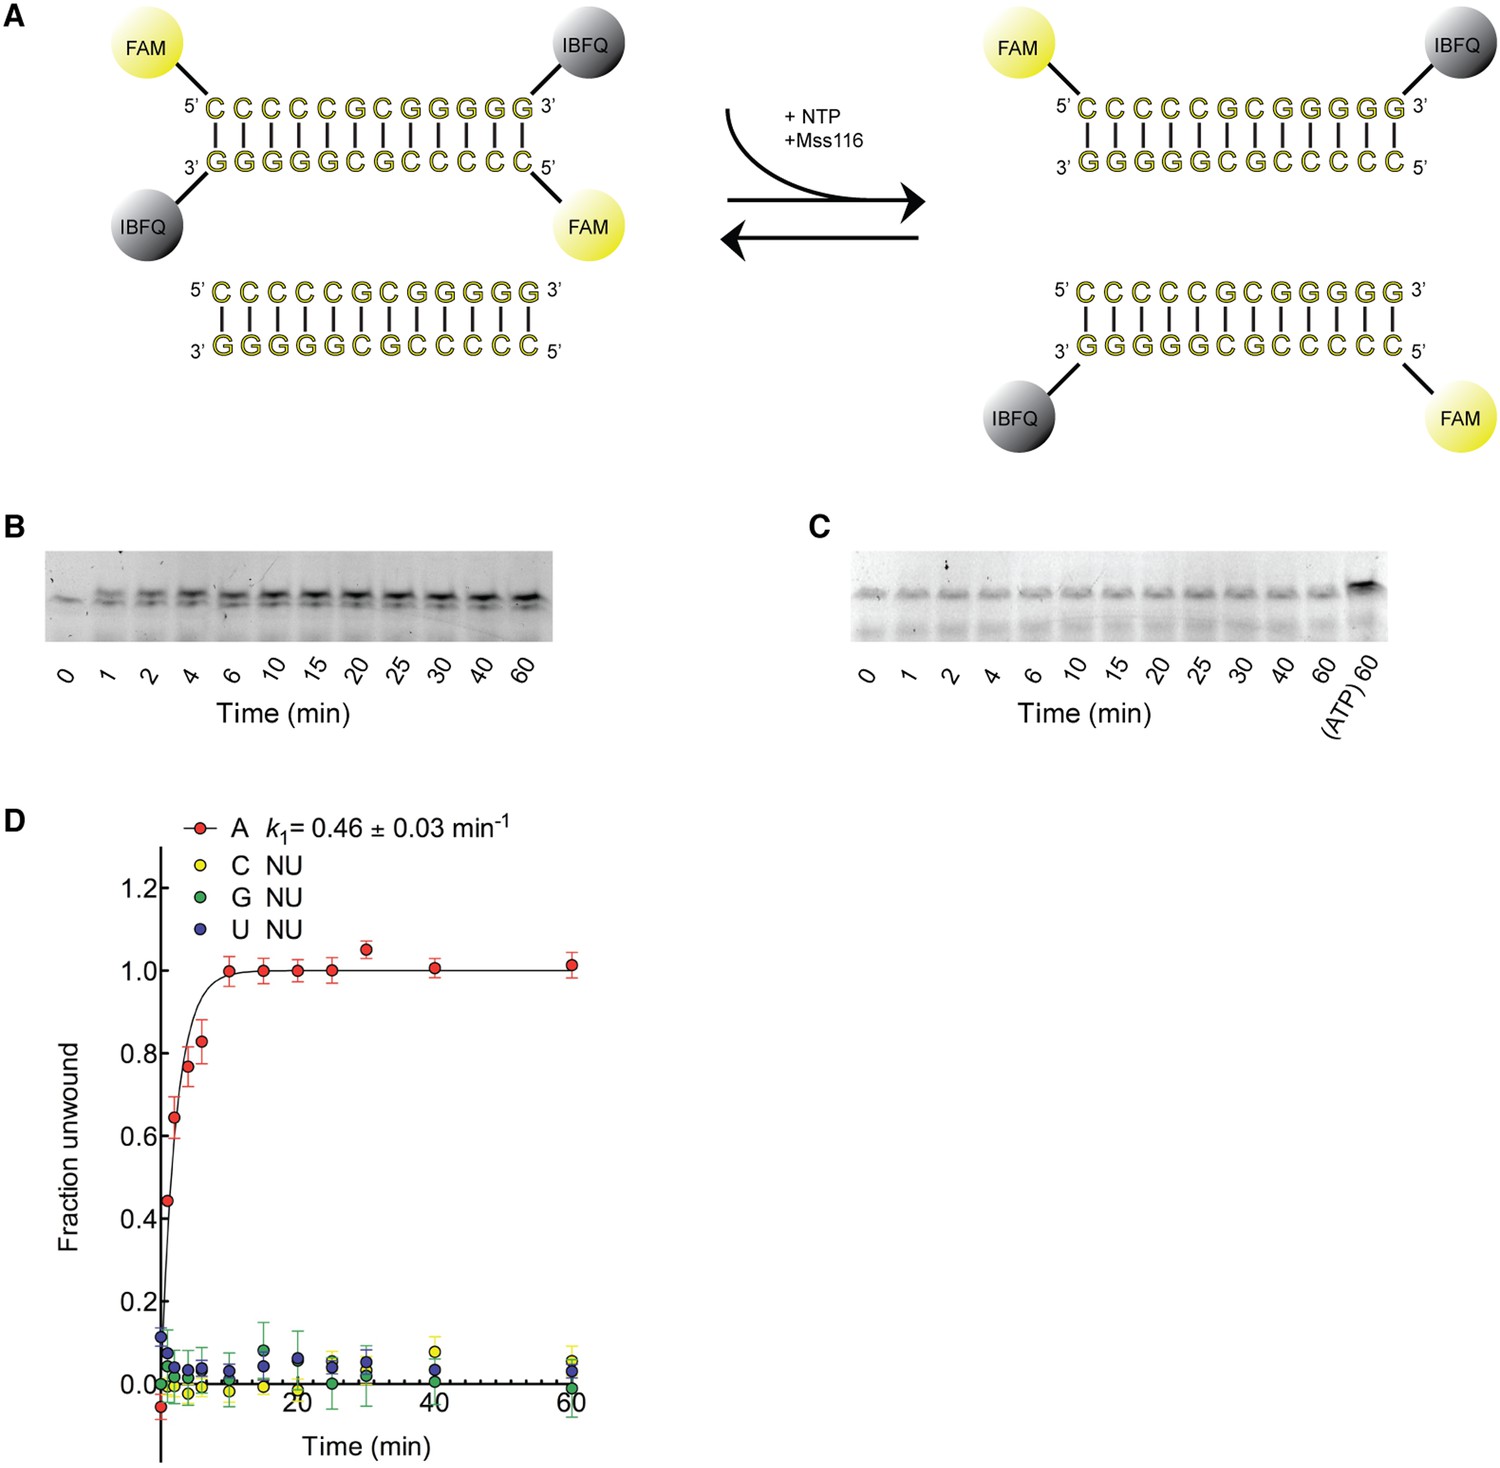
Kinetic assay of the unwinding of dsRNA by Mss116 with different NTPs.
(A) Schematic representation of the unwinding reaction measured in this assay. Unwinding was probed by using a 12-bp dsRNA substrate labeled with a fluorophore (6-carboxyfluorescein; FAM) and quencher (Iowa Black FQ; IBFQ) probes at the 5′ and 3′ ends, respectively (IDT). An increase in fluorescence of this substrate occurs upon unwinding and re-annealing to an unlabeled strand from a duplex of the same sequence that is present in excess. (B) Representative unwinding time course for labeled dsRNA (125 nM) by the helicase core of Mss116 (2 μM) measured at 5 mM ATP-Mg2+. After the addition of stop buffer to remove any bound protein, duplex samples were resolved in a non-denaturing 20% polyacrylamide gel run at 4°C in 1× Tris/Borate/EDTA buffer (pH 8.3). (C) Representative unwinding time course for labeled dsRNA (125 nM) by the helicase core of Mss116 (2 μM) measured at 5 mM CTP-Mg2+ with samples resolved as in (B). The last lane represents the same duplex unwound by ATP after 60 min. (D) Kinetic unwinding profiles of dsRNA by Mss116 for NTP, N = A, C, G, or U. Error bars represent the standard error for at least three independent measurements, and the error in k1 represents the standard error of the non-linear regression. NU, no appreciable unwinding. Unwinding data for ATP were normalized using the parameters obtained from the fit to a first-order reaction with a single exponential. In the case of other nucleoside triphosphates where no unwinding was observed, data were normalized against the signal for a duplex fully unwound by ATP at the same concentration (see panel C, final lane). Assays were performed in a buffer containing 5 mM free Mg2+. Additional assays were performed at 0.5 mM Mg2+, as previous data indicate that the unwinding activity of Mss116 increases at lower Mg2+ concentrations (Halls et al., 2007). These gave similar results.
Figure 3

The structural basis for the ATP specificity of the helicase core of Mss116.
(A) Crystal structures of the closed-state helicase core of Mss116 bound to ssRNA and different nucleotide analogues (D1D2–A10-RNA–NDP-BeFx for N = A, C, G, or U). Structures are colored according to the scheme in Figure 1C. (B) Comparisons of the protein–substrate interactions in the NDP-BeFx binding pockets of the structures shown in (A). Side chains that make direct contacts with the NDP are shown as ball and stick models. A 2Fo − Fc electron density map contoured at 1.0 σ for the NDP-BeFx ligand is shown in gray. Mg2+ ions and water molecules are shown as green and red spheres, respectively, and the atoms of BeF3 are shown in purple (Be) and yellow (F). Motif II (‘DEAD’) makes indirect contacts via water molecules to the BeF3 moiety, which corresponds to the γ-phosphate of ATP. (C) Schematics of direct NDP–protein interactions for the structures shown in (A). See also Table 2.
Figure 4 with 1 supplement
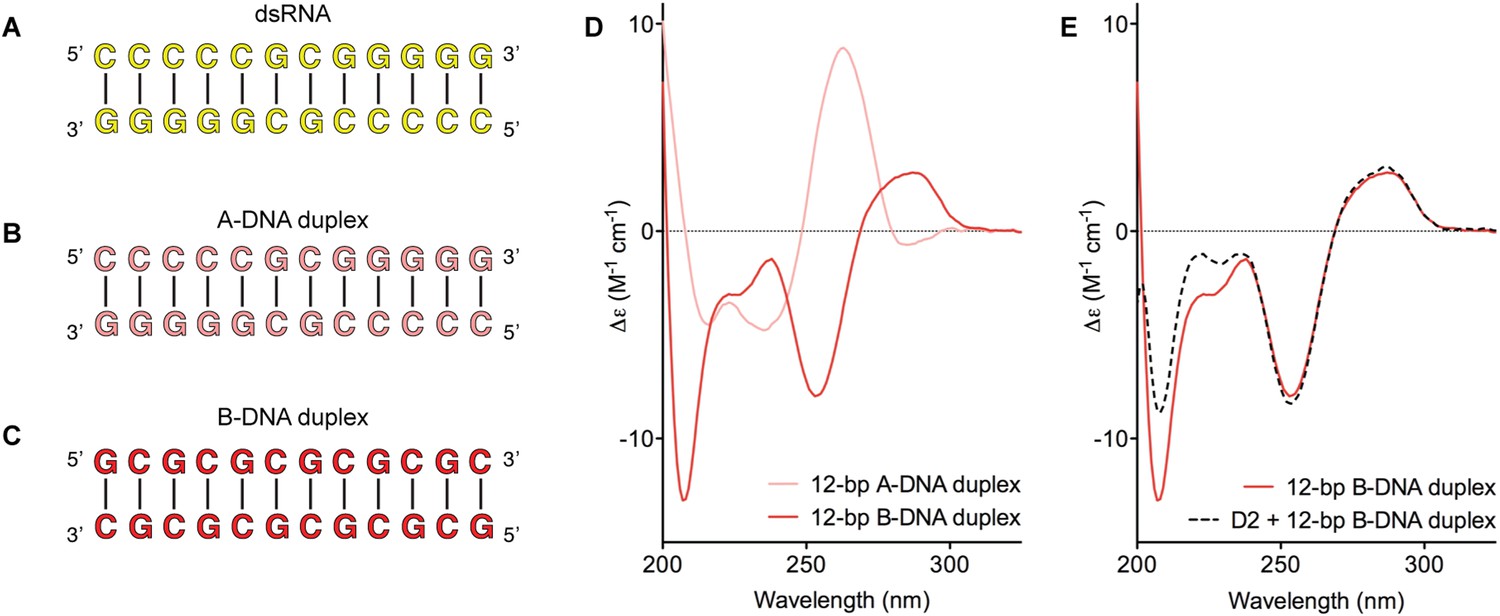
Model nucleic acid substrates.
(A–C) 12-bp model substrates of (A) dsRNA (yellow); (B) A-DNA duplex (pink); and (C) B-DNA duplex (red). The duplex geometry of the DNA substrates has been previously characterized in solution by CD measurements (Basham et al., 1995) and X-ray crystallography (Verdaguer et al., 1991). The duplexes are predicted to have similar stabilities (predicted melting temperatures are 61.0°C, 59.4°C, and 63.9°C for the dsRNA, A-DNA, and B-DNA duplexes, respectively [Owczarzy et al., 2008]). (D) CD spectra of A-DNA (pink) and B-DNA (red) duplexes, which are consistent with previously reported spectra of identical duplexes (Basham et al., 1995; Kypr et al., 2009). The CD-spectrum of the A-DNA duplex has a characteristic strong positive peak at 260 nm and negative peaks at 240 and 210 nm (Ivanov et al., 1973). The B-DNA duplex is characterized by a positive peak at 260–280 nm and a negative peak at ∼245 nm (Kypr et al., 2009). (E) CD spectra of the B-DNA duplex (100 μM) in the absence (solid red line) and presence (dashed black line) of D2 (120 μM). Spectra are shown in units of molar circular dichroism (Δε) and are background subtracted for the presence of protein.
Figure 4—figure supplement 1
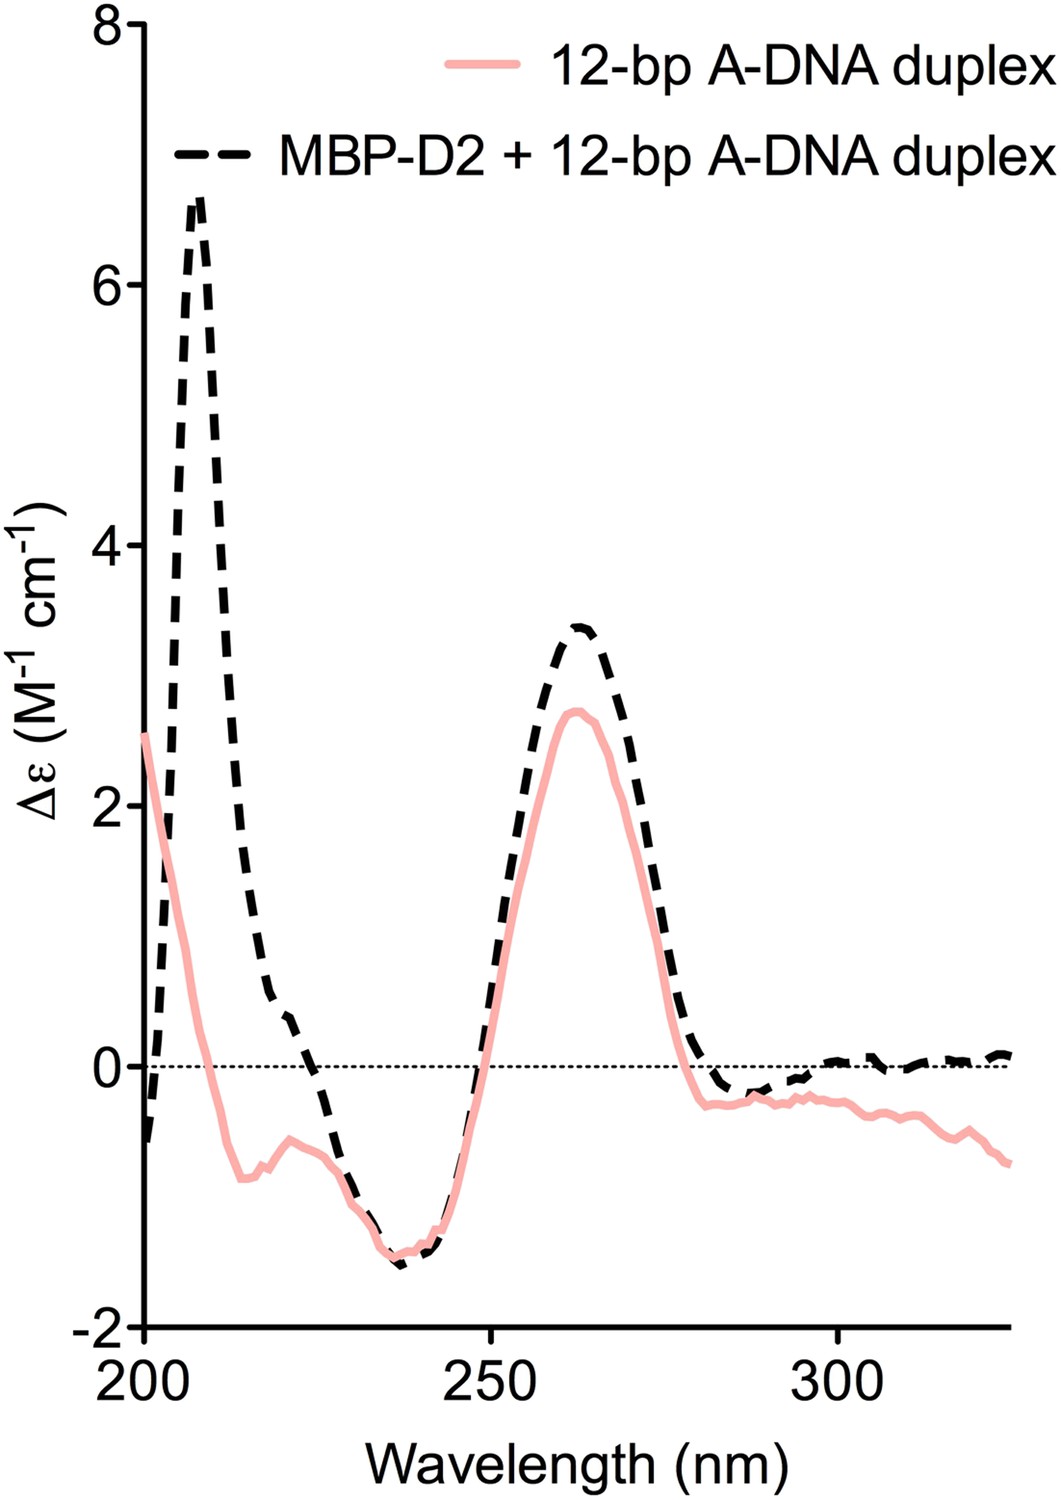
CD spectra of A-DNA duplex (80 μM) in the absence (solid pink line) and presence (dashed black line) of MBP-D2 (100 μM).
Spectra are shown in units of molar circular dichroism (Δε) and are background subtracted for the presence of protein. The characteristic strong positive and negative peaks in the CD-spectrum of the A-DNA duplex at 260 nm and 240 nm, respectively, remain in the presence of protein.
Figure 5 with 4 supplements
The biochemical basis for the RNA specificity of the helicase core of Mss116.
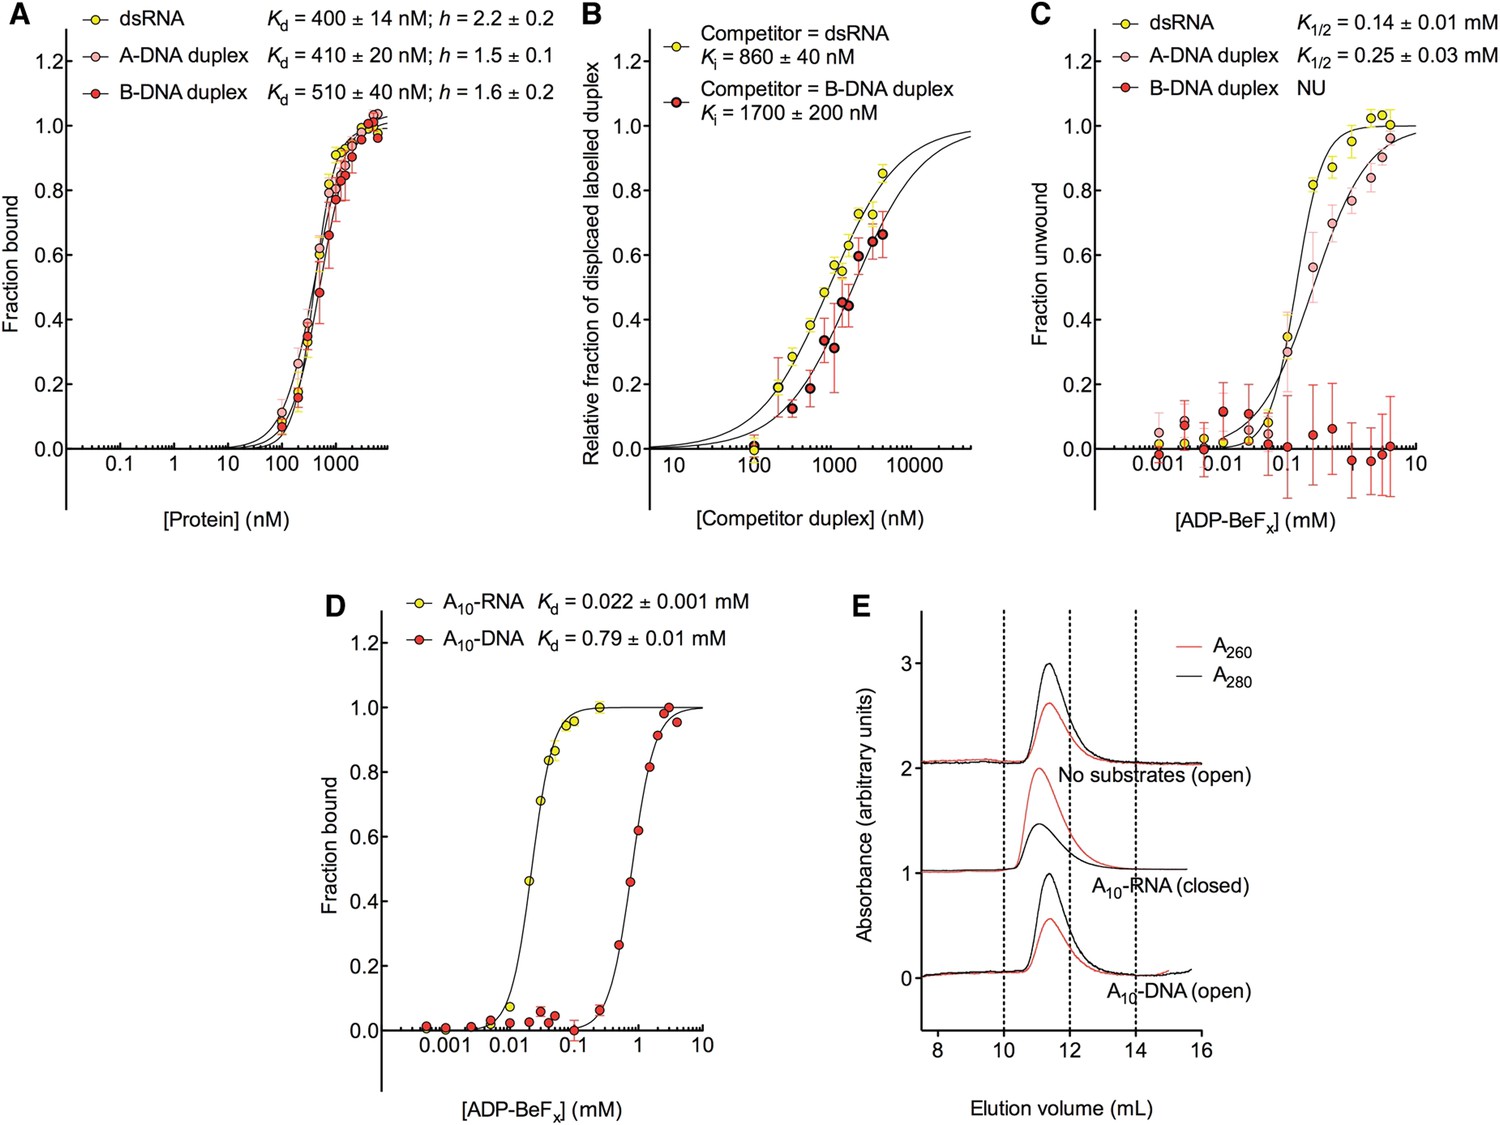
(A) Equilibrium binding of duplex substrates to MBP-tagged D2 in the absence of nucleotide determined by EMSA. (B) Competitive displacement from MBP-tagged D2 of 5′ FAM-B-DNA duplex (250 nM) by unlabeled dsRNA (0–6 μM, yellow, Ki = 860 ± 40 nM) and of 5′ FAM-dsRNA (250 nM) by unlabeled B-DNA duplex (0–6 μM, red, Ki = 1700 ± 200 nM). (C) Unwinding of duplex substrates by the MBP-tagged helicase core measured under equilibrium conditions by using a gel-based fluorescence assay to monitor the formation of a closed-state complex at increasing concentrations of ADP-BeFx (see also Figure 2—figure supplement 1). NU, no appreciable unwinding. (D) Equilibrium binding of A10-DNA to the MBP-tagged helicase core determined by fluorescence anisotropy measurements at increasing concentrations of ADP-BeFx. The binding of A10-RNA under the same conditions is shown for comparison (taken from Figure 2B). In (A–D), data were normalized using the signal obtained from the fit to the appropriate model outlined in the ‘Materials and methods’. (E) Normalized SEC profiles monitored by the absorbance at 260 nm (red) and 280 nm (black) for the helicase core in the absence of substrates (top) and in the presence of either A10-RNA + ADP-BeFx (middle) and A10-DNA + ADP-BeFx (bottom). An A260/A280 >1 at the maximum absorbance indicates the formation of a stable closed-state complex (Table 1).
Figure 5—figure supplement 1
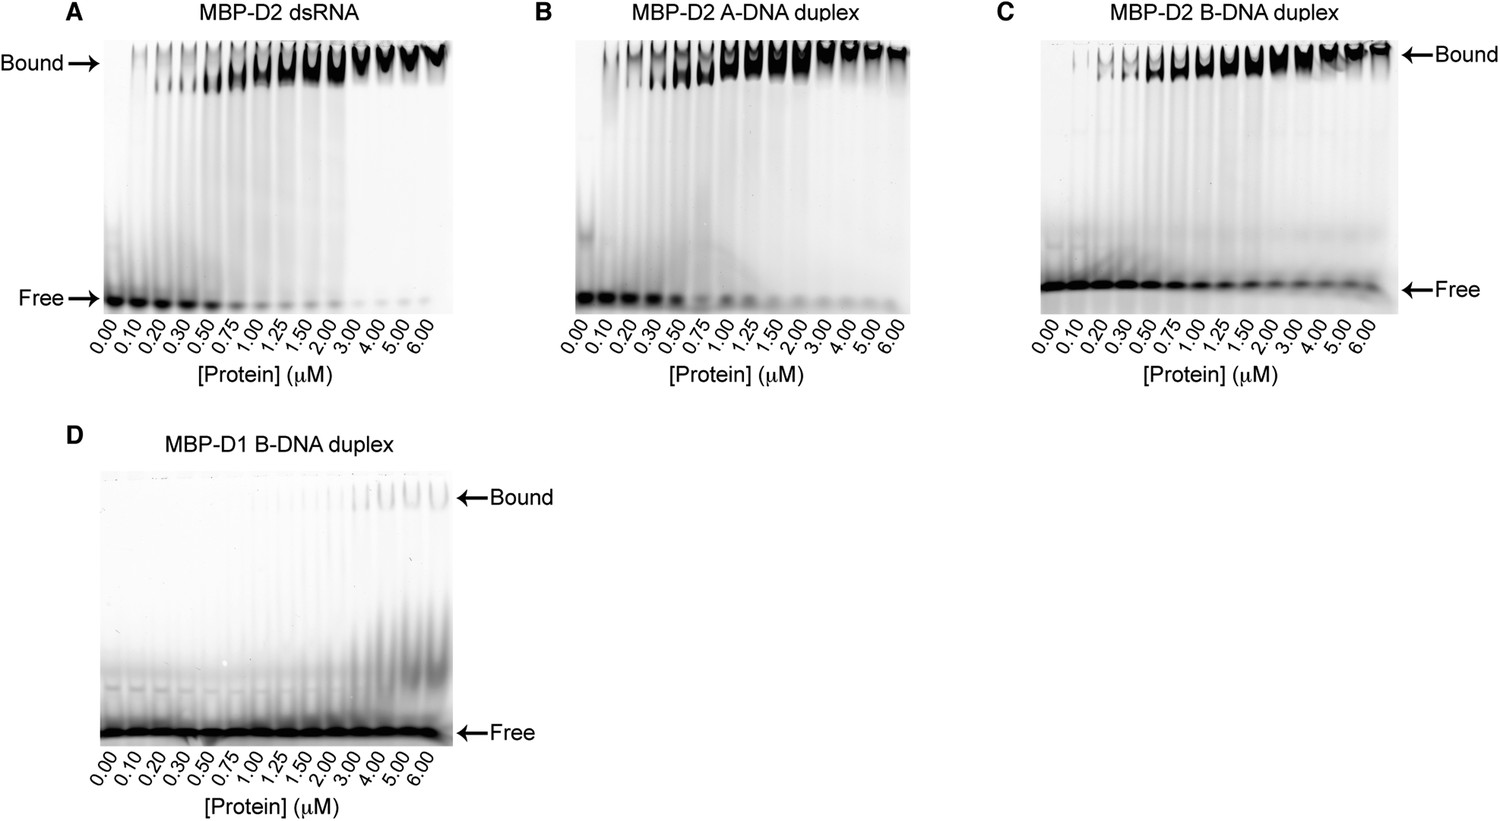
EMSA binding assays of model duplexes.
Representative binding assays of Mss116 MBP-D2 (0–6 μM) to a 5′ FAM-labeled 12-bp duplex substrate (100 nM) for (A) dsRNA; (B) an A-DNA duplex; and (C) a B-DNA duplex. Samples were loaded in the reaction medium and resolved in a non-denaturing 6% polyacrylamide gel run at 4°C in 0.5× Tris/Borate/EDTA buffer (pH 8.3). Arrows mark the positions of free and bound duplex substrate. Proteins have an N-terminal MBP tag to increase solubility under the EMSA conditions. The binding data show cooperativity for all duplex substrates (Hill coefficients are 2.2, 1.5, and 1.6 for the dsRNA, A-DNA, and B-DNA duplexes, respectively, Figure 5A), which suggests that multiple molecules of D2 can bind to a single duplex substrate. The second band corresponding to bound substrate seen in some lanes could also be indicative of this. (D) Representative binding assays of Mss116 MBP-D1 (0–6 μM) to a 5′ FAM-B-DNA duplex (100 nM) to demonstrate minimal binding of D1 to the B-DNA duplex under these experimental conditions.
Figure 5—figure supplement 2

Duplex unwinding measured by using a gel-based fluorescence assay to monitor the formation of a closed-state complex containing bound ssRNA or ssDNA.
Unwinding was probed by using the duplex substrates shown in Figure 4A–C, which were labeled with fluorophore (FAM) and quencher (IBFQ) probes at the 5′ and 3′ ends, respectively (IDT). A change in fluorescence of these substrates occurs when the helicase core unwinds the duplex and forms a closed-state bound to a single-stranded region of RNA (Figure 2—figure supplement 1A). (A–C) Representative unwinding assays for (A) dsRNA; (B) A-DNA; and (C) B-DNA duplexes by the MBP-tagged helicase core (2 μM) measured at increasing concentrations of ADP-BeFx (0–4 mM), as described in Figure 2—figure supplement 1A. Arrows mark the complexes corresponding to the open and closed state protein bound to nucleic acid.
Figure 5—figure supplement 3
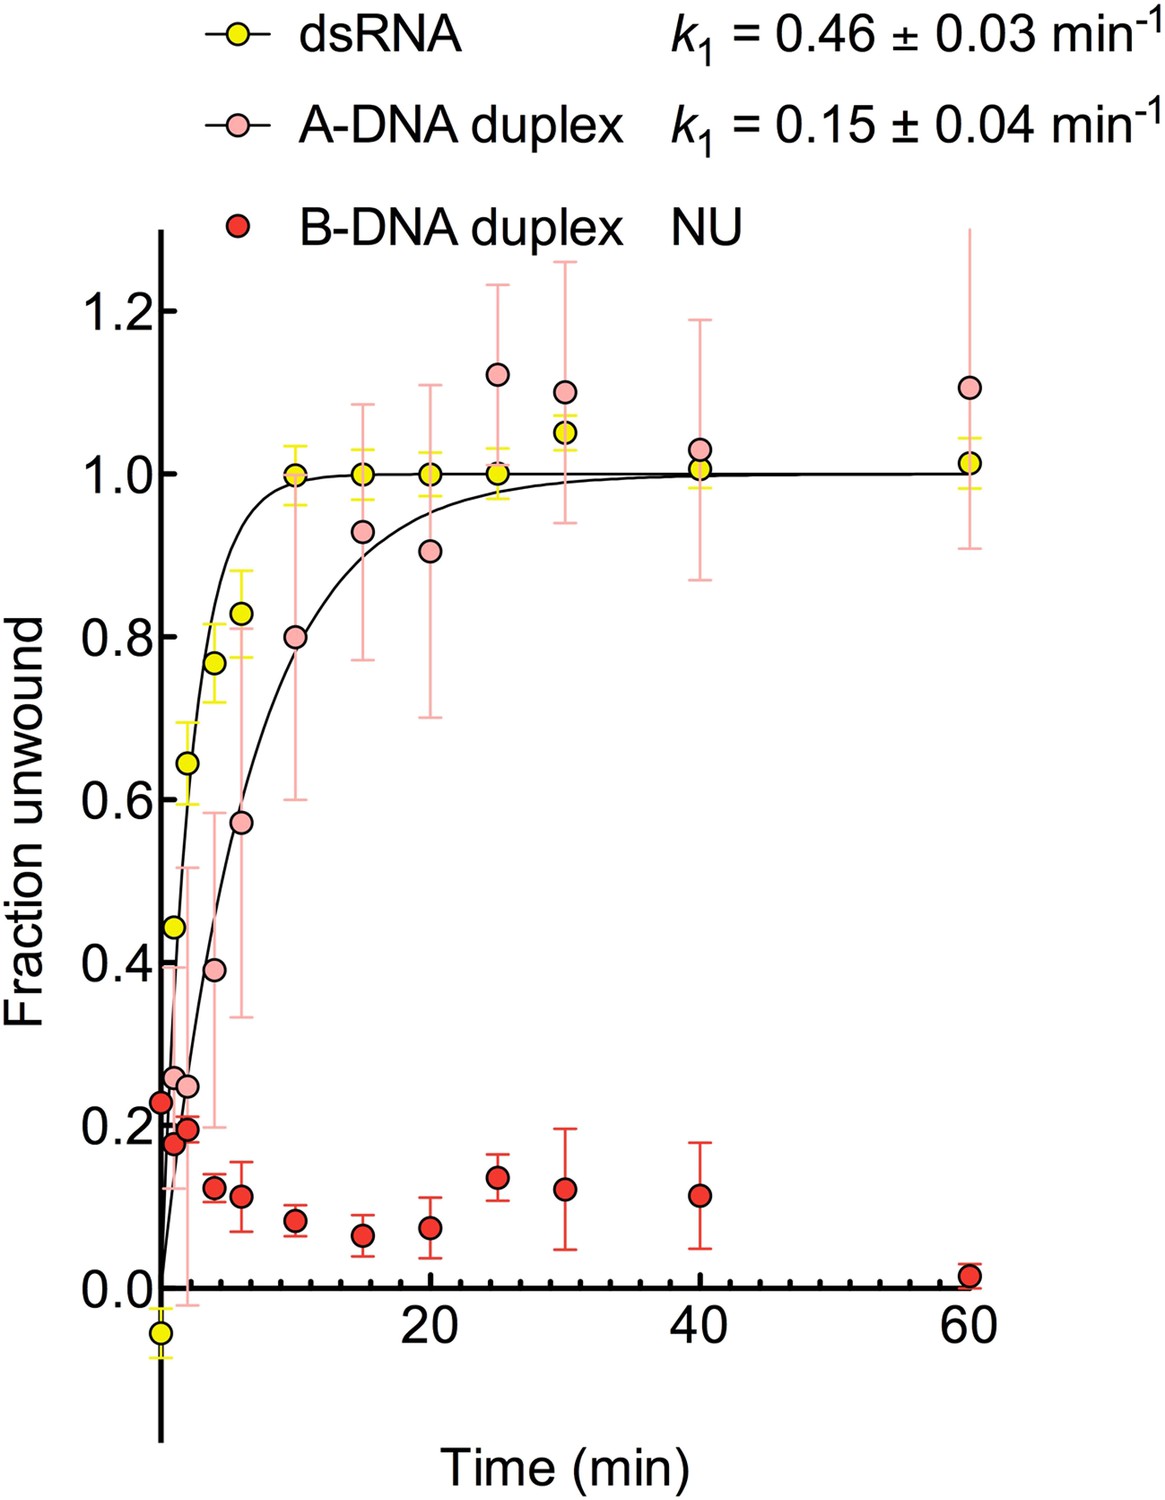
Kinetic assay of unwinding of duplex substrates by ATP.
Kinetic unwinding profiles of dsRNA, A-DNA, and B-DNA duplexes catalyzed by D1D2 (2 μM) and ATP (5 mM). Error bars represent the standard error for at least three independent measurements, and the error in k1 represents the standard error of the non-linear regression. NU, no appreciable unwinding. Data were normalized using the parameters obtained from the fit to a first-order reaction with a single exponential. In the case of B-DNA when no unwinding was observed, data were normalized using a signal for a fully unwound duplex. This was obtained unwinding and re-annealing a control sample containing the same amount of labeled and unlabeled duplex by heating to 94°C for 3 min and cooling to room temperature on the bench.
Figure 5—figure supplement 4

Characterization of the helicase core in the absence and presence of duplex substrates using size-exclusion chromatography.
SEC was performed using a Superdex 75 10/300 GL column (GE Healthcare) and a BioLogic DuoFlow chromatography system (Bio-Rad) in a buffer of 20 mM Tris–HCl (pH 7.5), 200 mM KCl, 10% glycerol, 1 mM DTT, 5 mM MgCl2. Complexes were assembled as outlined in the ‘Materials and methods’ and SEC data were measured using absorbance at 260 nm (red) and 280 nm (black). Example elution profiles are shown for D1D2 in the absence of substrates; in the presence of dsRNA only; in the presence of dsRNA and ADP-BeFx; in the presence of A-DNA-duplex and ADP-BeFx; and in the presence of B-DNA duplex and ADP-BeFx. The ratio of A260/A280, which is approximately 0.5 for free protein and >1 for protein–nucleic acid complexes, was used as an indicator of the formation of a closed-state complex that contains nucleic acid. However, the smaller elution volume at maximum A260 for dsRNA–D1D2–ADP-BeFx and A-DNA duplex-D1D2–ADP-BeFx (Ve = 9.6 ml for both) suggests the formation of some higher-order closed-state complexes, possibly with two protein molecules bound on either side of a partially unwound duplex. This is consistent with the cooperativity in duplex unwinding reactions previously observed for Mss116 (Halls et al., 2007).
Figure 6
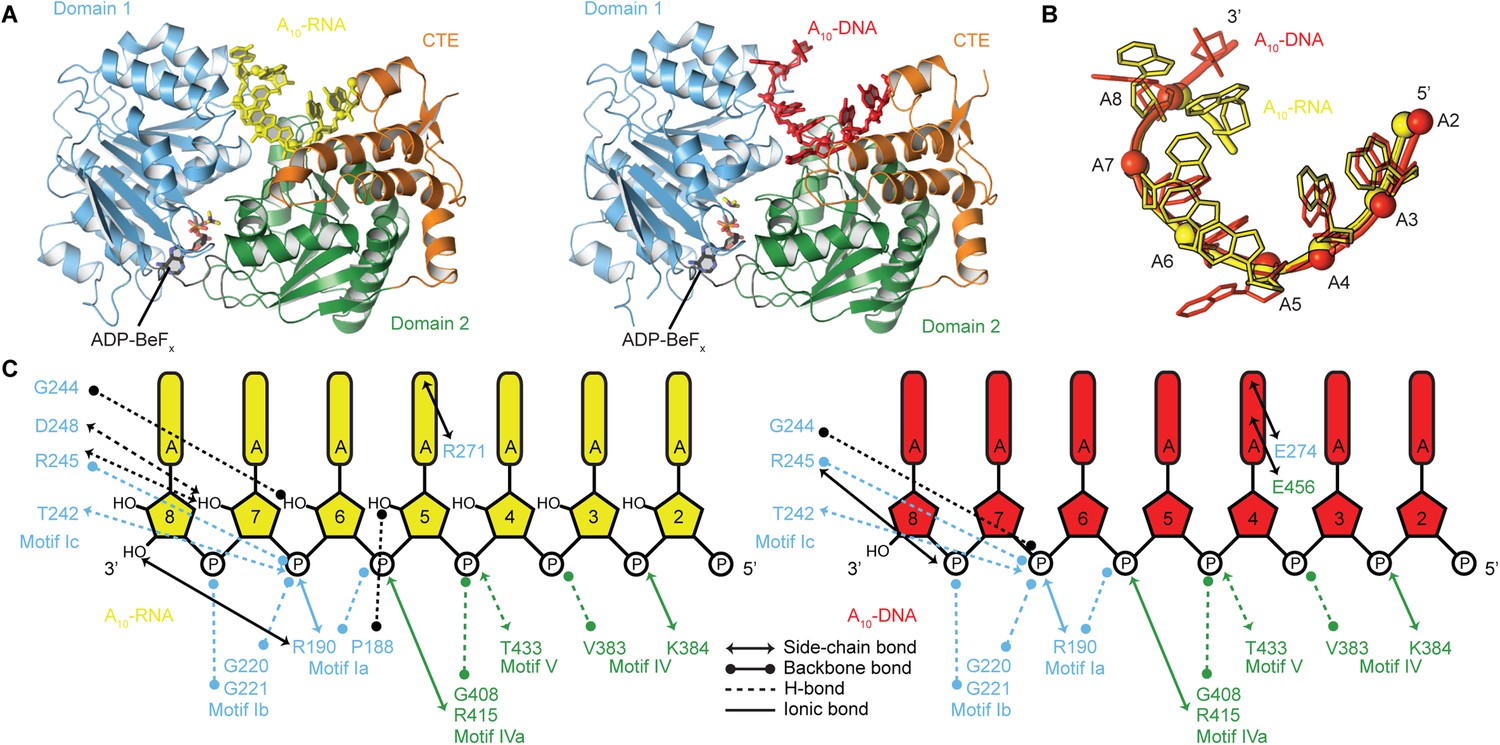
The structural basis for the RNA specificity of the helicase core of Mss116.
(A) Closed state crystal structures of the helicase core of Mss116 with the ATP analogue ADP-BeFx and A10-RNA (yellow) or A10-DNA (red). The helicase core is colored as in Figure 1C. (B) A comparison of the binding trajectory of equivalent nucleotides of A10-RNA (yellow) and A10-DNA (red) bound in the closed state. (C) A schematic comparing the interactions of A10-RNA (yellow) and A10-DNA (red) with the closed-state helicase core, colored blue and green to D1 and D2, respectively. Interactions unique to each structure are colored black.
Figure 7

Models and crystal structures of closed-state complexes of SF2 helicases.
(A) Surface representation of closed-state Mss116 with dsRNA modeled in the duplex RNA-binding pocket of D2. Sterically incompatible regions of D1 are highlighted in red, and these indicate how D1 promotes RNA unwinding upon core closure by disrupting the base pairing in the dsRNA. In particular, helicase motifs Ia, Ib, and Ic and the DEAD-box specific post-II motif in D1 displace one RNA strand and bend the other during RNA duplex unwinding (Mallam et al., 2012). (B) Surface representation of closed-state Mss116 with a B-DNA duplex, which is longer and thinner than an A-form duplex (Dickerson et al., 1982), modeled in the duplex RNA-binding pocket of D2. There are no appreciable clashes between dsDNA and the core in this model, which suggests why core closure does not promote unwinding of a B-DNA duplex (Figure 5C and Figure 5—figure supplement 3). (C) Closed-state structure of D1-D3 of human RIG-I helicase (PDB = 3TMI) bound to dsRNA (Jiang et al., 2011). dsRNA is accommodated in the closed-state of RIG-I, which explains how it functions by binding and/or translocating along a duplex RNA substrate (Myong et al., 2009; Rawling and Pyle, 2014). (D) Closed-state model of Sulfolobus solfataricus Swi2/Snf2 helicase core and a B-DNA duplex adapted from Durr et al. (2005). This model suggests that the Swi2/Snf2 helicase core can accommodate a B-form DNA duplex in a closed-state conformation and explains how helicases in this family function by translocating along DNA duplexes (Figure 1A). Proteins and nucleic acids are colored as in Figure 1.
Tables
Table 1
Size exclusion chromatography analysis of the helicase core of Mss116
| Sample | Elution volume at maximum absorbance/ml | A260/A280 of peak at maximum absorbance | Likely predominant state of core |
|---|---|---|---|
| Free protein | |||
| D1D2 (Mss116 helicase core) | 11.4 | 0.6 | Open |
| Free nucleic acid | |||
| dsRNA | 16.3 | 2.1 | − |
| A-DNA duplex | 15.1 | 1.6 | − |
| B-DNA duplex | 15.3 | 1.9 | − |
| A10-RNA | 18.6 | 3.0 | − |
| A10-DNA | 16.6 | 3.4 | − |
| Protein–RNA–nucleotide complexes* | |||
| D1D2–dsRNA–ADP-BeFx | 9.6 | 1.1 | Closed |
| D1D2–A-DNA-duplex–ADP-BeFx | 9.6 | 1.2 | Closed |
| D1D2–B-DNA-duplex–ADP-BeFx | 11.4 | 0.6 | Open |
| D1D2–A10-RNA–ADP-BeFx | 11.0 | 2.2 | Closed |
| D1D2–A10-RNA–CDP-BeFx | 11.1 | 2.2 | Closed |
| D1D2–A10-RNA–GDP-BeFx | 11.2 | 2.3 | Closed |
| D1D2–A10-RNA–UDP-BeFx | 11.4 | 1.0 | Open |
| D1D2–A10-DNA–ADP-BeFx | 11.4 | 0.6 | Open |
-
*
Parameters are quoted for the peak containing protein as determined by A214.
Table 2
Crystallographic data and refinement statistics
| Complex | D1D2–A10-RNA–ADP-BeFx | D1D2–A10-RNA–CDP-BeFx | D1D2–A10-RNA–GDP-BeFx | D1D2–A10-RNA–UDP-BeFx | D1D2–A10-DNA–ADP-BeFx |
|---|---|---|---|---|---|
| Data collection | |||||
| Space group | P21212 | P21212 | P21212 | P21212 | P21212 |
| Unit cell | |||||
| a, b, c (Å) | 89.83, 126.26, 55.55 | 89.64, 126.84, 55.03 | 89.99, 126.61, 55.55 | 89.76, 126.51, 55.51 | 90.39, 126.19, 55.23 |
| α, β, γ (°) | 90, 90, 90 | 90, 90, 90 | 90, 90, 90 | 90, 90, 90 | 90, 90, 90 |
| Wavelength (Å) | 1.0000 | 1.0000 | 1.0000 | 1.0000 | 1.0000 |
| Total reflections | 222,375 | 129,478 | 565,729 | 86,580 | |
| Unique reflections | 32,642 | 16,982 | 27,148 | 10,514 | 13,111 |
| Resolution* (Å) | 50 − 2.20 (2.24 − 2.20) | 50 − 2.60 (2.64 − 2.60) | 50 − 2.35 (2.39 − 2.35) | 50 − 3.30 (3.36 − 3.30) | 50 − 3.00 (3.05 − 3.00) |
| Redundancy | 6.8 (5.4) | 6.1 (5.4) | 19.2 (14.1) | 8.2 (8.1) | 5.5 (4.9) |
| Completeness (%) | 99.4 (97.7) | 99.7 (98.3) | 99.5 (94.9) | 99.5 (95.0) | 96.7 (88.8) |
| Overall I/σ(I) | 19.0 (1.5) | 12.1 (1.5) | 26.4 (2.4) | 11.1 (2.5) | 7.1 (1.5) |
| Rmerge† (%) | 9.7 (60.3) | 13.8 (77.0) | 13.3 (99.7) | 19.8 (66.5) | 19.8 (61.2) |
| Refinement | |||||
| Resolution (Å) | 47.24 − 2.20 | 47.07 − 2.74 | 47.28 − 2.35 | 47.22 − 3.21 | 44.15 − 2.96 |
| No. of reflections | 32,642 | 16,982 | 27,146 | 10,514 | 13,111 |
| Rwork (%) | 21.6 | 22.3 | 23.09 | 22.16 | 19.6 |
| Rfree§ (%) | 25.4 | 26.7 | 26.00 | 27.43 | 24.4 |
| No. atoms | |||||
| Protein | 7911 | 7519 | 7723 | 7528 | 7774 |
| Nucleic acid | 232 | 298 | 230 | 232 | 147 |
| Ligands | 45 | 42 | 43 | 40 | 44 |
| Water | 115 | 28 | 61 | 0 | 0 |
| Rmsd bonds (Å) | 0.003 | 0.003 | 0.003 | 0.004 | 0.003 |
| Rmsd angles (°) | 0.696 | 0.629 | 0.710 | 0.968 | 0.751 |
| Ramachandran favored# (%) | 97.23 | 96.01 | 96.84 | 98.40 | 97.04 |
| Ramachandran allowed (%) | 2.30 | 1.94 | 2.19 | 1.40 | 1.98 |
| PDB ID | 4TYW | 4TYY | 4TZ0 | 4TZ6 | 4TYN |
-
*
The numbers in parentheses refer to the highest resolution shell.
-
†
Rmerge = ∑hkl ∑i |Ihkl,i − 〈Ihkl〉|/∑hkl ∑〈Ihkl〉.
-
§
Rfree was calculated with 5% of reflections that were excluded from refinement.
-
#
Analysis by MolProbity (Chen et al., 2010).
Download links
A two-part list of links to download the article, or parts of the article, in various formats.
Downloads (link to download the article as PDF)
Open citations (links to open the citations from this article in various online reference manager services)
Cite this article (links to download the citations from this article in formats compatible with various reference manager tools)
Molecular insights into RNA and DNA helicase evolution from the determinants of specificity for a DEAD-box RNA helicase
eLife 3:e04630.
https://doi.org/10.7554/eLife.04630


