Cytosolic Hsp70 and co-chaperones constitute a novel system for tRNA import into the nucleus
- Nagoya University, Japan
- Kyoto Sangyo University, Japan
- University of Hyogo, Japan
Figures
Figure 1 with 1 supplement
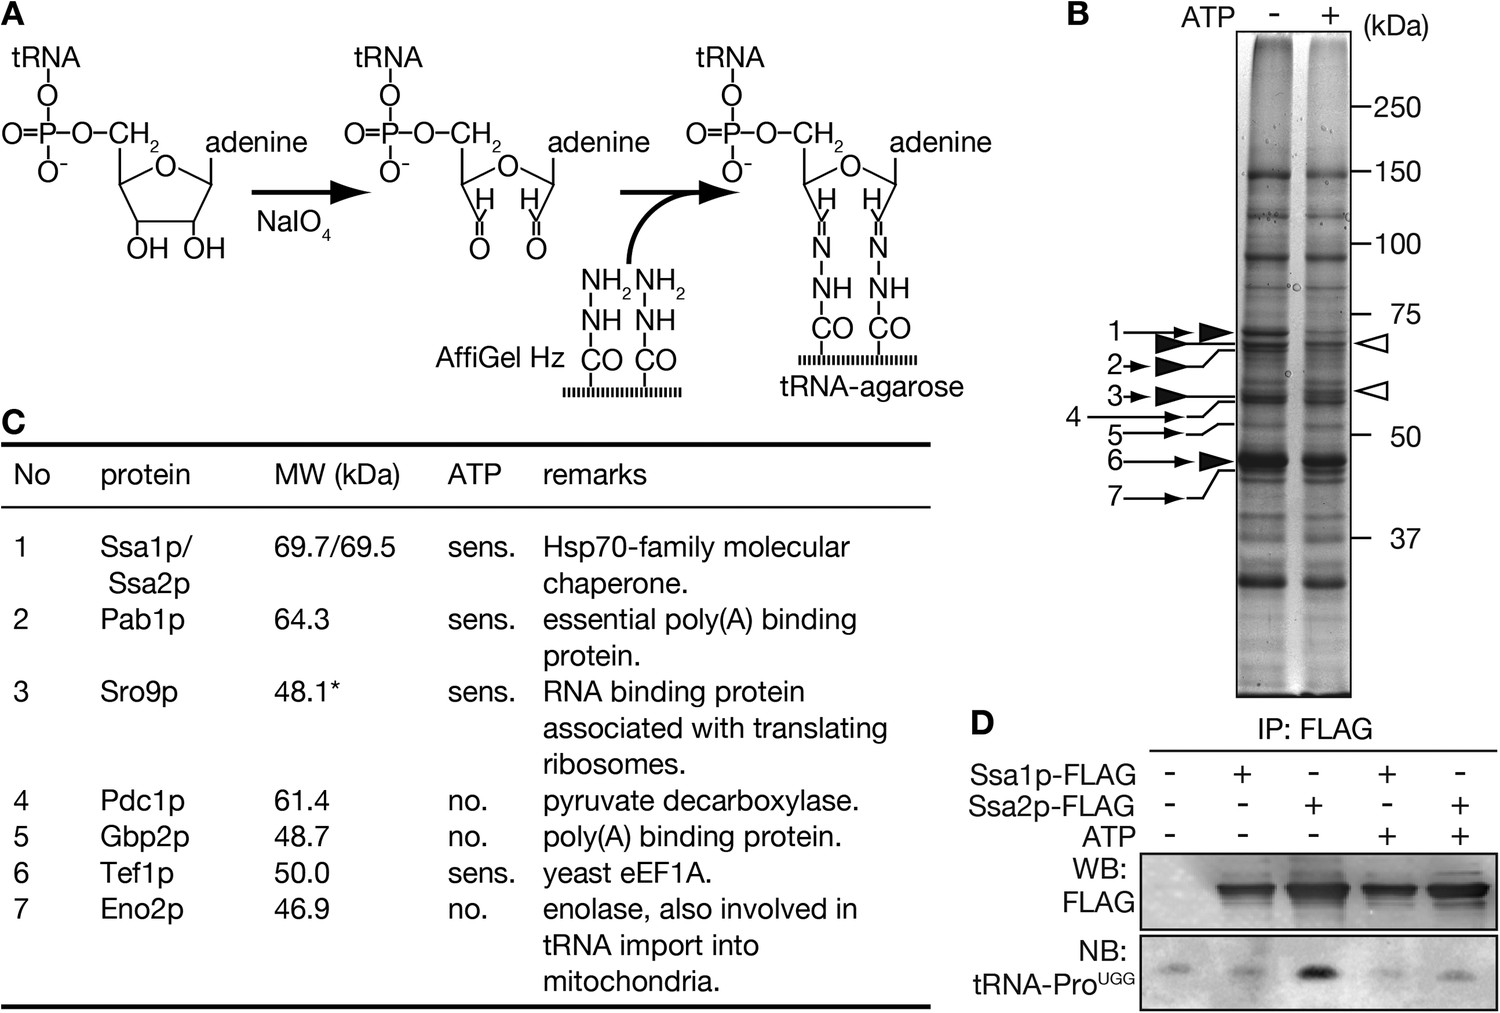
Purification of tRNA-interacting proteins with immobilized tRNA-resin.
(A) A schematic diagram for preparation of tRNA-agarose by hydrazide coupling. (B) tRNA-binding proteins purified with the tRNA-agarose were analyzed by SDS-PAGE/CBB staining. Purification was performed in the absence (−) or presence (+) of 3 mM Mg-ATP. Bands appearing mainly in the ATP minus or plus lanes are marked by closed and open arrowheads, respectively. Bands that were identified by peptide mass fingerprinting after in-gel digestion are indicated by small numbered arrows. (C) A summary of the proteins identified in B. The numbers correspond to the arrows shown in B. *Sro9p, with a calculated molecular mass of 48.1 kDa, is known to migrate as a 60-kDa band on SDS-PAGE (Sobel and Wolin, 1999). (D) Yeast lysates prepared from strains expressing either Ssa1p-FLAG or Ssa2p-FLAG in addition to the wild type-strain were subjected to immunoprecipitation with anti-FLAG agarose in the absence (−) or presence (+) of 3 mM Mg-ATP. One-tenth of the eluates were analyzed by Western blotting with the anti-FLAG antibody (WB), and the remainders of the eluates were subjected to RNA extraction and Northern blotting with a probe against mature tRNA-ProUGG (NB).
Figure 1—figure supplement 1
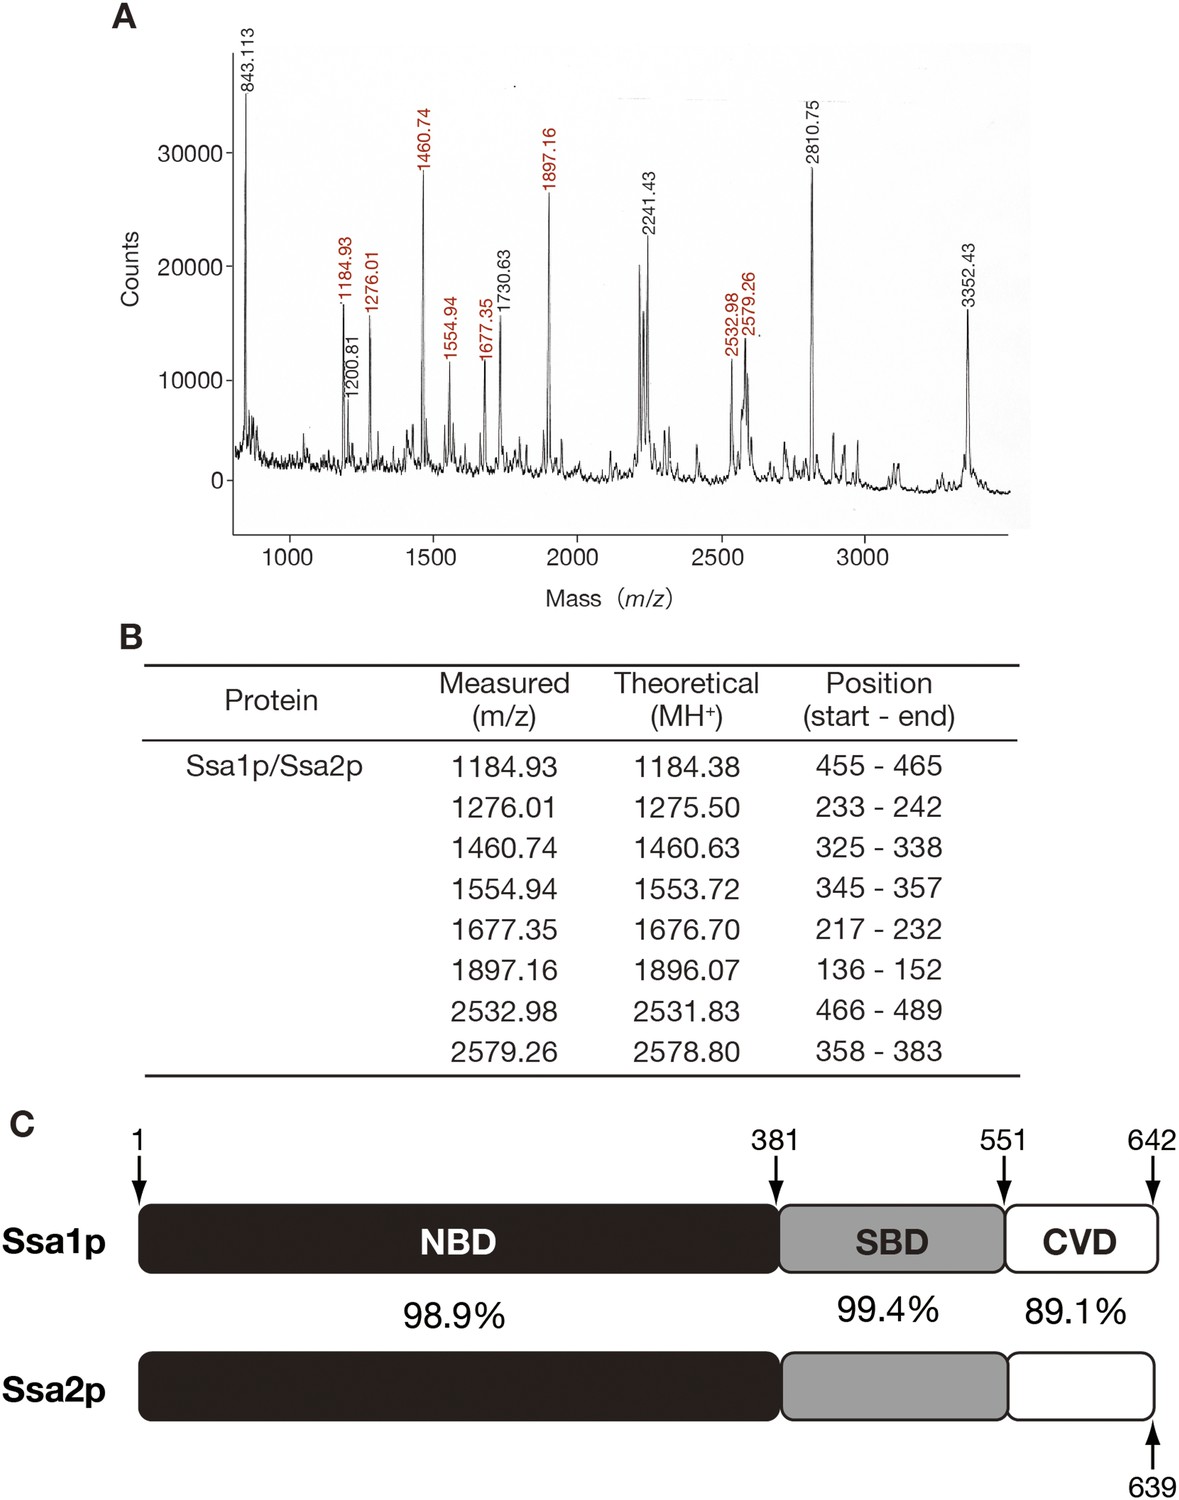
Identification of Ssa1p/Ssa2p as tRNA-binding protein by peptide mass fingerprinting.
(A) The band marked as ‘1’ in Figure 1B was excised from the gel and in-gel-digested with trypsin. The resulting peptides were recovered by extraction with 30% vol/vol acetonitrile, 0.1% vol/vol TFA, and subjected to MALDI/TOF MS (Voyager DE, Applied Biosystems, Foster City, CA). Peaks with red numbers indicate those derived from Ssa1p/Ssa2p. Protein identification was carried out with MS-Fit software (http://jpsl.ludwig.edu.au/ucsfhtml3.4/msfit.html). (B) MS data were compared with the theoretical molecular masses of tryptic fragments from Ssa1p and Ssa2p. (C) A schematic drawing of the domain structures of Ssa1p and Ssa2p. The amino-acid positions of domain boundaries are indicated. The numbers between the bars indicate the identity of the two amino acid sequences.
Figure 2 with 3 supplements
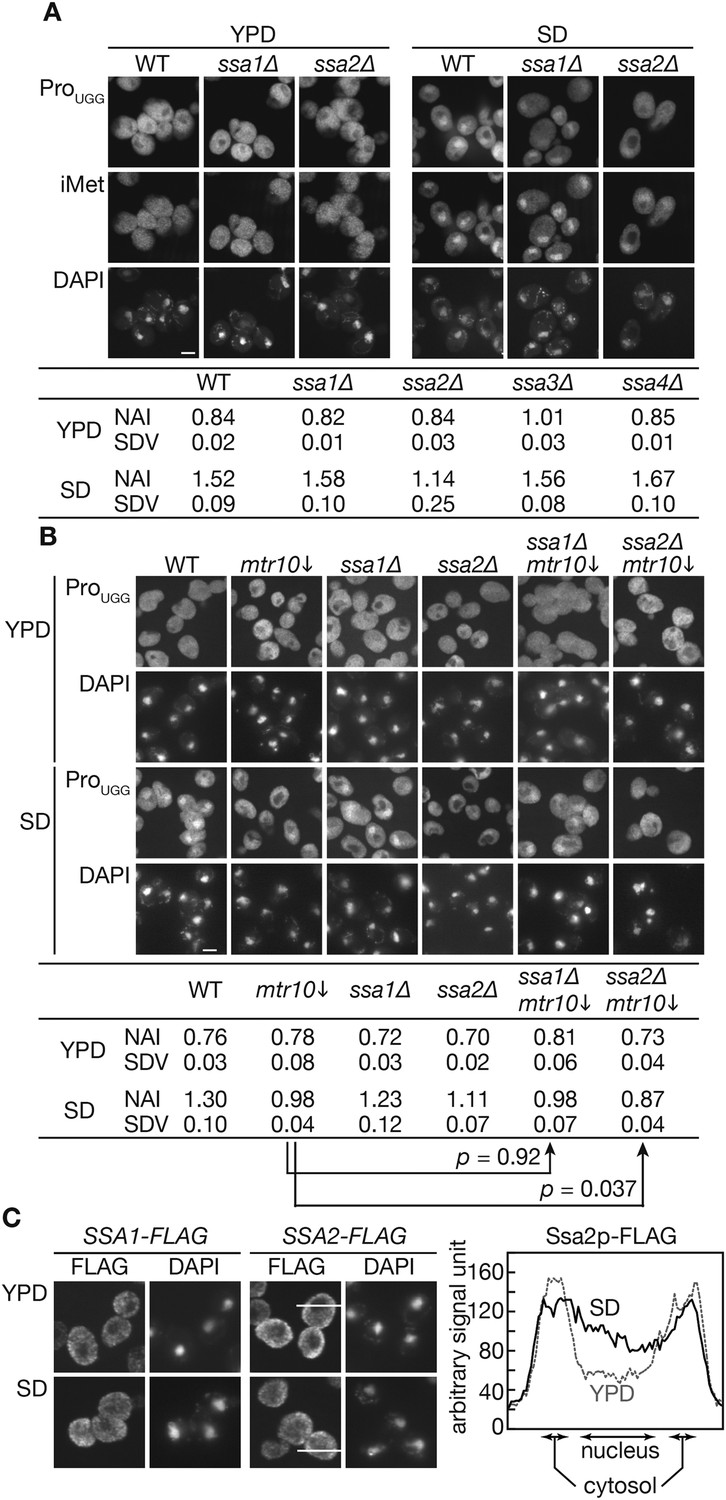
Nuclear accumulation of tRNAs under starvation conditions is affected by SSA2 gene deletion.
(A) Wild-type (WT: W303-1A), ssa1∆ (TYSC918), and ssa2∆ (TYSC920) cells were cultured in YPD until the log phase. The cells were then transferred to SD+Ura, Ade lacking all amino acids and cultured for additional 2 hr. The cells before (YPD) and after amino acid-starvation (SD) were subjected to FISH with a rhodamine-labeled probe against mature tRNA-ProUGG (ProUGG) and an FITC-labeled probe against tRNA-iMet (iMet). The nucleus was visualized with DAPI. Fluorescence signals of FISH images of tRNA-ProUGG were quantified, and the ratio between the nuclear and cytosolic signals is expressed as the NAI (see ‘Materials and methods’). Three independent samples were analyzed, and their average NAIs (NAI) with standard deviations (SDV) are shown. Bar, 5 µm. (B) The wild-type, GAL7p-MTR10 (mtr10↓: TYSC612), ssa1∆ (TYSC918), ssa1∆ GAL7p-MTR10 double mutant (ssa1∆ mtr10↓: ssa1∆ mtr10), ssa2∆ (TYSC920), and ssa2∆ GAL7p-MTR10 double mutant (ssa2∆ mtr10↓: ssa2∆ mtr10) strains pre-grown in YPGal were cultured in YPD for 18 hr, transferred to SD+Ura, Ade, and subjected to FISH with the anti-tRNA-ProUGG probe, as described in A. Average NAIs with SDVs from three independent experiments are shown in the table. (C) Localization of Ssa1p and Ssa2p was analyzed by immunofluorescence microscopy. Cells expressing SSA1-FLAG or SSA2-FLAG were grown in YPD (YPD) and were subsequently cultured in SD+Ura, Ade (SD) for 2 hr. The signal intensities of Ssa2p-FLAG on the lines shown in the pictures are shown in the far right graph. A solid line indicates a cell in SD, and a dashed gray line does a cell in YPD. Original microscopic images and individual data for quantitative FISH in this figure will be found in Figure 2—source data 1.
-
Figure 2—source data 1
Zip file containing source data for Figure 2.
Yeast cells are processed as described in the Figure 2 legend and the ‘Materials and methods’ section. Images from three independent sets of FISH experiments are subjected to quantification. Each folder named as Fig2A_expX or Fig2B_expX contains gray-scale tif images with 16 bit depth (acquired by MetaMorph) of a set of the experiments. A file name consists of the strain name (‘wt ’or ‘ssa1’ for example) and culture conditions (‘YPD’ or ‘SD’) with the last capital letter representing the recording channel (‘D’ for DAPI staining or ‘R’ for RNA FISH). If the number of cells suitable for quantification in one image was under 30, those from two images were quantified. In such cases, two sets of images (‘ssa2_SD_a_R.tif’ and ‘ssa2_SD_b_R.tif’ for example) are included. Raw quantification data and their processing to NAIs are summarized Excel files. Summary of the total experiments are shown in the ‘SUMMARY’ sheet in the file named ‘Figure 2A_data_summaryandexp1_DATA.xls’ or ‘Figure 2B_data_summaryandexp1_DATA.xls.’ The same set of data for experiments with the wild-type strain are shown graphically in Figure 2—figure supplement 3 in the supplemental materials. All the tif images have 16-bit depth.
- https://doi.org/10.7554/eLife.04659.006
Figure 2—figure supplement 1
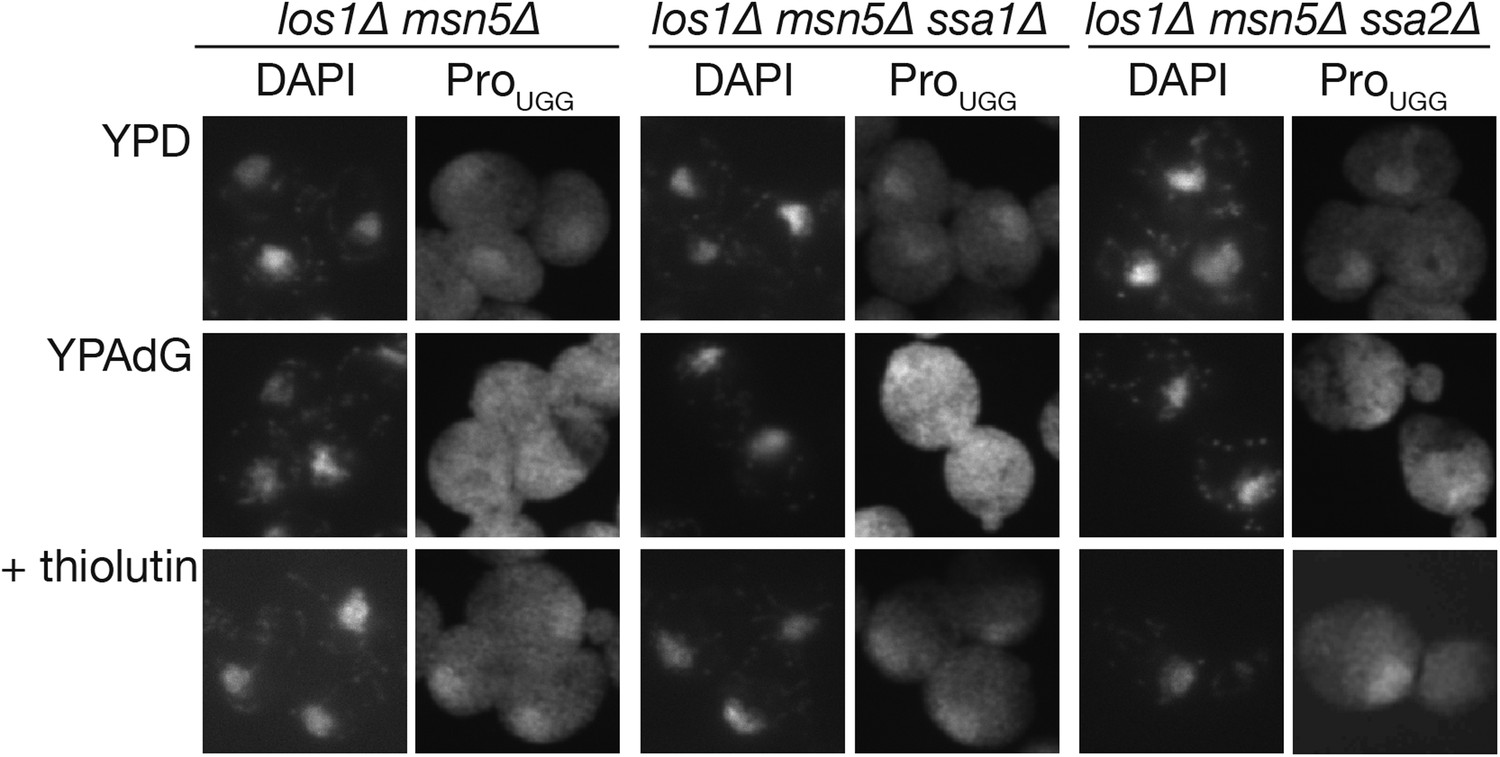
Nuclear import of tRNA under the los1∆ msn5∆ background was not affected by the deletion of SSA genes.
Nuclear import of tRNA-ProUGG in ssa1∆ or ssa2∆ strains under non-starvation conditions was monitored by the nuclear import assay upon recovery from ATP depletion (Takano et al., 2005). The strains shown at the top of the panels (los1∆ msn5∆, TYSC512; los1∆ msn5∆ ssa1∆, TYSC1059; los1∆ msn5∆ ssa2∆, TYSC1060) were grown in a rich medium (YPD), exposed to 10 mM NaN3 and 10 mM 2-deoxyglucose for 1 hr (YPAdG) to deplete intracellular ATP, and then incubated in YPD with 5 µg/ml thiolutin, a transcription inhibitor, for 1 hr (+thiolutin). At each time point, the cells were harvested and subjected to FISH with a probe against mature tRNA-ProUGG (right columns). The nucleus was visualized by DAPI staining (left columns).
Figure 2—figure supplement 2
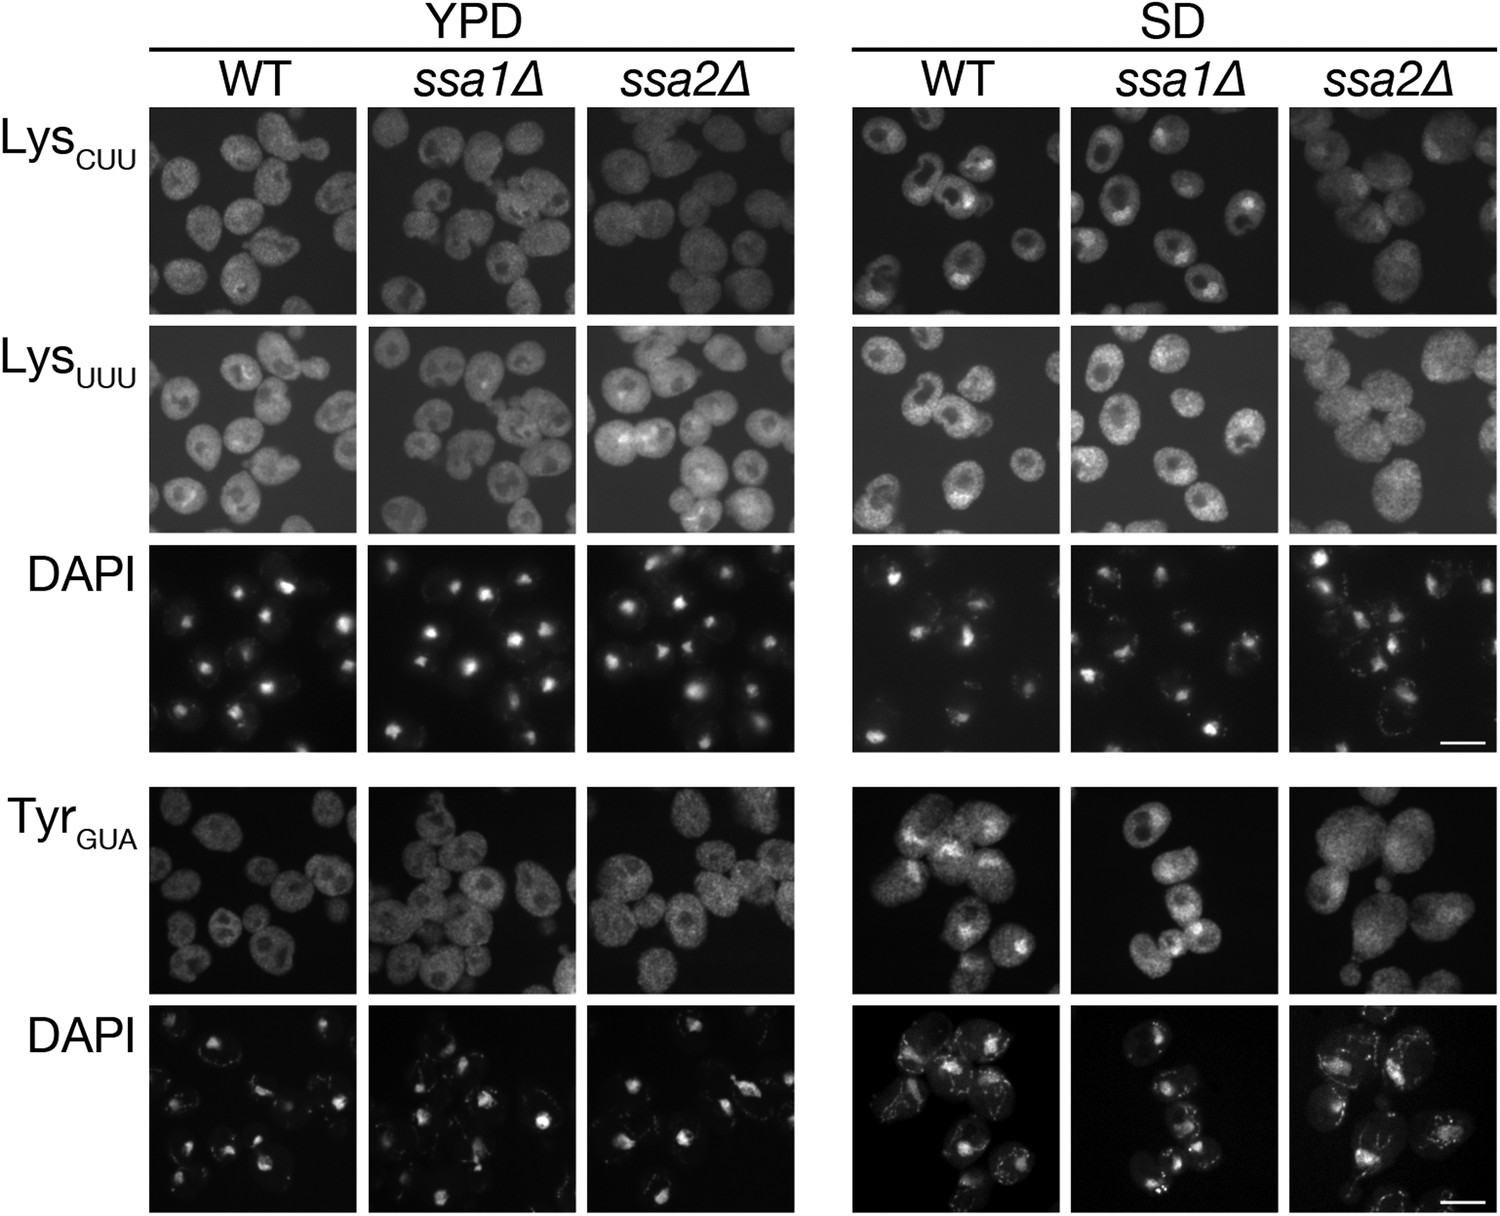
Defects in nuclear accumulation of several other tRNA species were observed in ssa2∆ cells.
The wild-type (W303-1A), ssa1∆ (TYSC918), and ssa2∆ (TYSC920) strains treated as in Figure 2A were subjected to FISH analyses with anti-tRNA-LysCUU (LysCUU), anti-mature tRNA-LysUUU (LysUUU), or anti-mature tRNA-TyrGUA (TyrGUA) probes. Because tRNA-LysUUU and tRNA-TyrGUA are encoded by intron-containing genes while tRNA-LysCUU is by intronless genes, the probes for the former two tRNA species were designed to detect only spliced tRNAs. Bars, 5 µm.
Figure 2—figure supplement 3
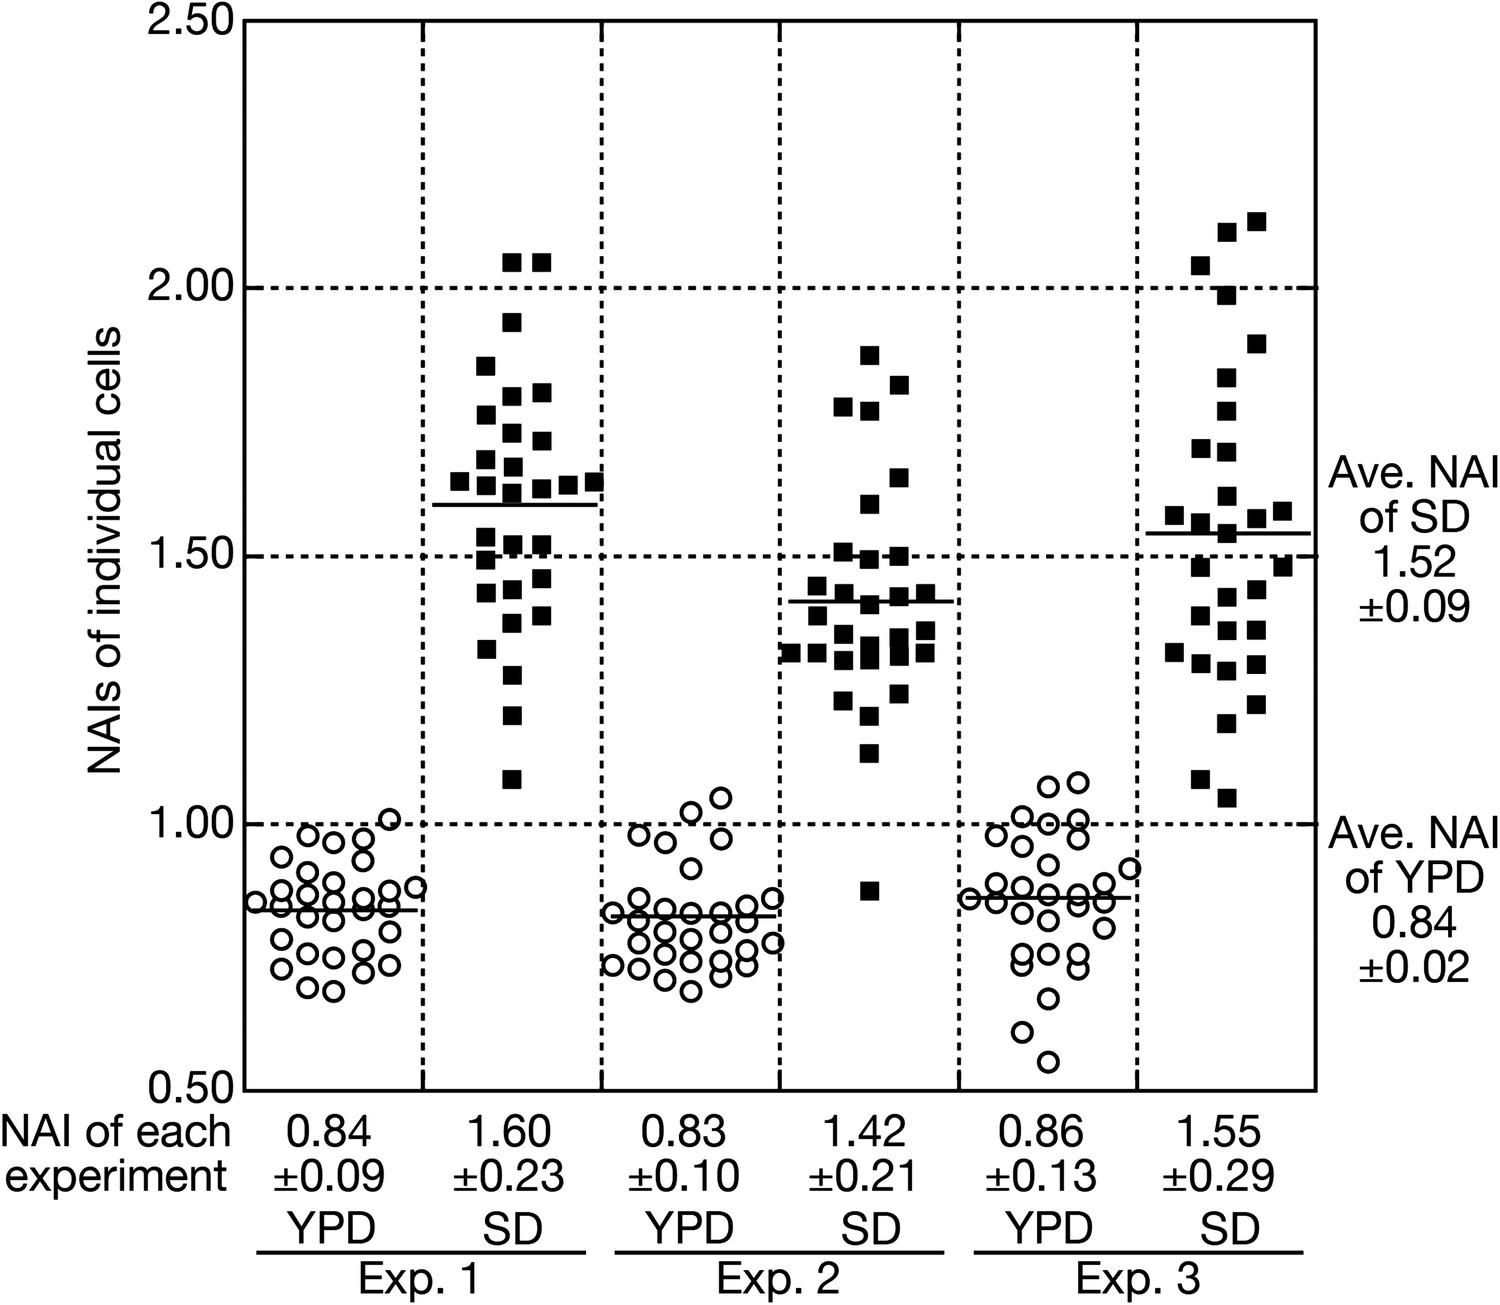
Quantitative analyses of nuclear accumulation of tRNAs.
A typical example of quantitative FISH data processing to acquire an average NAI and its standard deviation (SDV) is shown. In this case, wild-type cells (W303-1A) were cultured in the rich medium (YPD) and then were shifted to the nutrient starvation medium (SD). Three independent sets of cell samples before and after incubation in the SD medium were subjected to FISH with the anti-mature tRNA-ProUGG probe. NAIs of 30 individual cells in each experiment are measured and shown as open circles (YPD) and closed squares (SD). An average of NAIs of individual cells with an SDV in each experiment is shown in the bottom. The ‘average NAI’ appearing in the text is calculated from the NAIs of three independent experiments and shown in the right.
Figure 3
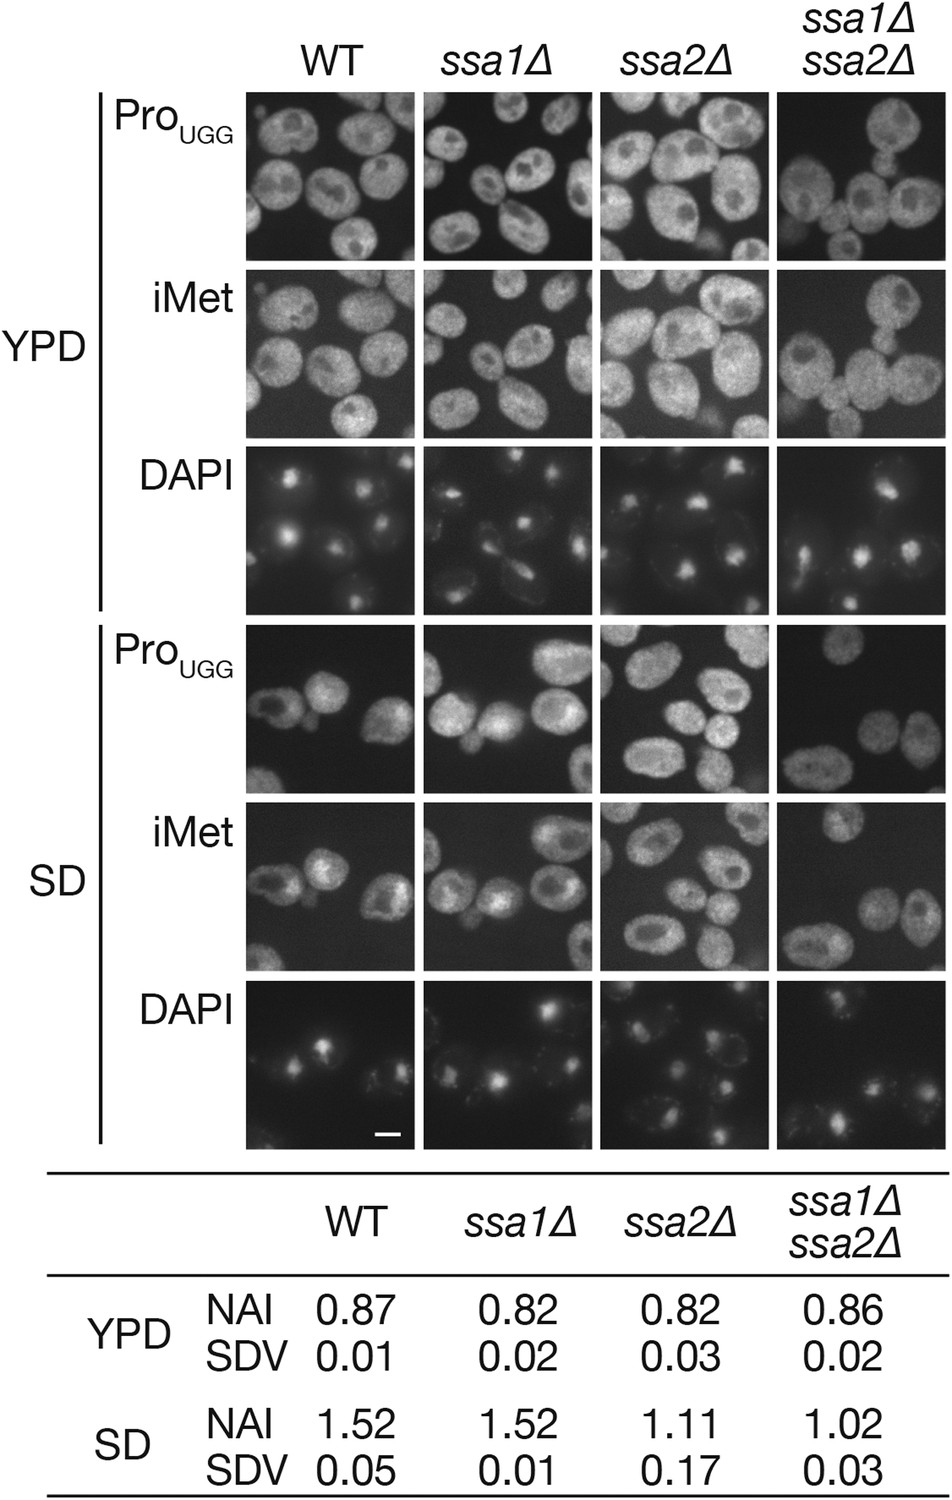
The ssa1∆ ssa2∆ double deletion does not cause a synergistic effect on the nuclear accumulation of tRNAs under starvation conditions.
Wild-type (W303-1A), ssa1∆ (TYSC918), ssa2∆ (TYSC920), and ssa1∆ ssa2∆ double mutant (TYSC1013) strains were cultured in YPD (YPD) and transferred to SD+Ade, Ura (SD) for 2 hr. The cells were subsequently subjected to FISH analysis with anti-tRNA-ProUGG and tRNA-iMet probes. Bar, 5 µm. The fluorescence signals of tRNA-ProUGG images of three independent experiments were quantified, and the average NAIs with SDVs were calculated. Original microscopic images and individual data for quantitative FISH in this figure will be found in Figure 3—source data 1.
-
Figure 3—source data 1
Zip file containing source data for Figure 3.
Yeast cells are processed as described in the Figure 3 legend and the ‘Materials and methods’ section. Images from three independent sets of FISH experiments are subjected to quantification. Each folder named as Fig3_expX contains gray-scale tif images with 16 bit depth (acquired by MetaMorph) of a set of the experiments. A file name consists of the strain name (‘wt,’ ‘ssa1,’ for example) and culture conditions (‘YPD’ or ‘SD’) with the last capital letter representing the recording channel (‘D’ for DAPI staining or ‘R’ for RNA FISH). If the number of cells suitable for quantification in one image was under 30, those from two images were quantified. In such cases, two sets of images (‘ssa2_SD_a_R.tif’ and ‘ssa2_SD_b_R.tif’ for example) are included. Raw quantification data and their processing to NAIs are summarized Excel files. Summary of the total experiments are shown in the ‘SUMMARY’ sheet in the file named ‘Figure 3_data_summaryandexp1_DATA.xls.’ All the tif images have 16-bit depth.
- https://doi.org/10.7554/eLife.04659.011
Figure 4 with 1 supplement
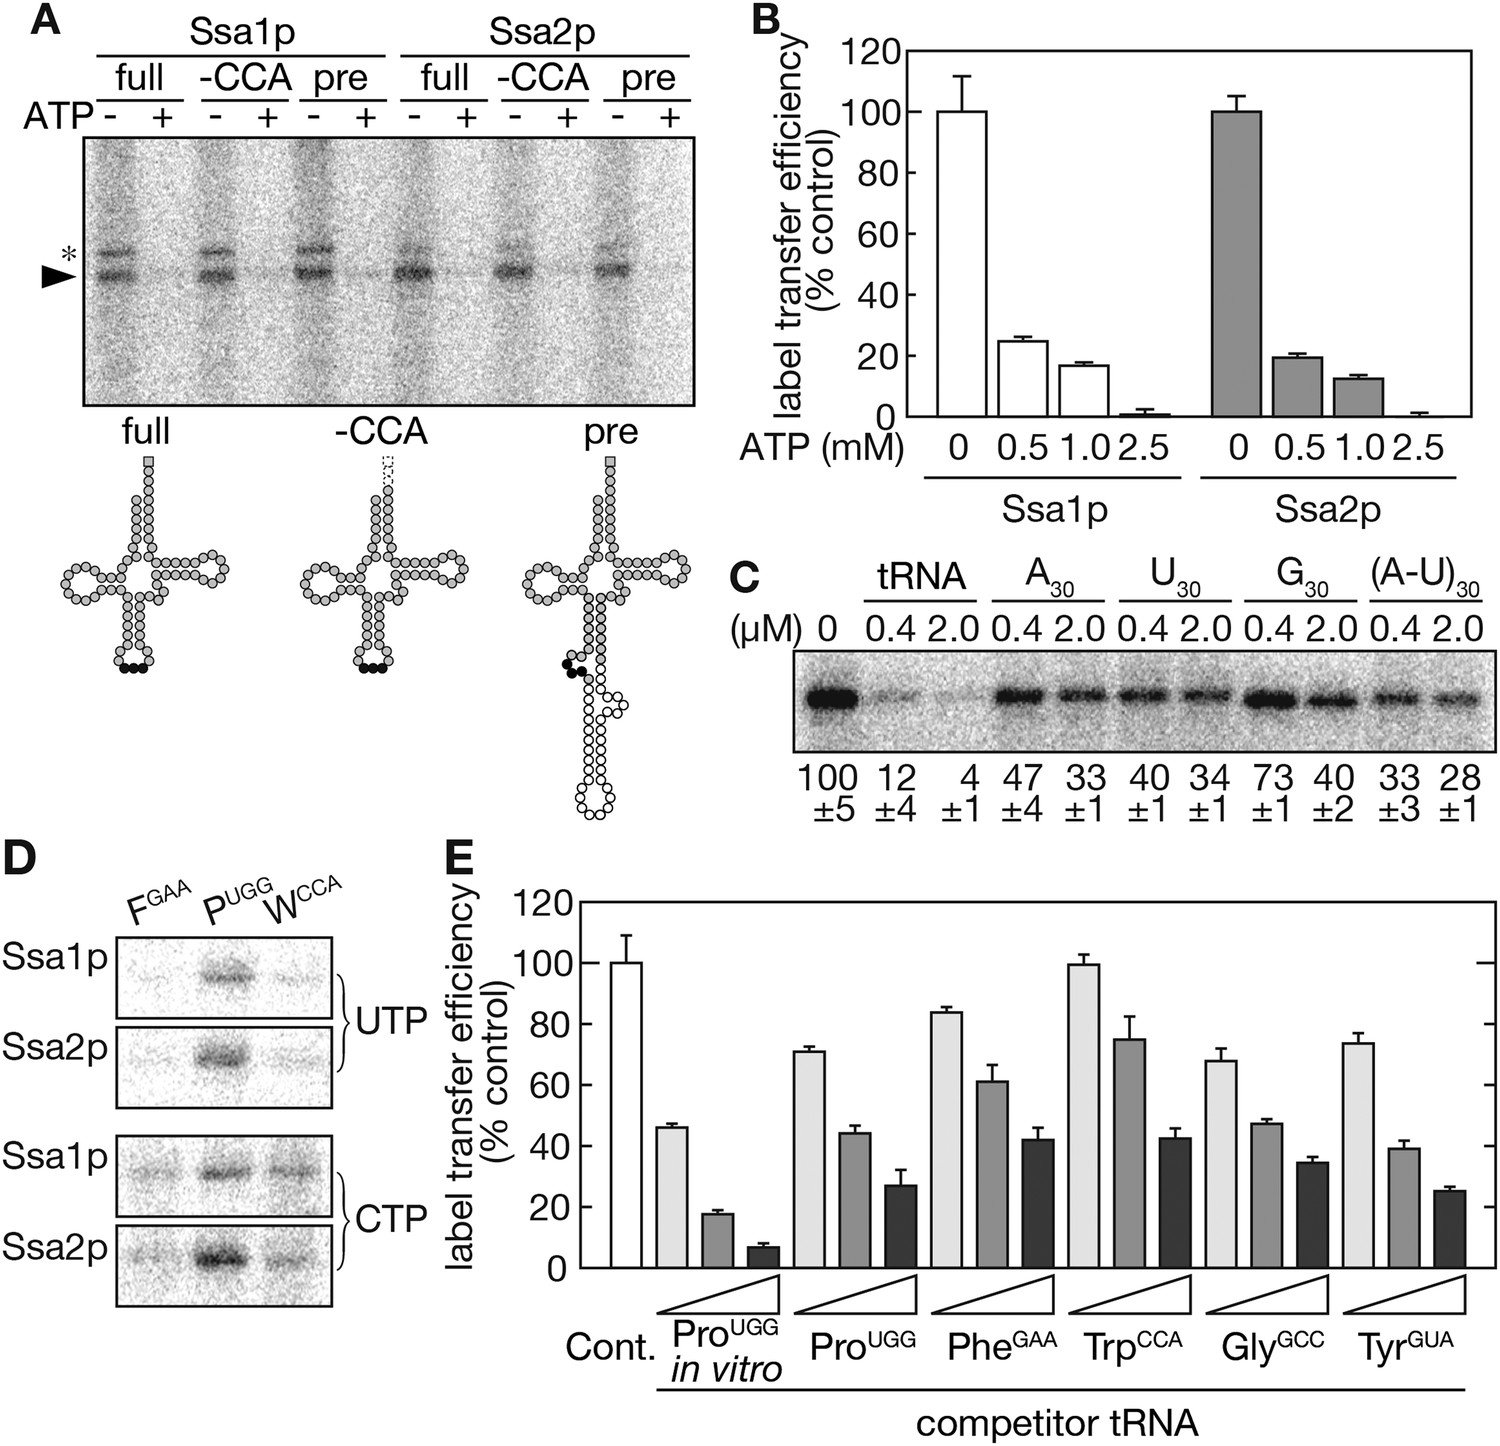
Ssa proteins directly and specifically interact with tRNAs in vitro.
(A) In vitro-transcribed tRNA-ProUGG molecules shown in the lower panel (full-length [full], CCA-less [-CCA], and precursor [pre]) were subjected to label transfer assays with recombinant Ssa1p or Ssa2p in the absence (−) or presence (+) of 2.5 mM ATP. 32P-labeled Ssa proteins are indicated by an arrowhead. Bands marked with an asterisk are Ssa proteins cross-linked with partially digested tRNA species. In the lower part, nucleotides corresponding to the anticodon, the intron and the adenosine of the CCA end are shown as black circles, white circles, and a gray square, respectively. (B) Label transfer assays with 32P-labeled mature tRNA-ProUGG were performed in the presence of various concentrations of ATP. The label transfer efficiency without ATP was set to 100%. Data are presented as the averages of three independent experiments. Error bars represent SDVs. (C) The specificity of tRNA recognition by Ssa2p was examined by competition experiments with short RNAs. The indicated concentrations of in vitro-transcribed tRNA-ProUGG or homo-30mers shown on the top were added to the label transfer assays. Averages of relative band intensities in triplicate experiments are shown at the bottom with SDVs. (D) Label transfer assays were performed with equal radioactive amounts of three different tRNAs (tRNA-PheGAA, tRNA-ProUGG, and tRNA-TrpCCA) labeled with either 32P-UTP (upper) or 32P-CTP (lower). (E) Label transfer from 32P-UTP-labeled tRNA-ProUGG to Ssa2p was monitored in the presence of increasing amounts of competitor tRNAs transcribed in vitro or purified from yeast. Label transfer efficiency without any competitor (white bar) was set to 100%. Original gel images and individual quantification data for the label transfer assays in this figure will be found in Figure 4—source data 1.
-
Figure 4—source data 1
Zip file containing source data for Figure 4.
- https://doi.org/10.7554/eLife.04659.013
Figure 4—figure supplement 1
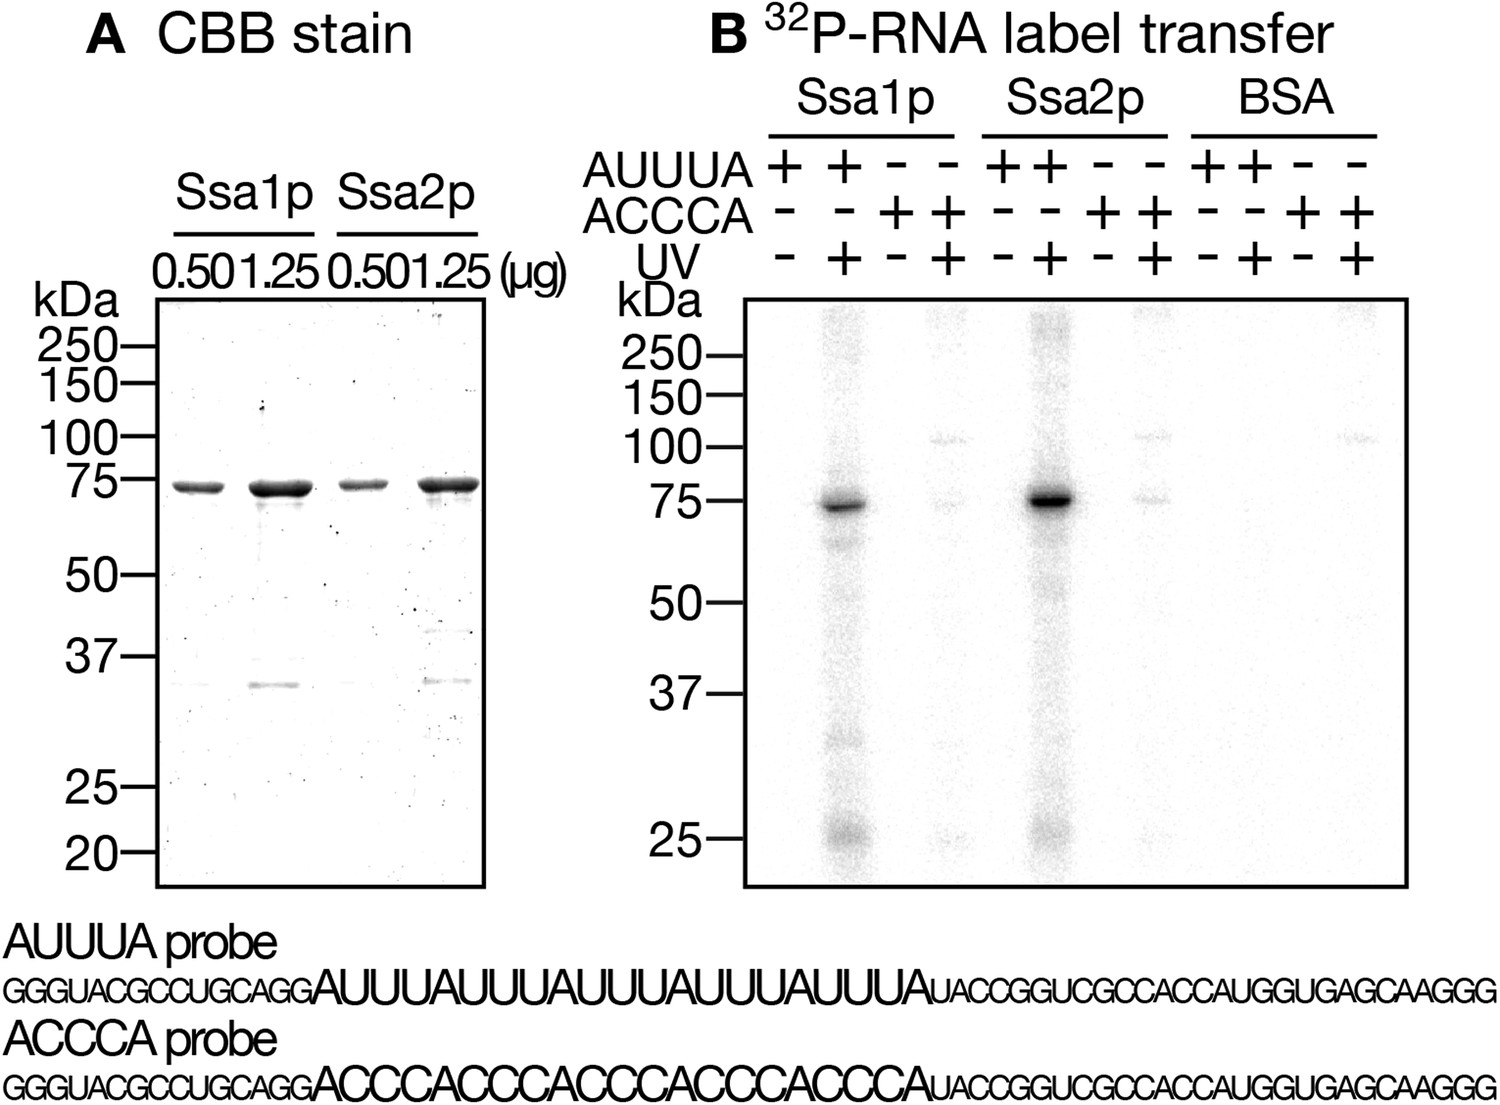
Label transfer from the AU-rich RNA to Ssa proteins.
(A) Recombinant Ssa proteins were purified from E. coli. The indicated amounts of Ssa proteins were subjected to SDS-PAGE and stained with CBB. (B) Label transfer assays of Ssa proteins with RNA molecules with or without AU-rich elements. 32P-labeled (AUUU)5- and (ACCC)5-containing RNAs were transcribed in vitro with 32P-UTP. Each of these RNAs (1.0 × 10⁶ cpm) was incubated with 1.0 µg of either Ssa1p, Ssa2p or BSA in the absence of ATP. After UV-irradiation at 90 mJ/cm2 (UV ‘+’ lanes) or being held at room temperature without irradiation for the same duration (UV ‘−’ lanes), the mixtures were digested with RNase Cocktail, and subjected to SDS-PAGE followed by radioimaging. The sequences of the RNA species used in the assay are shown at the bottom.
Figure 5
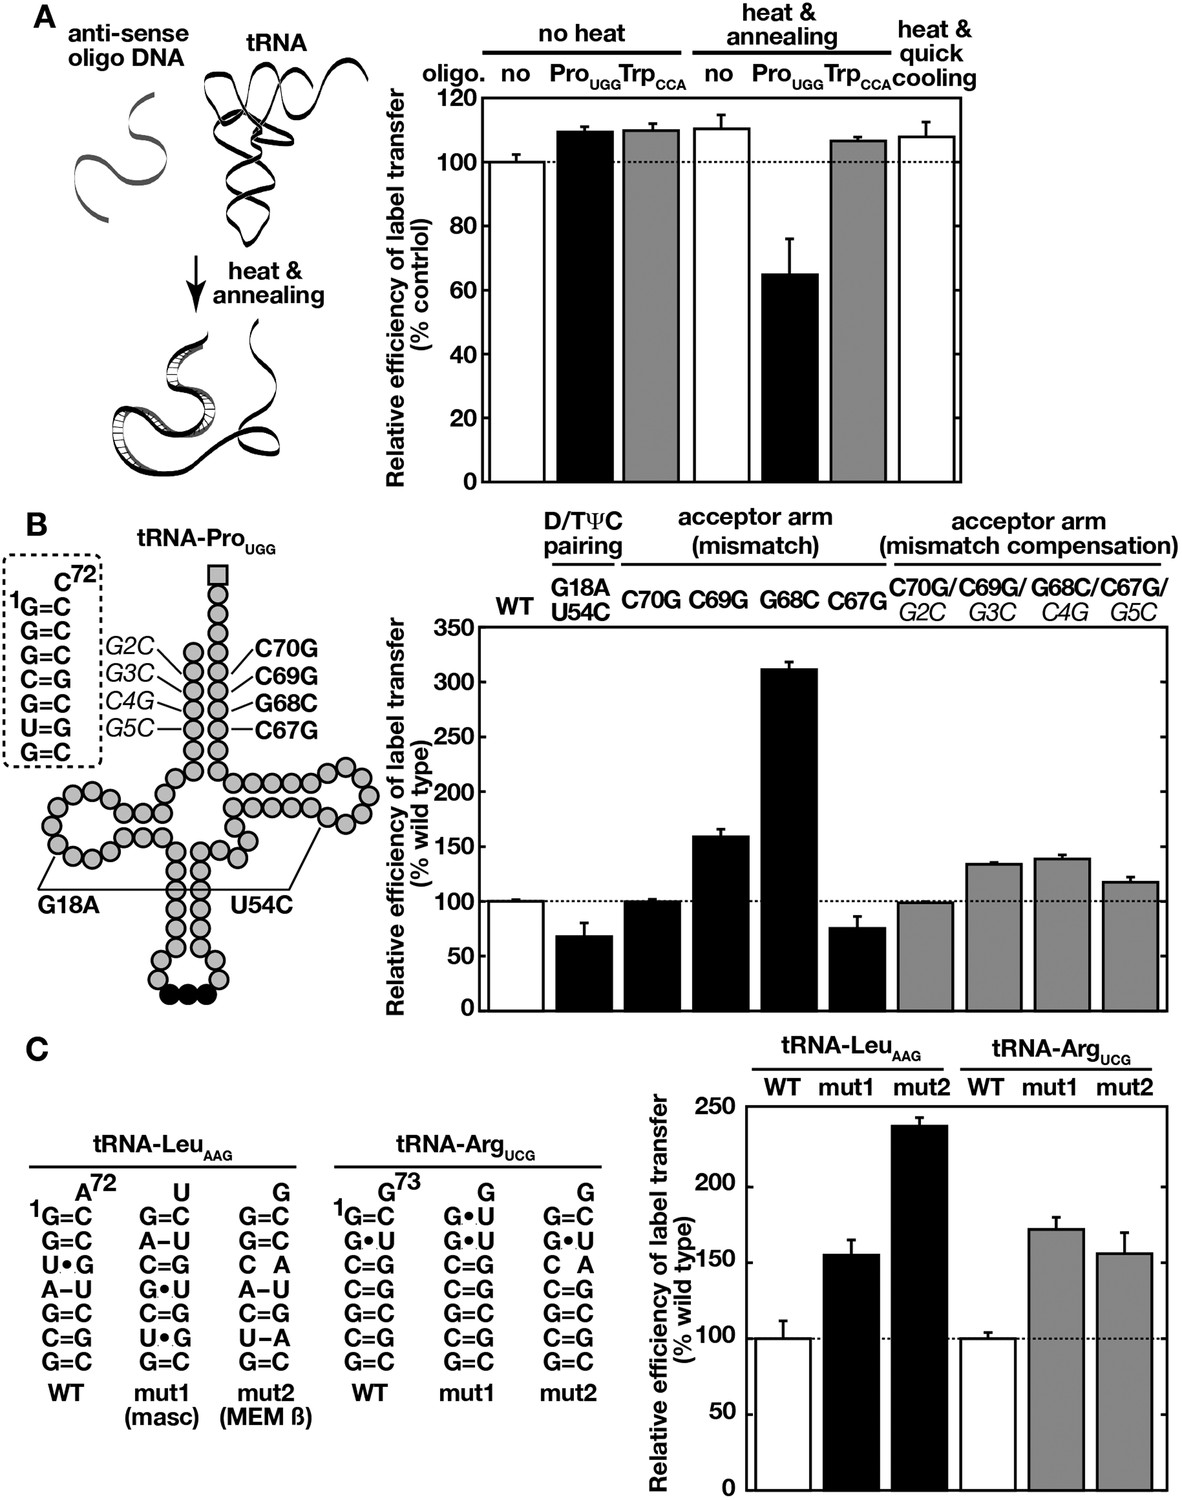
Ssa proteins recognize higher order structures of tRNAs and prefer a destabilized acceptor stem.
(A) 32P-labeled tRNA-ProUGG was mixed without (no, white bar) or, with its anti-sense (ProUGG, black bar) or unrelated control (anti-sense of TrpCCA, gray bar) oligo-DNA. tRNA/oligo-DNA mixtures were heat-denatured and annealed to form DNA-RNA hybrids (‘heat and annealing’) as indicated on the left. A sample without oligo-DNA was also heated and quick-cooled (the far right bar). The resulting samples were then subjected to the label transfer assay with Ssa2p. (B) Label transfer from tRNA-ProUGG mutants was assayed with Ssa2p. Mutation sites of tRNA-ProUGG used in the assay are indicated schematically in the left. Boldface characters indicate mutations introduced to cause destabilization, and italicized characters do mutations that compensate for mismatches caused by the former mutations. The label transfer efficiencies of mutant tRNAs to Ssa2p were summarized in the right graph. (C) Wild-type (WT) and mutant forms (mut1 and mut2) of human tRNA-LeuAAG and tRNA-ArgUCG were subjected to the label transfer assay with Ssa2p. Sequences of the acceptor stems of the tRNAs are shown in the left. The tRNA-LeuAAG derivatives received replacements of the acceptor stem of tRNA-LeuAAG with those of tRNA-like ncRNAs such as MALAT1-associated small cytoplasmic RNA (mascRNA, mut1) and MEM β RNA (mut2). For panels B and C, the label transfer efficiency of the wild-type tRNA was set to 100%. Similar results were obtained with Ssa1p (not shown). Original gel images and individual quantification data for the label transfer assays in this figure will be found in Figure 5—source data 1.
-
Figure 5—source data 1
Zip file containing source data for Figure 5.
- https://doi.org/10.7554/eLife.04659.016
Figure 6 with 1 supplement
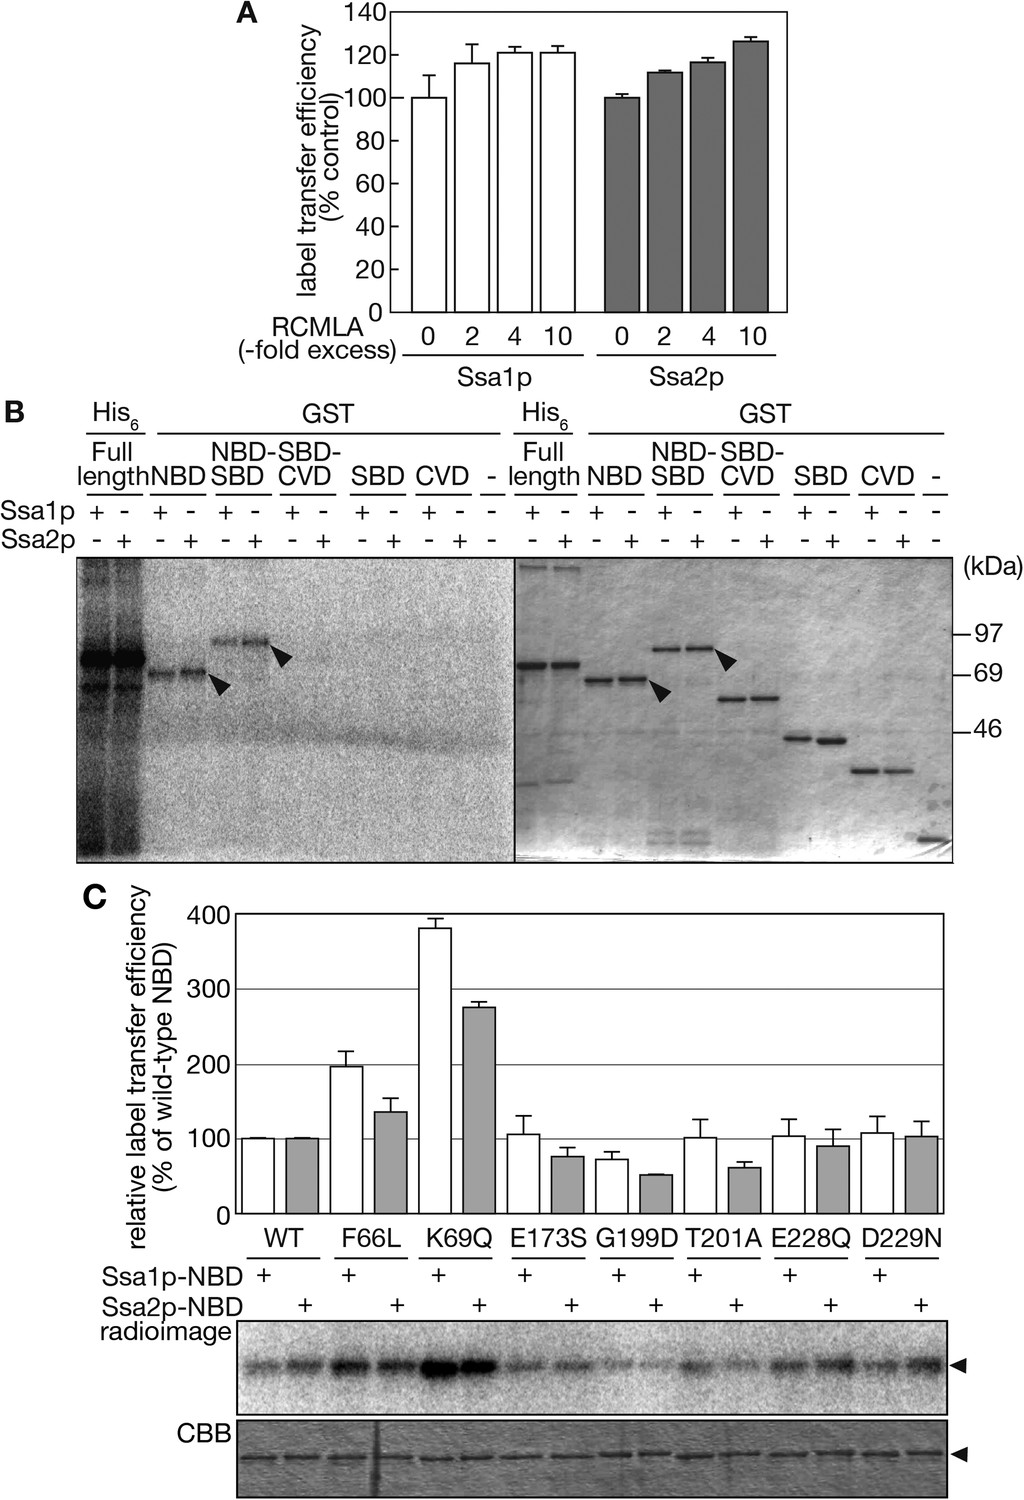
The NBD of Ssa proteins is essential for tRNA recognition.
(A) Label transfer assays with 32P-labeled tRNA-ProUGG were performed in the presence of various concentrations of RCMLA. The amount of RCMLA is shown as the molar ratio against Ssa proteins. (B) Label transfer assays with full-length Ssa-His6 fusions or GST-fusions with partial Ssa proteins. Left, radioimaging; right, CBB staining. Arrowheads indicate the bands of GST-fusions that received radioactivity. (C) Label transfer assays were carried out with wild-type or mutant forms of GST-Ssa1p-NBD (Ssa1p-NBD) or GST-Ssa2p-NBD proteins (Ssa2p-NBD). Quantitated data and raw gel images of a typical experiment are shown in the upper graph and the lower panels, respectively. The relative label transfer efficiency represents a ratio of label transfer of a mutant GST-Ssa-NBD to that of the corresponding wild type. The efficiency of the wild-type protein is set to 100%. All the experiments are done in triplicates, and error bars represent SDVs. Original gel images and individual quantification data for the label transfer assays in this figure will be found in Figure 6—source data 1.
-
Figure 6—source data 1
Zip file containing source data for Figure 6.
- https://doi.org/10.7554/eLife.04659.018
Figure 6—figure supplement 1
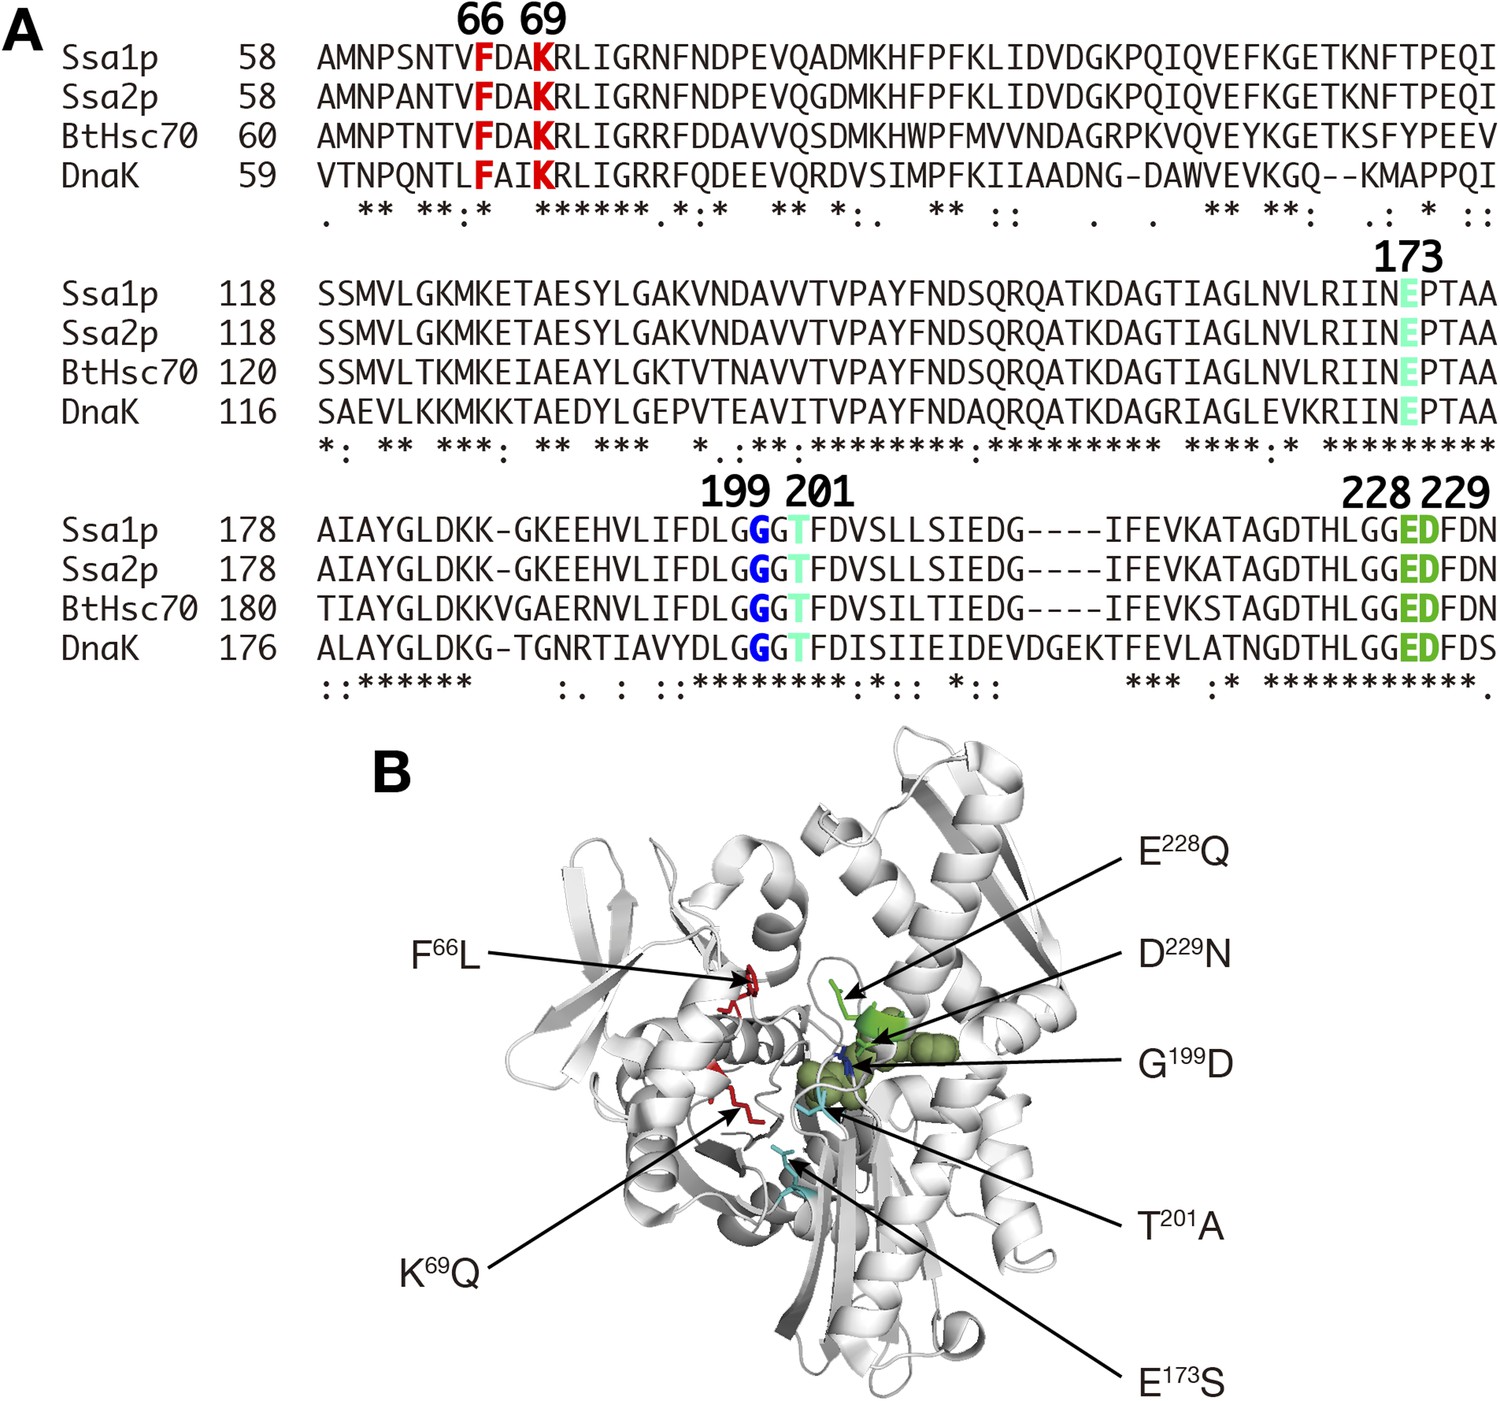
Mutations introduced into the NBD of Ssa proteins.
(A) Sequence comparison among Ssa1p, Ssa2p, bovine Hsc70 (BtHsc70) and E. coli Hsp70 (DnaK). Asterisks, identical residues; colons, strongly conserved residues; periods, weakly conserved residues. Residues altered in mutants examined in Figure 6C by the label transfer assay are colored, and their positions in Ssa proteins are shown in boldface. (B) Mutation points are indicated in the structural model of the NBD of bovine Hsc70 (1–394 aa) (PDB ID, 2QWL; Jiang et al., 2007). The structure of bovine Hsc70 (1–394aa) is shown in a ribbon model. Side chains of mutated residues are shown in wire drawing with the same color-code in A. An ADP molecule bound to the nucleotide binding cleft was shown in the green surface model.
Figure 7
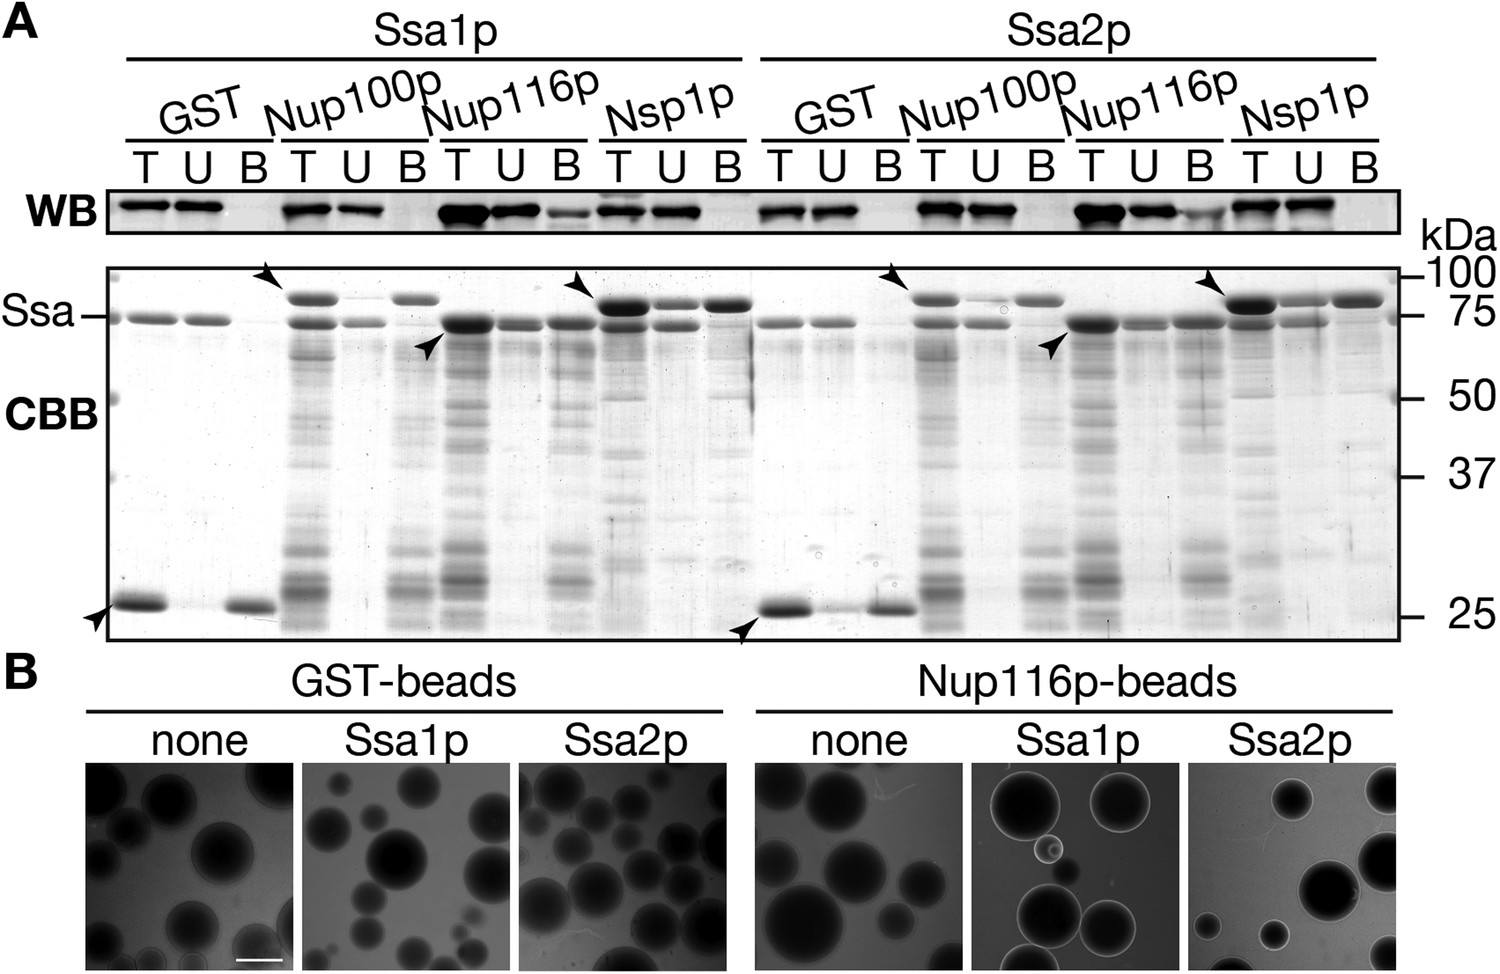
Ssa proteins interact with a certain nucleoporin.
(A) Interaction between Ssa proteins and nucleoporins was analyzed by the pull-down assay. 200 pmol of either GST, GST-Nup100(1–640)p, GST-Nup116(165–715)p or GST-Nsp1(1–601)p were mixed with 40 pmol of either Ssa1p or Ssa2p, and were pull-downed with Glutathione Sepharose. The same portions of total (T), unbound (U), and bound (B) samples were subjected to SDS-PAGE. Ssa proteins in each fraction were detected by Western blotting with anti-Ssa protein antibodies (upper, WB), and total proteins were visualized by CBB staining (lower, CBB). Positions of GST fusions were indicated by arrowheads. (B) tRNA interaction with Nups were assayed by a variant of the low affinity binding assay. Alexa 488-labeled tRNA-ProUGG (0.50 µg) was incubated with GST- or GST-Nup116(165–715)p-coated Glutathione Sepharose in the absence (none) or presence of Ssa1p (Ssa1p) or Ssa2p (Ssa2p). Binding of the fluorescent tRNA to the beads was monitored with a fluorescence microscope.
Figure 8
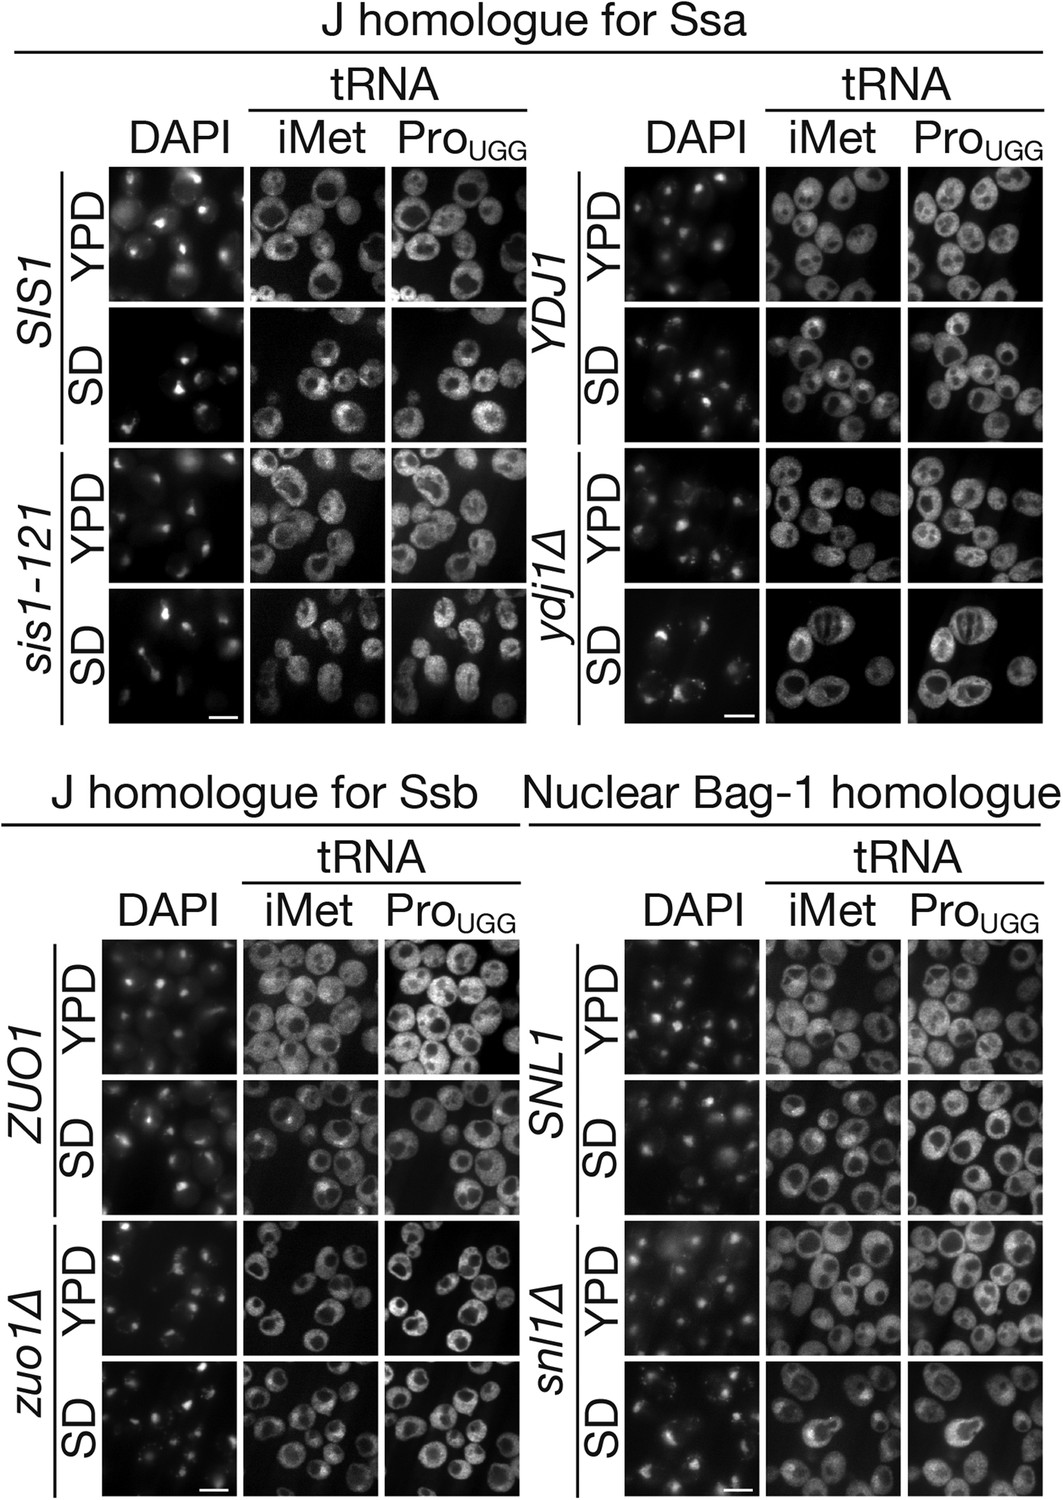
Major cytosolic DnaJ homologues of Ssa proteins are involved in tRNA import under starvation conditions.
tRNA localization under starvation conditions in mutants of major cytoplasmic DnaJ homologues (SIS1, YDJ1 and ZUO1) or a nuclear Bag-1 homologue (SNL1) was analyzed by FISH. Pairs of YDJ1 (PJ31-3A) and ydj1∆ (JJ160) strains, SIS1 (TYSC950) and sis1-121 (TYSC951) strains, ZUO1 (BY4741) and zuo1∆ (5937) strains, and SNL1 (W303-1B) and snl1∆ (SWY1353) strains were treated as described in Figure 2 except that all the strains but the SNL1 and snl1∆ strains were cultured at 23°C instead of 30°C. In each set of panels, upper two rows are the parental wild type and the lower two rows are the mutant. Bar, 5 µm.
Additional files
-
Supplementary file 1
Plasmids used for in vitro transcription in this study.
- https://doi.org/10.7554/eLife.04659.022
-
Supplementary file 2
Yeast strains used in this study.
- https://doi.org/10.7554/eLife.04659.023
Download links
A two-part list of links to download the article, or parts of the article, in various formats.
Downloads (link to download the article as PDF)
Open citations (links to open the citations from this article in various online reference manager services)
Cite this article (links to download the citations from this article in formats compatible with various reference manager tools)
Cytosolic Hsp70 and co-chaperones constitute a novel system for tRNA import into the nucleus
eLife 4:e04659.
https://doi.org/10.7554/eLife.04659


