The genetic architecture of gene expression levels in wild baboons
- University of Chicago, United States
- National Museums of Kenya, Kenya
- Duke University, United States
Figures
Figure 1 with 14 supplements

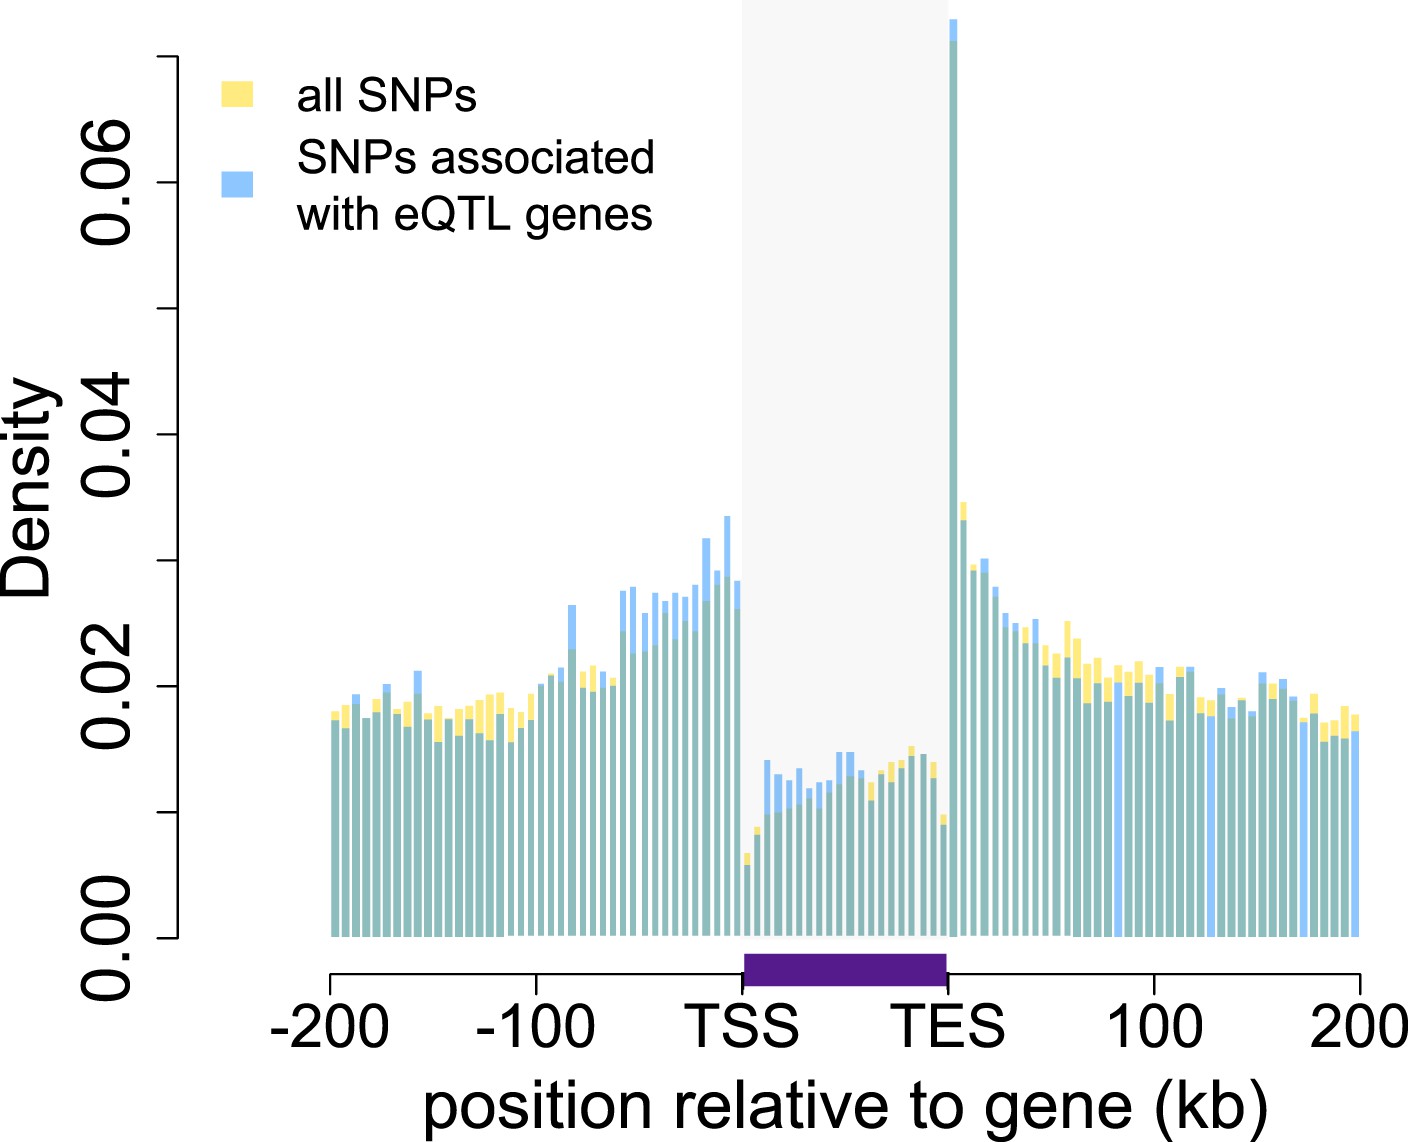
Baboon eQTLs are enriched in and near genes.
The locations of all SNPs tested in the eQTL analysis are shown in gold relative to the 5′ most gene transcription start site (TSS) and the 3′ most gene transcription end site (TES) for all 10,409 genes. SNPs detected as eQTL are overplotted in blue, and are enriched, relative to all SNPs tested, near transcription start sites, transcription end sites, and within gene bodies. Gray shaded rectangle denotes the region bounded by the TSS and TES, with gene lengths divided into 20 bins for visibility (because the gene body is thus artificially enlarged, SNP density within genes cannot be directly compared with SNP density outside of genes). Note that SNPs that fall outside of one focal gene may fall within the boundaries of other genes. Inset: distribution of all SNPs tested relative to the location of genes, highlighting the concentration of SNPs in genes (the peak at the center of the plot). See Figure 1—figure supplements 1–14 for additional details on workflow, variant calling validation, location of all analyzed SNPs relative to genes, agreement between eQTL and ASE detection, and effects of local structure.
Figure 1—figure supplement 1
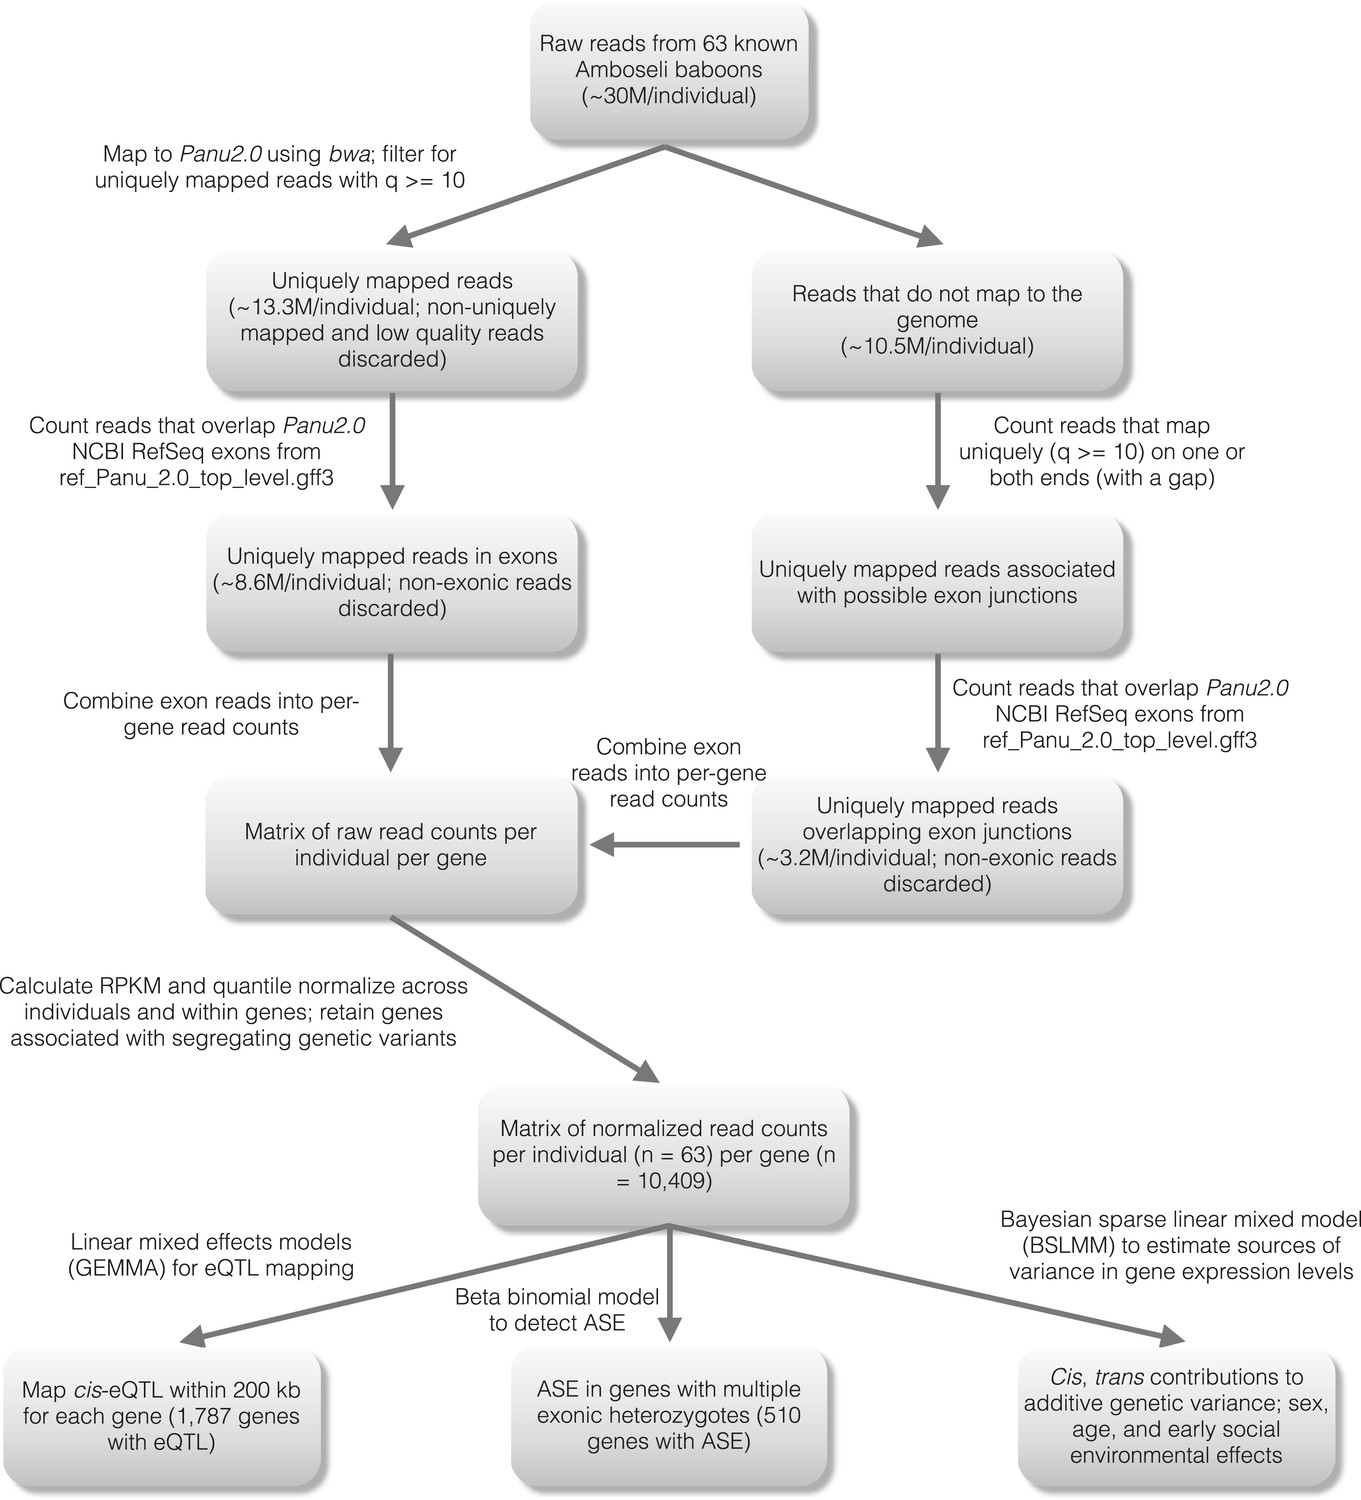
Detailed workflow for gene expression level estimation.
https://doi.org/10.7554/eLife.04729.004
Figure 1—figure supplement 2
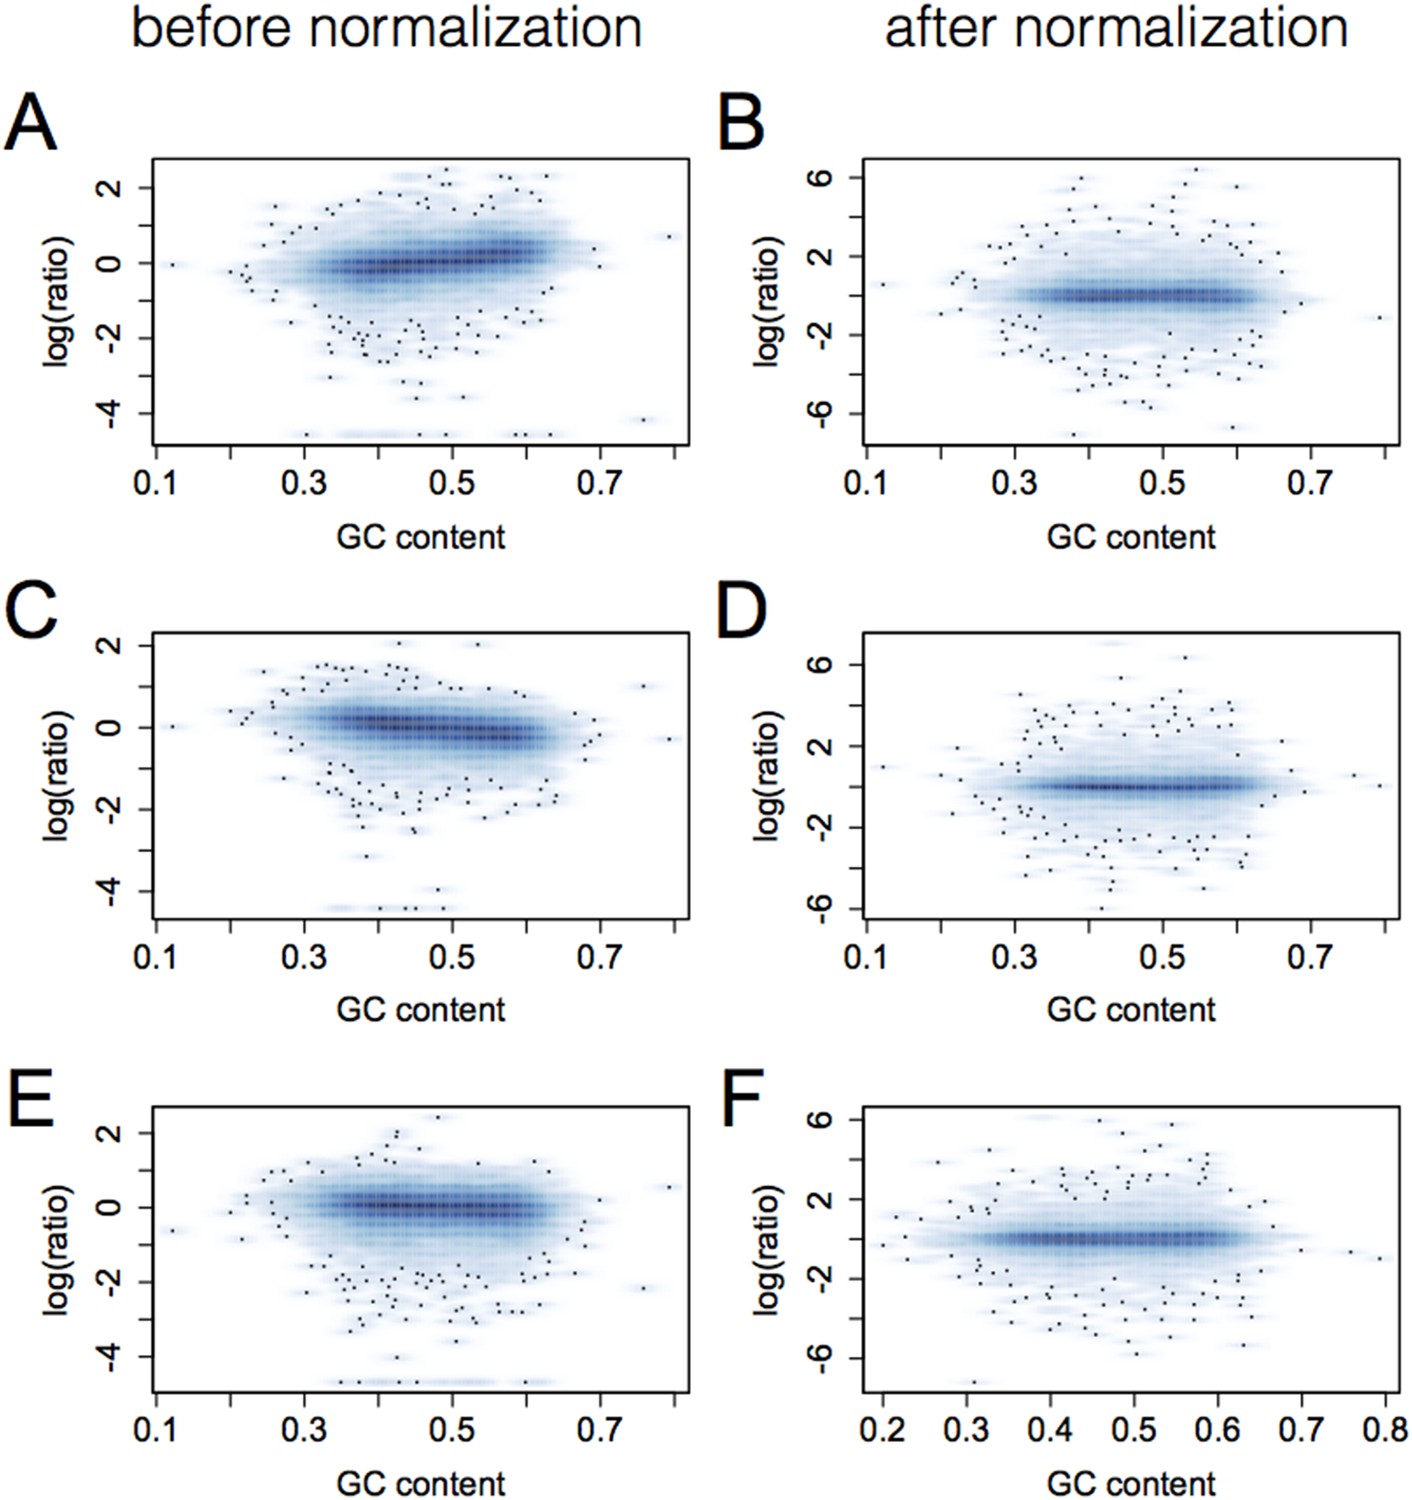
Elimination of GC bias via quantile normalization.
Each plot shows gene GC content (x-axis) vs the log of the ratio of the individual's RPKM for that gene to mean RPKM across all individuals. Data for three individuals are shown in pairs (A and B, C and D, E and F) for prior to (left) and after (right) quantile normalization.
Figure 1—figure supplement 3
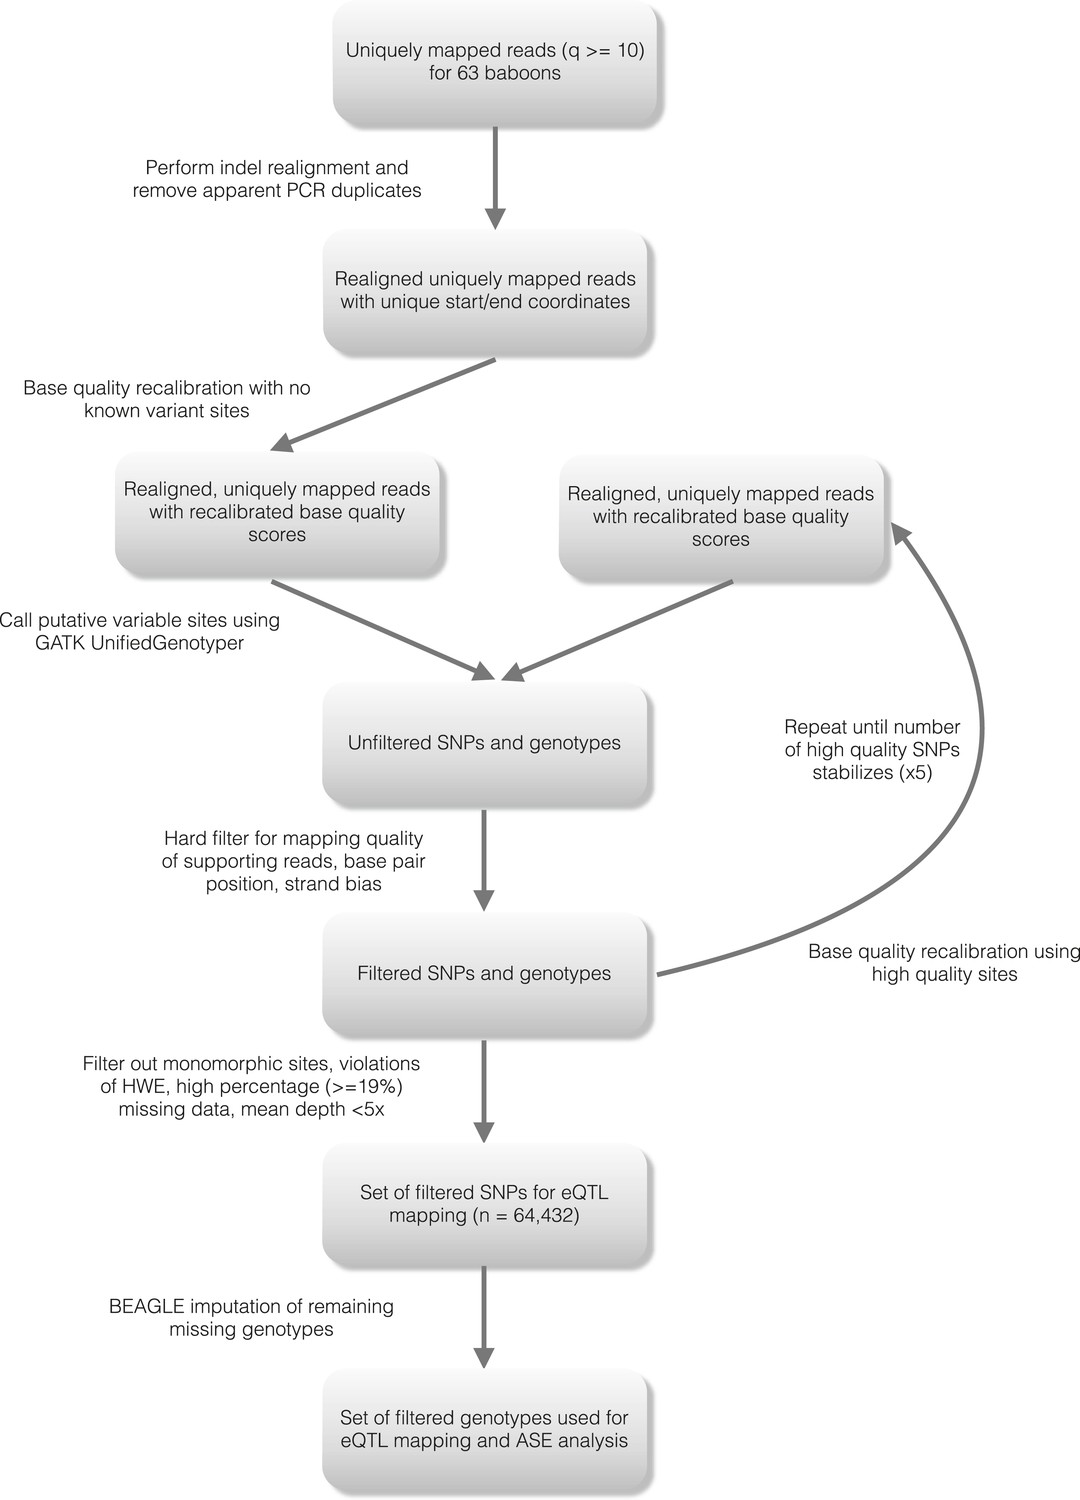
Detailed workflow for SNP genotyping.
https://doi.org/10.7554/eLife.04729.006
Figure 1—figure supplement 4
Location of analyzed SNPs relative to genes.
The locations of all SNPs tested in the eQTL analysis are shown in gold relative to the 5′ most gene transcription start site (TSS) and the 3′ most gene transcription end site (TES) for all 10,409 genes. The location of all SNPs tested in association with eQTL genes is overplotted in blue. Gray shaded rectangle denotes the region bounded by the TSS and TES, with gene lengths divided into 20 bins for visibility.
Figure 1—figure supplement 5
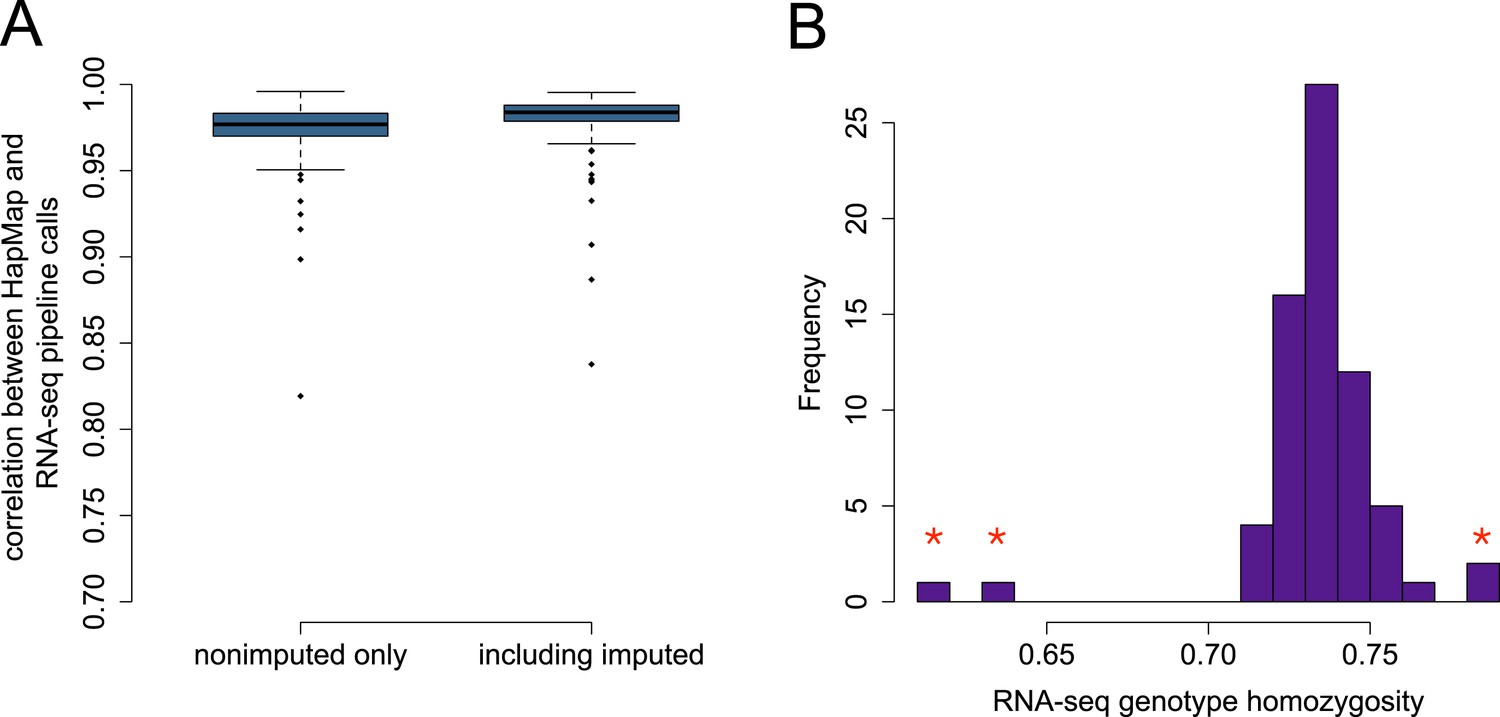
Accuracy of genotype calls for SNPs independently typed in HapMap3.
(A) Distribution of correlations between SNPs called using RNA-seq data and SNPs called independently by HapMap3 (n = 9919 variants). (B) Estimated homozygosity levels for n = 69 YRI individuals at the same set of sites; outliers (denoted with red stars) reflect those individuals with the lowest correlation between RNA-seq-based genotypes and HapMap3 genotypes. The four starred outliers in (B) include the three lowest accuracy individuals in the boxplots in (A).
Figure 1—figure supplement 6
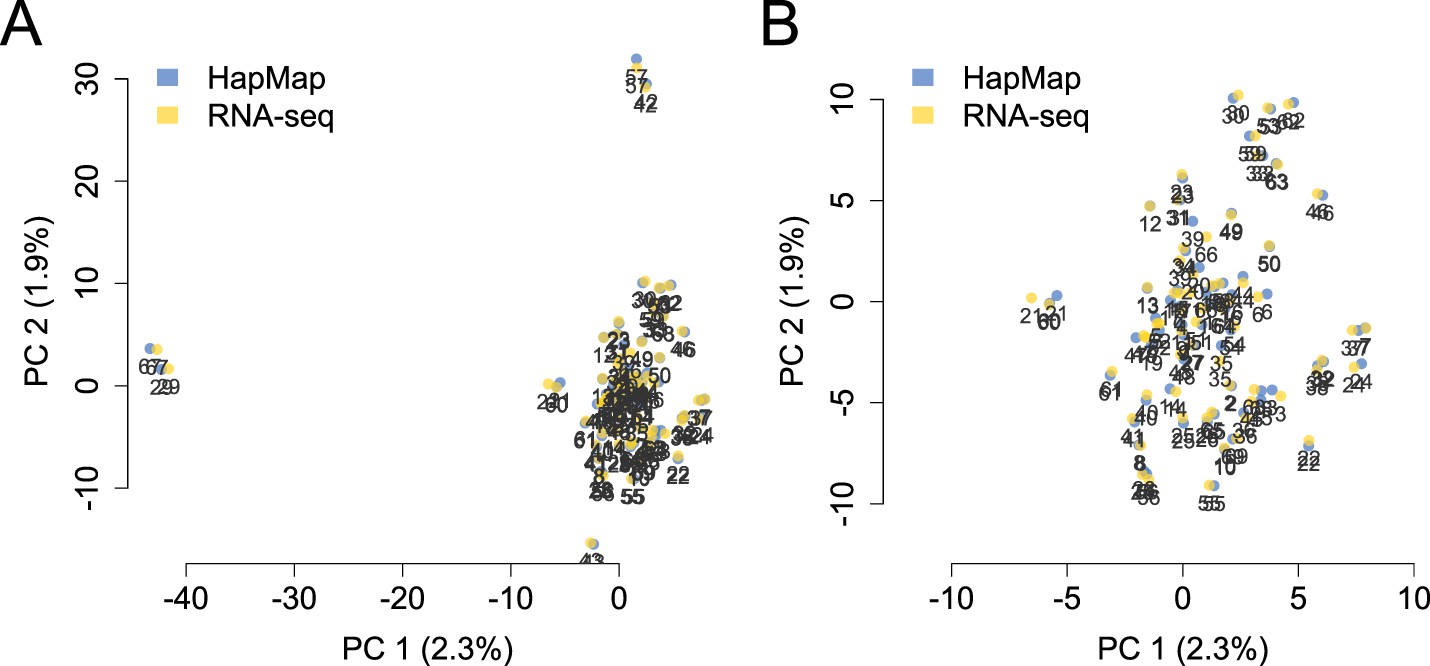
PCA projection of YRI samples using the RNA-seq-based pipeline vs independently typed SNPs.
PCA projection of genotype data from the RNA-seq-based pipeline and the HapMap3 data place individual samples very close together. (A) and (B) show the same data, but (B) zooms in on the central cluster for better visibility.
Figure 1—figure supplement 7
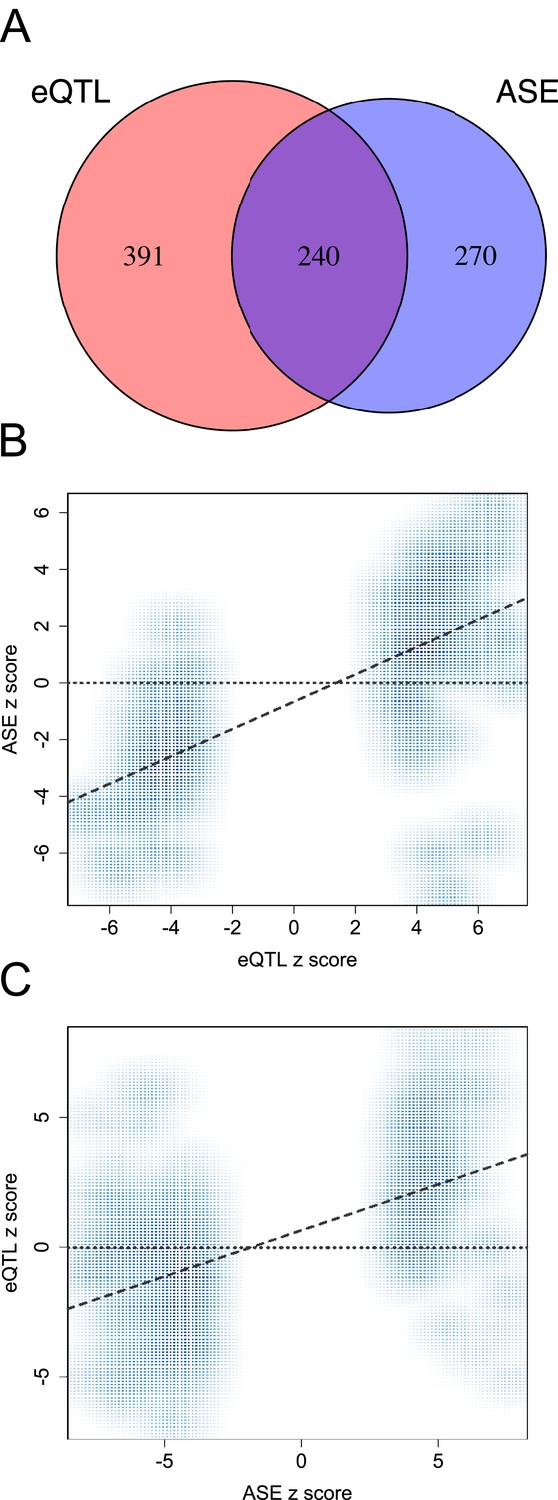
Agreement between eQTL and ASE approaches for identifying functional variants.
(A) Venn diagram depicting the overlap between genes with significant eQTL and ASE, among genes tested in both cases (note that the number of genes with eQTL is smaller in this figure than in the overall data set because we consider only the set of genes that were testable for both eQTL and ASE, n = 2280 instead of n = 10,409). Genes with significant eQTL are more likely to have significantly detectable ASE and vice-versa (n = 2280; p < 10−25). (B) eQTL SNPs in exonic regions that could also be tested for ASE reveal correlated effect sizes (n = 123; p < 10−20). (C) Similarly, ASE SNPs exhibit effect sizes that are correlated with evidence for eQTL at the same sites (n = 510; p < 10−45).
Figure 1—figure supplement 8
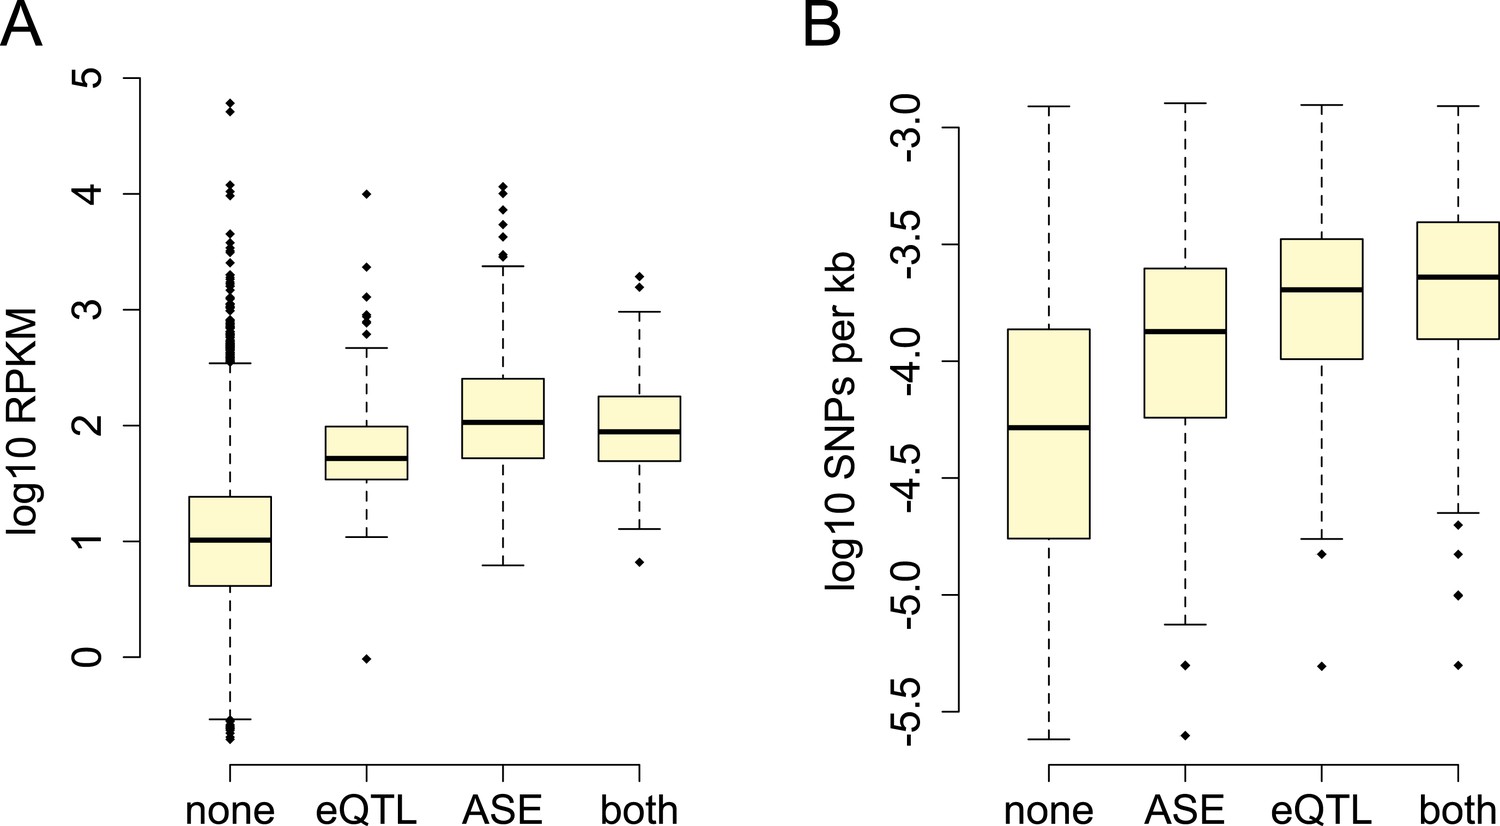
Power to detect ASE vs eQTL.
(A) Detection of ASE is favored for genes with higher expression levels (p = 3.99 × 10−209), (B) whereas detection of eQTL is favored for genes with greater cis-regulatory SNP density (p = 1.05 × 10−73).
Figure 1—figure supplement 9
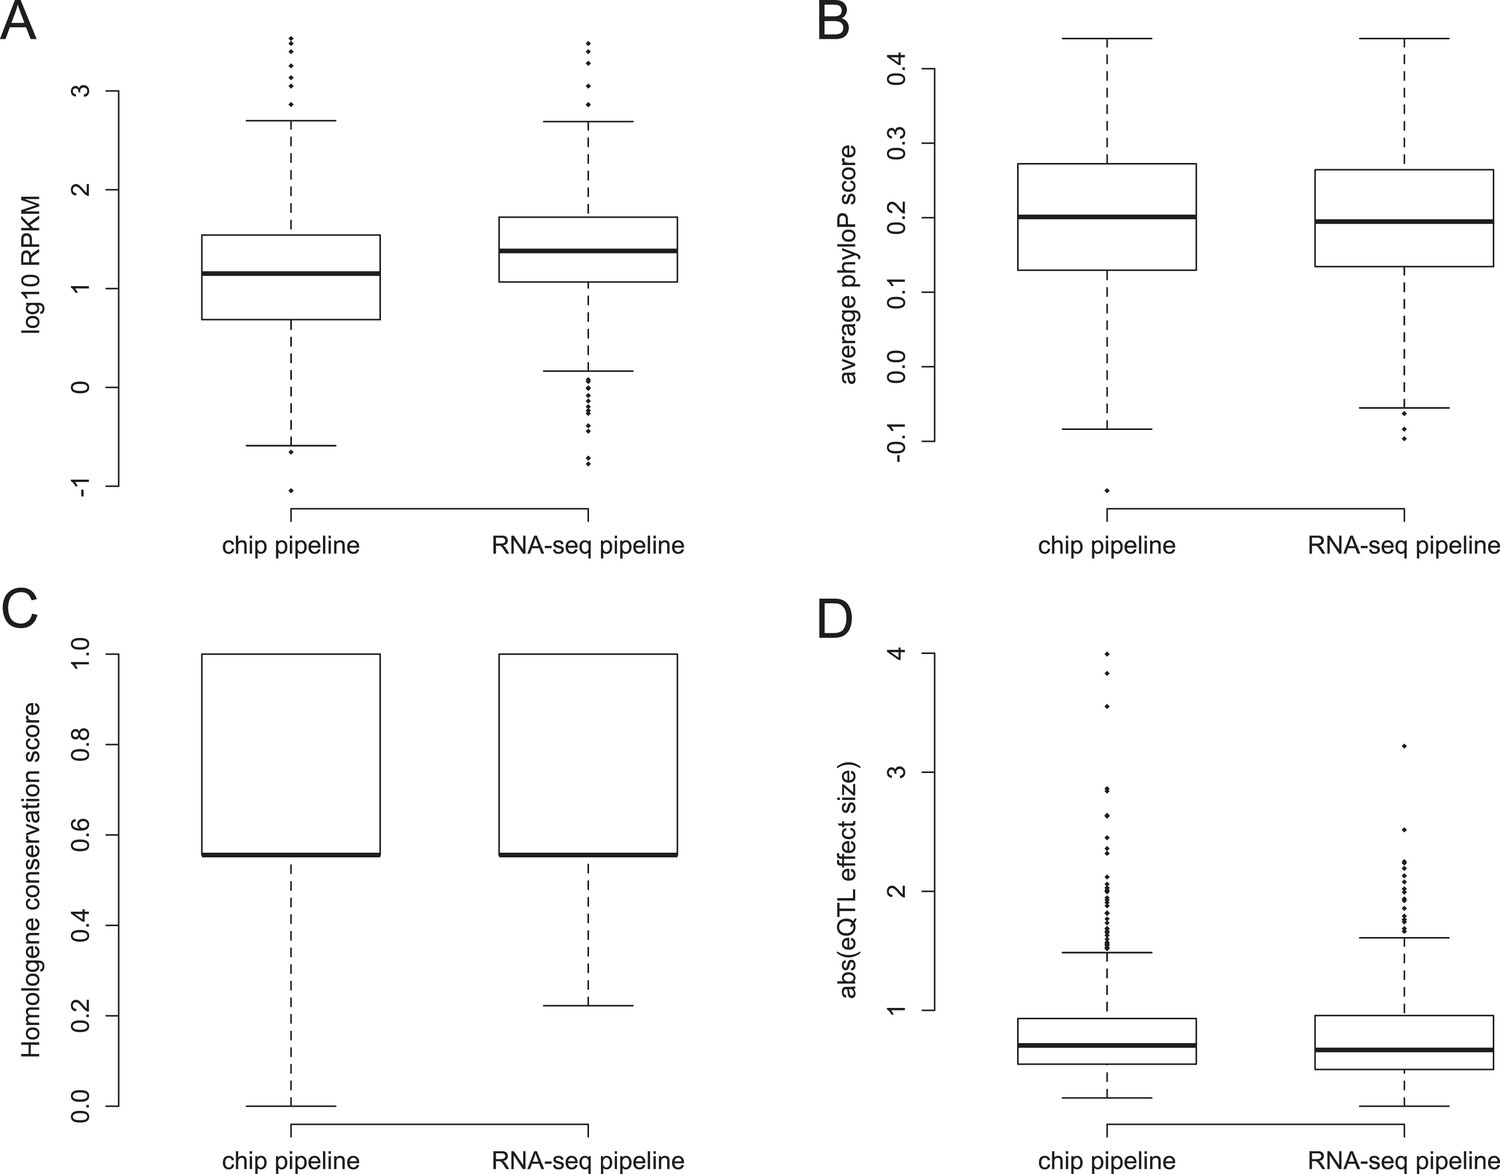
Characteristics of YRI eQTL identified in the RNA-seq vs conventional pipelines.
Boxplot differences between eQTL identified in the YRI data set using chip-based genotype data vs RNA-seq-based genotype data for (A) gene expression levels in RPKM (Wilcoxon test p = 6.53 × 10⁻⁹); (B) conservation levels measured by average phyloP per gene (p = 0.707); (C) conservation levels measured using Homologene conservation scores (p = 0.600); and (D) magnitude of the eQTL effect size (p = 0.137).
Figure 1—figure supplement 10
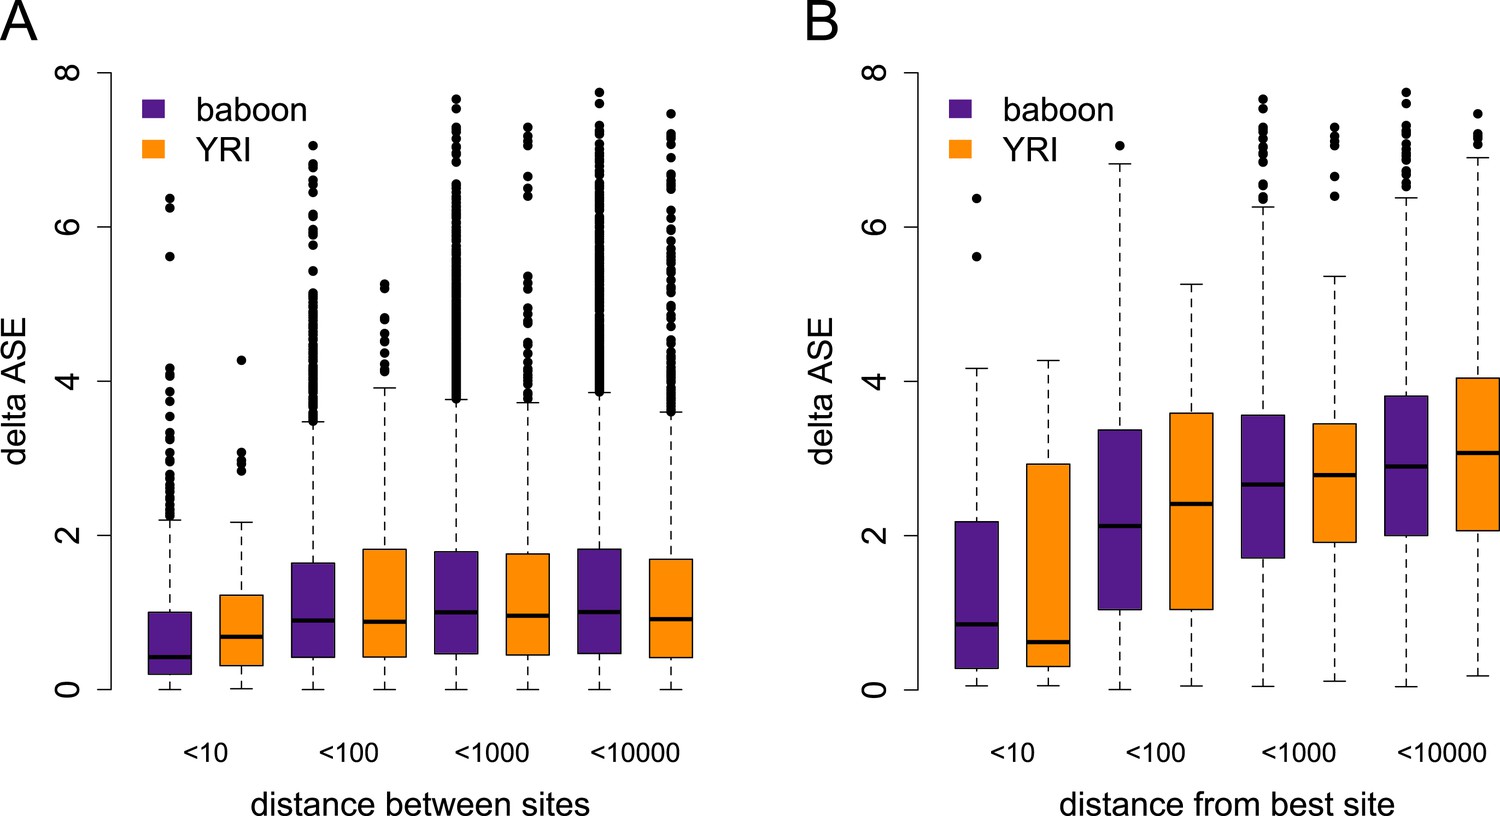
Differences in the magnitude of ASE vs distance between sites.
(A) Difference in the magnitude of ASE estimated for pairs of tested sites (i.e., absolute difference of the absolute values of z-scores), by distance between sites. (B) Difference in the magnitude of ASE estimated for pairs of tested sites for genes with significant ASE only, where one site in the pair is the site with the best ASE support for the gene. In both plots, distance categories reflect the range from the previous category to the labeled max value.
Figure 1—figure supplement 11
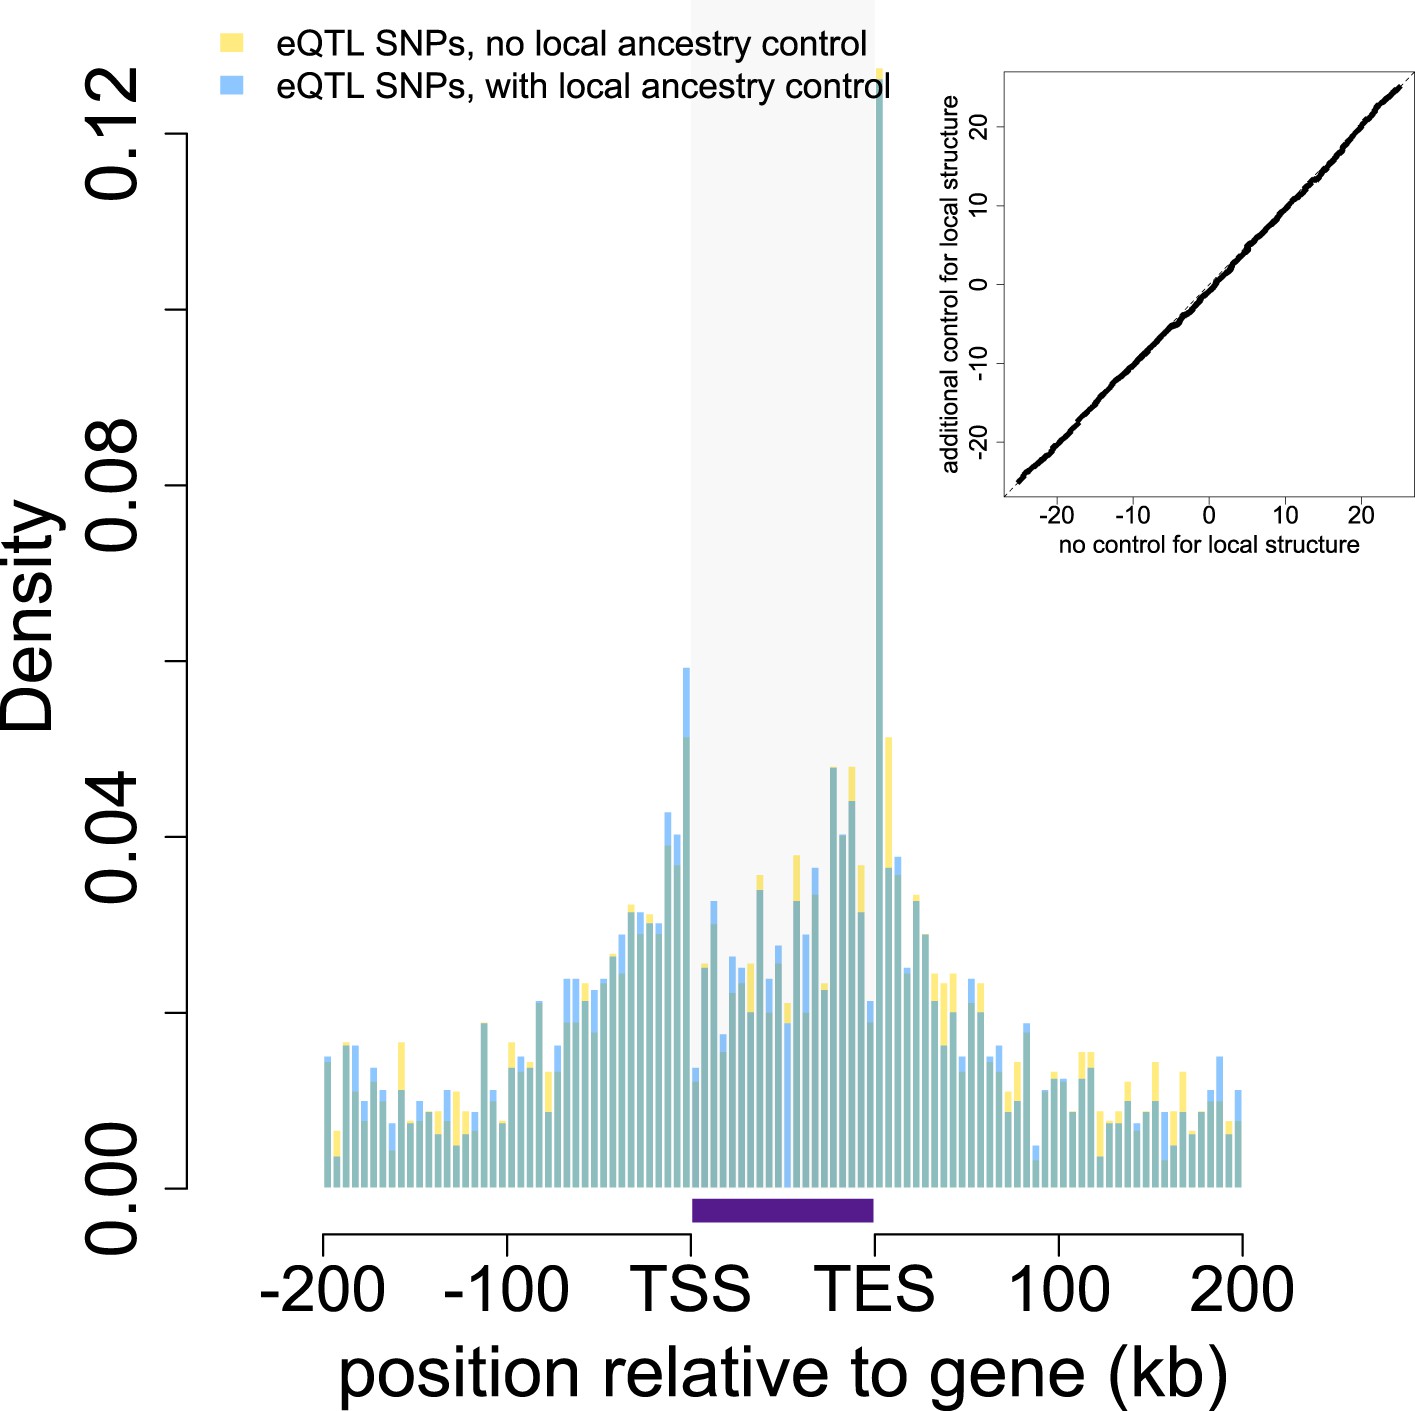
Location of eQTL SNPs relative to genes with and without controlling for local structure.
The locations of all eQTL SNPs (n = 1787) identified in the main eQTL analysis are shown in gold relative to the 5′ most gene transcription start site (TSS) and the 3′ most gene transcription end site (TES). eQTL SNPs detected in a parallel analysis controlling for local structure (n = 1583) are overplotted in blue. Gray shaded rectangle denotes the region bounded by the TSS and TES, with gene lengths divided into 20 bins for visibility. Note that SNPs that fall outside of one focal gene may fall within the boundaries of other genes. Inset: Quantile–quantile plot of eQTL locations in models that do and do not control for local structure (Kolmogorov-Smirnov test, p = 0.577).
Figure 1—figure supplement 12
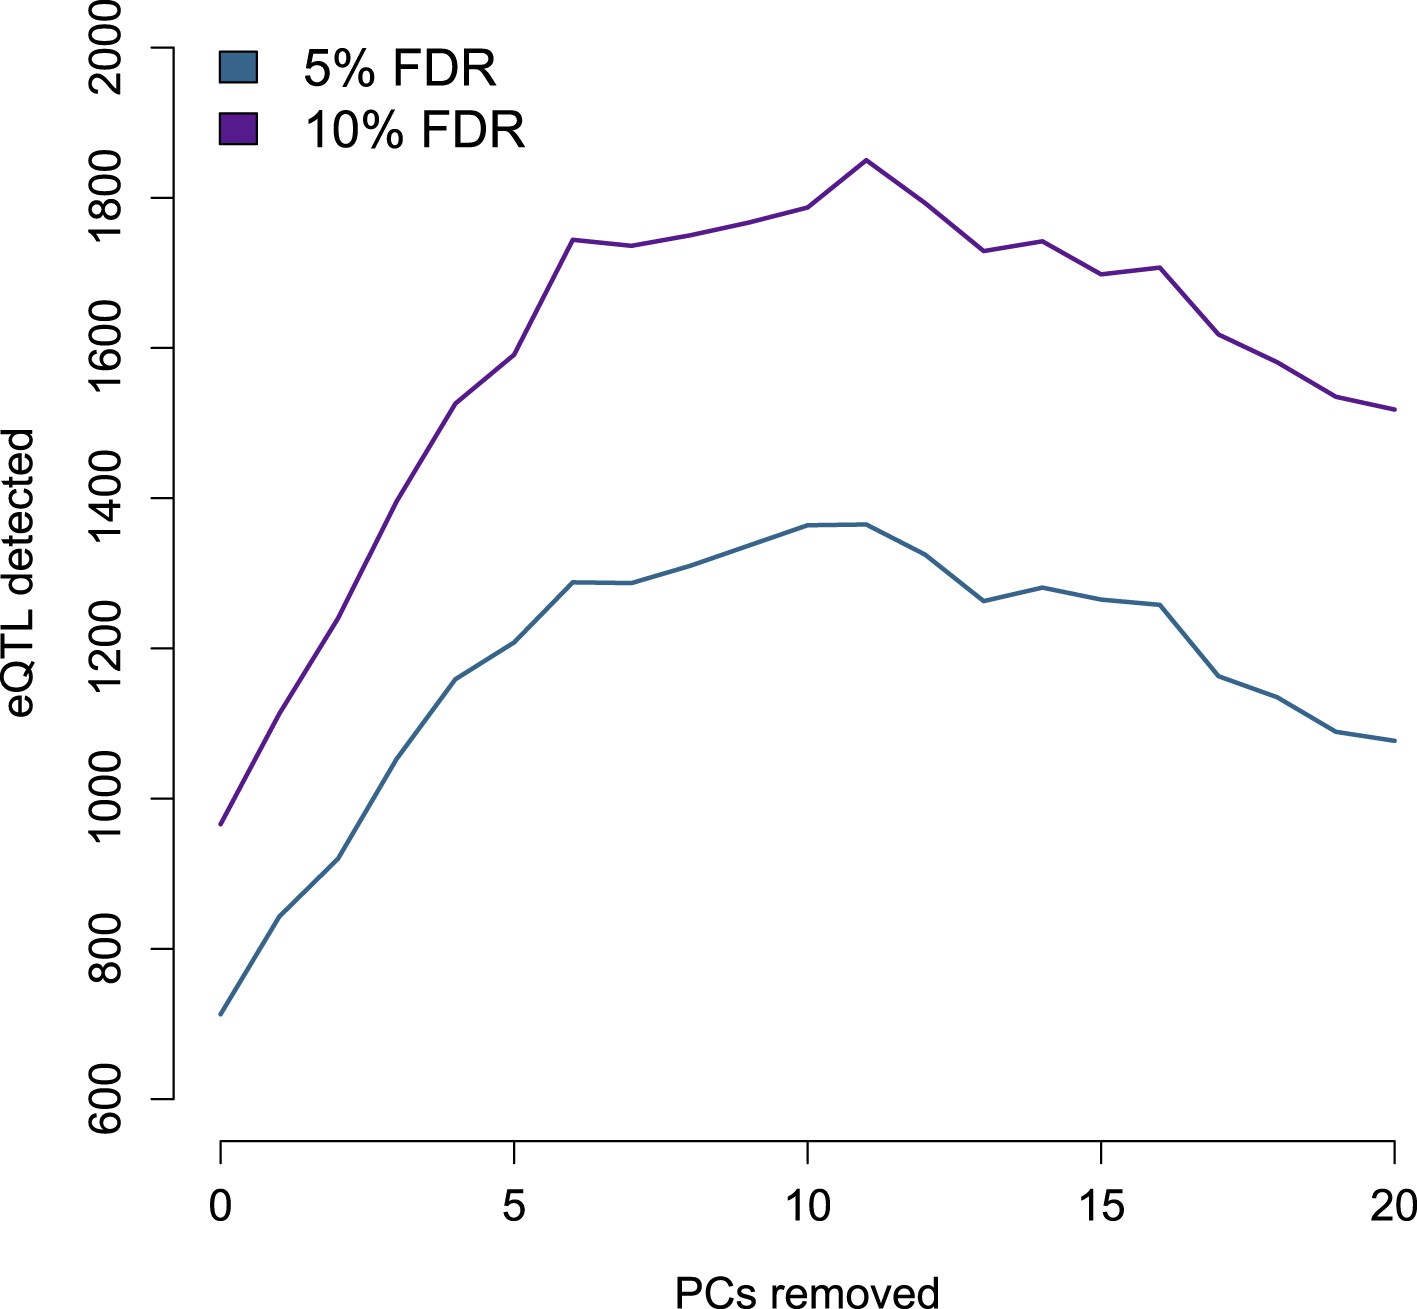
Number of eQTL identified by PCs removed from the gene expression data set.
https://doi.org/10.7554/eLife.04729.015
Figure 1—figure supplement 13
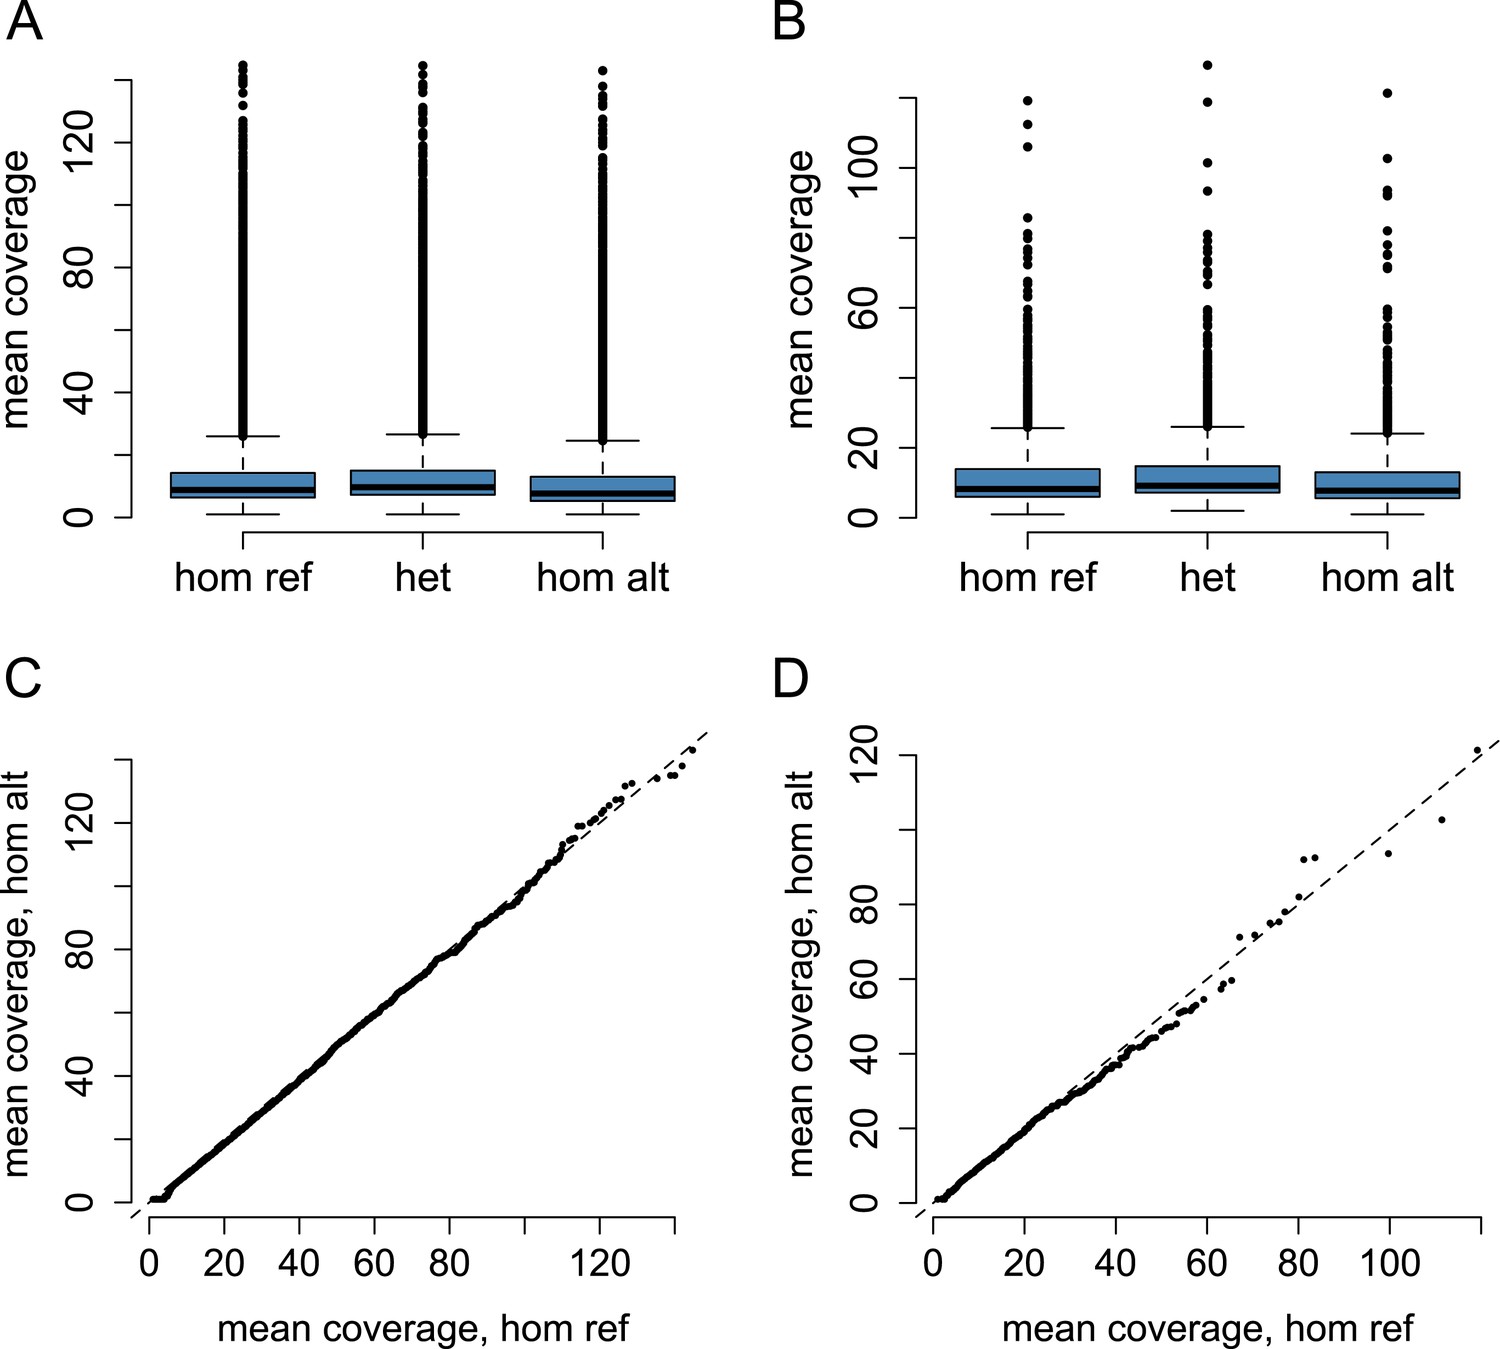
Coverage by genotype call.
Mean coverage by genotype class for (A) all SNPs tested in the baboon eQTL analysis (n = 64,432), and (B) SNPs identified as eQTL (n = 1693). QQ plot of mean coverage in homozygotes for the reference allele vs homozygotes for the alternate allele for (C) all SNPs and (D) SNPs identified as eQTL. The magnitude of increased coverage in reference allele homozygotes indicates the degree of systematic reference allele mapping bias (dashed line shows the expectation for no mapping bias). Reference allele homozygotes tend to have higher coverage, on average, than alternate allele homozygotes (K-S test: p < 2.2 × 10⁻¹⁶ for all SNPs; p = 3.9 × 10⁻⁵ for eQTL SNPs), suggesting some degree of mapping bias; however the effect is actually smaller for eQTL SNPs than for all SNPs (K-S D = 0.167 for all SNPs; K-S D = 0.084 for eQTL SNPs).
Figure 1—figure supplement 14
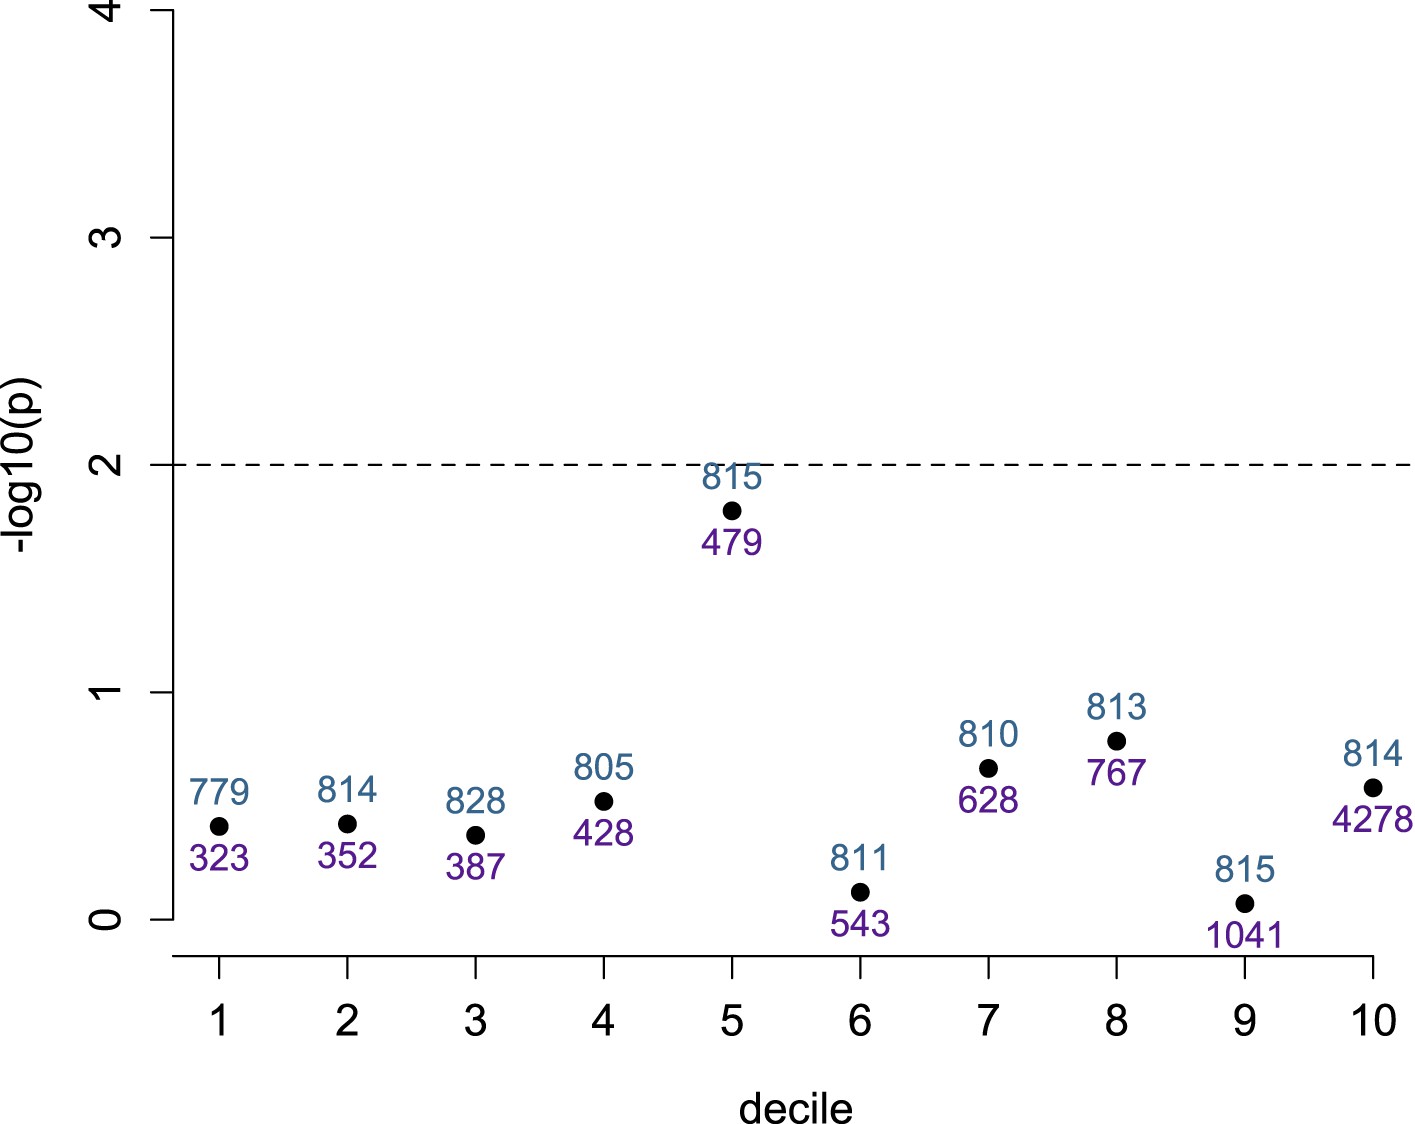
Detection of ASE is not dependent on number of heterozygotes, conditional on total read depth.
SNPs within the set tested for ASE (n = 8145) were divided into deciles based on total read depth. The evidence for a relationship (−log10 of the p-value from a Wilcoxon test) between number of heterozygous individuals at each site and detection of significant ASE is shown on the y-axis for each decile. Dashed line shows a nominal significance threshold of p = 0.01. Blue numbers above each point show the number of sites that fall within the decile; purple numbers below each point show the maximum total read depth for that decile (minimum total read depth is the maximum depth for the previous decile, or 300 for the lowest decile).
Figure 2 with 1 supplement
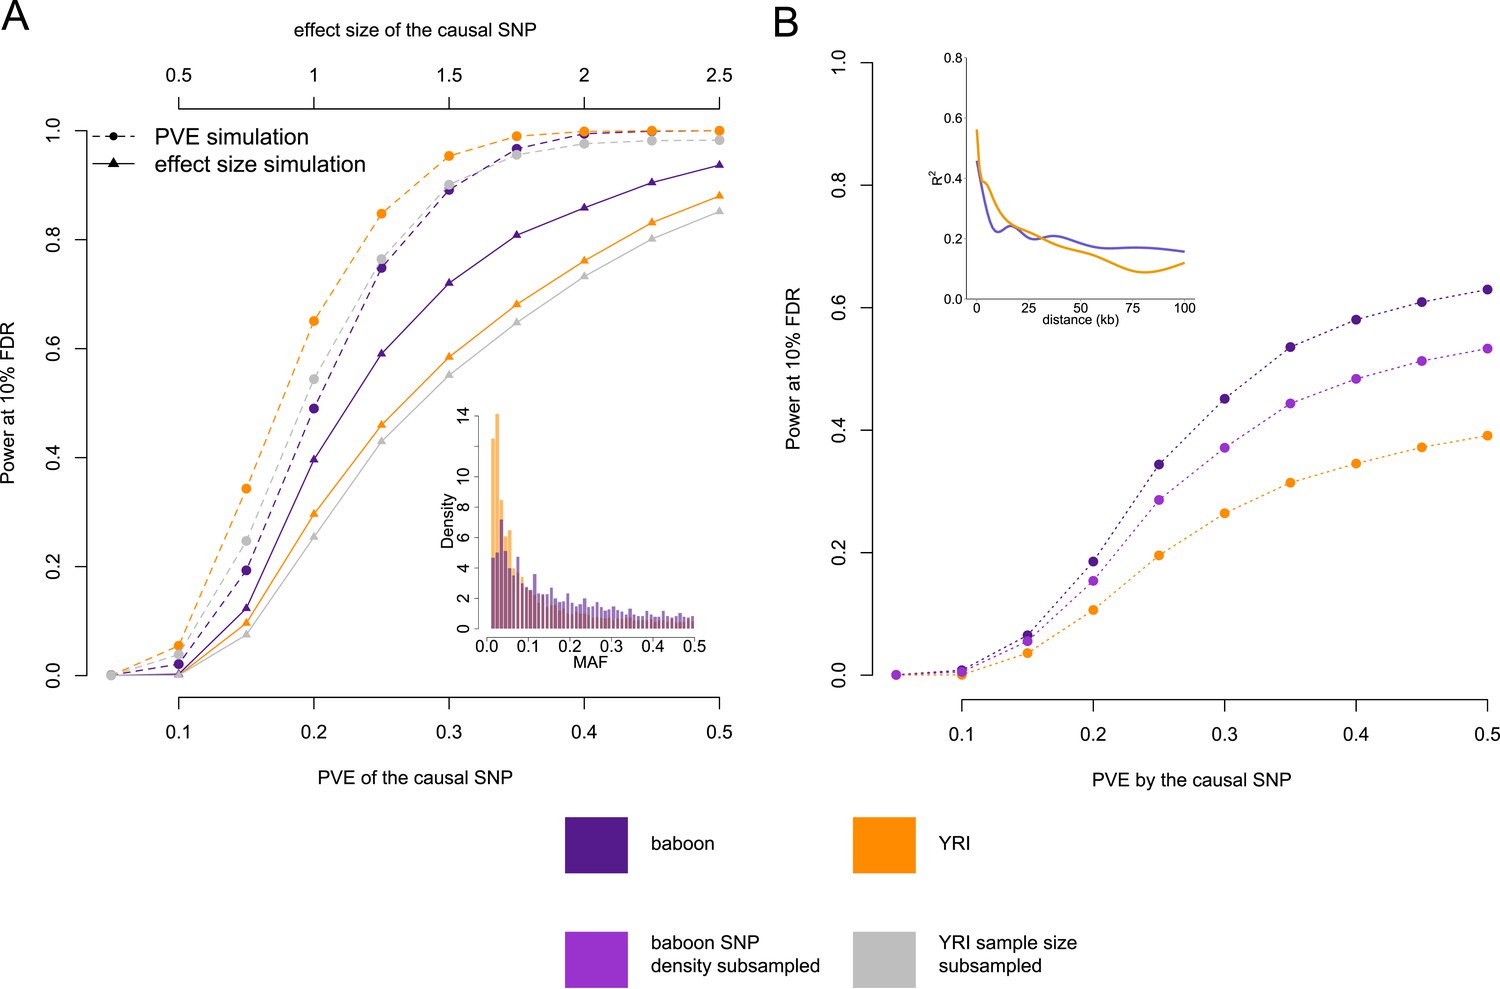
Power to detect eQTL in the Amboseli baboons compared to the HapMap YRI population.
(A) Simulated eQTL data sets demonstrate that the baboon data set has greater power to detect eQTL (at a 10% FDR threshold) when eQTL are simulated based on effect size (solid lines and triangles) but not when eQTL are simulated based on proportion of variance in gene expression levels explained (PVE: dashed lines and circles). This result likely stems from differences in the minor allele frequency (MAF) spectrum between baboons and YRI (inset), which favors eQTL mapping in the baboons; simulations based on effect size are sensitive to MAF, but simulations based on PVE are not. (B) Masking the simulated eQTL SNP demonstrates that the baboon data set has greater power to detect eQTL due to both increased cis-regulatory SNP density and more extended LD (inset). Subsampling the SNP density in the baboon data set to the level of the YRI data set reduces the difference in power but does not remove it completely. In B, all results are shown for PVE-based simulations to exclude the effects of the MAF. See Figure 4—figure supplement 1 for power simulations for masked SNPs based on effect size.
Figure 2—figure supplement 1
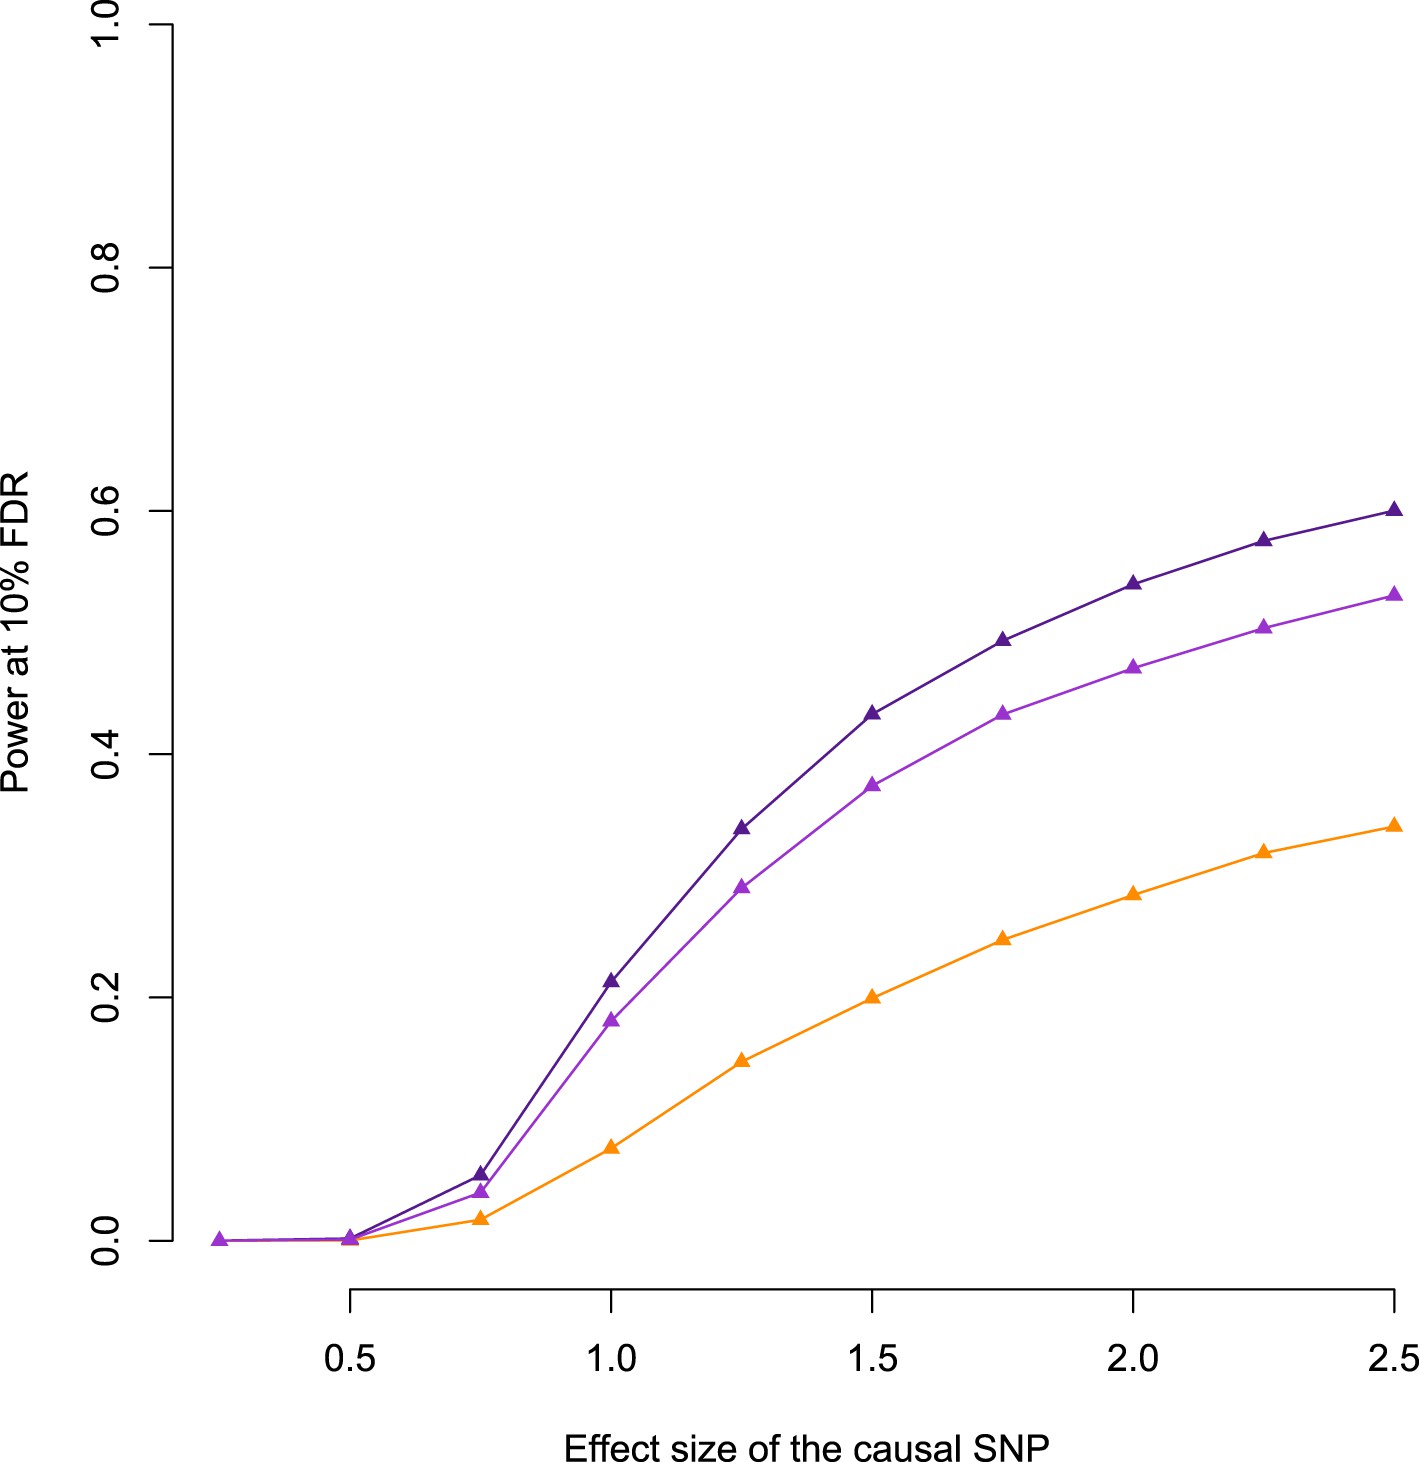
Relationship between power to detect eQTL and simulated effect size, when the true eQTL is masked.
Purple line shows the baboon data; pink line shows the baboon data with SNP density subsampled to match the YRI; orange line shows the YRI data. Masking the simulated eQTL SNP demonstrates that the baboon data set has greater power to detect eQTL due to both increased cis-regulatory SNP density and more extended LD. Subsampling the SNP density in baboon to the level of the YRI data set reduces the difference in power but does not remove it completely.
Figure 3 with 1 supplement
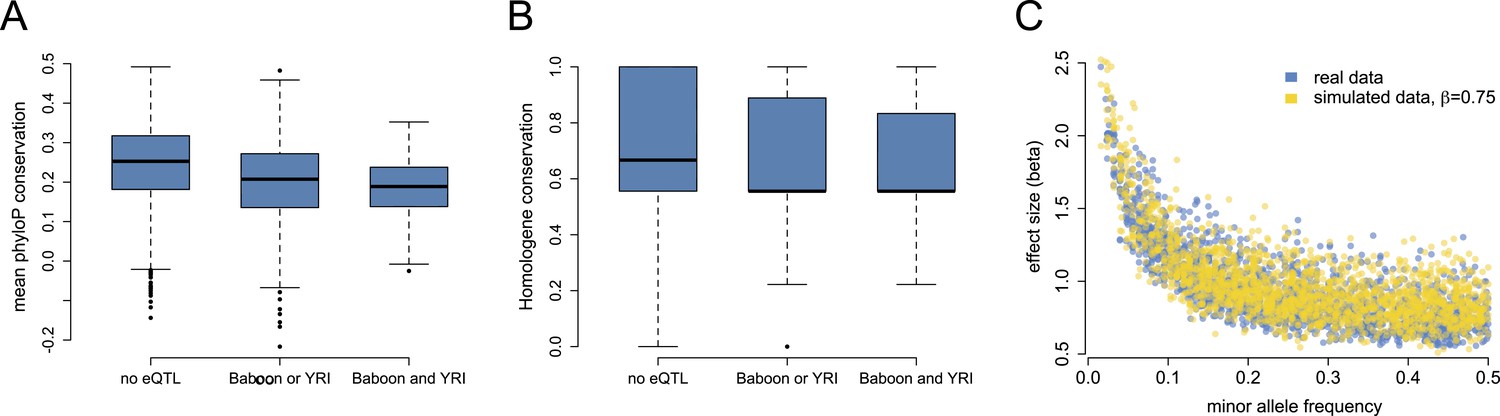
Mixed evidence for negative selection on variants affecting gene expression level.
(A) Genes that harbor detectable eQTL in baboons, the YRI, or both are more likely to be conserved across long stretches of evolutionary time, based on mean phyloP scores in a 46-way primate genome comparison (n = 7268; p < 10−53). (B) These genes are also more likely to be lineage-specific, based on Homologene annotations (n = 7065; p = 1.78 × 10⁻⁸). (C) Although we detect a strong negative correlation between eQTL effect size and eQTL minor allele frequency, in support of pervasive selection against alleles with large effects on gene expression levels, this correlation also appears when simulating constant eQTL effect sizes, suggesting winner's curse effects. See Figure 3—figure supplement 1 for phyloP results based on a 100-way vertebrate genome comparison.
Figure 3—figure supplement 1
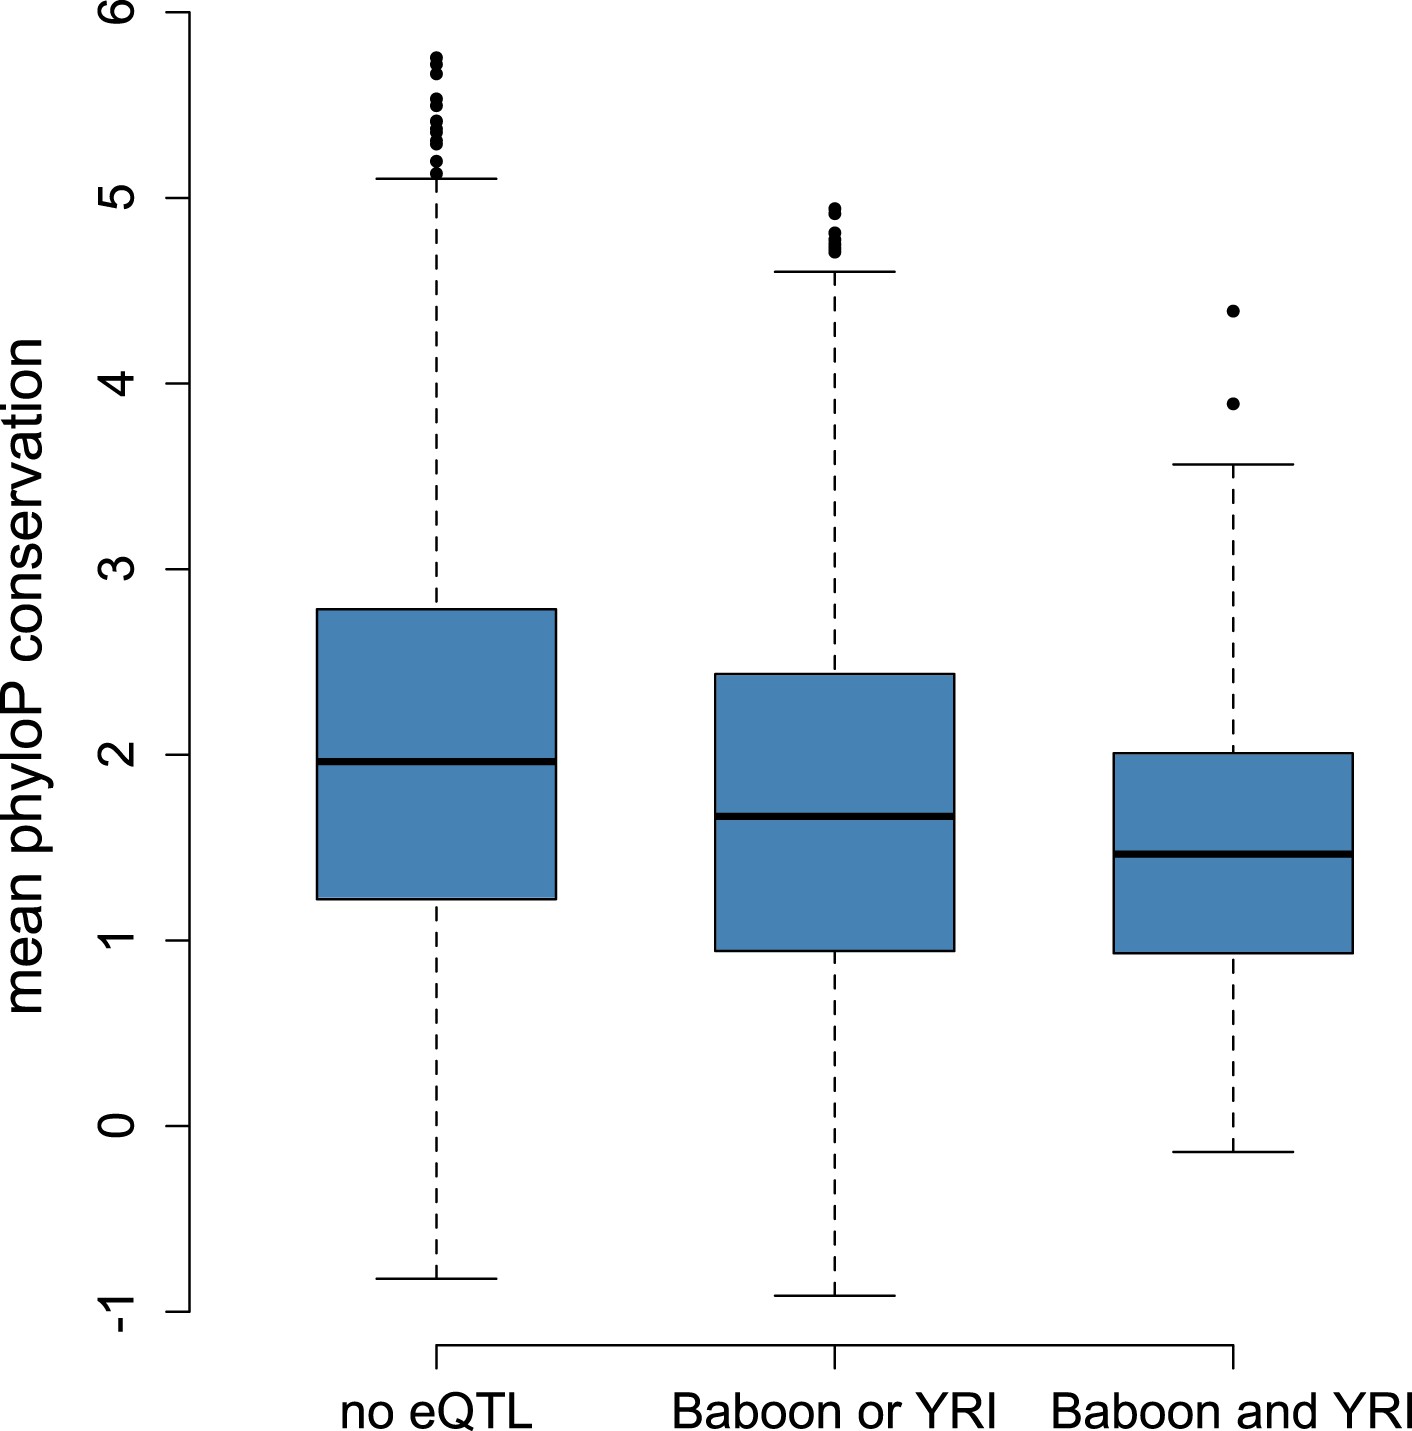
Correlation between eQTL detection and mean phyloP scores based on 100-way vertebrate comparison.
Genes with eQTL in both data set or one data set are less conserved across vertebrates than genes for which no eQTL were detected (n = 7,268, p < 10−19).
Figure 4 with 3 supplements
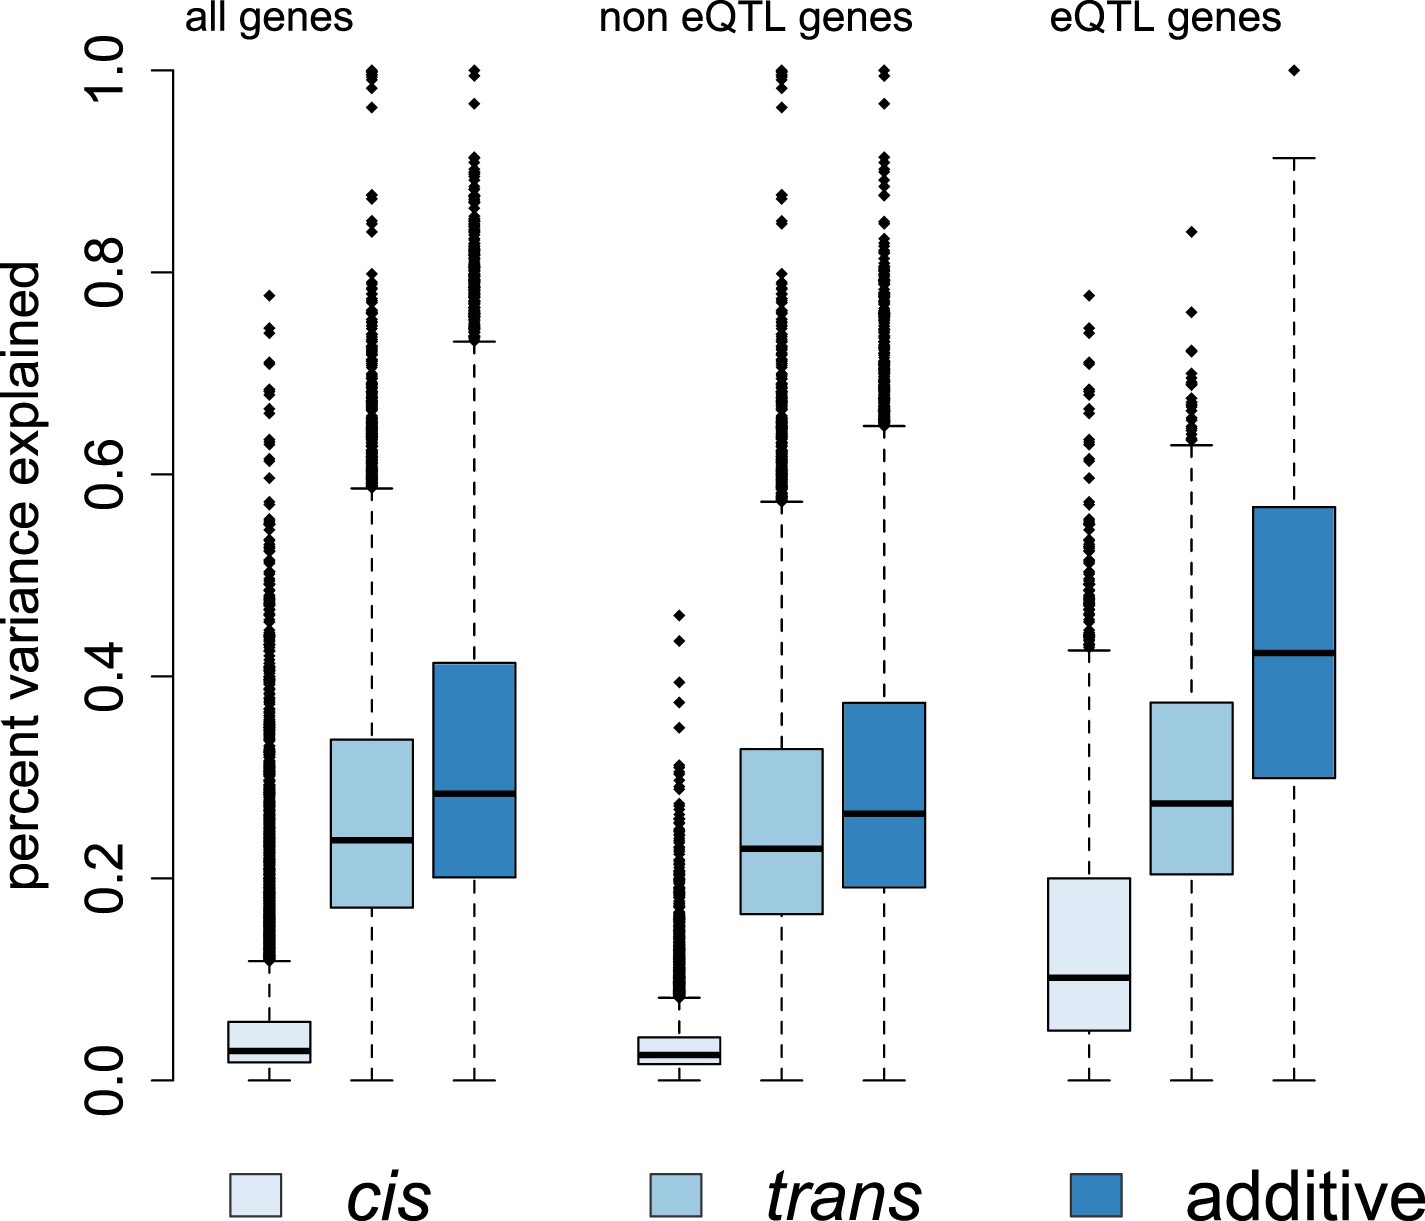
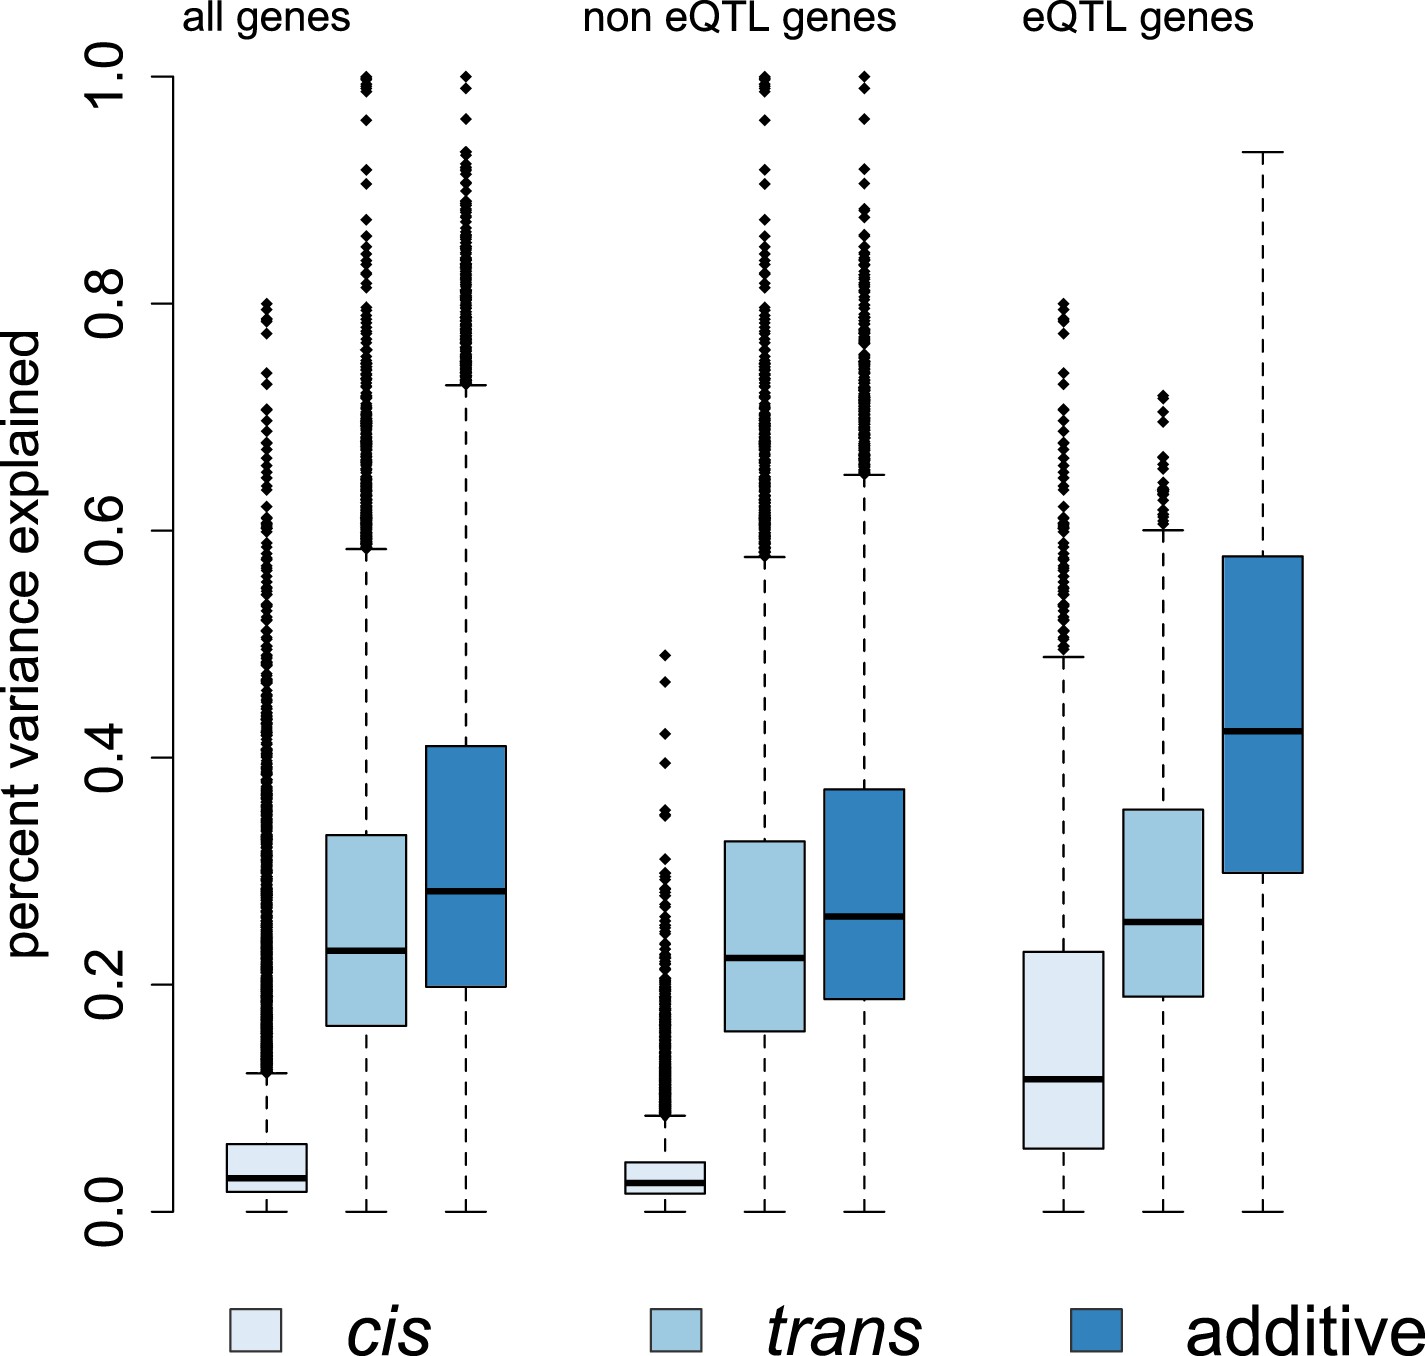
Genetic contributions to variance in gene expression levels in wild baboons.
Proportion of variance in gene expression levels estimated for all genes, genes without detectable eQTL, and genes with detectable eQTL. Additive genetic effects on gene expression variation, especially cis-acting effects, are larger for eQTL genes than for other genes. See Figure 4—figure supplements 1–3 for related results on percent variance explained by genetic, environmental, and demographic variables and results using an alternative set of SNPs for estimating ptrans.
Figure 4—figure supplement 1
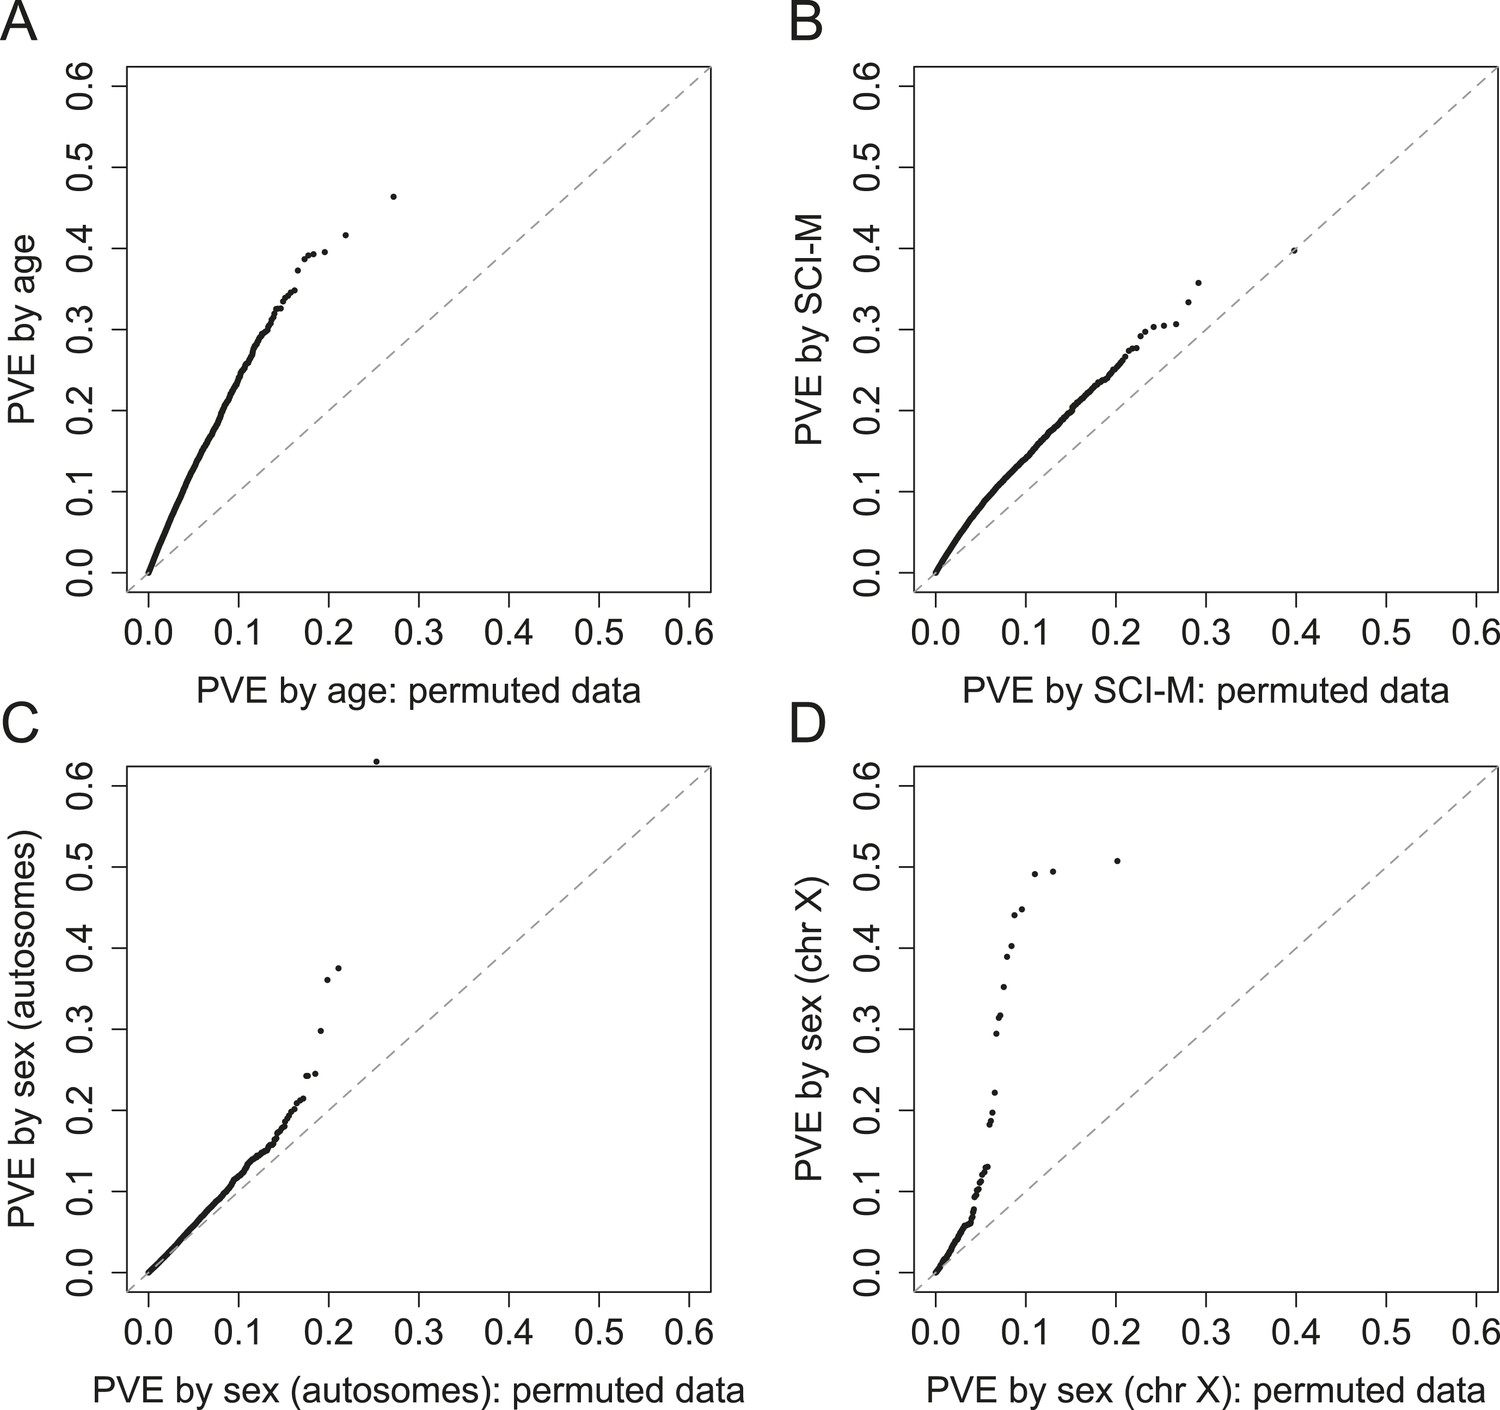
PVE explained by demographic and early environmental variables.
QQ plots of PVE explained by a variable of interest vs PVE explained by that variable with permuted data, for (A) age; and (B) maternal social connectedness to males (SCI-M). Bottom panels show the difference between evidence for significant PVE by sex for (C) genes on autosomes vs (D) genes on the X chromosome (bottom right).
Figure 4—figure supplement 2
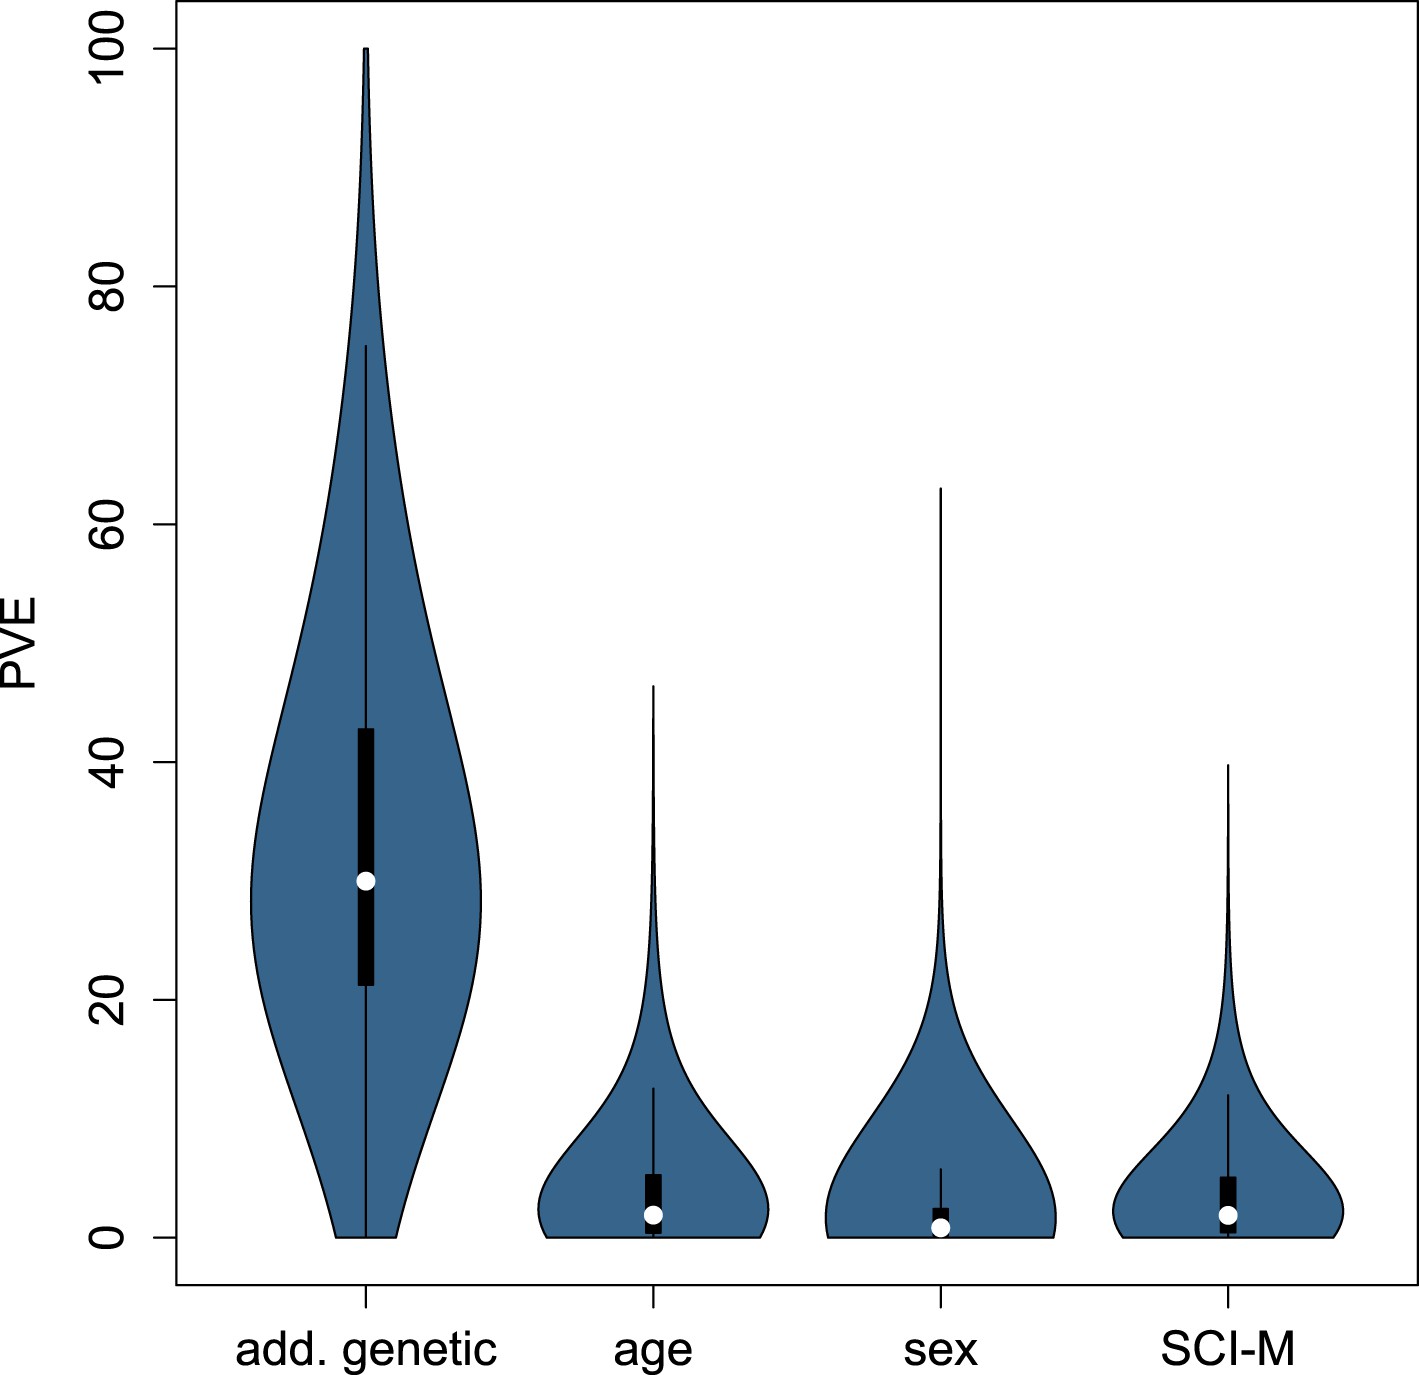
Distribution of PVE explained by additive genetic variance, age, sex, and maternal social connectedness to males across all genes.
https://doi.org/10.7554/eLife.04729.024
Figure 4—figure supplement 3
Genetic contributions to variance in gene expression levels, with ptrans based on SNPs on other chromosomes only.
https://doi.org/10.7554/eLife.04729.025Additional files
-
Supplementary file 1
Supplementary tables. (A) Read mapping summary. (B) Gene Ontology analysis for genes with no eQTL in baboon or YRI. (C) Gene Ontology analysis for genes with eQTL in either or both baboon and YRI. (D) Demographic and environmental data.
- https://doi.org/10.7554/eLife.04729.026
Download links
A two-part list of links to download the article, or parts of the article, in various formats.
Downloads (link to download the article as PDF)
Open citations (links to open the citations from this article in various online reference manager services)
Cite this article (links to download the citations from this article in formats compatible with various reference manager tools)
The genetic architecture of gene expression levels in wild baboons
eLife 4:e04729.
https://doi.org/10.7554/eLife.04729


