Cofilin-induced unidirectional cooperative conformational changes in actin filaments revealed by high-speed atomic force microscopy
- National Institute of Advanced Industrial Science and Technology, Japan
- Kanazawa University, Japan
- Japan Science and Technology Agency, Japan
- Osaka City University, Japan
- University of Tsukuba, Japan
- Yokohama City University, Japan
Figures
Figure 1 with 1 supplement

HS-AFM observation of control and cofilin-bound actin filaments.
(A) Control actin filaments without cofilin. (B) Actin filaments fully bound with cofilin over an extended distance. (C) Paracrystals of actin filaments. Bars: 25 nm, Z-scale: 0–12 nm. (D and E) Histograms of peak heights (D) and lengths of half helical pitches (E) in control actin filaments and cofilin-decorated actin segments. N was between 1722 and 2536. (F) Half helical pitches of actin paracrystals (N = 1009). Solid lines show Gaussian fittings with confidence intervals of 99.73%. For comparison, the dark line in (F) shows the Gaussian fitting of control actin filaments. Measurements were made in F buffer containing 1 mM ATP (A), 1 mM ATP, and 75 nM cofilin (B) or 1 mM ATP and 30 mM MgCl2 (C). Student's t-test comparing control and cofilin-decorated actin segments showed that the differences in peak heights and half helical pitches are statistically significant at p ≤ 0.00001. The mean of the half helical pitches of control actin filaments and paracrystals did not differ significantly. Models of control actin filaments and cofilin-decorated actin filaments with two different orientations on substrates are shown in Figure 1—figure supplement 1.
Figure 1—figure supplement 1
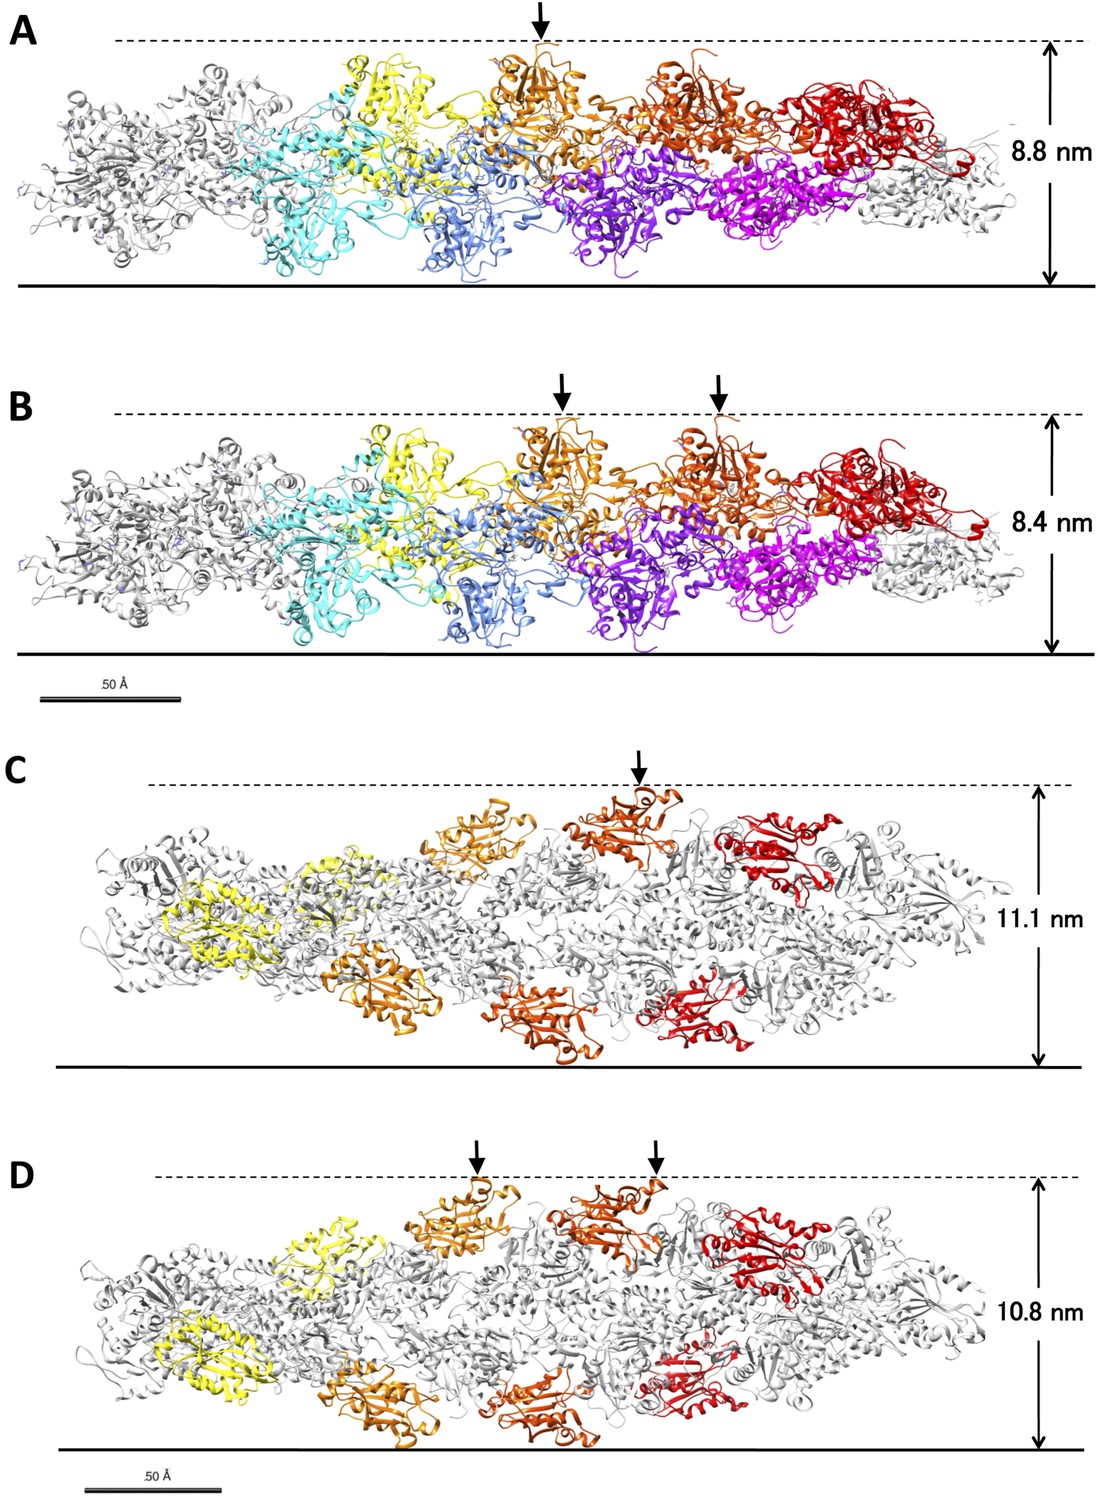
Models of control actin filaments and cofilin-decorated filaments on a flat substrate.
(A and B) show predicted peak heights of control actin filaments (PDB ID 3G37; Murakami et al. (2010)), and (C and D) show fully cofilin-decorated filaments (PDB ID 3J0S; Galkin et al. (2011)). These images were generated using Chimera software. When the true crossover point coincides with the position of an actin subunit (A) or a bound cofilin molecule (C), the position of the peak is equal to that of the crossover point, and its height is the tallest of the various possible orientations of the filament on the substrate. When the true crossover point is at the middle of two actin subunits (B) or two bound cofilin molecules (D), the peak height is the shortest of the possible orientations. In this latter case, the observed peak position is away from the true crossover point by as much as ∼2.5 nm. Depending on the orientation of the filament, therefore, the distance between the observed peak position and the true crossover point fluctuates between 0 and 2.5 nm. Random distribution of distances between the true crossover points and the highest points of the closest actin subunits would result in ±1.7 nm of error in the estimation of the positions of the true crossover points. If the peak positions at both ends of a half helix have this much error, the half helical pitch would have ±2.3 nm (±1.7 nm × √2) error. This is somewhat smaller than the ±3.0 nm standard deviation of the half helical pitches of actin filament paracrystals, and the difference should derive from small structural fluctuations in the paracrystals and/or measurement error from various other sources. In either case, it is safe to use the 3.0 nm standard deviation as the upper limit of the combined measurement errors and to estimate the lower limit of the structural fluctuations of control and cofilin-bound filaments.
Figure 2

Asymmetric structure of bare actin zones neighboring a cofilin cluster.
(A and B) HS-AFM image of a short cofilin cluster transiently associating with two S1 molecules (yellow arrowheads), which persisted for ∼1 s, enabling identification of the filament polarity (B). Measurements were made in F buffer containing 20 nM S1, 75 nM cofilin, 1 mM ADP, and 0.1 mM ATP. Bar: 25 nm; Z-scale: 0–12 nm. (C and D) Time-dependent changes in the heights of the indicated peaks (white arrowheads) and half helical pitches between the indicated peaks. (E and F) Histograms of the lengths of the half helical pitches of bare actin segments immediately neighboring cofilin clusters. Filaments were incubated in F buffer containing 1 mM ADP and 0.1 mM ATP for 5 min before observation (E) as in (A and B) or were incubated in F buffer containing 1 mM ADP for 30 min before observation (F). Pitches of the half helices of the first immediate neighbor on each side of cofilin clusters were measured. These values, together with those for the second neighbors, are summarized in Table 1.
Figure 3 with 4 supplements
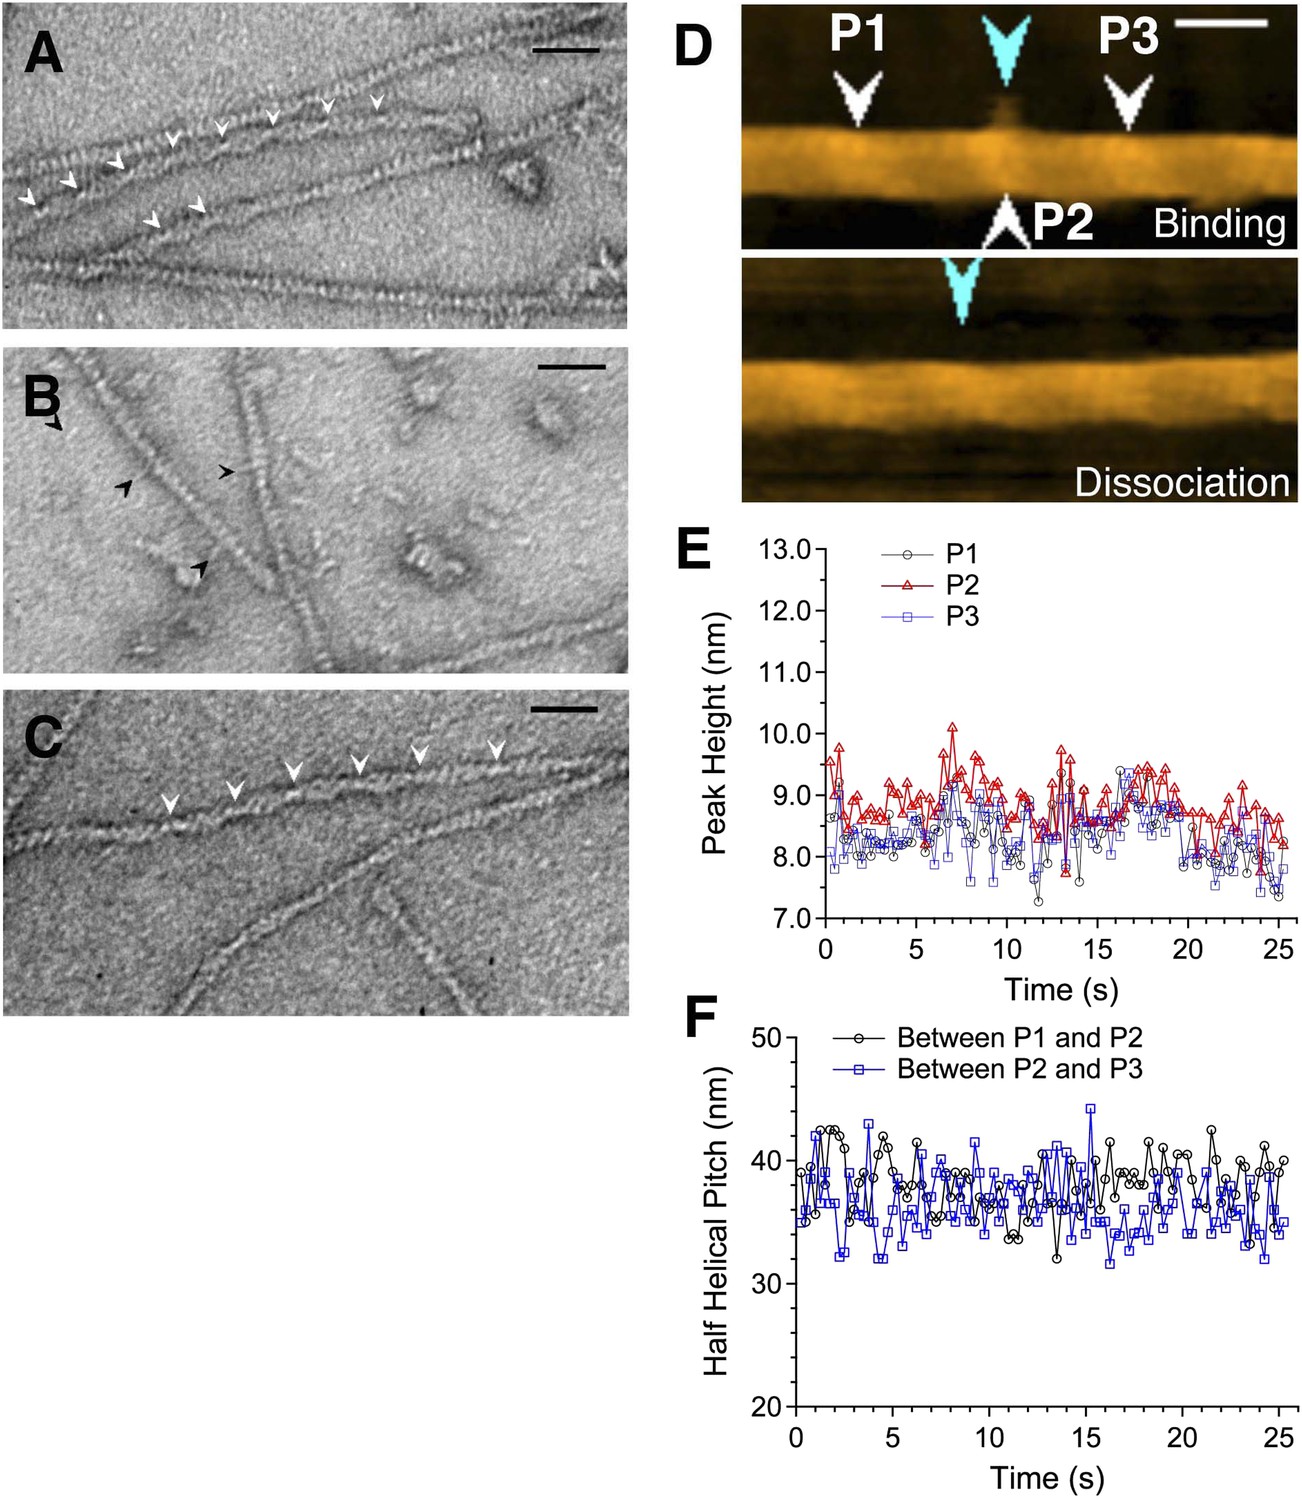
Actin filaments with bound cofilin or cofilin-rod fusion protein.
(A–C) are electron micrographs of negatively stained samples, and (D) is a HS-AFM image of a sample similar to that shown in (B). (A) Actin filaments bound with cofilin-rod. Arrowheads show crossover points in clusters of cofilin-rod. The rod portions of the fusion proteins are not readily visible, which may be due to alignment of the rods along the cofilin clusters. Severing activity and stoichiometric binding of cofilin-rod to actin filaments were confirmed by HS-AFM (Video 1) and co-sedimentation assays (Figure 3—figure supplement 3), respectively. (B) Cofilin-rod molecules sparsely bound to actin filaments, identified by the rod-like structures (black arrowheads). (C) Actin filaments with bound cofilin molecules (without rod fusion). Arrowheads show crossover points in clusters. Actin filaments and cofilin or cofilin-rod were mixed at a 2:1 (A and C) or 1:1 (B) molar ratio in F buffer containing 1 mM ATP. Bars: 25 nm. (D) HS-AFM image of an actin filament and an apparently singly bound cofilin-rod molecule (blue arrowhead in the upper image) near P2 (white arrowhead). Conditions: F buffer containing 1 mM ATP and 75 nM cofilin-rod (without His-tag). Bar: 25 nm. See Video 2. (E) shows heights of the three peaks and (F) shows spacing between them.
Figure 3—figure supplement 1
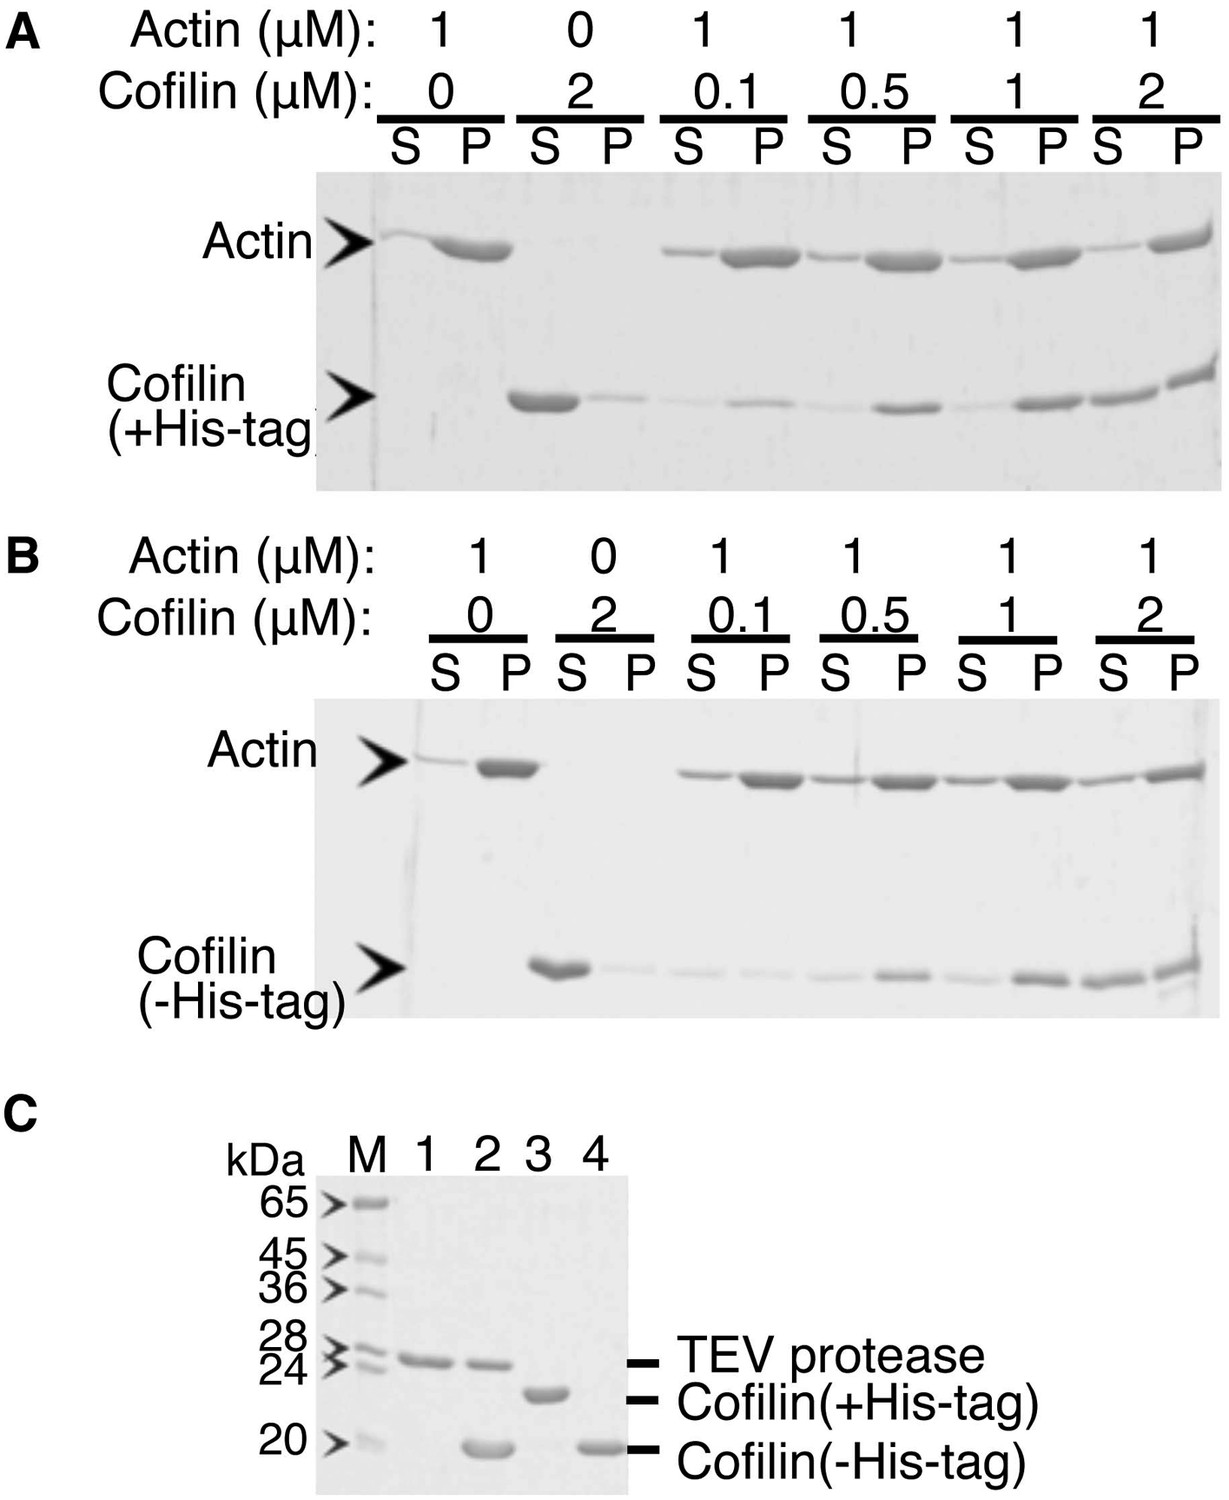
Co-sedimentation of cofilin (with or without His-tag) with actin filaments.
(A and B) are SDS-PAGE of supernatant and pellet fractions after ultracentrifugation of mixtures of various concentrations of cofilin with (A) or without (B) His-tag and 1 µM actin filaments, respectively. Acrylamide concentration of the gel was 12%. His-tag was removed by incubation with 1/4 (wt/wt) of His-tagged TEV protease overnight at 5°C and then passed through a Ni-column in the presence of 10 mM imidazole. Lanes 1 to 4 in (C) show His-TEV protease, mixture of His-cofilin and His-TEV after reaction over night, His-cofilin, and the reaction mixture that flowed through a Ni-NTA column (i.e., cofilin without His-tag). Co-sedimentation experiments were performed as follows. Frozen aliquots of cofilin (±His-tag) and rabbit skeletal actin were thawed on ice for 1 hr and were then clarified by ultracentrifugation at 80,000 rpm for 5 min at 5°C. The supernatant was collected, and protein concentrations were measured using Advanced Protein Assay reagent (Cytoskeleton). Actin filaments were prepared by polymerization of G-actin (20 µM) in F buffer containing 1 mM ATP on ice for 30 min. The filaments formed were diluted to 1 µM and gently mixed with the cofilin (±His-tag) of various concentrations (i.e., 0.1, 0.5, 1, and 2 µM) in F buffer containing 1 mM ATP. These protein mixtures were further incubated for 3–5 min at room temperature, followed by ultracentrifugation at 80,000 rpm for 5 min at 25°C. Supernatant and pellet fractions were separately run on a SDS-polyacrylamide gel and stained with Coomassie Blue. Control experiments were performed in the same manner using either 1 µM actin filament only or 2 µM cofilin or its derivative only.
Figure 3—figure supplement 2
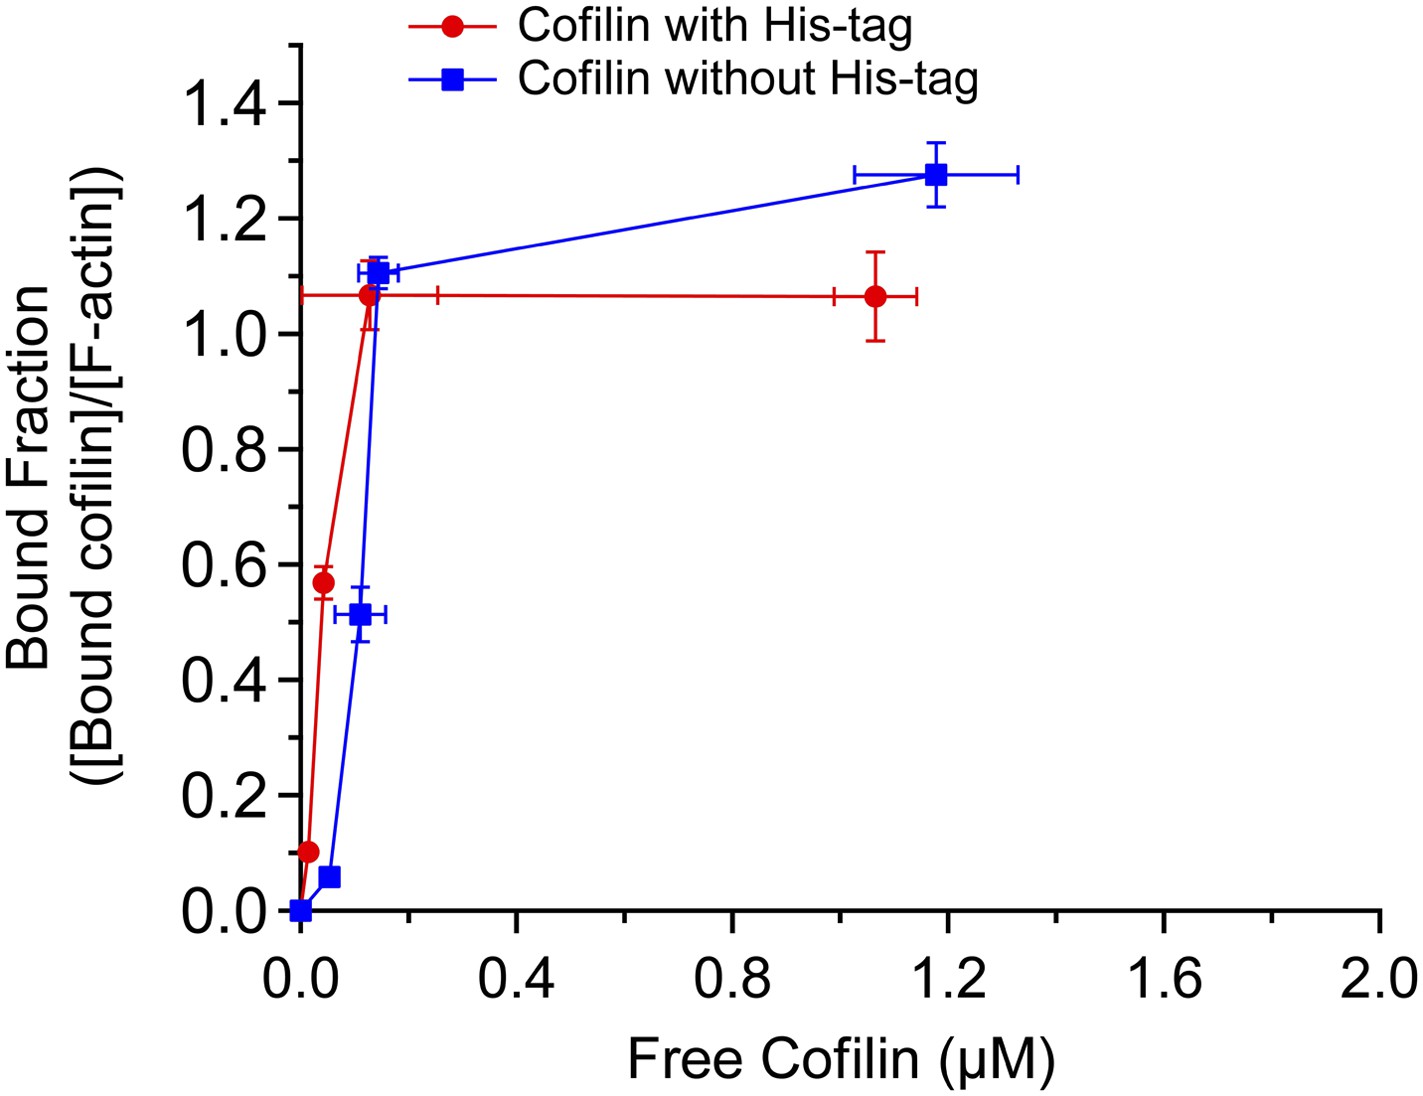
Actin binding curves of cofilin and cofilin without His tag.
Band intensities of gels shown in Figure 3—figure supplement 1 were quantified, and fractions of actin-bound with cofilin ([cofilin]ppt/[actin]ppt) were shown as a function of free cofilin concentration ([cofilin]sup). Mean ± SD are shown (N = 3).
Figure 3—figure supplement 3
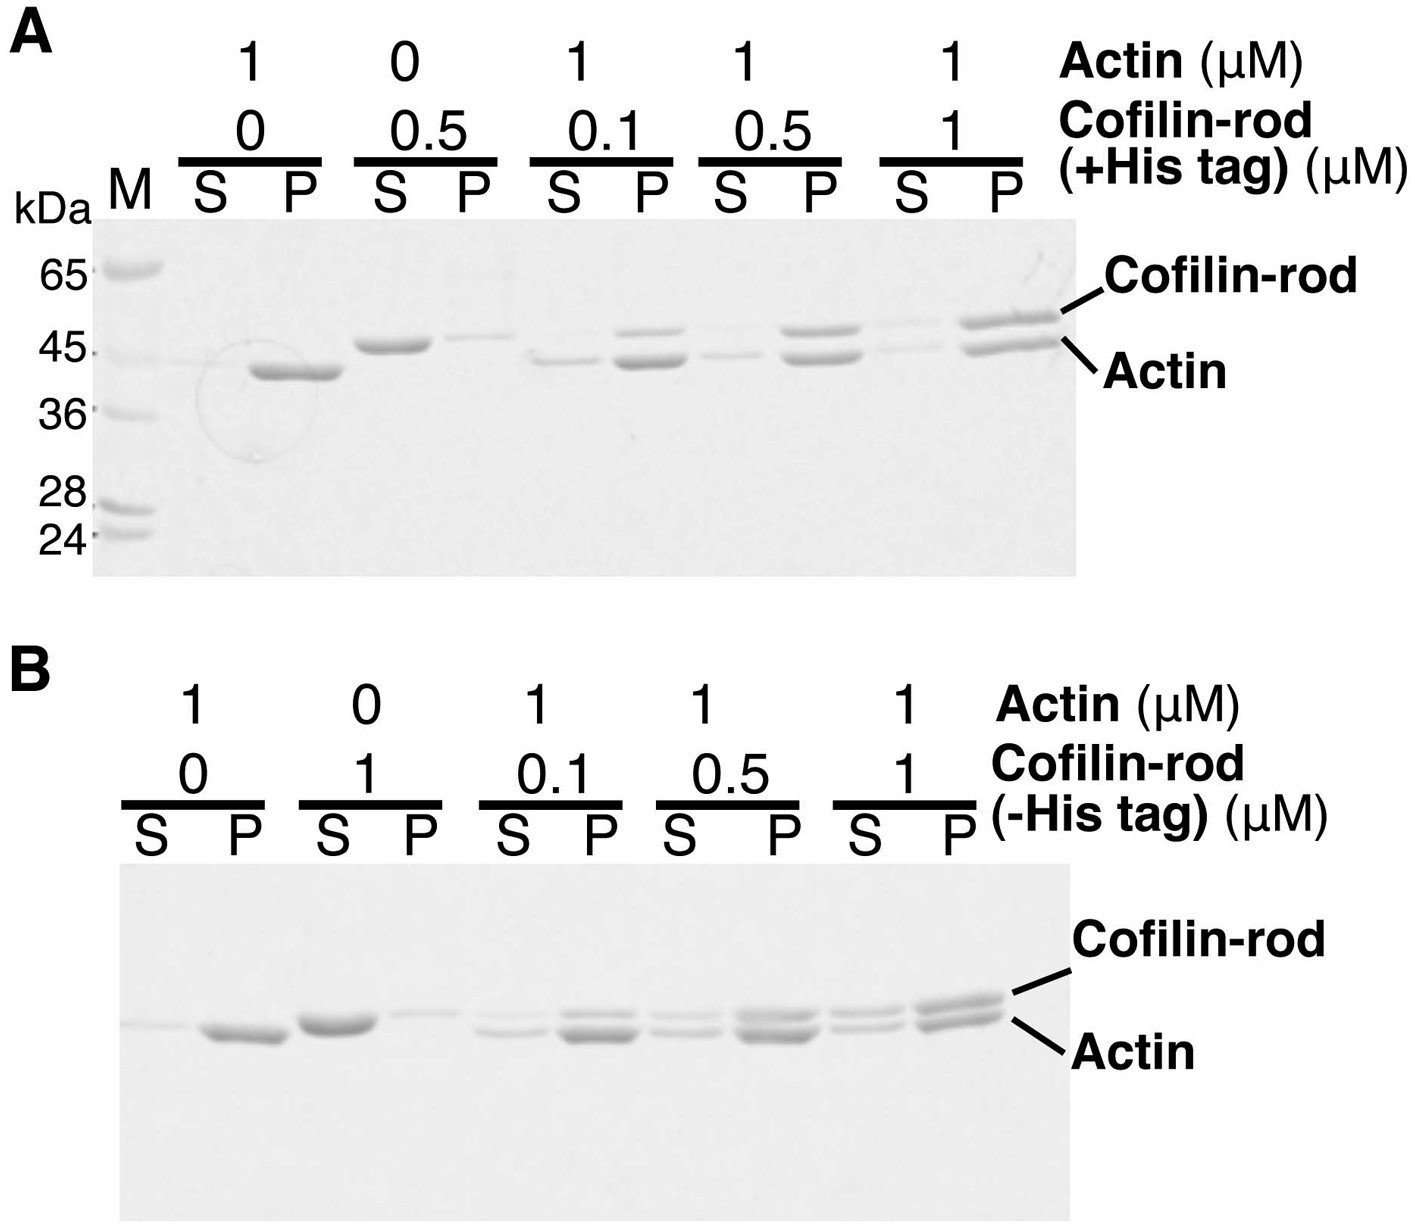
Co-sedimentation of cofilin-rod with (+) and without (−) His-tag.
(A and B) SDS-PAGE analysis of binding of cofilin-rod with and without His-tag to actin filaments, respectively. Experiments were carried out in F buffer containing 1 mM ATP, and protein concentrations used are shown above each gel. Cleavage of His-tag by TEV protease was performed as described in the legend to Figure 3—figure supplement 1. Acrylamide concentration of the gel was 10%.
Figure 3—figure supplement 4
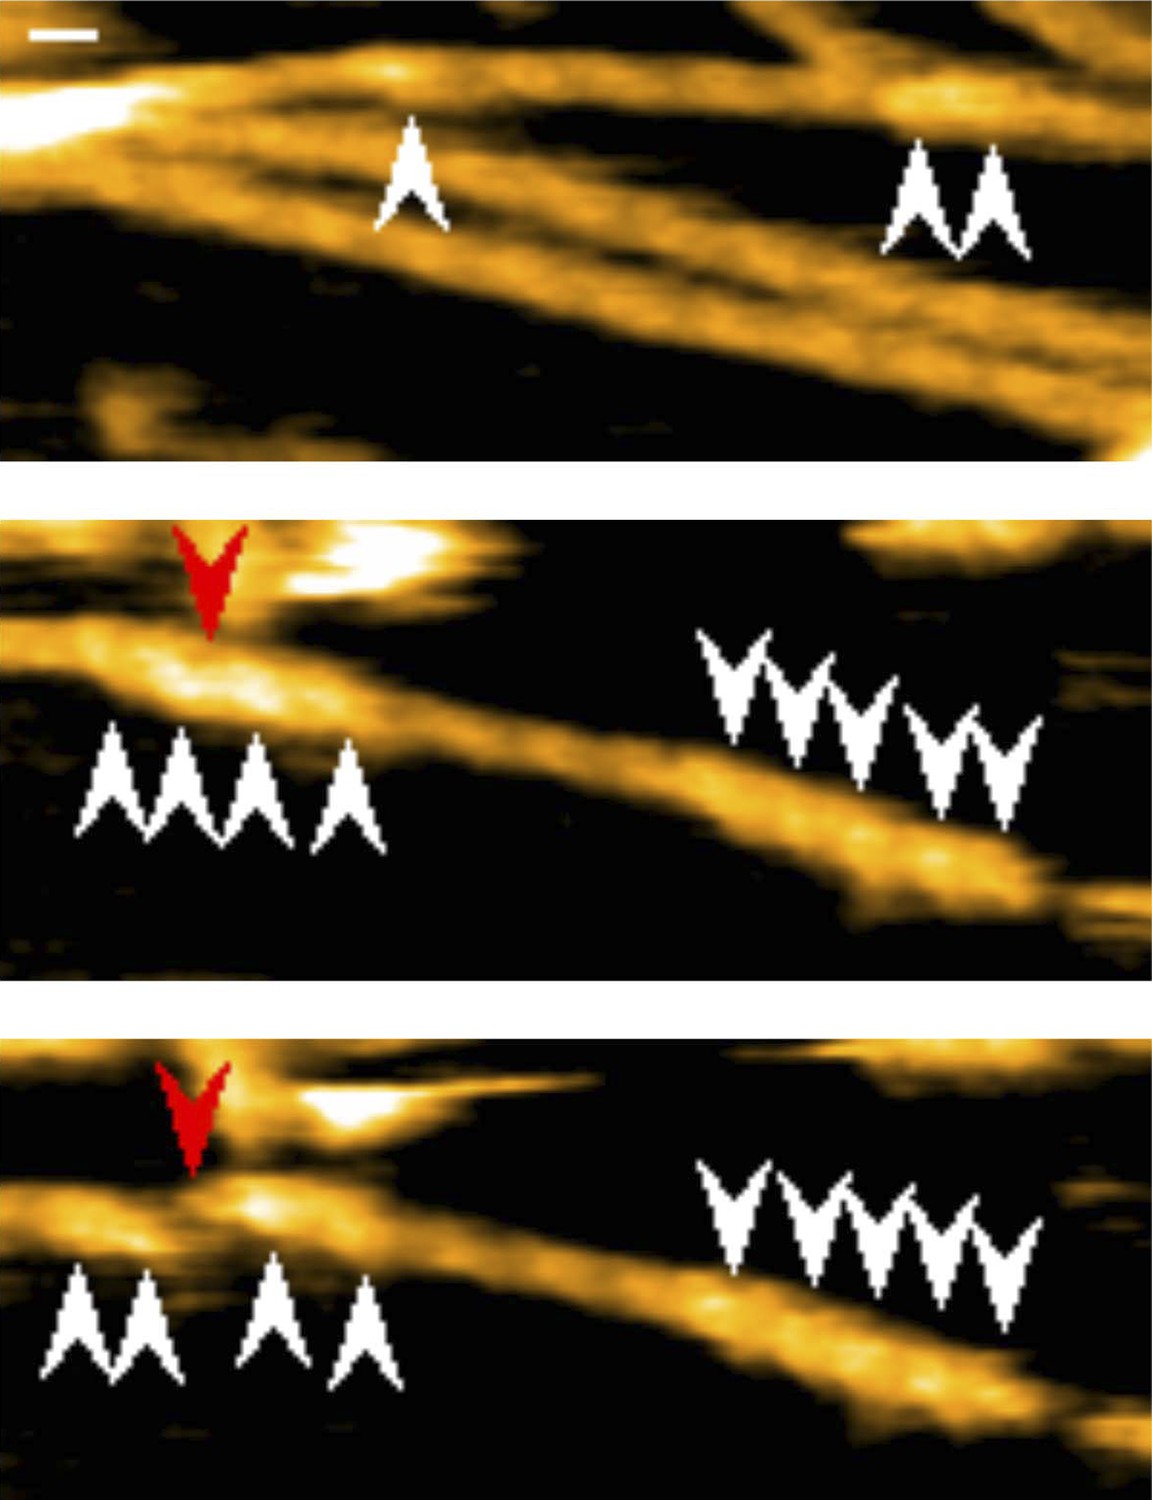
Representative still images from Video 1, demonstrating cluster formation and severing function of cofilin-rod without His-tag.
Red arrowheads: severing points in end half helices in cofilin clusters; white arrowheads: cofilin-rod clusters. Z-scale: 0–12 nm. Scale bar: 25 nm.
Figure 4
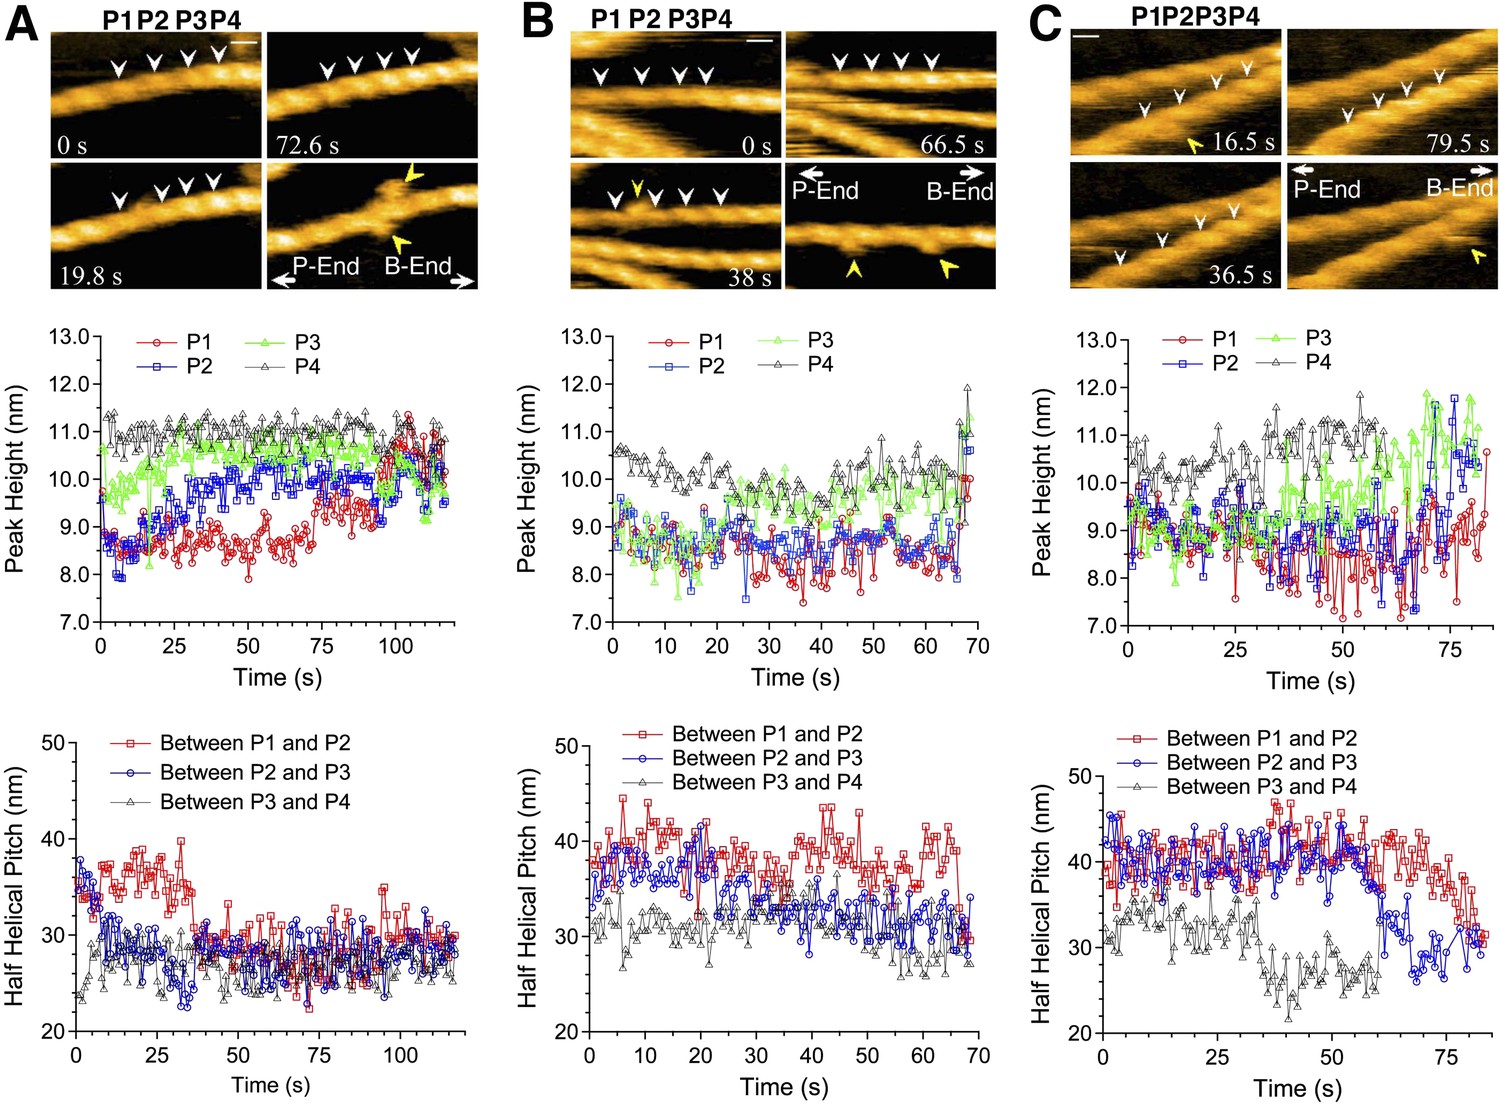
Growth of cofilin clusters along actin filaments.
Growth of cofilin clusters along actin filaments in F buffer containing 1 mM ADP and 0.1 mM ATP (A), along actin filaments carrying ADP, prepared by incubating filaments in F buffer containing 1 mM ADP, hexokinase, and glucose at room temperature for 30 min (B), and along actin filaments carrying ADP and Pi, prepared by incubating filaments in 1 mM ADP and 10 mM Pi for 10 min at room temperature (C). The concentrations of cofilin were 75 nM (A and B) or 900 nM (C) and those of S1 were 20 nM (A and B) or 150 nM (C). Each panel consists of four sequential snapshots (top), a figure showing the heights of the indicated peaks (middle), and the half helical pitches between the indicated peaks (bottom). Yellow arrowheads show the transient association of S1. Note that P1 in (A) and P3 in (B) rose in two substeps. Bars: 25 nm; Z-scale: 0–12 nm.
Figure 5
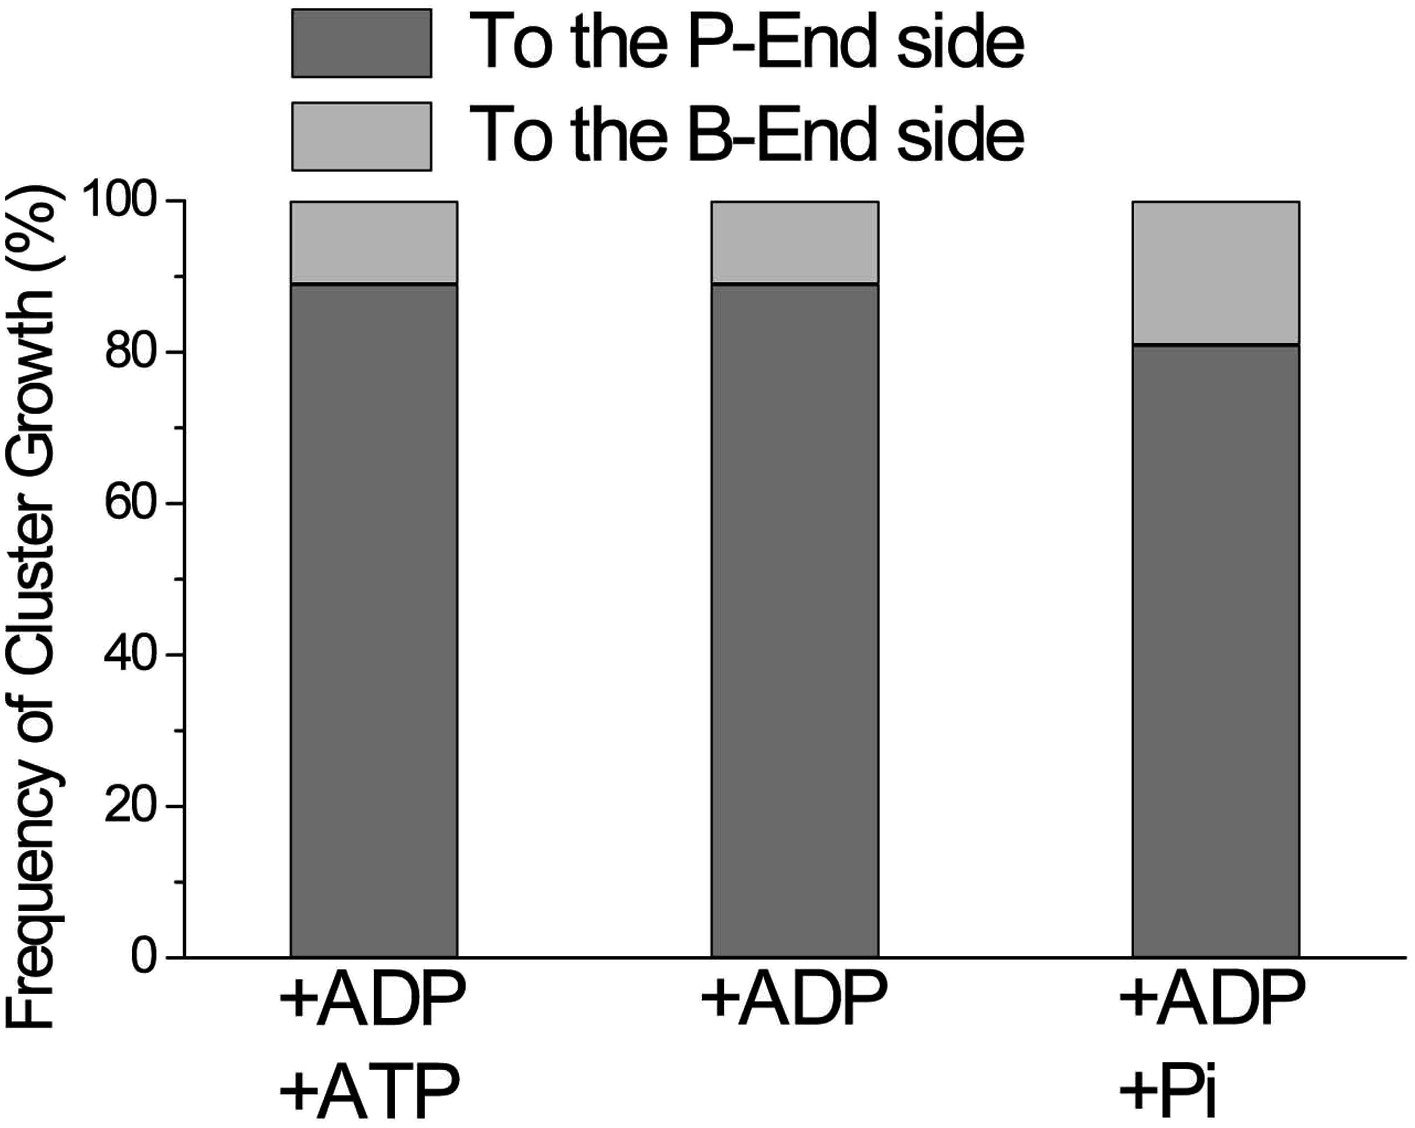
Directional preference of the growth of cofilin clusters.
The growth of cofilin clusters was observed under three buffer conditions: in the presence of 1 mM ADP and 0.1 mM ATP (+ADP +ATP); 1 mM ADP (+ADP) and 1 mM ADP and 10 mM Pi (+ADP +Pi), as in Figure 4. Growth of a cluster by one-half helix was counted as one growth event. The total number of observed growth events was 37, 46, and 188 for each condition. We speculate that at least some of the cluster growth events in the barbed-end direction were actually growth in the preferred direction from invisibly small clusters on the barbed side of a visible cluster.
Figure 6 with 4 supplements
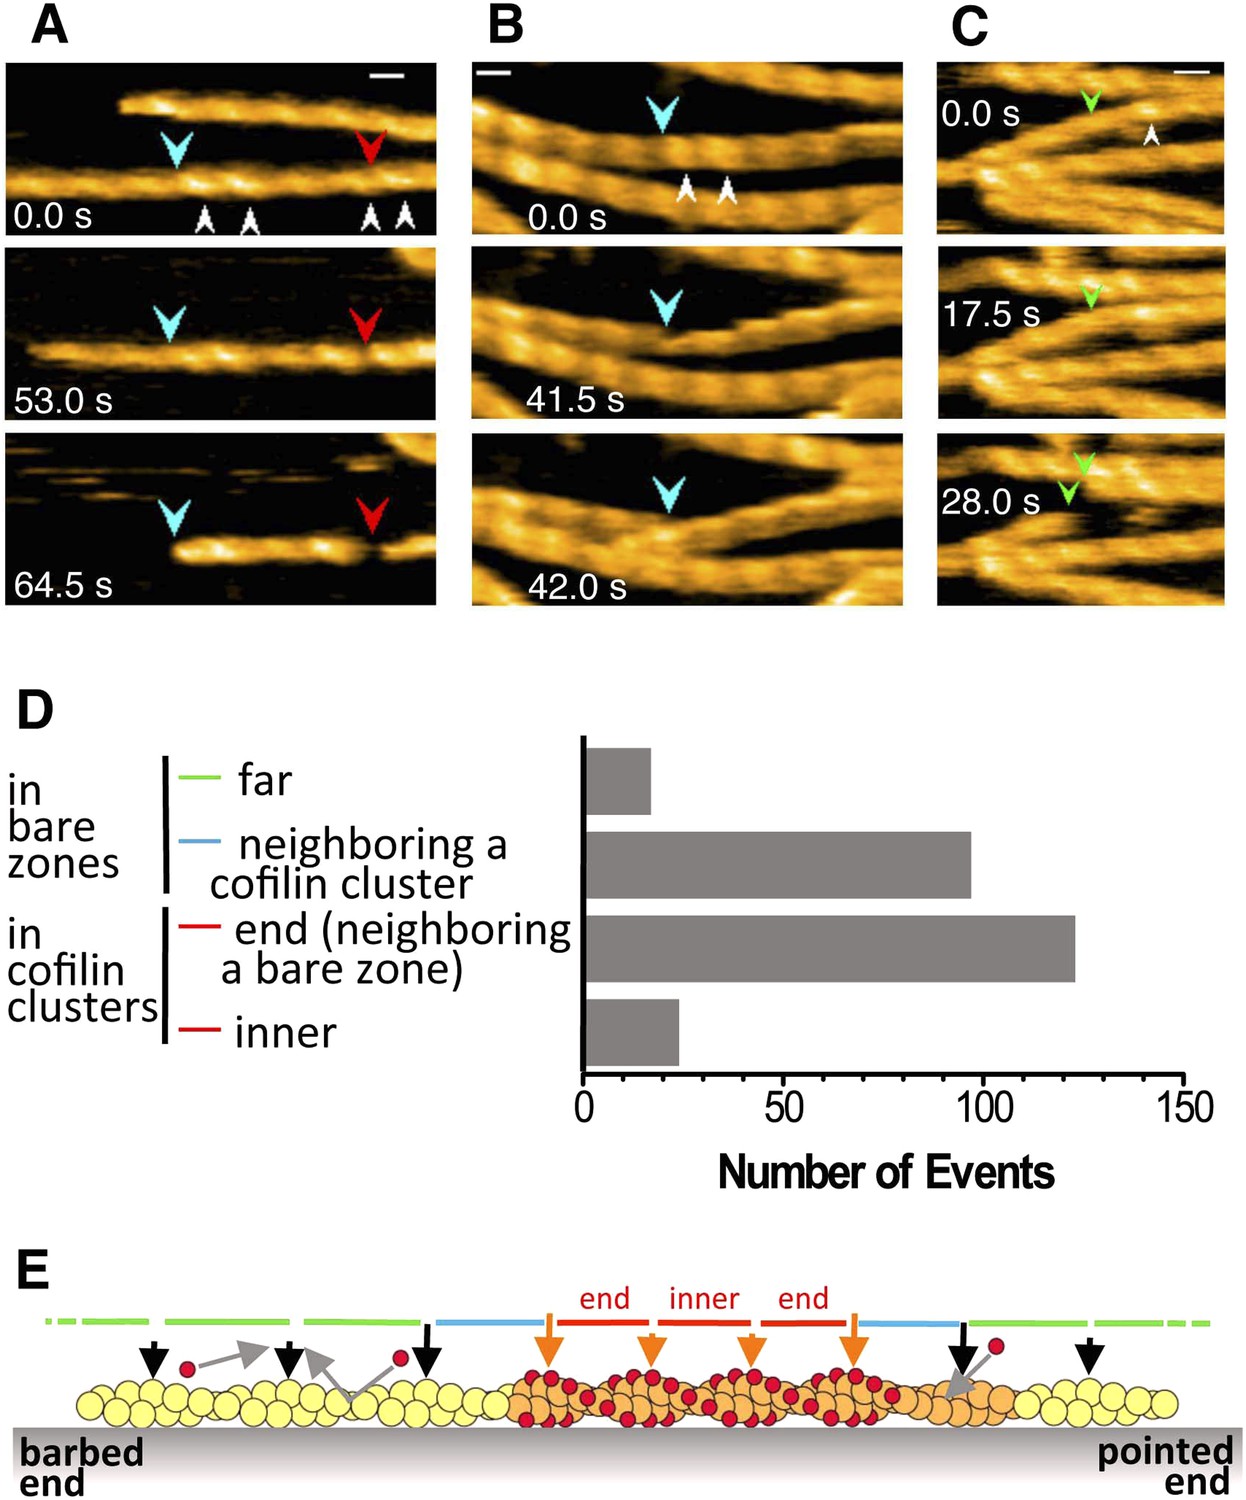
Severing of actin filaments near cofilin clusters.
(A–C) Typical cases of filament severing (red arrowheads) within or near cofilin clusters (white arrowheads). The observation buffers were F-buffer containing 1 mM ADP (A and C) and 1 mM ATP (B). Concentration of cofilin was 40 nM (A and C) and 75 nM. The first break in (A) was inside a cluster, while the second was at or near the junction between a bare zone and a cluster. Red, blue, and green arrowheads show severing points within cofilin clusters, in bare zone close to cofilin clusters, and in bare zones more than half a helix away from a cofilin cluster, while white arrowheads show cofilin clusters. Bars: 25 nm; Z-scale: 0–12 nm. See Videos 6–8. (D) Classification of severing sites into four categories: (1) in ‘far’ bare zone (between a tall and a short black arrow or between two short black arrows, indicated by green bars in (E)); (2) in bare zone half helices immediately neighboring a cofilin cluster (between a tall black and a tall orange arrow, indicated by blue bars in (E)); (3) in ‘end’ cofilin cluster half helices immediately neighboring bare zones (between a tall and a short orange arrow, indicated by red bars in (E)); and (4) in ‘inner’ cofilin cluster half helices (between two short orange arrows, indicated by a red bar in (E)). Comparison of the last two categories demonstrates that severing within cofilin clusters occurs preferentially near the ends. Note, however, that this comparison does not necessarily show a quantitative difference in the susceptibility to severing between end and inner half helices, since the number of end and inner helices examined are not the same. (E) A schematic summary of the proposed distributions of bound cofilin molecules (red spheres), segments of normal (yellow) and shortened (orange) helical pitch, and normal (black arrows) and tall (orange arrows) crossover points. Free cofilin molecules tend to bind to the supertwisted bare zone on the pointed-end side of the cluster (gray arrows), driving the growth of the cluster in the pointed-end direction. This is most certainly an oversimplification, ignoring a number of complex issues, some of which are discussed in the main text.
Figure 6—figure supplement 1

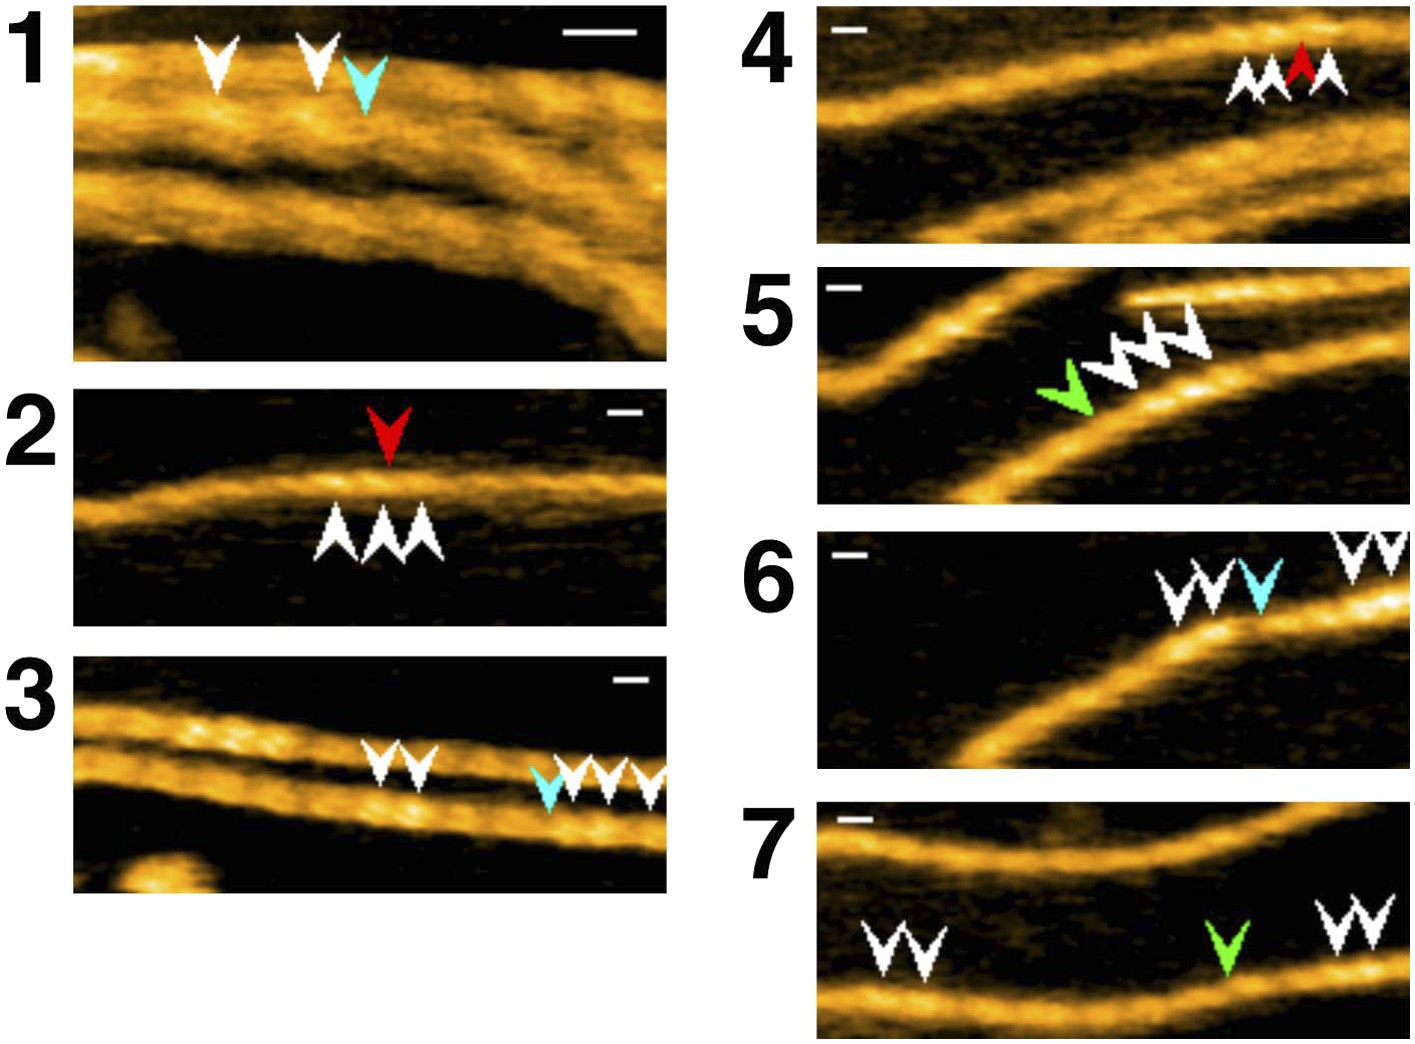
Representative still images from Video 9, demonstrating severing of actin filaments by cofilin with His-tag.
Red, blue, and green arrowheads indicate severing in half helices in cofilin clusters, in a bare half helix immediately neighboring a cofilin cluster, and in bare zones more than half a helix away from cofilin clusters, respectively. White arrowheads: cofilin clusters. Numbers (1–10) refer to the sequence number in the video. Z-scale: 0–12 nm. Scale bar: 25 nm.
Figure 6—figure supplement 2
Representative still images from Video 10, showing severing of actin filaments by cofilin without His-tag.
Red, blue, and green arrowheads indicate severing in half helices in cofilin clusters, in a bare half helix immediately neighboring a cofilin cluster, and in bare zones more than half a helix away from cofilin clusters, respectively. White arrowheads: cofilin clusters. Numbers (1–7) refer to the sequence number in the video. Z-scale: 0–12 nm. Scale bar: 25 nm.
Figure 6—figure supplement 3
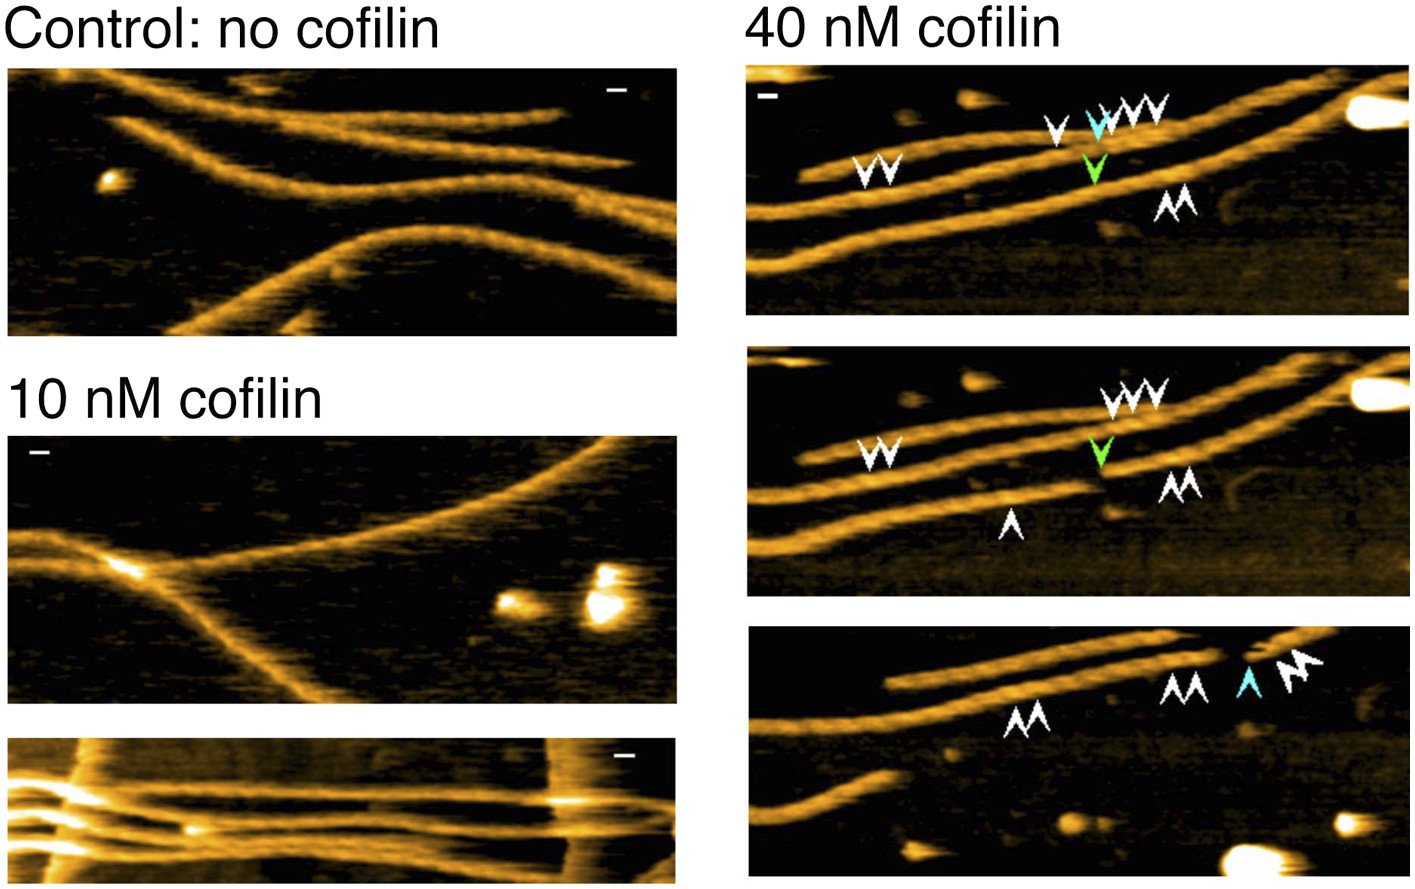
Representative still images from Video 11, showing severing of actin filaments in the presence and absence of low concentration of cofilin.
Blue arrowheads: severing in a bare half helix immediately neighboring a cofilin cluster; green arrowheads: severing in bare zones more than half a helix away from cofilin clusters; white arrowheads: cofilin clusters. Z-scale: 0–12 nm. Scale bar: 25 nm.
Figure 6—figure supplement 4
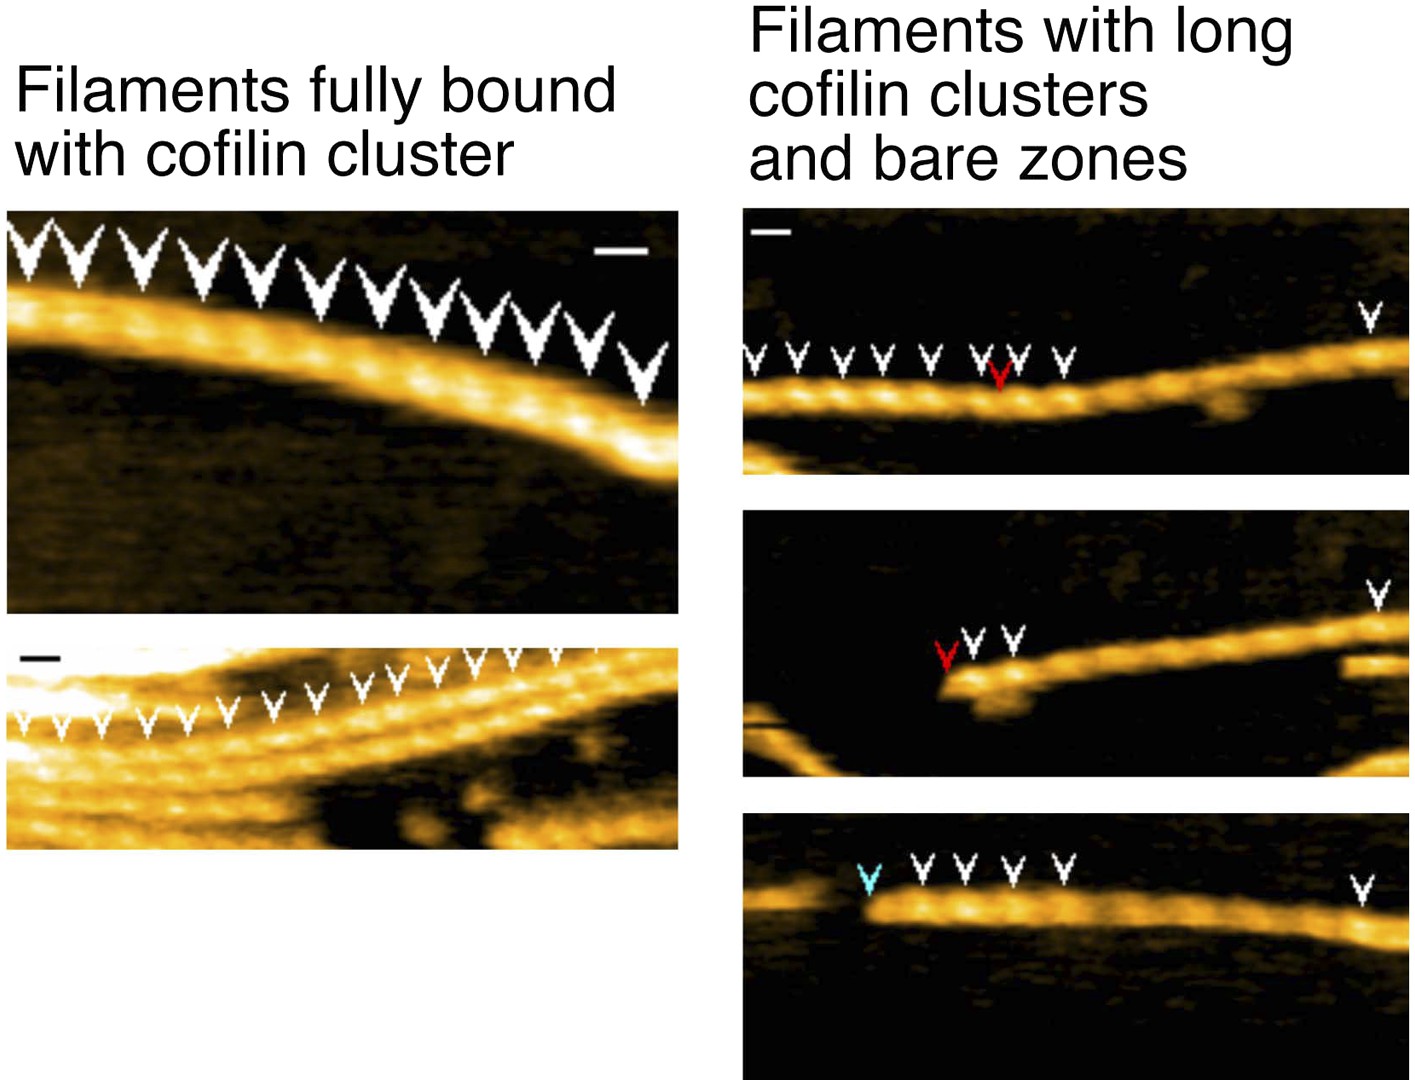
Representative still images from Video 12, showing severing in actin filaments decorated with high concentrations of cofilin.
Red arrowheads: severing in half helices in cofilin clusters; blue arrowheads: severing in a bare half helix immediately neighboring a cofilin cluster; white arrowheads: cofilin clusters. Z-scale: 0–12 nm. Scale bar: 25 nm.
Videos
Video 1
Cluster formation and severing functions of cofilin-rod.
Conditions: F buffer containing 1 mM ATP, and 300 nM cofilin-rod without His-tag, imaging rate: 2 frames/s, and playing rate: 5 frames/s. White arrowheads indicate clusters of cofilin-rod, and red and blue arrowheads show severing points inside a cluster and in a bare half helix immediately neighboring a cluster, respectively. Z-scale was 0–12 nm. Related to Figure 3—figure supplement 4.
Video 2
Sparse binding of individual cofilin-rod molecules to actin filaments.
Conditions: F buffer containing 1 mM ATP and 75 nM cofilin-rod without His-tag, imaging rate: 4 frames/s, and playing rate: 5 frames/s. Transient binding of cofilin-rod to and dissociation from an actin filament was followed for approximately 90.5 s, shown by the presence and absence of a blue arrowhead. No severing was observed in all four similar cases of successful imaging of sparse binding of cofilin-rod to actin filaments. Z-scale was 0–12 nm. Related to Figure 3D.
Video 3
Growth of a cofilin cluster toward the pointed end of a filament in F buffer containing 1 mM ADP, 0.1 mM ATP, 20 nM S1, and 75 nM cofilin.
Imaged at 2 frames/s and played at 5 frames/s. White arrowheads show growth of the cofilin cluster, and yellow and magenta arrowheads show binding of S1. Magenta arrowheads indicate S1 molecules whose binding angle could not be determined, either for geometric reasons (i.e., binding on the upper face of the filament) or because the binding was too short-lived. Z-scale was 0–12 nm. For magnifications and polarity of the analyzed filaments, refer to Figure 4 in the main text. Related to Figure 4A.
Video 4
Growth of a cofilin cluster toward the pointed end of a filament in F buffer containing 1 mM ADP, 20 nM S1, and 75 nM cofilin.
Imaged at 2 frames/s and played at 5 frames/s. For color codes of arrowheads, see the legend to Video 3. Z-scale was 0–12 nm. For magnifications and polarity of the analyzed filaments, refer to Figure 4 in the main text. Related to Figure 4B.
Video 5
Growth of a cofilin cluster toward the pointed end of a filament in F buffer containing 1 mM ADP, 10 mM Pi, 150 nM S1, and 900 nM cofilin (without His-tag).
For color codes of arrowheads, see the legend to Video 3. For magnifications and polarity of the analyzed filaments, refer to Figure 4 in the main text. Under this condition, binding of S1 was so short-lived that the tilted binding was not obvious in some cases (magenta). The S1 molecule indicated by a double magenta arrowhead appears to tilt in the direction opposite to other S1 molecules indicated by yellow arrowhead, and we speculate that this is because this S1 molecule was not stably bound to the filament when imaged. Imaged at 2 frames/s and played at 3 frames/s. Z-scale was 0–12 nm. Related to Figure 4C.
Video 6
Severing of actin filaments in a cofilin cluster.
Conditions: F buffer containing 1 mM ADP and 40 nM cofilin. Severing of actin filaments occurred within a cofilin cluster (at 53 s) and then at or near the boundary between a bare zone and another cofilin cluster (at 64.5 s). Imaged at 2 frames/s and played at 5 frames/s. Red, blue, and green arrowheads indicate severing in half helices in cofilin clusters, in a bare half helix immediately neighboring a cofilin cluster, and in bare zones more than half a helix away from cofilin clusters, respectively. White arrowheads: cofilin clusters. Z-scale was 0–12 nm. Related to Figure 6A.
Video 7
Severing of actin filaments at or near a boundary between a bare zone and a cofilin cluster.
Conditions: F buffer containing 1 mM ATP and 75 nM cofilin. Severing occurred at 42 s. Imaged at 2 frames/s and played at 5 frames/s. For color codes of the arrowheads, see the legend to Video 6. Z-scale was 0–12 nm. Related to Figure 6B.
Video 8
Severing of actin filaments in a bare zone more than one half helix away from a cofilin cluster.
Conditions: F buffer containing 1 mM ADP and 40 nM cofilin. Severing occurred at 28 s. Imaged at 2 frames/s and played at 5 frames/s. For color codes of the arrowheads, see the legend to Video 6. Z-scale was 0–12 nm. Related to Figure 6C.
Video 9
Severing of actin filaments by cofilin.
To show more general view of severing events, in addition to the small number of representative cases shown in Videos 6–8, 10 different image sequences from different experiments were merged. Sequence numbers are shown in the first 10 frames of each sequence. For color codes of the arrowheads, see the legend to Video 6. Conditions: F buffer containing 1 mM ATP (sequences 1–6), 1 mM ADP (sequence 7–8) or 1 mM ATP + 10 mM Pi (sequence 9–10). The concentration of cofilin shown in this video was 75 nM, except in sequences 9 and 10, in which it was 300 and 150 nM, respectively. Z-scale was 0–12 nm. Related to Figure 6—figure supplement 1.
Video 10
Severing of actin filaments by cofilin without His-tag.
In this video, seven different image sequences from different filaments and experiments were merged. Conditions: F buffer containing 1 mM ATP and 75 nM cofilin, except in sequence 3 in which cofilin concentration was 150 nM. For color codes of the arrowheads, see the legend to Video 6. Z-scale was 0–12 nm. Related to Figure 6—figure supplement 2.
Video 11
Severing of actin filaments in the absence or presence of low concentrations of cofilin.
Four independent image sequences are merged. Conditions: F buffer containing 1 mM ATP and 0, 10 or 40 nM cofilin without His-tag. In this video, three data sets which represent three cases of the absence or presence of cofilin are sequentially shown and indicated before each sequence begins as (i) Control: Without Cofilin, (ii) 10 nM Cofilin (two different image sequences), and (iii) 40 nM Cofilin. Note that severing of actin filaments was not observed not only in the absence but also in the presence of 10 nM cofilin. In the presence of 40 nM cofilin, severing was infrequently observed. For color codes of the arrowheads, see the legend to Video 6. Images were taken at 0.5 frames/s, except in the presence of 40 nM cofilin they were recorded at 0.25 frames/s, and the video is played at 5 frames/s. Z-scale was 0–12 nm. Related to Figure 6—figure supplement 3.
Video 12
Actin filaments decorated with high concentrations of cofilin.
The first three quarter of this video were taken in F buffer containing 1 mM ATP and 1 µM cofilin, and the last one quarter was taken in the presence of 650 nM cofilin. In the presence of 1 µM cofilin, filaments were fully decorated along the length, and no severing was observed. In the presence of 650 nM cofilin, there were some bare zones, and severing occurred near the boundary of the bare zone and the cofilin clusters, regardless of the size of cofilin clusters. For color codes of the arrowheads, see the legend to Video 6. Images were taken at 2 frames/s and played at 5 frames/s. Z-scale was 0–12 nm. Related to Figure 6—figure supplement 4.
Tables
Table 1
Peak heights and lengths of half helical pitches in bare actin segments neighboring cofilin clusters
| 1 mM ADP + 0.1 mM ATP | 1 mM ADP | |||
|---|---|---|---|---|
| Peak height (nm) | Half helix (nm) | Peak height (nm) | Half helix (nm) | |
| First neighbor on the P-end side | 9.2 ± 1.0 | 28.8 ± 4.5 | 8.9 ± 1.0 | 28.7 ± 4.7 |
| Second neighbor on the P-end side | 9.1 ± 1.0 | 36.5 ± 4.1 | 8.8 ± 1.1 | 36.9 ± 4.9 |
| First neighbor on the B-end side | 9.0 ± 0.9 | 37.3 ± 4.6 | 8.7 ± 0.9 | 38.4 ± 4.3 |
| Second neighbor on the B-end side | 9.2 ± 0.6 | 35.4 ± 3.9 | 8.7 ± 0.8 | 36.7 ± 4.2 |
-
Actin filaments were incubated in F buffer containing 1 mM ADP and 0.1 mM ATP for 5 min or in F buffer containing 1 mM ADP for 30 min prior to the addition of cofilin. Filaments under the latter condition were shorter than those under the former condition and were apparently in the process of spontaneous depolymerization.
-
Each mean and SD were calculated from 423 to 446 data.
Additional files
-
Source code 1
The Kodec4.4.7.39 for HS-AFM image viewing and analysis software is coded in Visual C# (Visual Studio 2010, Microsoft, USA).
- https://doi.org/10.7554/eLife.04806.031
Download links
A two-part list of links to download the article, or parts of the article, in various formats.
Downloads (link to download the article as PDF)
Open citations (links to open the citations from this article in various online reference manager services)
Cite this article (links to download the citations from this article in formats compatible with various reference manager tools)
Cofilin-induced unidirectional cooperative conformational changes in actin filaments revealed by high-speed atomic force microscopy
eLife 4:e04806.
https://doi.org/10.7554/eLife.04806


