DNA damage shifts circadian clock time via Hausp-dependent Cry1 stabilization
- Scripps Research Institute, United States
Figures
Figure 1 with 2 supplements
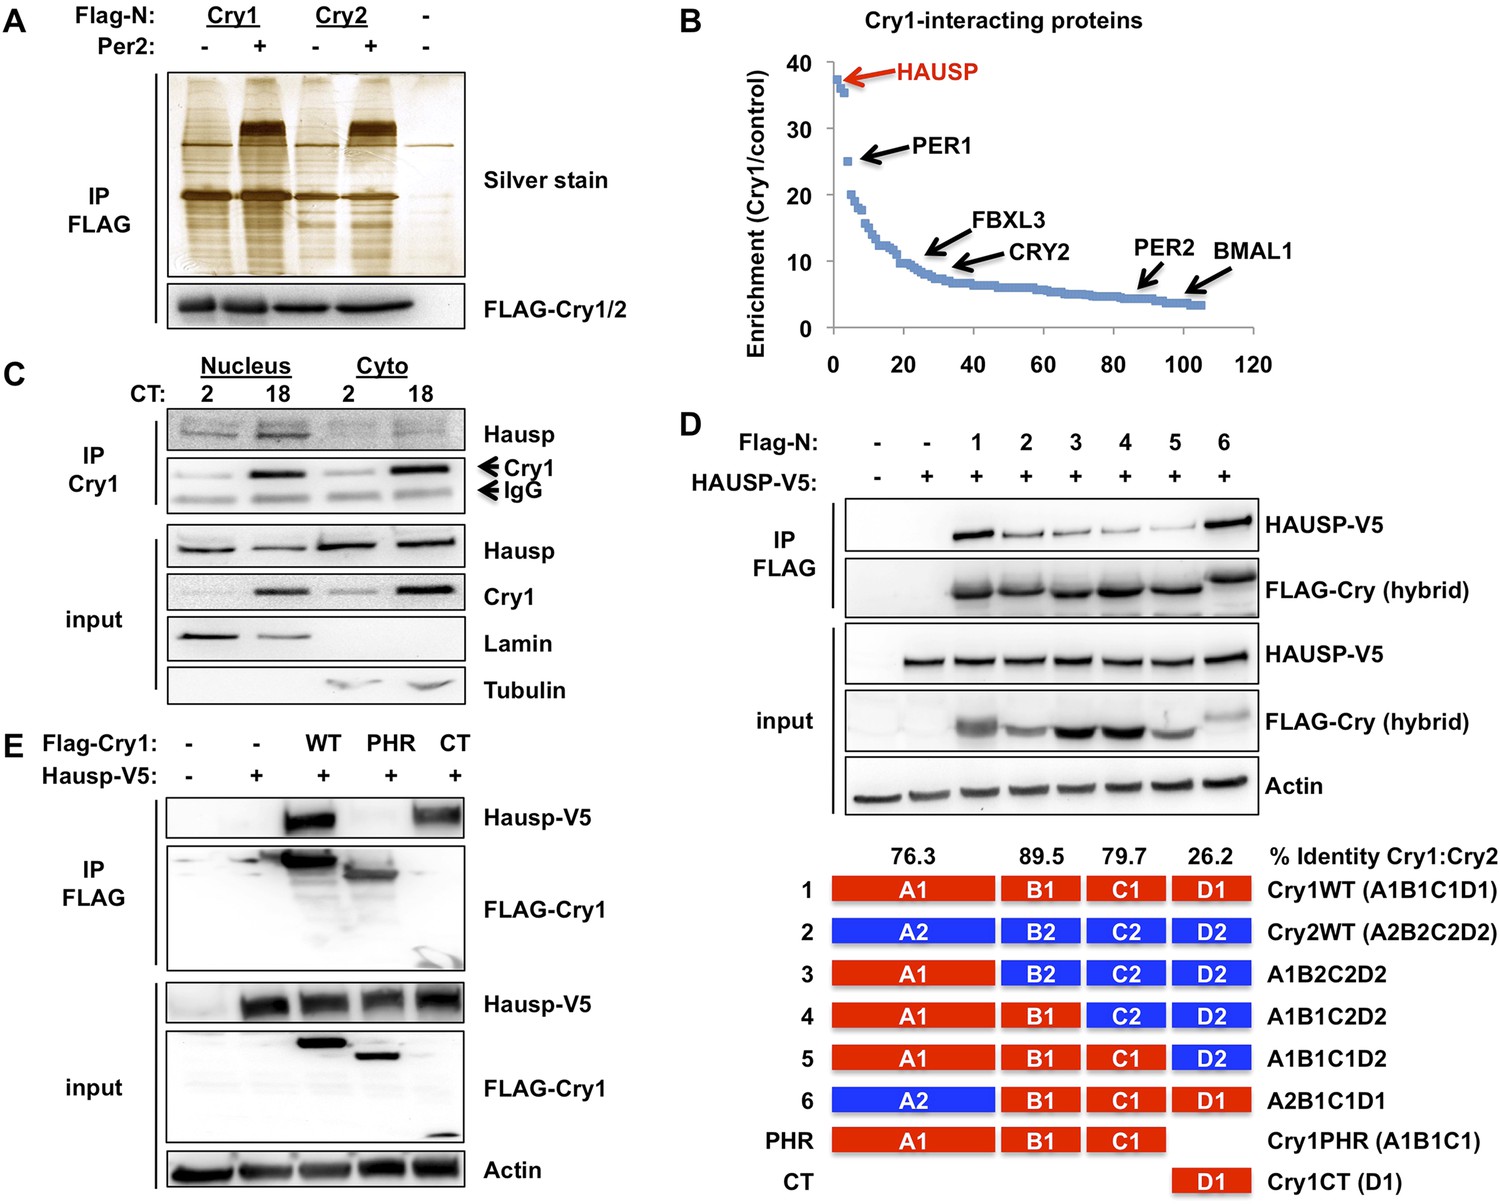
Hausp interacts with Cry1.
(A and B) Lysates from 293T cells expressing pcDNA3-2xFLAG with no insert (−), Cry1, or Cry2 after the FLAG tag with (+) or without (−) co-expression of Per2 were used to purify control, Cry1, or Cry2-containing complexes by immunoprecipitation (IP) of the FLAG tag. 5% of each purification was analyzed by SDS-PAGE and silver stain (A) and components of the resulting complexes were identified by mass spectrometry performed on the remaining 95% of the sample. The experiment was performed in triplicate and Pattern Lab for Proteomics (Carvalho et al., 2012) was used to identify statistically enriched partners. In (B) Enrichment is the ratio of spectral counts in Cry1 vs control samples for all statistically enriched partners over three experiments (e.g., lane 1 vs lane 5 from [A]). Arrows depict several established partners for Cry1 as well as the observed 37-fold enrichment for Hausp in Cry1-containing samples. (C) Endogenous Hausp bound to endogenous Cry1 was detected by immunoblot (IB) following IP from nuclear and cytoplasmic fractions of mouse embryonic fibroblasts (MEFs) harvested at the indicated times (CT, hours) following circadian synchronization by dexamethasone. (D) Top: Hausp-V5 bound to FLAG-Cry1/2 hybrids was detected by IB following IP from 293T cells. Bottom: schematic diagram showing the composition of the Cry1/2 hybrids and domains used in D and E. (E) Hausp-V5 bound to FLAG-Cry1 full length or isolated domains was detected by IB following IP.
Figure 1—figure supplement 1
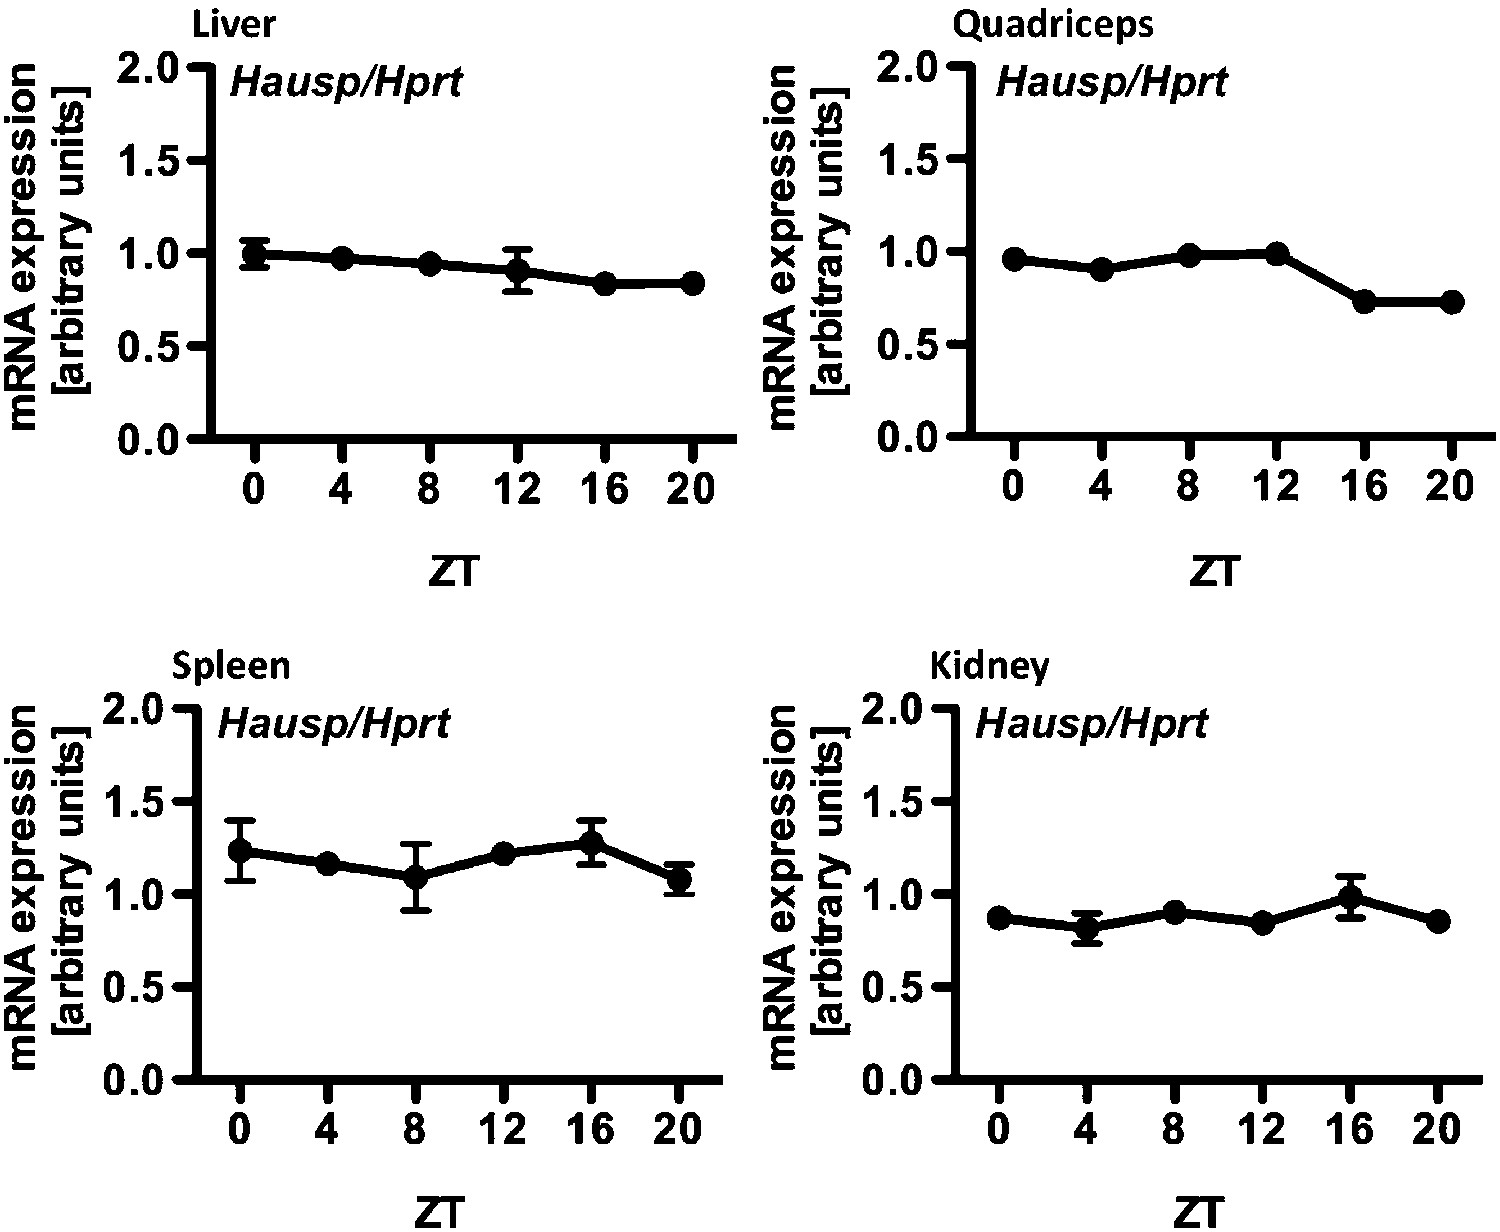
Circadian measurement of Hausp mRNA expression in mouse tissues.
Hausp expression was measured by quantitative RT-PCR in RNA prepared from mouse liver, quadriceps, spleen, and kidneys harvested at the indicated zeitgeber times (ZT, hours after lights on) from wild-type mice housed under normal 12:12 light:dark conditions. Data represent the mean ± s.d. for three samples at each ZT.
Figure 1—figure supplement 2
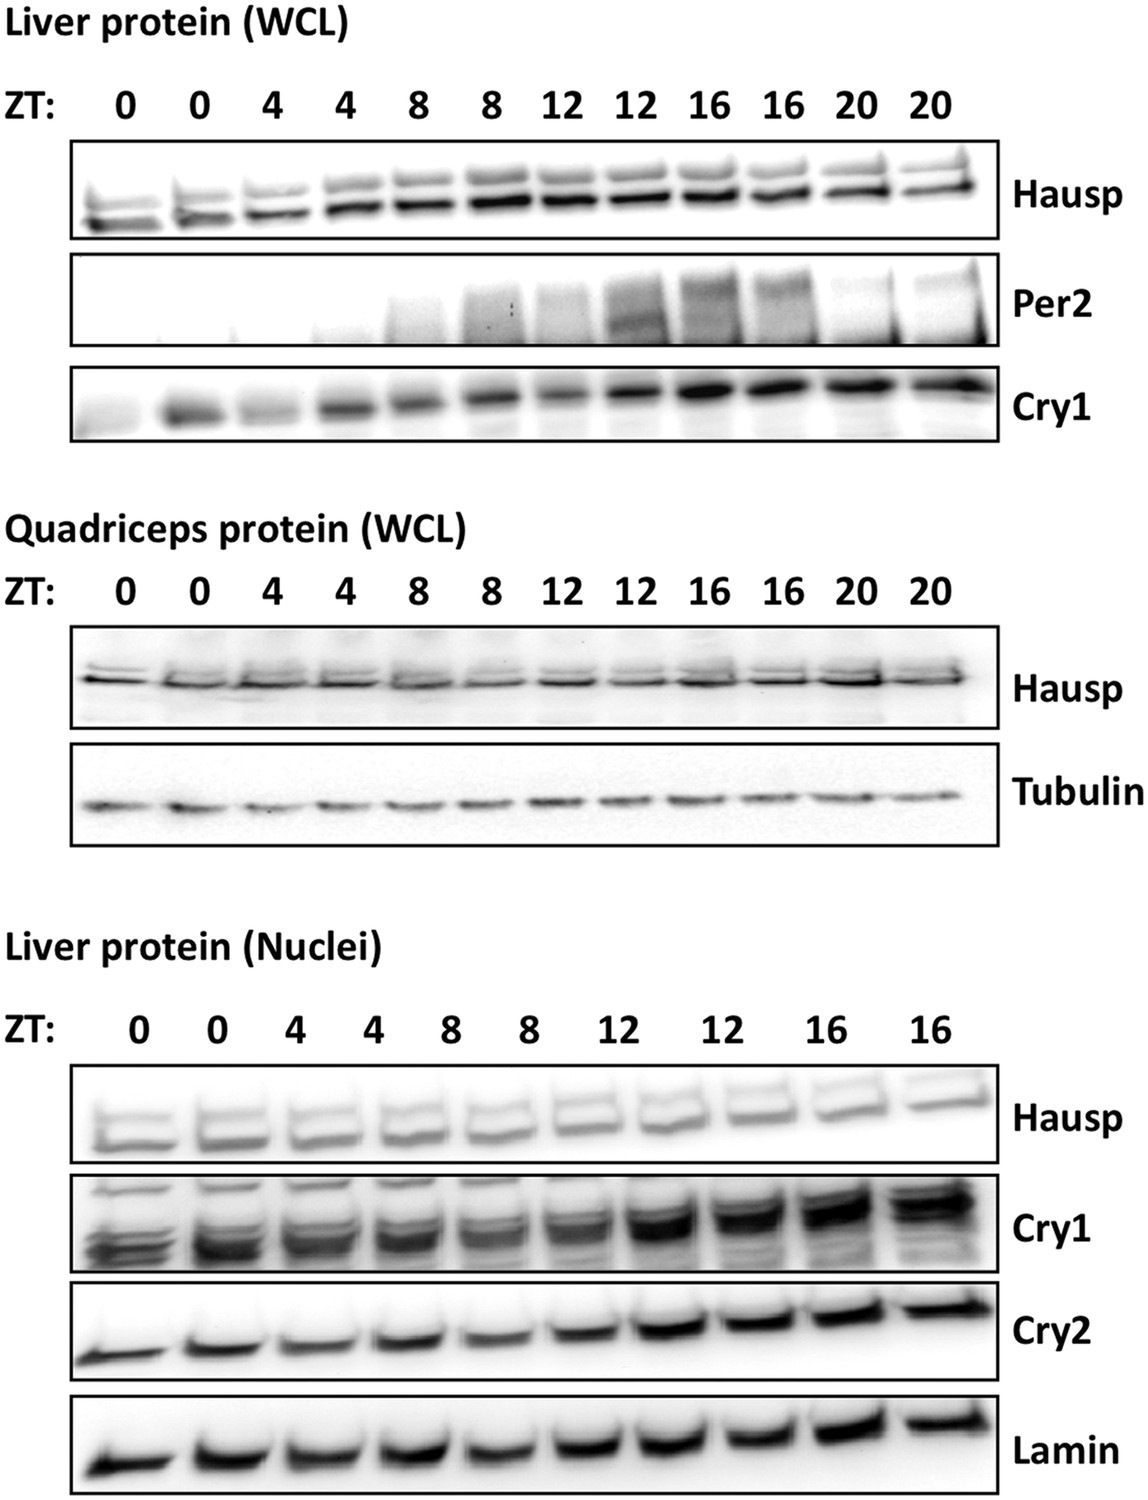
Circadian measurement of Hausp protein expression in mouse tissues.
Hausp, Per2, Cry1, Cry2, Tubulin, and Lamin were measured by IB in whole cell lysates or nuclei prepared from mouse liver or quadriceps harvested at the indicated ZTs. Each lane on the gel represents a sample collected from a unique animal.
Figure 2 with 3 supplements
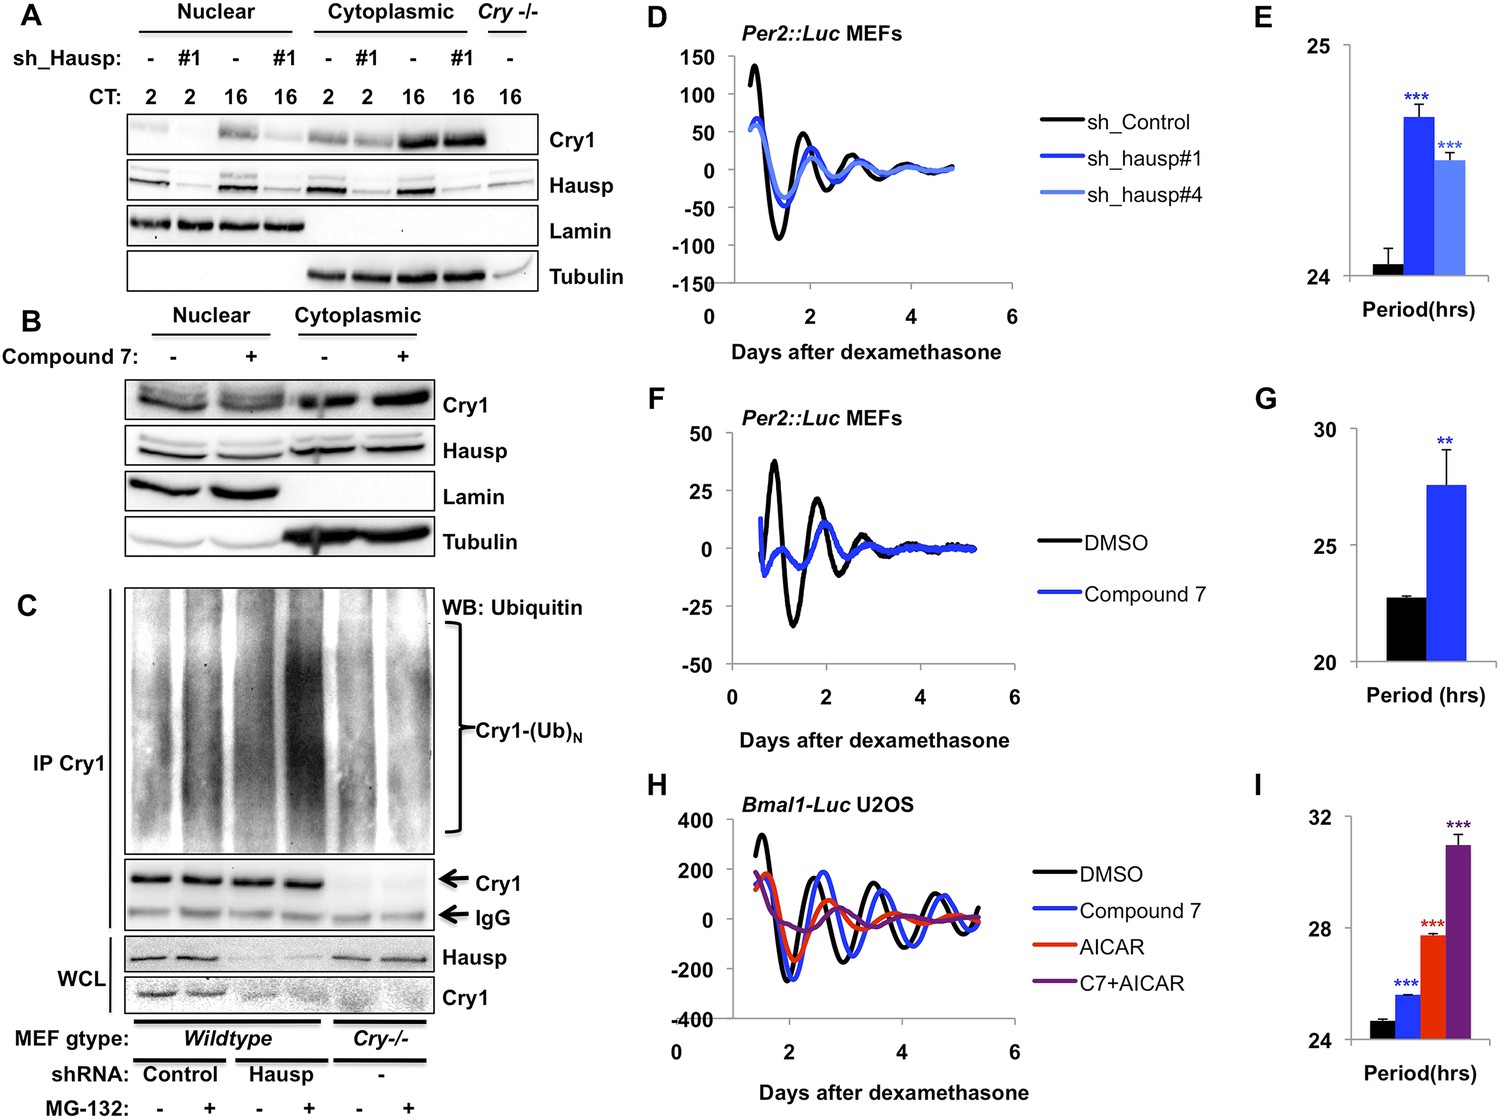
Hausp stabilizes Cry1 via deubiquitination and alters circadian rhythms.
(A) Wild-type or Cry1−/−;Cry2−/− (Cry−/−) MEFs stably expressing a control sequence (−) or shRNA targeting Hausp (#1) were subjected to nuclear and cytoplasmic fractionation. Cry1, Hausp, Lamin, and Tubulin were analyzed by IB from fractions harvested at the indicated times following circadian synchronization with dexamethasone (CT, hours). (B) Cry1, Hausp, Lamin and Tubulin were detected by IB in nuclear and cytoplasmic fractions from MEFs treated with vehicle (DMSO, −) or Compound 7 (+). (C) Wild-type MEFs stably expressing control or Hausp-targeting shRNA or Cry−/− MEFs were treated with vehicle (DMSO, −) or MG132 (+) for 6 hr, and lysed in RIPA buffer containing iodoacetamide. 6 mg of RIPA lysates from each condition was subjected to IP with 5 μg of anti-Cry1 antibody. Ubiquitinated Cry1 (Cry1− (Ub)N), Cry1, and Hausp were detected by IB in IPs and whole cell lysates (WCL). (D, F, H) Typical results of continuous monitoring of luciferase activity from MEFs expressing Per2-luciferase fusion protein from a knock-in allele (D and F) or from U2OS cells stably expressing luciferase under the control of the Bmal1 promoter (H) with stable expression of control or either of two shRNA sequences targeting Hausp (D) or treated with Compound 7 and/or AICAR (F and H). (E, G, I) Quantitation of the circadian period of luciferase activity from experiments performed as described in (D, F, H). Data represent the mean ± s.d. for 4–8 samples per condition. **p < 0.01, ***p < 0.001 vs control samples (control shRNA for E or DMSO-treated cells for G and I).
Figure 2—figure supplement 1
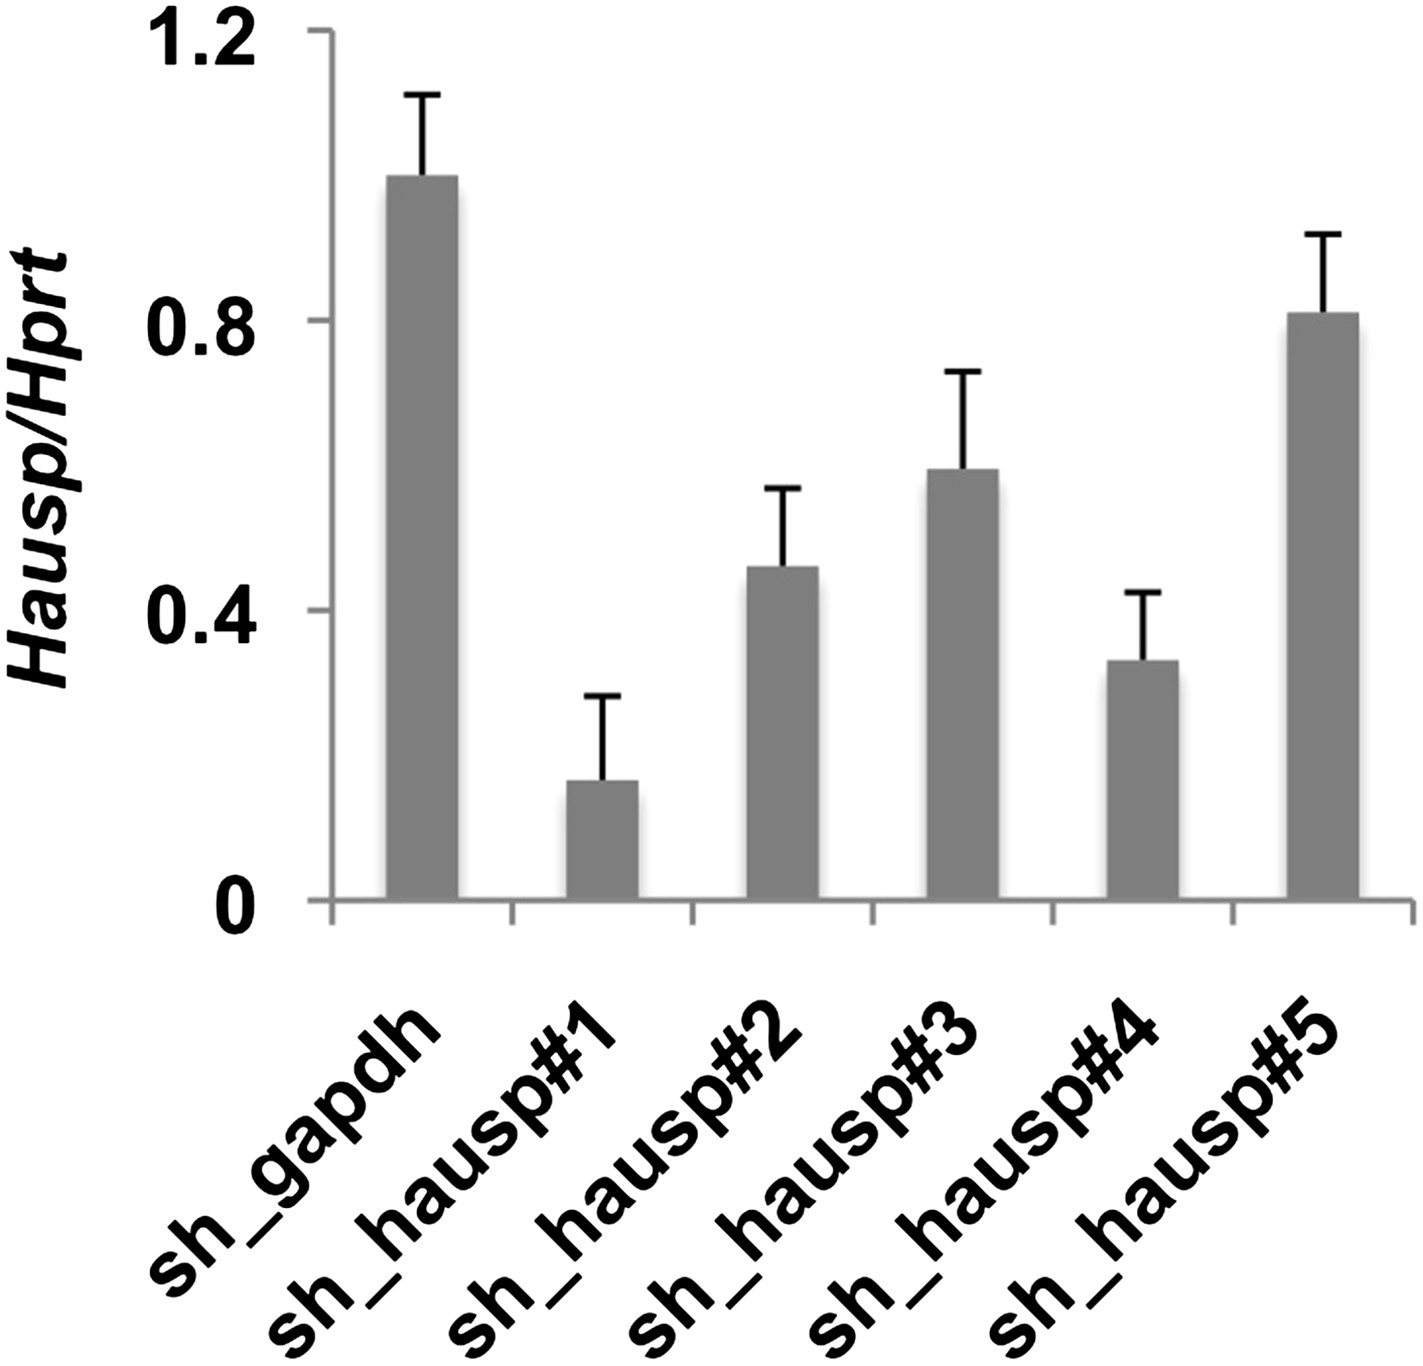
Validation of shRNA targeting Hausp.
Hausp expression was measured by quantitative RT-PCR in RNA prepared from MEFs stably expressing the indicated shRNA. Data represent the mean ± s.d. for three samples per cell line measured in triplicate.
Figure 2—figure supplement 2
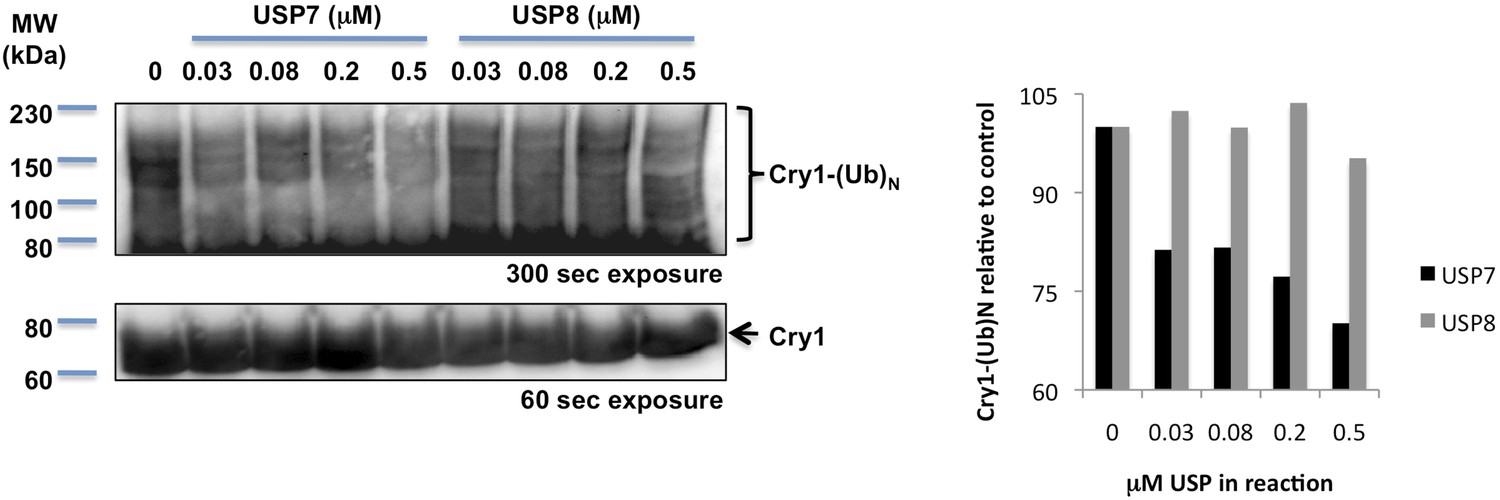
In vitro deubiquitination of Cry1 by recombinant Hausp.
Full-length and ubiquitylated Cry1 were measured by IB following in vitro exposure of purified ubiquitylated Cry1 to the indicated amounts of recombinant USP7 (Hausp) or USP8. Right: quantitation of the western blots shown at left. Data represent a typical result of three independent experiments.
Figure 2—figure supplement 3
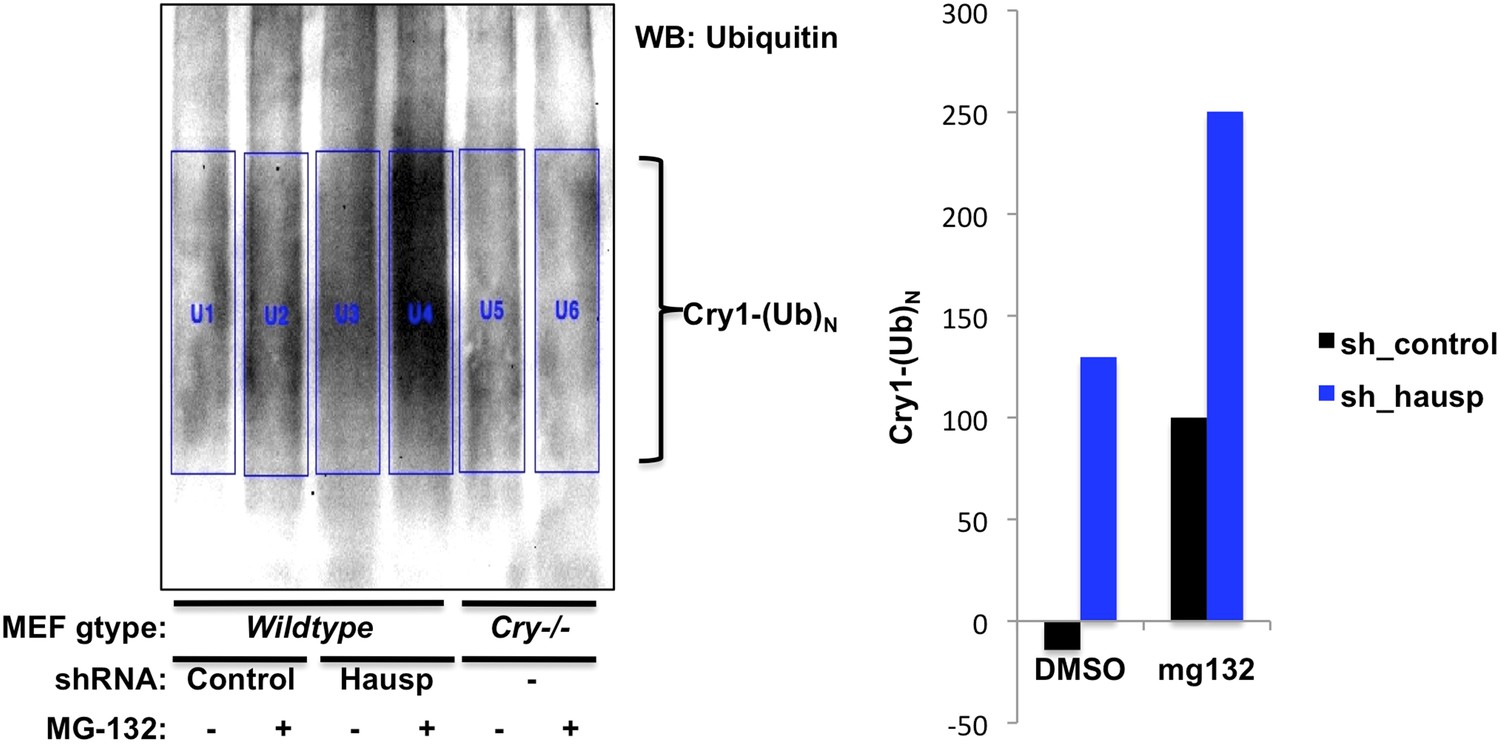
Quantitation of in vivo Cry1 ubiquitination.
Quantitation of ubiquitinated Cry1 immunoprecipitated from MEFs expressing shRNA targeting Hausp (blue) or a control sequence (black). Left, western blot from Figure 2C with boxes used for quantitation. The average signal detected in the first two lanes (background nonspecific signal from Cry1−/−;Cry2−/− cells) was subtracted from each of the other lanes to generate the data show on the right.
Figure 3 with 3 supplements
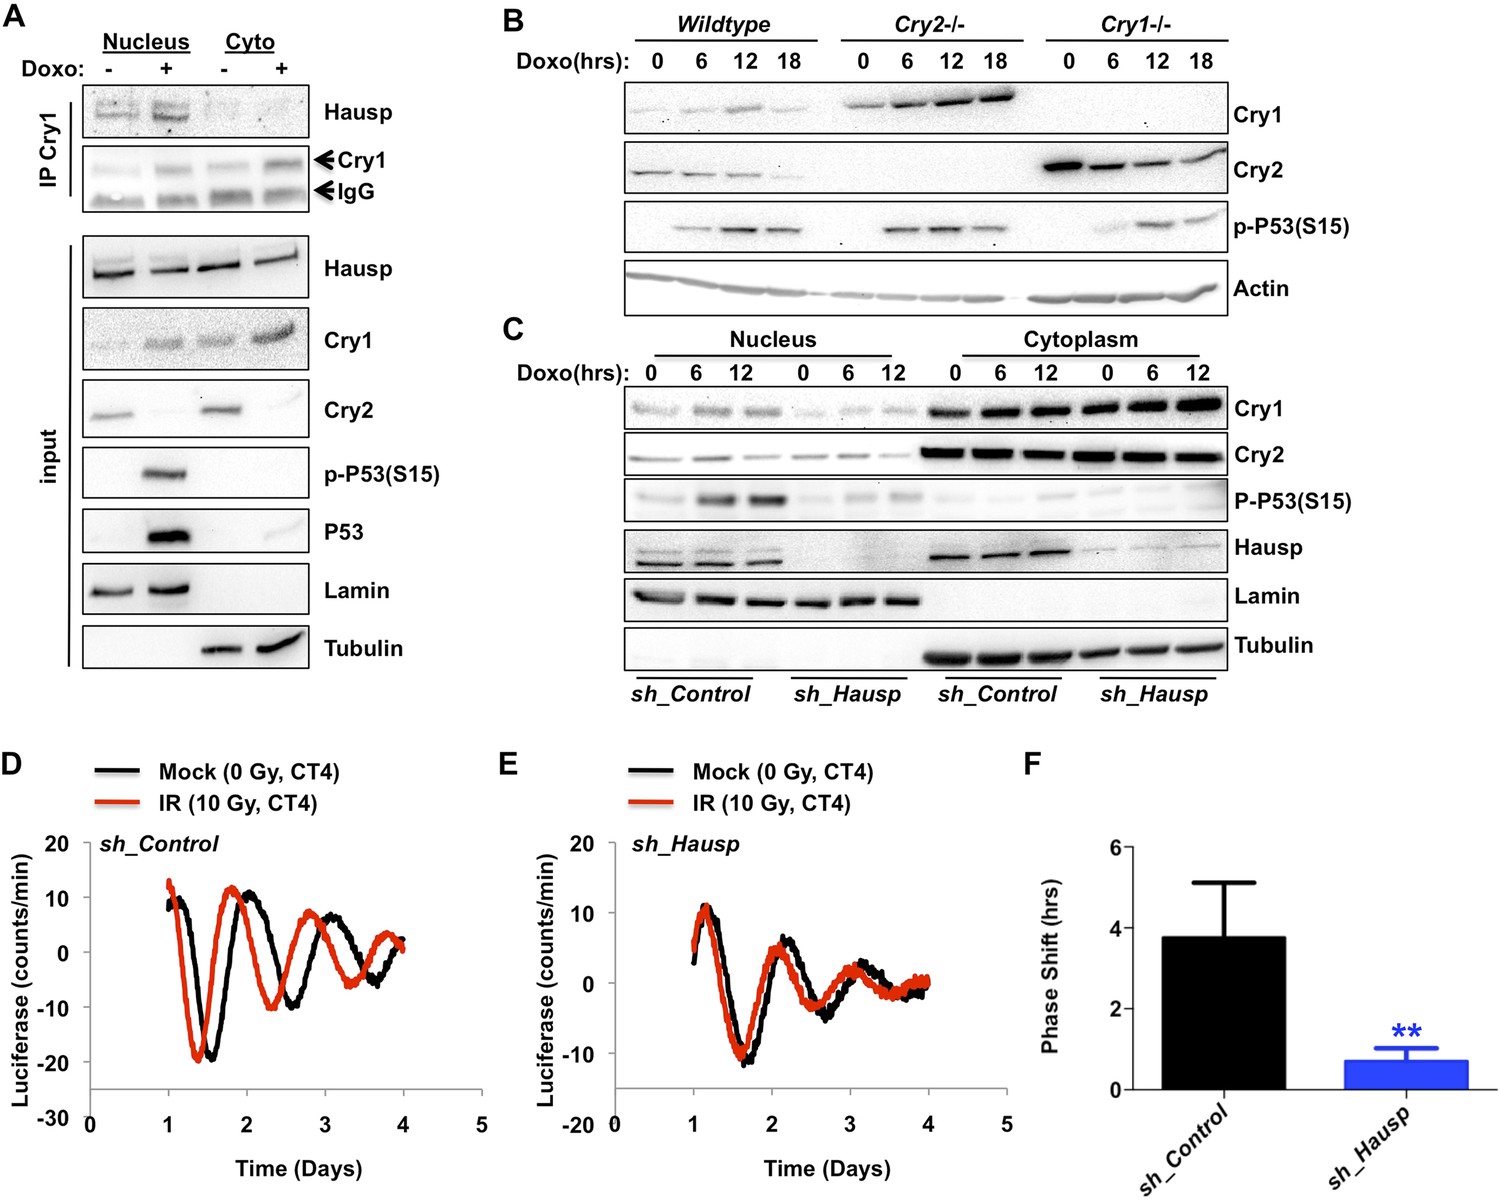
DNA damage resets the clock via Hausp-dependent stabilization of nuclear Cry1.
(A) Endogenous Hausp, Cry1, Cry2, phospho-P53 (Ser15), P53, Lamin, and Tubulin were detected by IB in Cry1 immunoprecipitates or input samples from nuclear and cytoplasmic fractions of primary MEFs treated with vehicle (−) or doxorubicin (+). (B) Cry1, Cry2, phospho-P53 (Ser15), and Actin were detected by IB in lysates from wildtype (WT), Cry1−/− or Cry2−/− MEFs treated with doxorubicin for the indicated times. (C) Cry1, Cry2, phospho-P53 (Ser15), Hausp, Lamin, and Tubulin were detected by IB in nuclear and cytoplasmic fractions from MEFs expressing control or Hausp-targeting shRNA and treated with doxorubicin for the indicated times. (D and E) Typical results of continuous monitoring of luciferase activity from primary adult ear fibroblasts expressing Bmal1-luciferase and control or Hausp-targeting shRNA and treated with 0 (black) or 10 Gy (red) irradiation 3 hr after circadian synchronization with dexamethasone. Data represent the mean luciferase counts of eight samples per condition from one of four independent experiments. (F) Quantitation of the differences in initial circadian phase of luciferase activity caused by irradiation calculated from experiments performed as described in (D and E). Data in (D–F) represent the mean ± s.d. of phase shifts observed in four independent experiments. **p < 0.01 vs control samples.
Figure 3—figure supplement 1
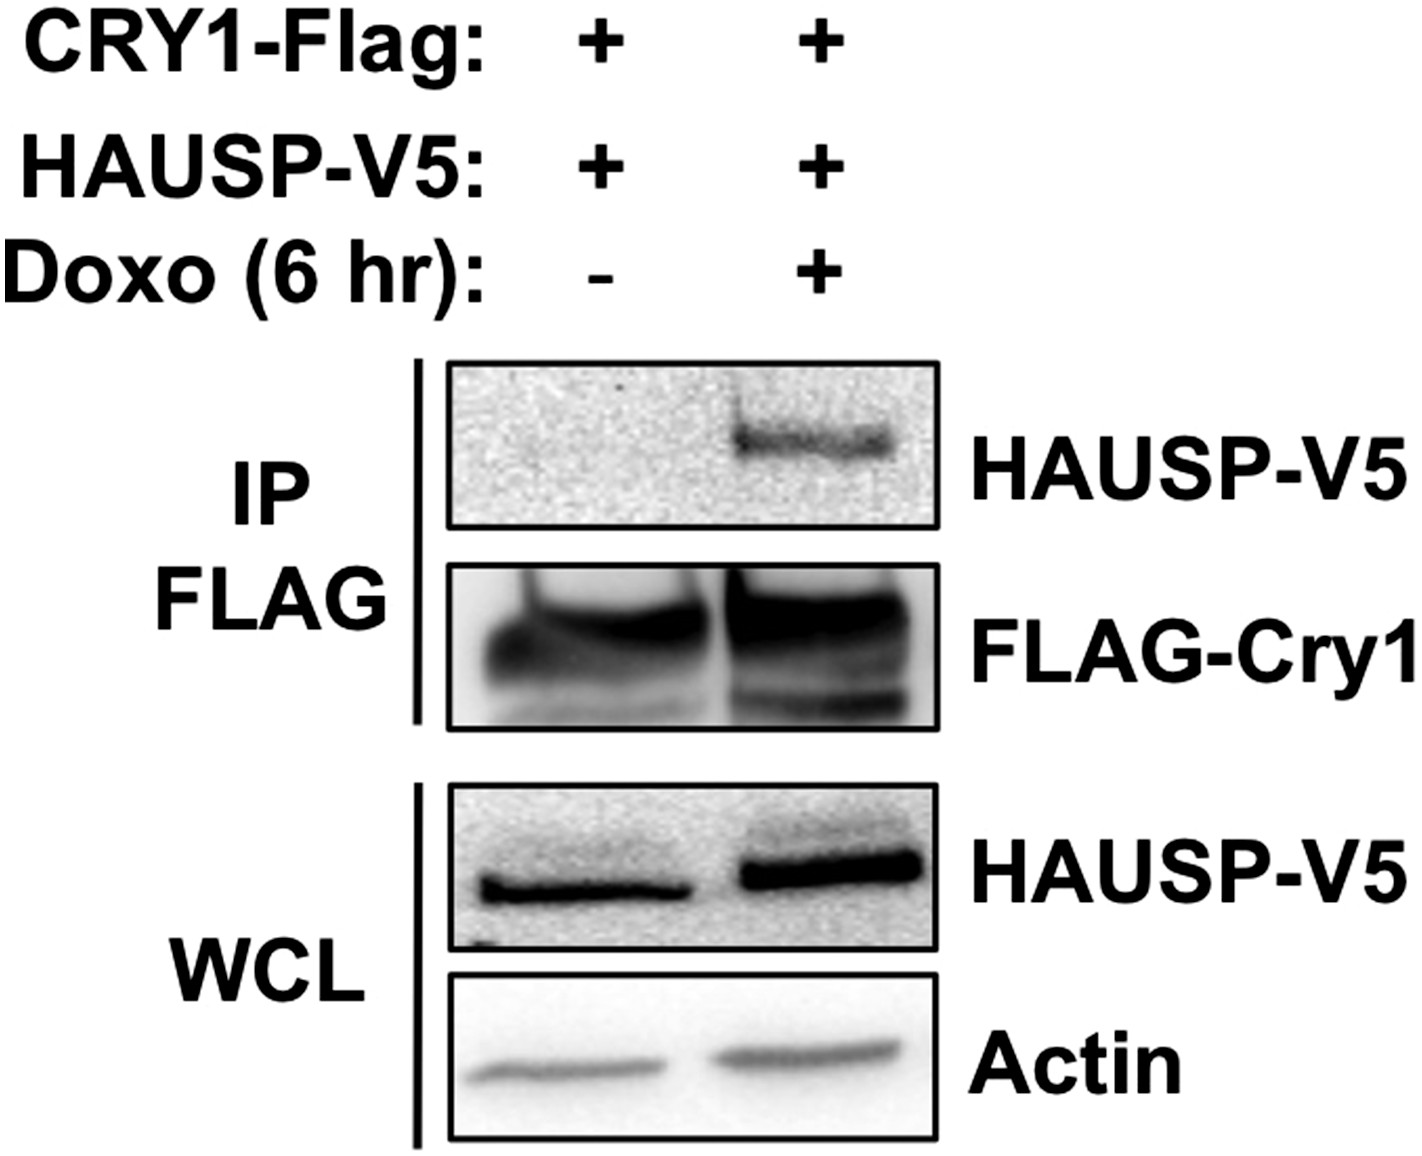
Effect of DNA damage on Cry1-Hausp interaction in transfected 293T cells.
HAUSP-V5, FLAG-Cry1, and Actin were detected by IB in IPs or whole cell lysates (WCL) from 293T cells transfected with the indicated plasmids (by calcium phosphate method) and treated with doxorubicin.
Figure 3—figure supplement 2
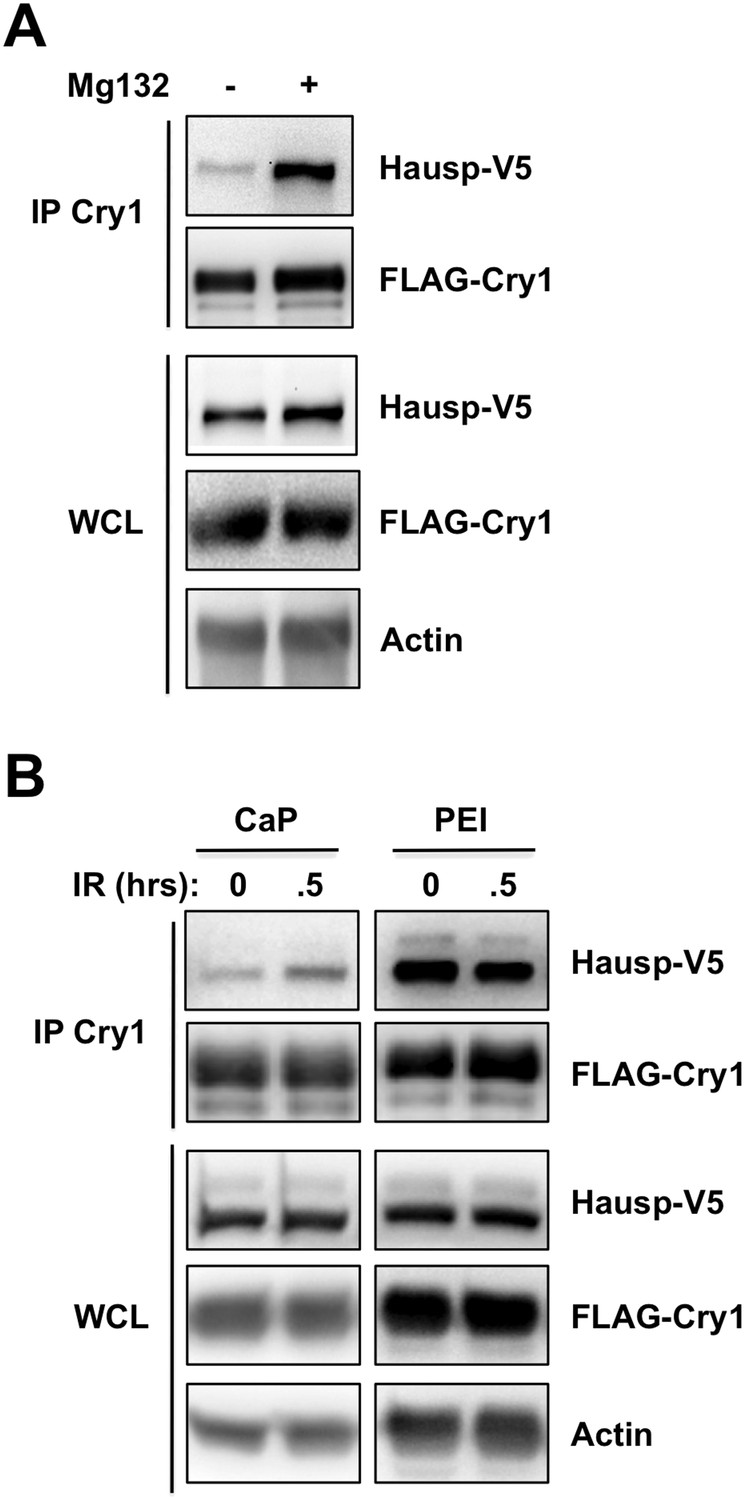
Proteostasis and/or membrane stress increase the Cry1-Hausp interaction.
HAUSP-V5, FLAG-Cry1, and Actin were detected by IB in IPs or whole cell lysates (WCL) from 293T cells transfected with the indicated plasmids (by calcium phosphate CaP, or PEI method) and treated with (A) Mg132 or (B) 10 Gy ionizing radiation (IR). Note that the Cry1-Hausp interaction, which can be increased by DNA damage stimuli, is independently induced by other stress signals including proteostasis stress and membrane stress. The degree to which Cry1 and/or Hausp are overexpressed in transfected cells influences their affinity of interaction. The method of transfection also altered their interaction. We consistently observed induced interaction between Cry1 and Hausp after DNA damage in cells transfected with low concentrations of plasmids using standard calcium phosphate transfection protocols. However, cells transfected with PEI or otherwise expressing excessive amounts of exogenous proteins or treated with the proteasome inhibitor Mg132 displayed high basal interaction between Cry1 and Hausp that was not further increased upon treatment with DNA damaging agents.
Figure 3—figure supplement 3
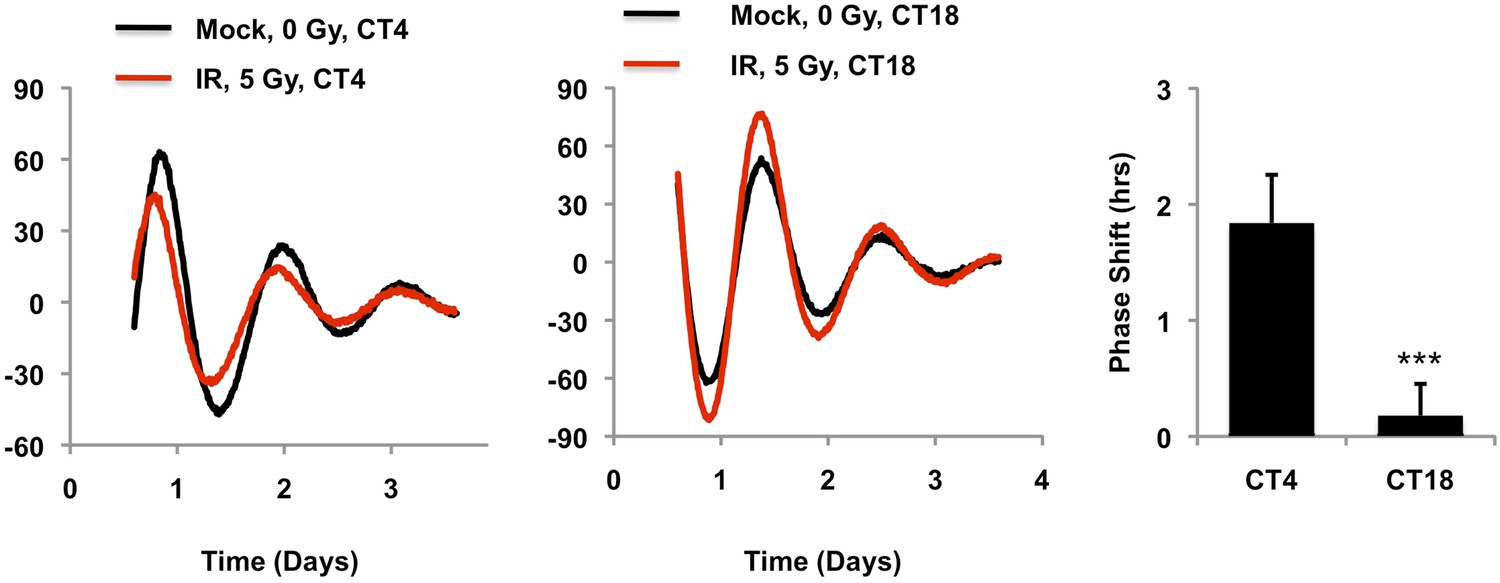
Circadian time of exposure determines phase shift in response to DNA damage.
Typical results of continuous monitoring of luciferase activity from mouse embryonic fibroblasts expressing Per2::Luciferase treated with 0 (black curves) or 10 Gy (red curves) ionizing radiation 4 (CT4) or 18 (CT18) hours after circadian synchronization with 1 μM dexamethasone. Data represent the mean luciferase counts of six samples per condition from one of two independent experiments. Right: quantitation of the differences in initial circadian phase of luciferase activity caused by irradiation. Data represent the mean ± propagated s.d. difference between initial phase in Mock vs irradiated samples for six samples per condition. ***p < 0.001 for a significant interaction between CT and irradiation by 2-way ANOVA.
Figure 4 with 2 supplements

DNA damage induced signaling modulates interactions of Cry1/2, Hausp, and Fbxl3.
Hausp-V5, FLAG-Cry1/2, phospho-P53 (Ser15), Phospho-SQ/TQ, Phospho-Cry1S588 (P-S588), Fbxl3-V5, and Actin were detected by IB in IPs and lysates (WCL) from 293T cells transfected with the indicated plasmids and lysed at the indicated times following treatment with doxorubicin (doxo) or irradiation (IR).
Figure 4—figure supplement 1
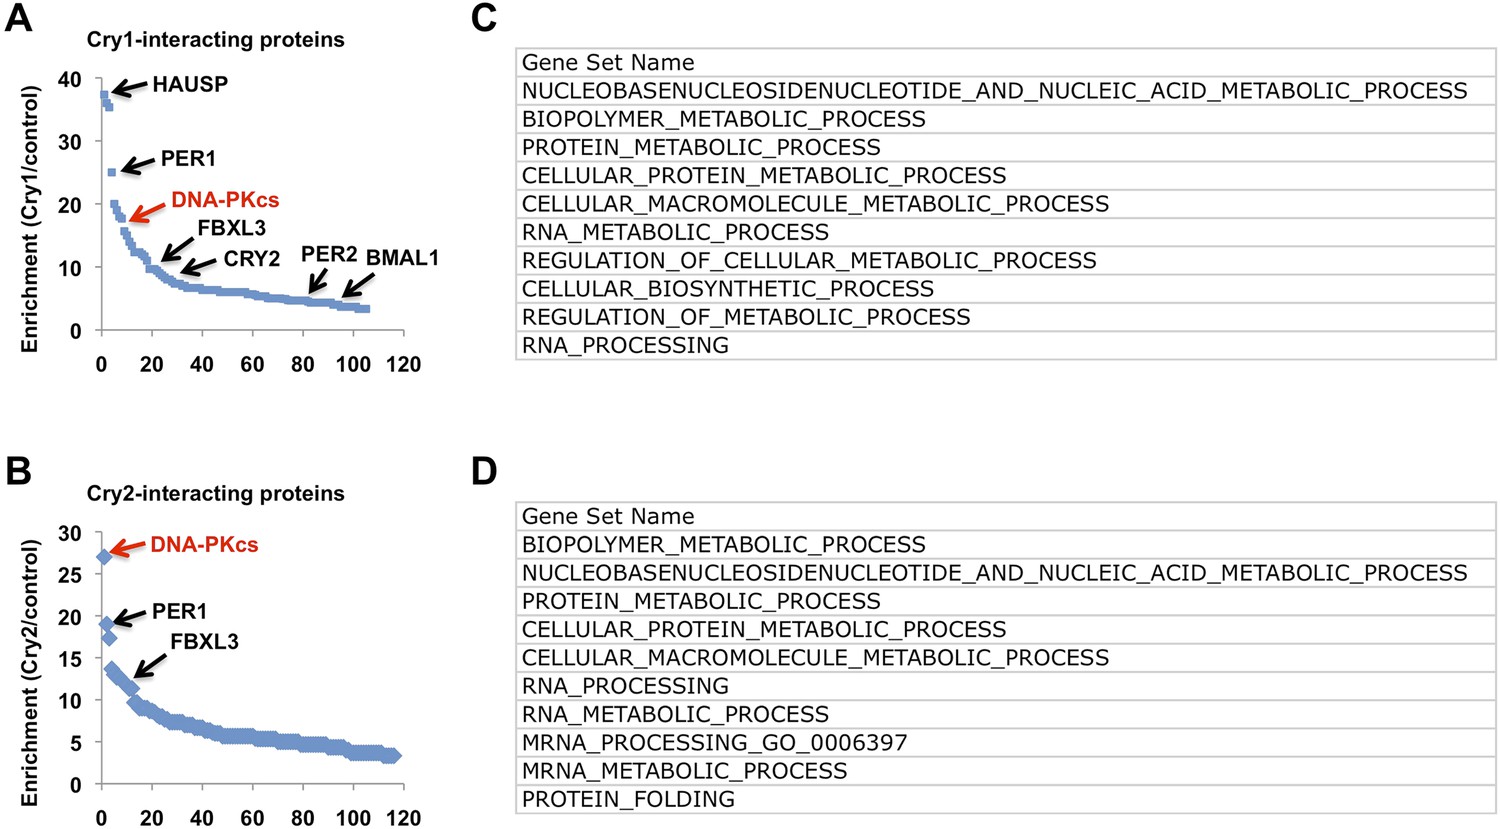
Composition of Cry1- and Cry2-associated protein complexes.
(A and B) Lysates from 293T cells expressing pcDNA3-2xFLAG with no insert, Cry1, or Cry2 were used to purify control, Cry1, or Cry2-containing complexes by immunoprecipitation (IP) of the FLAG tag. Components of the resulting complexes were identified by mass spectrometry. The experiment was performed in triplicate and PatternLab for Proteomics (Carvalho et al.) was used to identify statistically enriched partners. Enrichment is the ratio of spectral counts in Cry1 or Cry2 vs control samples for the top 150 statistically enriched partners over three experiments. Arrows depict several established partners for Cry1 and Cry2 as well as the observed 18-fold and 27-fold enrichment for DNA-PKcs in Cry1- and Cry2-containing samples, respectively. (C and D) Biological processes identified by Gene Set Enrichment Analysis to be statistically enriched in Cry1-associated complexes (C) or Cry2-associated complexes (D).
Figure 4—figure supplement 2

Conserved SQ/TQ motifs present in Cry1 and/or Cry2.
Sequence alignment of mouse and human Cry1 and Cry2 indicating the positions and conservation of several SQ/TQ motifs. (Numbers correspond to the amino acid positions in mouse Cry1.)
Figure 5 with 2 supplements
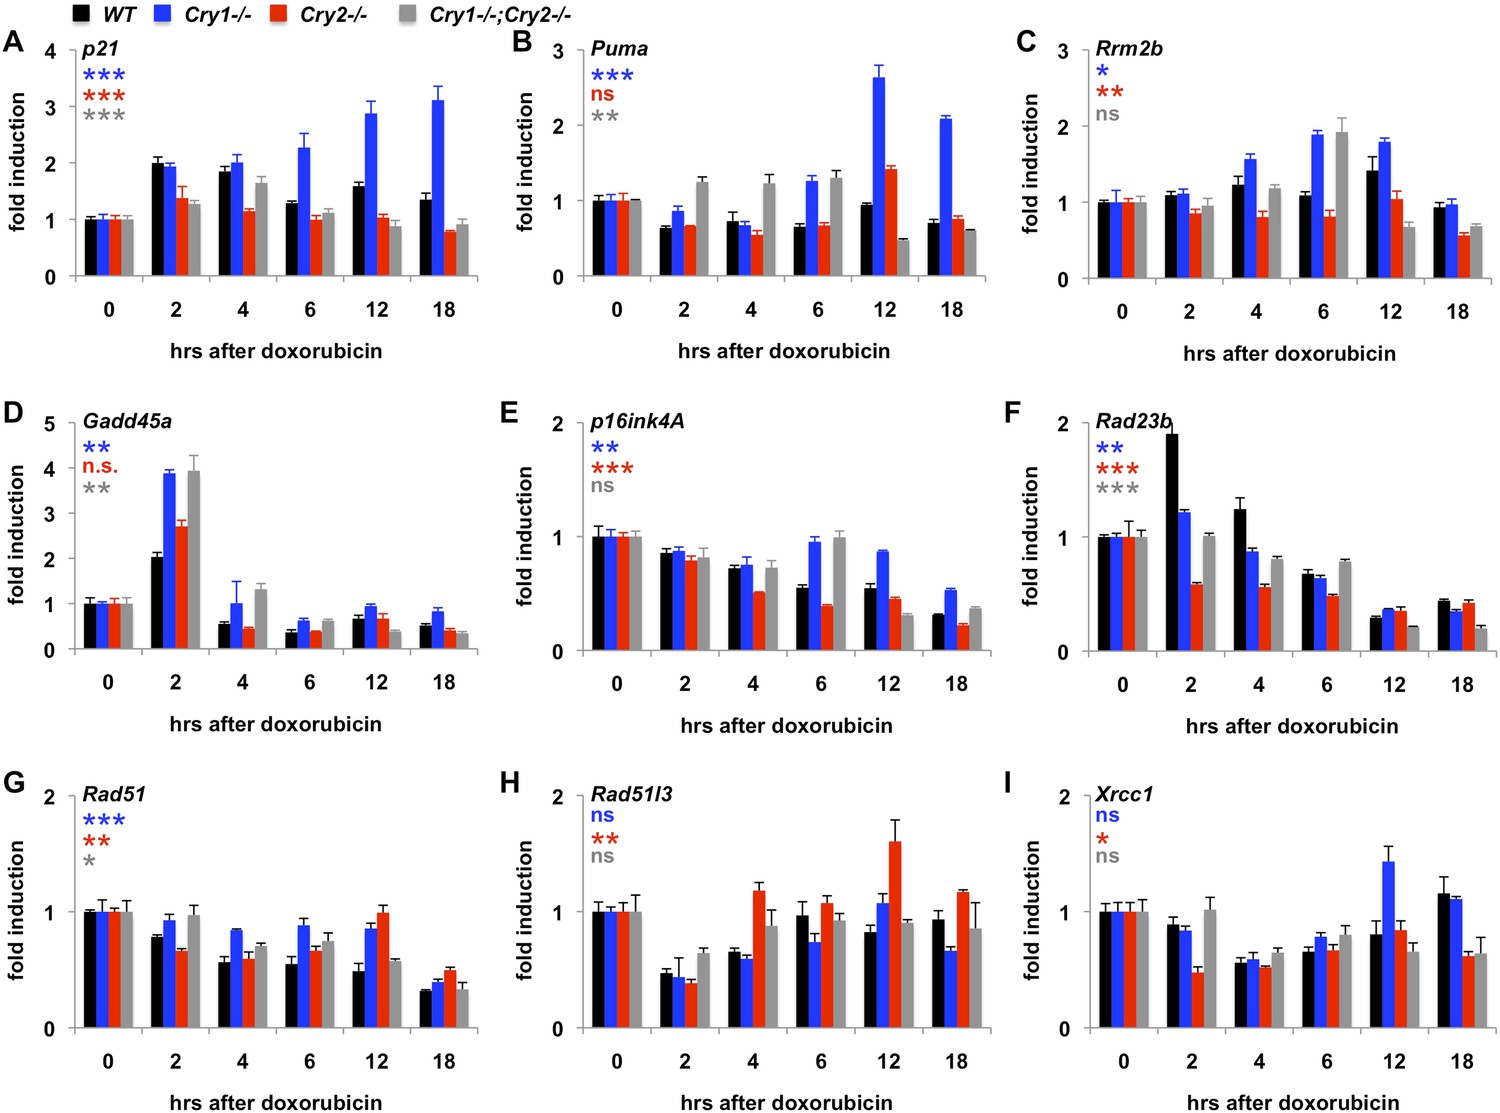
Cry1/2 deficiency alters transcriptional response to DNA damage.
Expression of the indicated transcripts was measured by quantitative PCR (qPCR) in cDNA from wildtype (black), Cry1−/− (blue), Cry2−/− (red), and Cry1−/−;Cry2−/− (gray) fibroblasts treated with doxorubicin for the indicated times. *p < 0.05, **p < 0.01, ***p < 0.001 for effect of genotype by repeated measures ANOVA analysis (blue—WT vs Cry1−/−; red—WT vs Cry2−/−; gray—WT vs Cry1−/−;Cry2−/−).
Figure 5—figure supplement 1
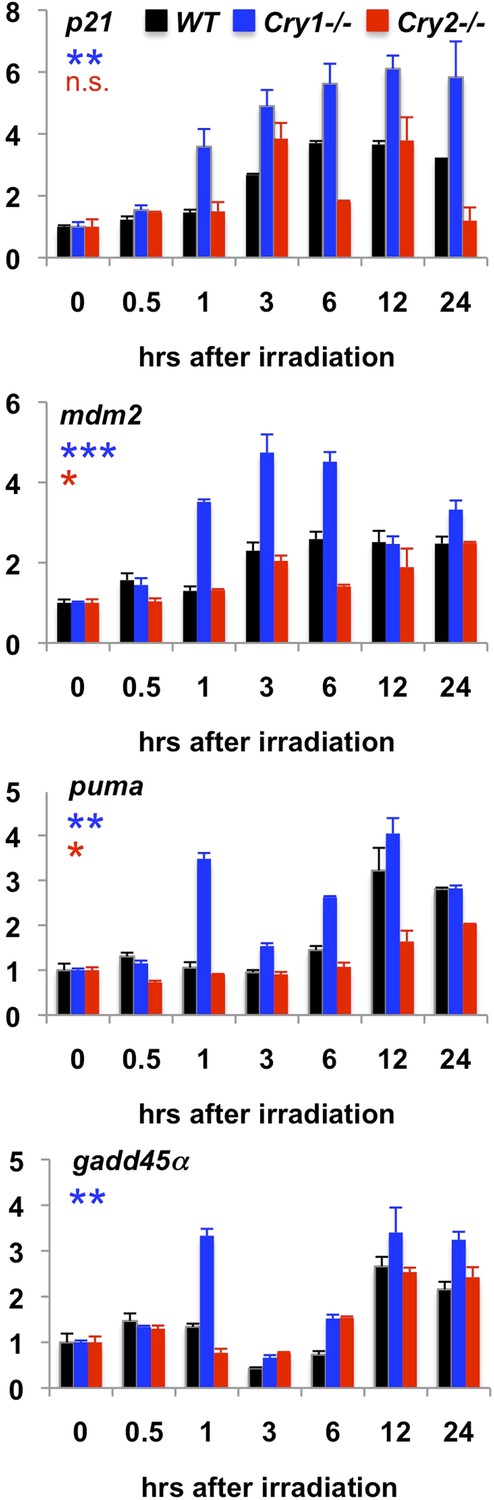
Transcriptional response to irradiation-induced DNA damage.
Expression of the indicated transcripts was measured by quantitative PCR (qPCR) in cDNA prepared from wild-type (black), Cry1−/− (blue), and Cry2−/− (red) fibroblasts at the indicated times following exposure to 5 Gy irradiation.
Figure 5—figure supplement 2
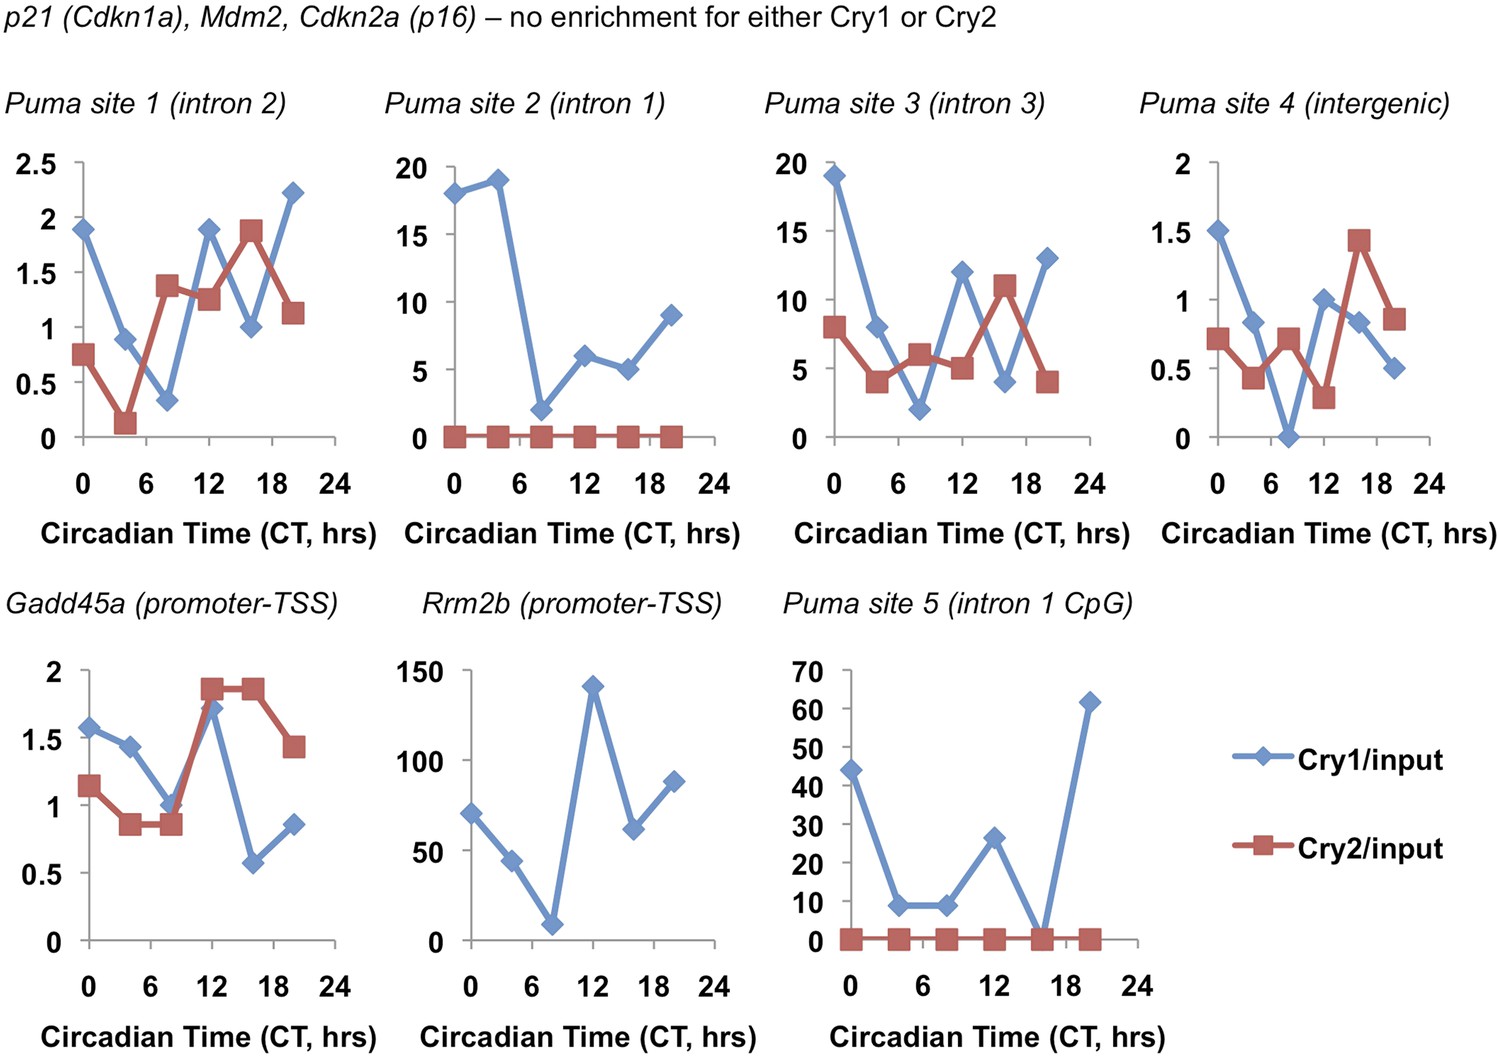
Circadian pattern of Cry1 and Cry2 binding to selected chromatin sites.
Association of Cry1 (blue) or Cry2 (red) with chromatin at the indicated locations in ChIP sequencing data set published by Koike et al. (2012). Data represent the reported Cry1 or Cry2 signal normalized to the reported ‘input’ signal for each locus.
Figure 6
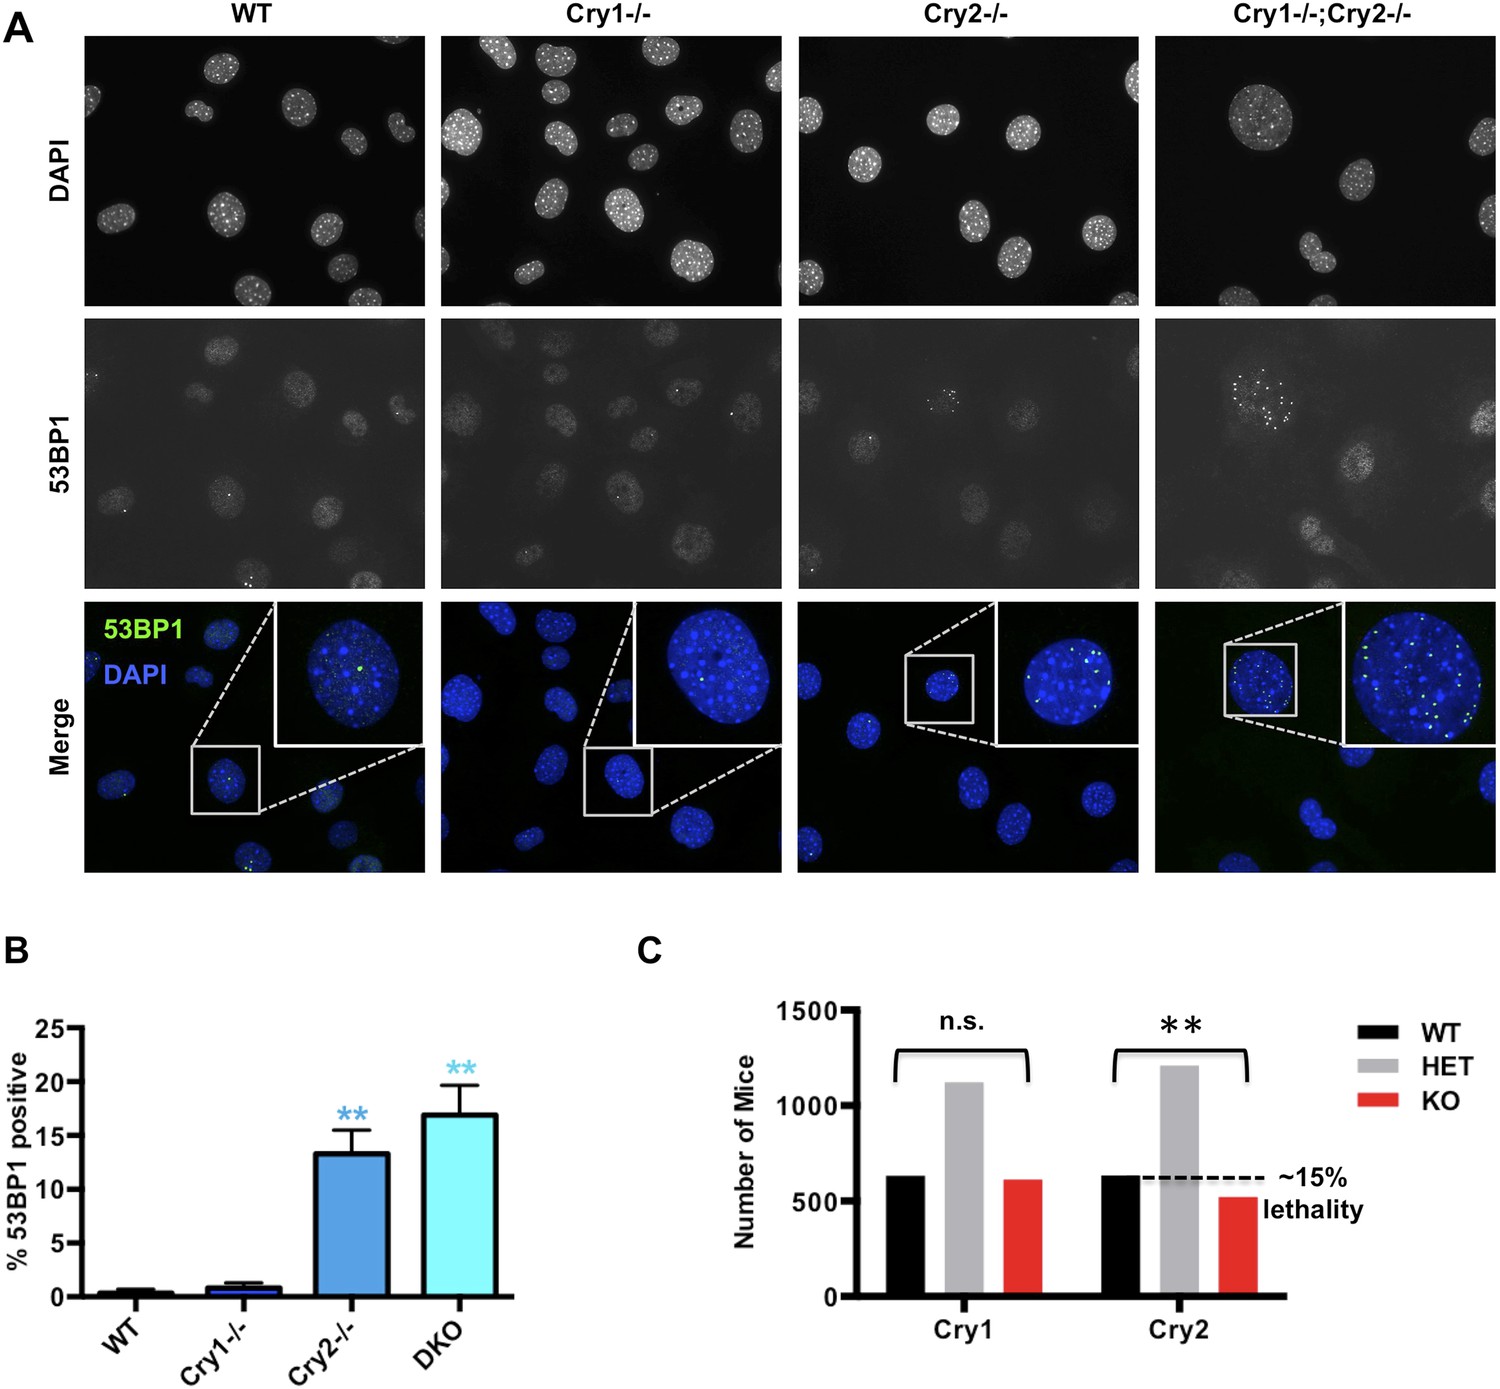
Cry2−/− cells accumulate damaged DNA.
(A) Representative early passage (P3–4) primary wildtype (WT), Cry1−/−, Cry2−/−, and Cry1−/−;Cry2−/− adult ear fibroblasts stained with anti-53BP1 antibody (green) and DAPI (blue). Insets show enlarged view of indicated cells. (B) Quantitation of 53BP1-positive cells prepared as described in (A). Nuclei containing more than five 53BP1 puncta and negative for BrdU labeling were considered positive for DNA damage. Data represent the mean ± s.d. for at least 200 cells per genotype. (C) Chi-squared analysis of the distributions of Cry1 and Cry2 wildtype (black), heterozygous (gray), and homozygous knockout (red) genotypes establishes a significantly reduced survival of Cry2−/− mice. **p < 0.01 by chi-squared analysis with 2 degrees of freedom (χ2 = 10.39).
Figure 7
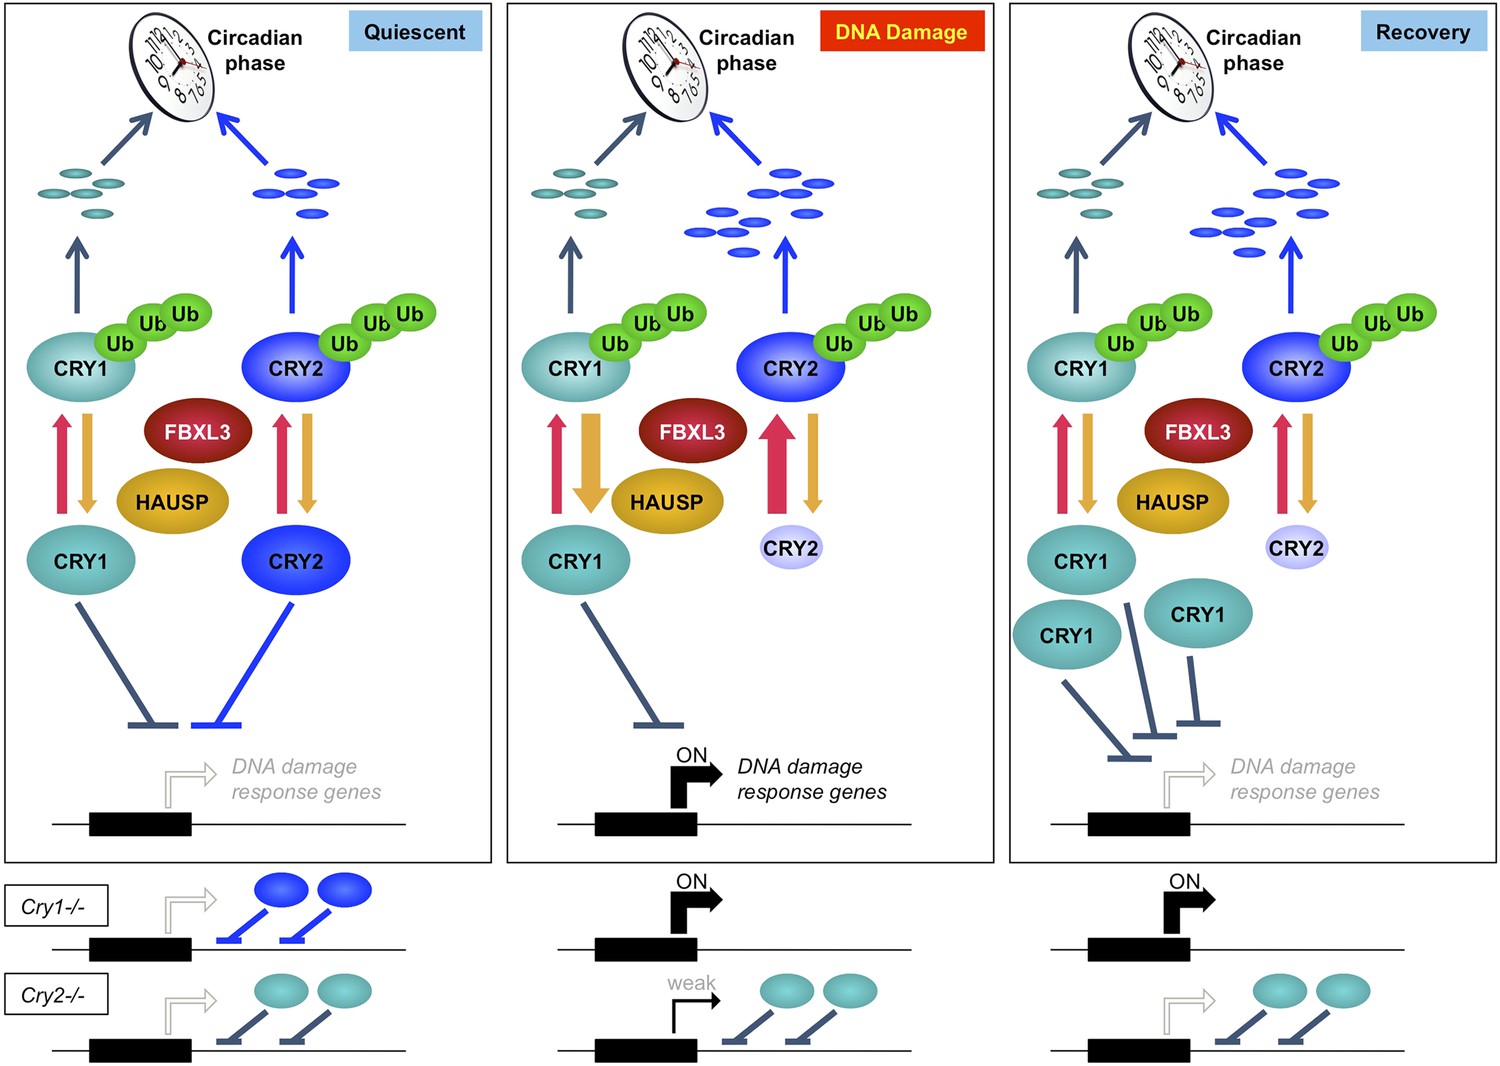
Model depicting a novel mechanism by which the regulation of Cry1 and Cry2 enables coordination of the transcriptional response to genotoxic stress.
In quiescent cells, Cry1 and Cry2 repress transcription of target genes. Upon DNA damage, Cry2 is degraded, relieving repression. As Cry1 accumulates, it replaces Cry2 and returns gene expression to normal levels resulting in transient activation. In Cry1−/− cells, gene expression is enhanced, while in Cry2−/− cells, damage-induced transcription is suppressed. Note that this model does not explain the dynamics of altered response observed for all transcripts but may apply to the average change in the transcriptional response to DNA damage in Cry1/2-deficient cells.
Tables
Table 1
Primers used for qPCR
| Cdkn2a (p21): | Fwd: CCAGGCCAAGATGGTGTCTT | Rev: TGAGAAAGGATCAGCCATTGC |
| Mdm2: | Fwd: CTGTGTCTACCGAGGGTGCT | Rev: CGCTCCAACGGACTTTAACA |
| Rrm2b: | Fwd: GACAGCAGAGGAGGTTGACTTG | Rev: AAAACGCTCCACCAAGTTTTCA |
| Puma: | Fwd: GTACGGGCGGCGGAGACGAG | Rev: GCACCTAGTTGGGCTCCATTTCTG |
| Gadd45a: | Fwd: AAGACCGAAAGGATGGACACG | Rev: CAGGCACAGTACCACGTTATC |
| Rad23b: | Fwd: ACCTTCAAGATCGACATCGACC | Rev: ACTTCTGACCTGCTACCGGAA |
| Rad51l3: | Fwd: GGAGCTTTGTGCCCAGTACC | Rev: TCCCCAATGTCCCAATGTCTAT |
| Xrcc1: | Fwd: AGCCAGGACTCGACCCATT | Rev: CCTTCTCCAACTGTAGGACCA |
| p16ink4a: | Fwd: GTGTGCATGACGTGCGGG | Rev: GCAGTTCGAATCTGCACCGTAG |
| Rad51: | Fwd: TCACCAGCGCCGGTCAGAGA | Rev: CCGGCCTAAAGGTGCCCTCG |
Additional files
-
Supplementary file 1
Cry1-associated proteins. Lysates from 293T cells expressing pcDNA3-2xFLAG with no insert (control) or Cry1 after the FLAG tag were used to purify control or Cry1-containing complexes by immunoprecipitation (IP) of the FLAG tag. Components of the resulting complexes were identified by mass spectrometry. The experiment was performed in triplicate and PatternLab for Proteomics (Carvalho et al.) was used to identify statistically enriched partners in Cry1-associated complexes compared to the control. Enrichment (Cry1/control) is the ratio of spectral counts in Cry1 vs control samples for all statistically enriched partners over three experiments.
- https://doi.org/10.7554/eLife.04883.023
-
Supplementary file 2
Cry2-associated proteins. Lysates from 293T cells expressing pcDNA3-2xFLAG with no insert (control) or Cry2 after the FLAG tag were used to purify control or Cry1-containing complexes by immunoprecipitation (IP) of the FLAG tag. Components of the resulting complexes were identified by mass spectrometry. The experiment was performed in triplicate and PatternLab for Proteomics (Carvalho et al.) was used to identify statistically enriched partners in Cry2-associated complexes compared to the control. Enrichment (Cry2/control) is the ratio of spectral counts in Cry2 vs control samples for all statistically enriched partners over three experiments.
- https://doi.org/10.7554/eLife.04883.024
-
Supplementary file 3
Chromatin binding of circadian transcription factors to loci encoding DNA repair proteins. Published data (Koike et al., 2012, Table S2) was searched for the text string ‘repair’ to make a preliminary identification of chromatin regions near genes involved in DNA repair that were found to be associated with each of the seven circadian transcription factors Cry1, Cry2, Per1, Per2, Clock, Npas2, and Bmal1.
- https://doi.org/10.7554/eLife.04883.025
Download links
A two-part list of links to download the article, or parts of the article, in various formats.
Downloads (link to download the article as PDF)
Open citations (links to open the citations from this article in various online reference manager services)
Cite this article (links to download the citations from this article in formats compatible with various reference manager tools)
DNA damage shifts circadian clock time via Hausp-dependent Cry1 stabilization
eLife 4:e04883.
https://doi.org/10.7554/eLife.04883


