Bioengineered human myobundles mimic clinical responses of skeletal muscle to drugs
- Duke University, United States
- Duke University School of Medicine, United States
Figures
Figure 1 with 4 supplements
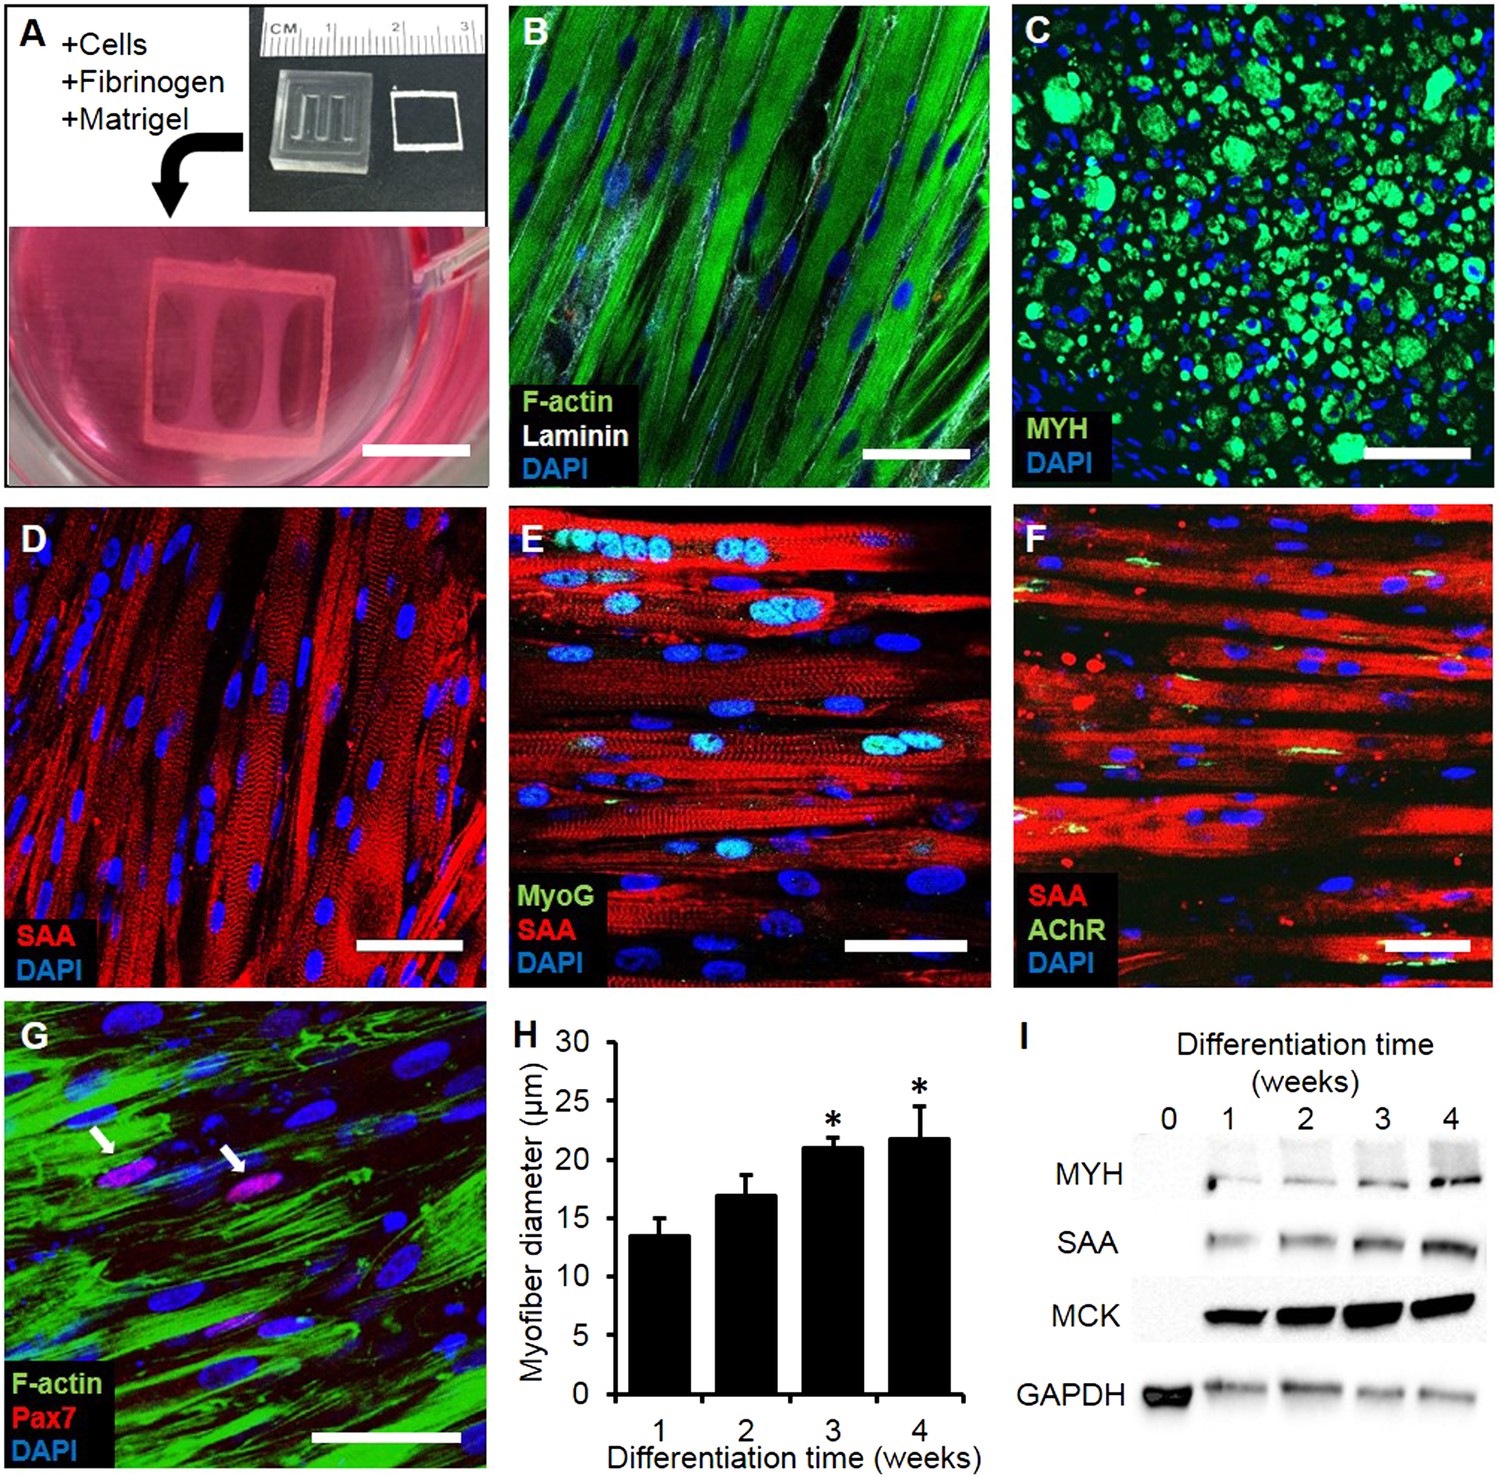
Structure and cellular composition of myobundles.
(A) Human myogenic precursors were cast within a fibrin/matrigel matrix in PDMS molds and anchored to nylon frames. Once compacted, frames with myobundles were removed for free-floating culture. (B) F-actin+ myofibers shown within 2-week myobundles are aligned and surrounded by laminin. (C) Transverse myobundle cross-section showing dense, uniformly distributed myosin heavy chain (MYH) expressing myofibers. (D–F) Aligned myofibers within myobundle show striated pattern of the contractile protein sarcomeric α-actinin (SAA) (D), myogenin (MyoG) positive nuclei (E), and bungarotoxin-labeled acetylcholine receptors (AChR) (F). (G) Pax7+ cells (arrows) are found abutting myofibers suggesting regenerative potential. (H) Myofiber diameter increases with time in culture, with significant enhancement at 3 and 4 weeks vs 1 week (*p < 0.05, N = 4 donors, n > 10 myofibers per myobundle). (I) Structural maturation is also evident from increased expression of muscle markers MYH, SAA, and muscle creatine kinase (MCK). Scale bars: (B–F) scale = 50 µm, (G) scale = 25 µm.
Figure 1—figure supplement 1
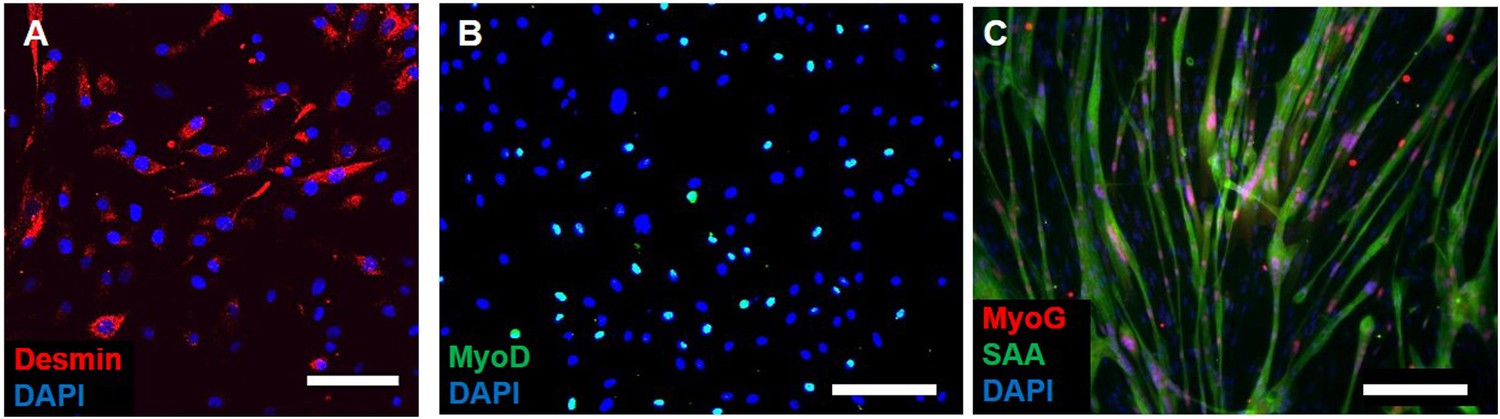
Myogenicity of donor cells during expansion.
(A) Expanded donor cells at passage three still express the muscle precursor markers desmin and (B) MyoD. (C) After switch to low serum media in 2D, myogenic cells fuse into myotubes and express myogenin (MyoG) and sarcomeric alpha-actinin (SAA). Scale bars: (A) 50 µm, (B and C) 200 µm.
Figure 1—figure supplement 2
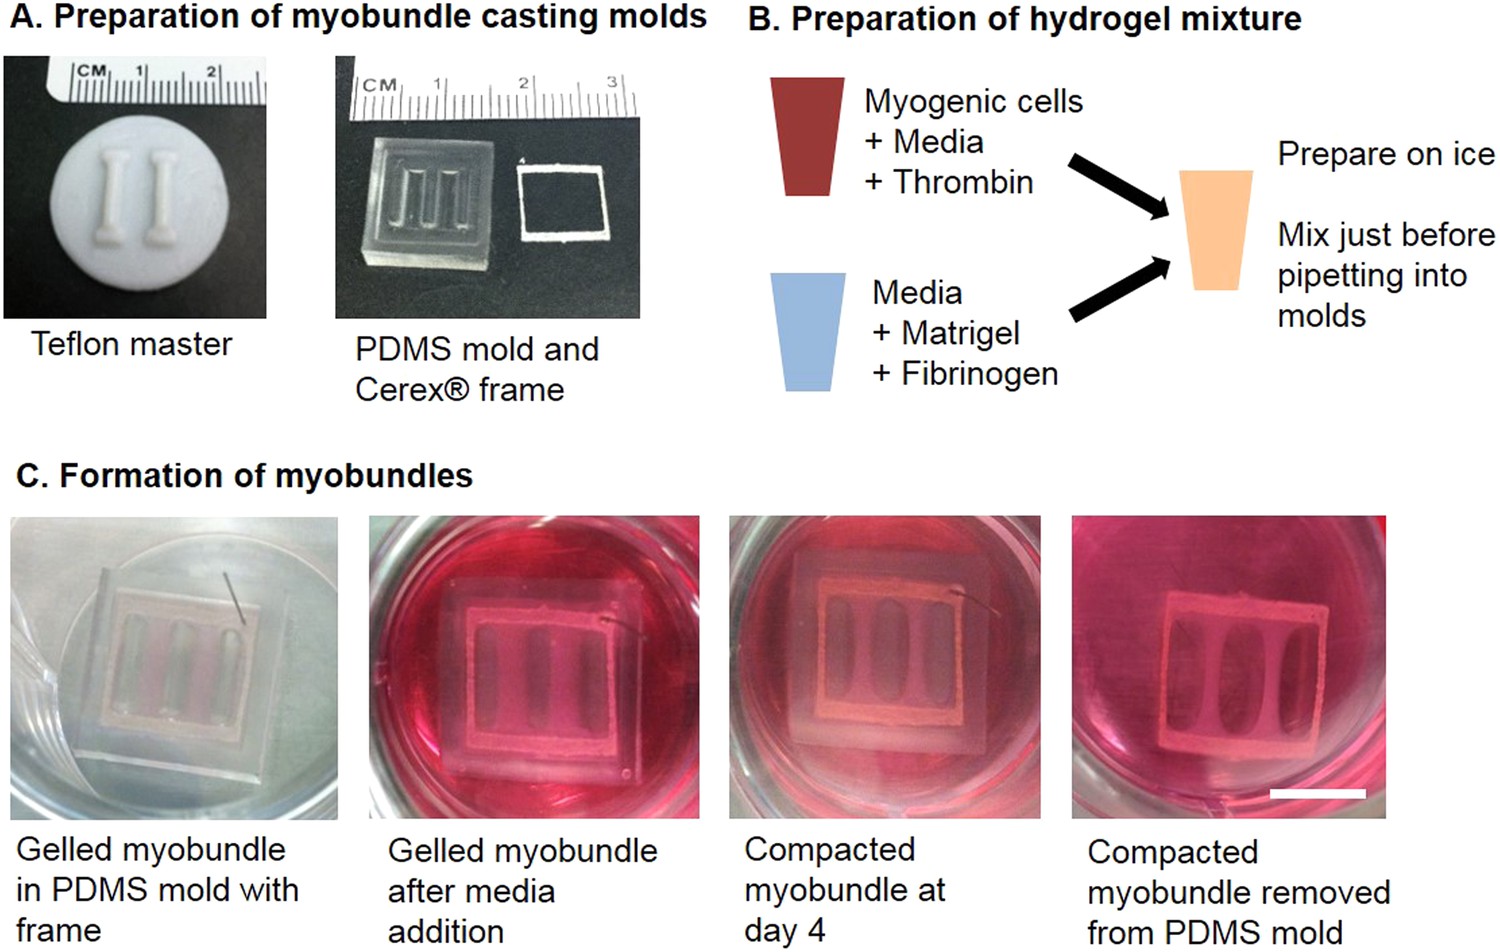
Schematic of myobundle fabrication.
(A) Machined teflon masters were used to generate multiple replicas of PDMS molds. The PDMS molds contain an outer ridge that fit laser-cut frames made of porous Cerex material. (B) Separate solutions containing myogenic cells and hydrogel proteins were prepared on ice and mixed immediately prior to pipetting into the PDMS mold with frame. (C) Images depicting the appearance of the myobundles during the course of culture. At far left, the cell/hydrogel solution is gelled at 37°C in a tissue culture incubator for 30 min. Following gelation, culture media is added to the well. Within 4 days, the myobundles compact and the edges come away from the PDMS mold. The compacted myobundles are removed from the mold and cultured free-floating. Scale bar = 5 mm.
Figure 1—figure supplement 3
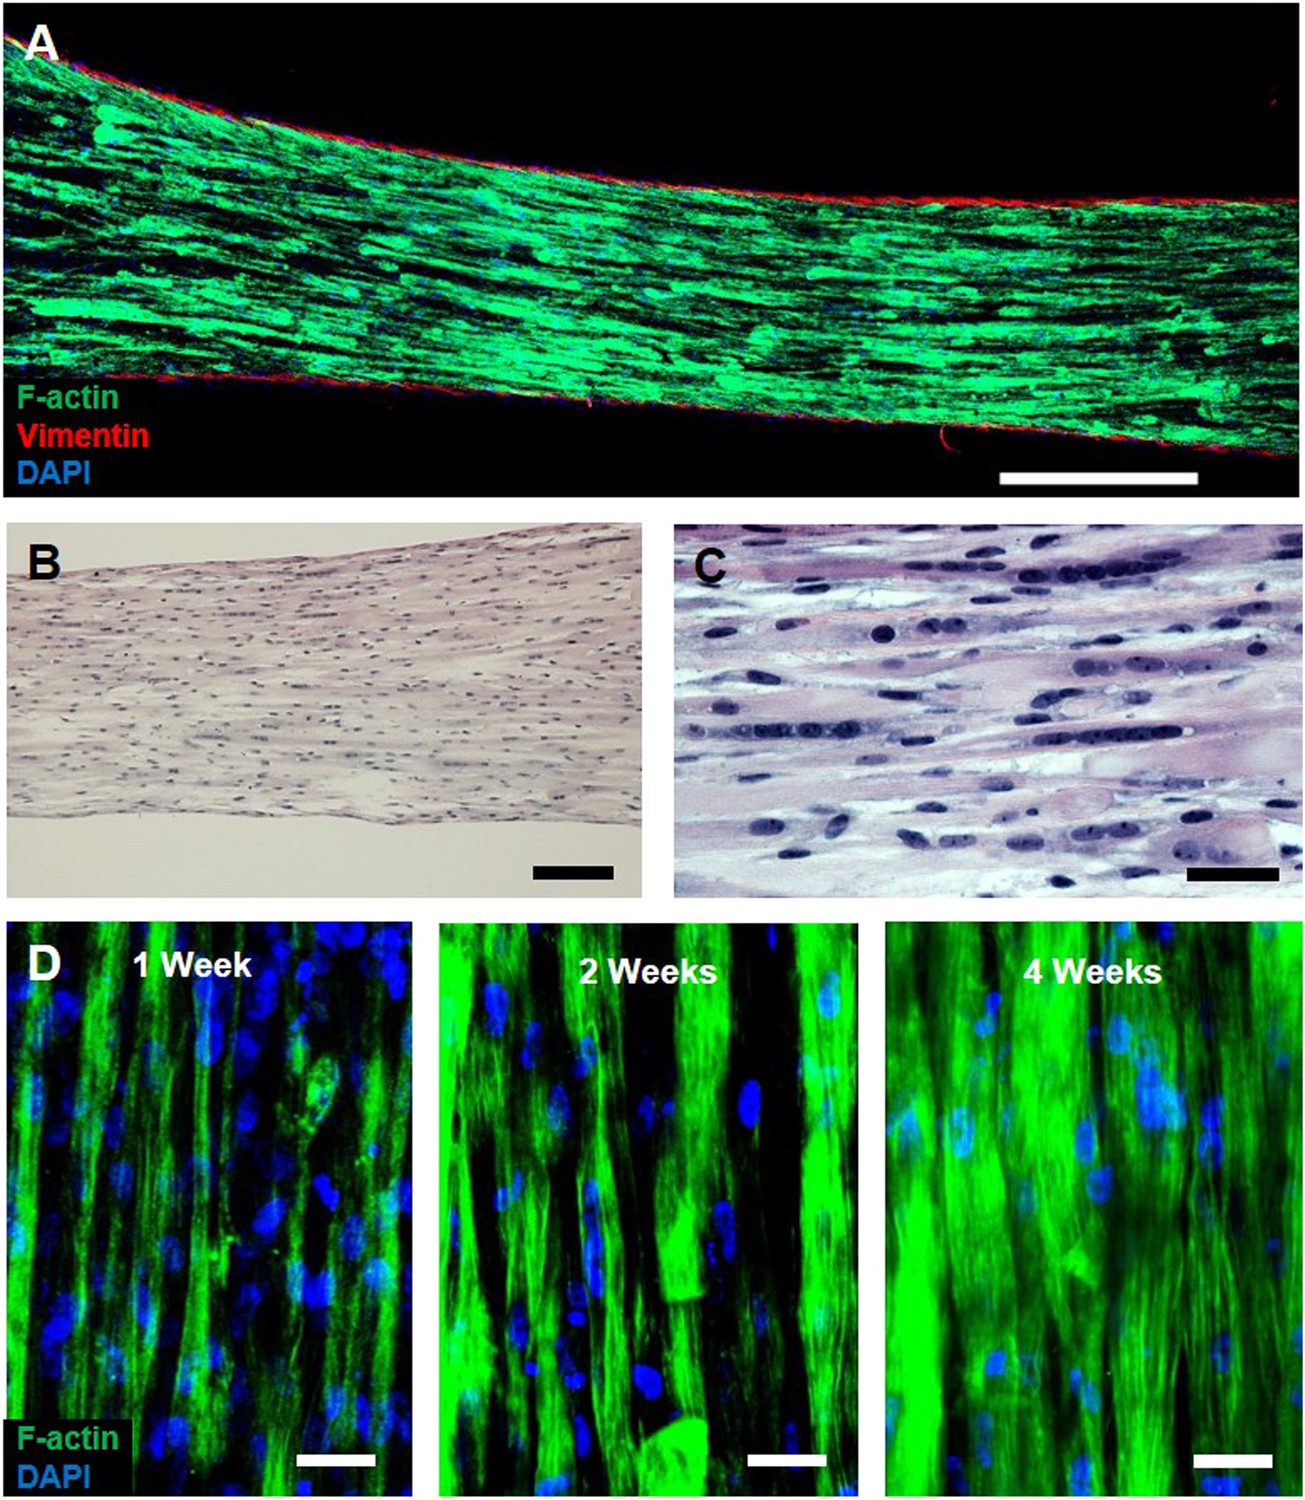
Characterization of myobundle architecture.
(A) Representative composite image of a myobundle consisting of aligned, F-actin+ myofibers surrounded by a layer of vimentin+ fibroblasts on the outer surface. (B and C) Hematoxylin and eosin stain at lower (B) and higher (C) magnification show uniform density of aligned, multinucleated myofibers at 3 weeks of culture. (D) F-actin+ immunostaining shows increased myofiber diameter with time in culture. Scale bars: (A) 500 µm, (B) 200 µm (C and D) = 50 µm.
Figure 1—figure supplement 4
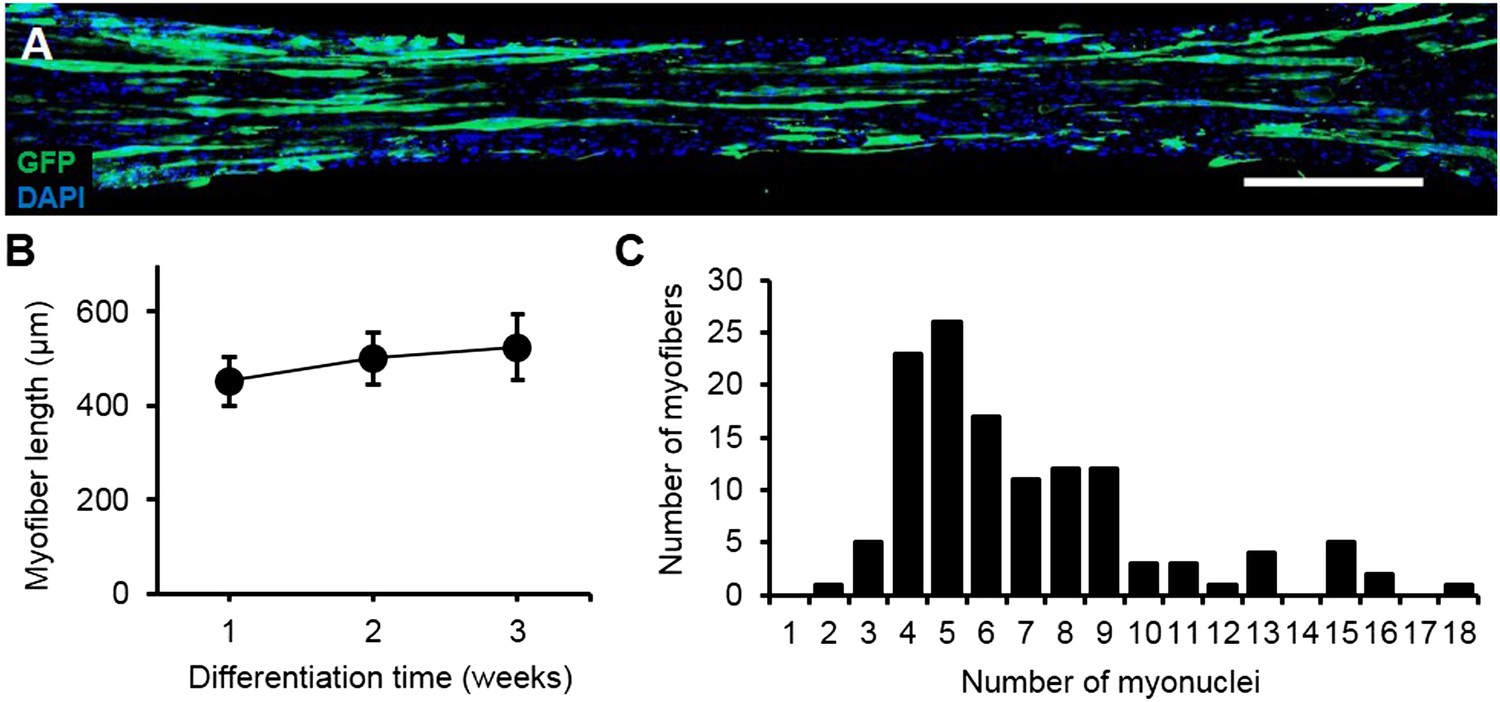
Characterization of myofiber length and myonuclei number.
(A) Representative composite image of a 3-week differentiated myobundle formed using 5% GFP expressing myogenic cells to visualize individual myofibers. Scale bar = 500 µm. (B) The average length of GFP+ myofibers as a function of differentiation time (20–50 myofibers per bundle, n = 4–6 myobundles per time point). (C) Histogram of myonuclei number per GFP+ myofiber in 3-week myobundles with average and median myonuclei numbers of 7 ± 3.6 and 6, respectively (n = 127 myofibers from 6 myobundles).
Figure 2 with 2 supplements

Contractile function of myobundles.
(A) Representative contractile force traces of a 3-week myobundle showing fusion of individual twitches into a stronger tetanic contraction induced by increased stimulation frequency. (B) Representative increase in both contractile (active) force and passive tension with increase in myobundle length for one donor at 3 weeks in culture (n = 3 myobundles). (C) Twitch and tetanus forces increase over time in culture with significant enhancement at 4 weeks vs 1 week (*p < 0.05, n = 4 myobundles). (D) Kinetics of twitch rise and relaxation do not vary over 4 weeks in culture (n = 4 myobundles). (E) Specific twitch and tetanus force and tetanus-to-twitch ratio for different cell sources (D1–D9, donors 1–9; CS, commercial source, Lonza). (F) Kinetics of twitch response for different cell sources.
Figure 2—figure supplement 1
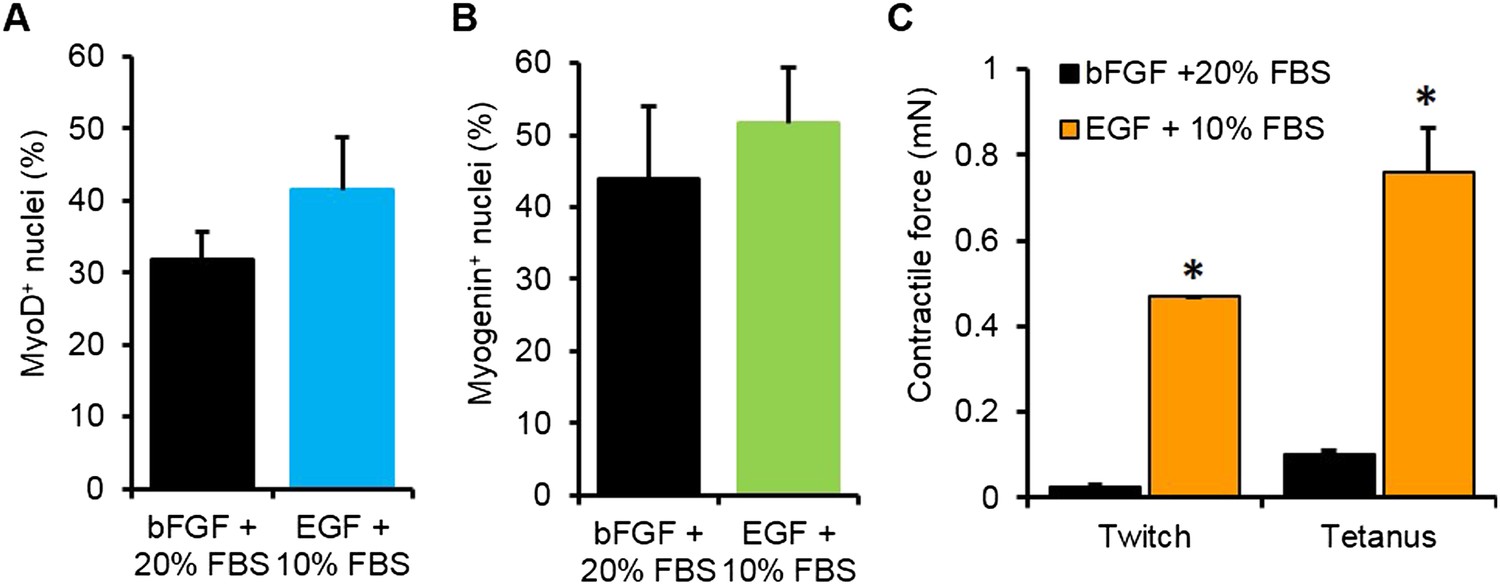
Optimization of myogenic cell expansion using two different media.
(A) Myogenic cells expanded in the two different media containing either bFGF or EGF had similar fractions of MyoD+ cells. (B) Upon differentiation in 2D culture, these cells expressed similar levels of myogenin (n = 3 coverslips) (C) Cells expanded in EGF containing media formed myobundles with significantly higher levels of contractile force than those expanded in bFGF containing media. (N = 2 donors, n = 4 myobundles, *p < 0.05.)
Figure 2—figure supplement 2
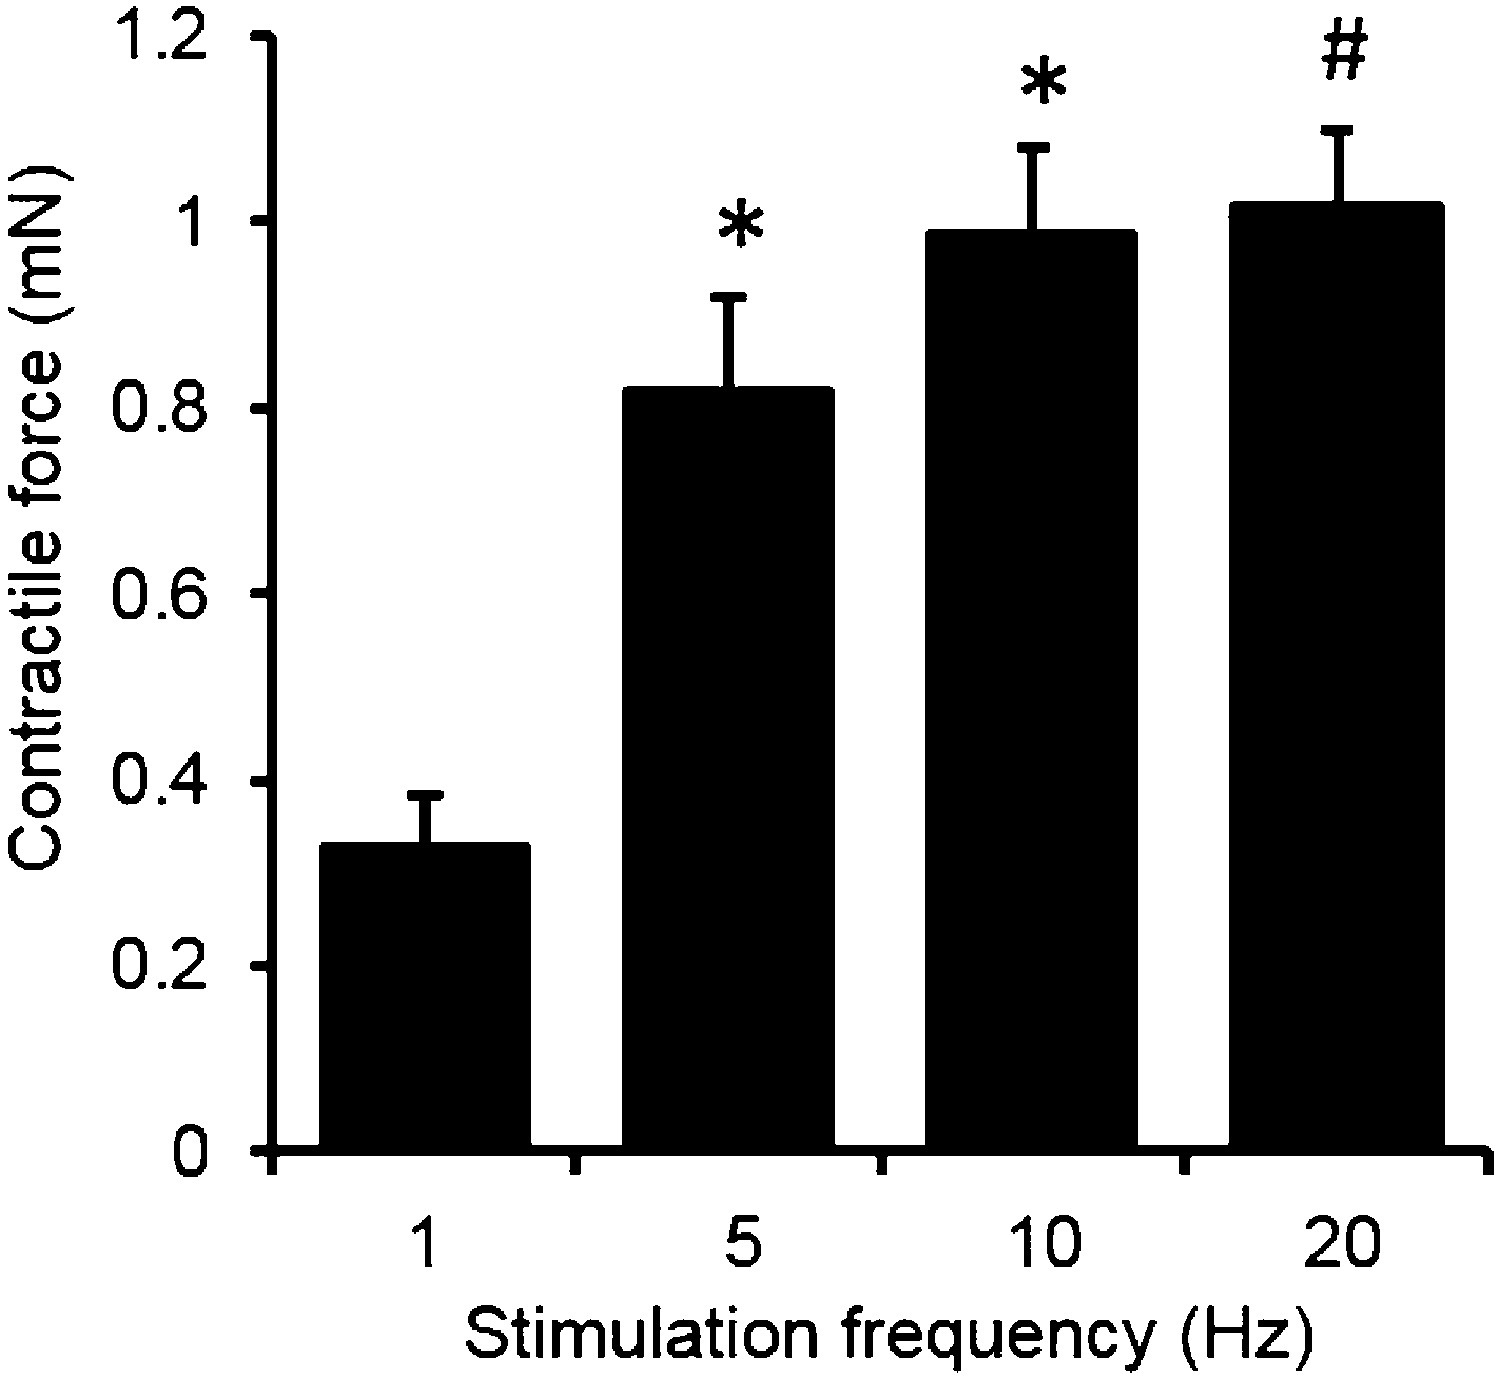
Force-frequency relationship of myobundles.
Contractile force increases with stimulation frequency. (n = 4 myobundles; *p < 0.05 vs 1 Hz; #p < 0.05 vs 1 Hz and 5 Hz.)
Figure 3 with 3 supplements
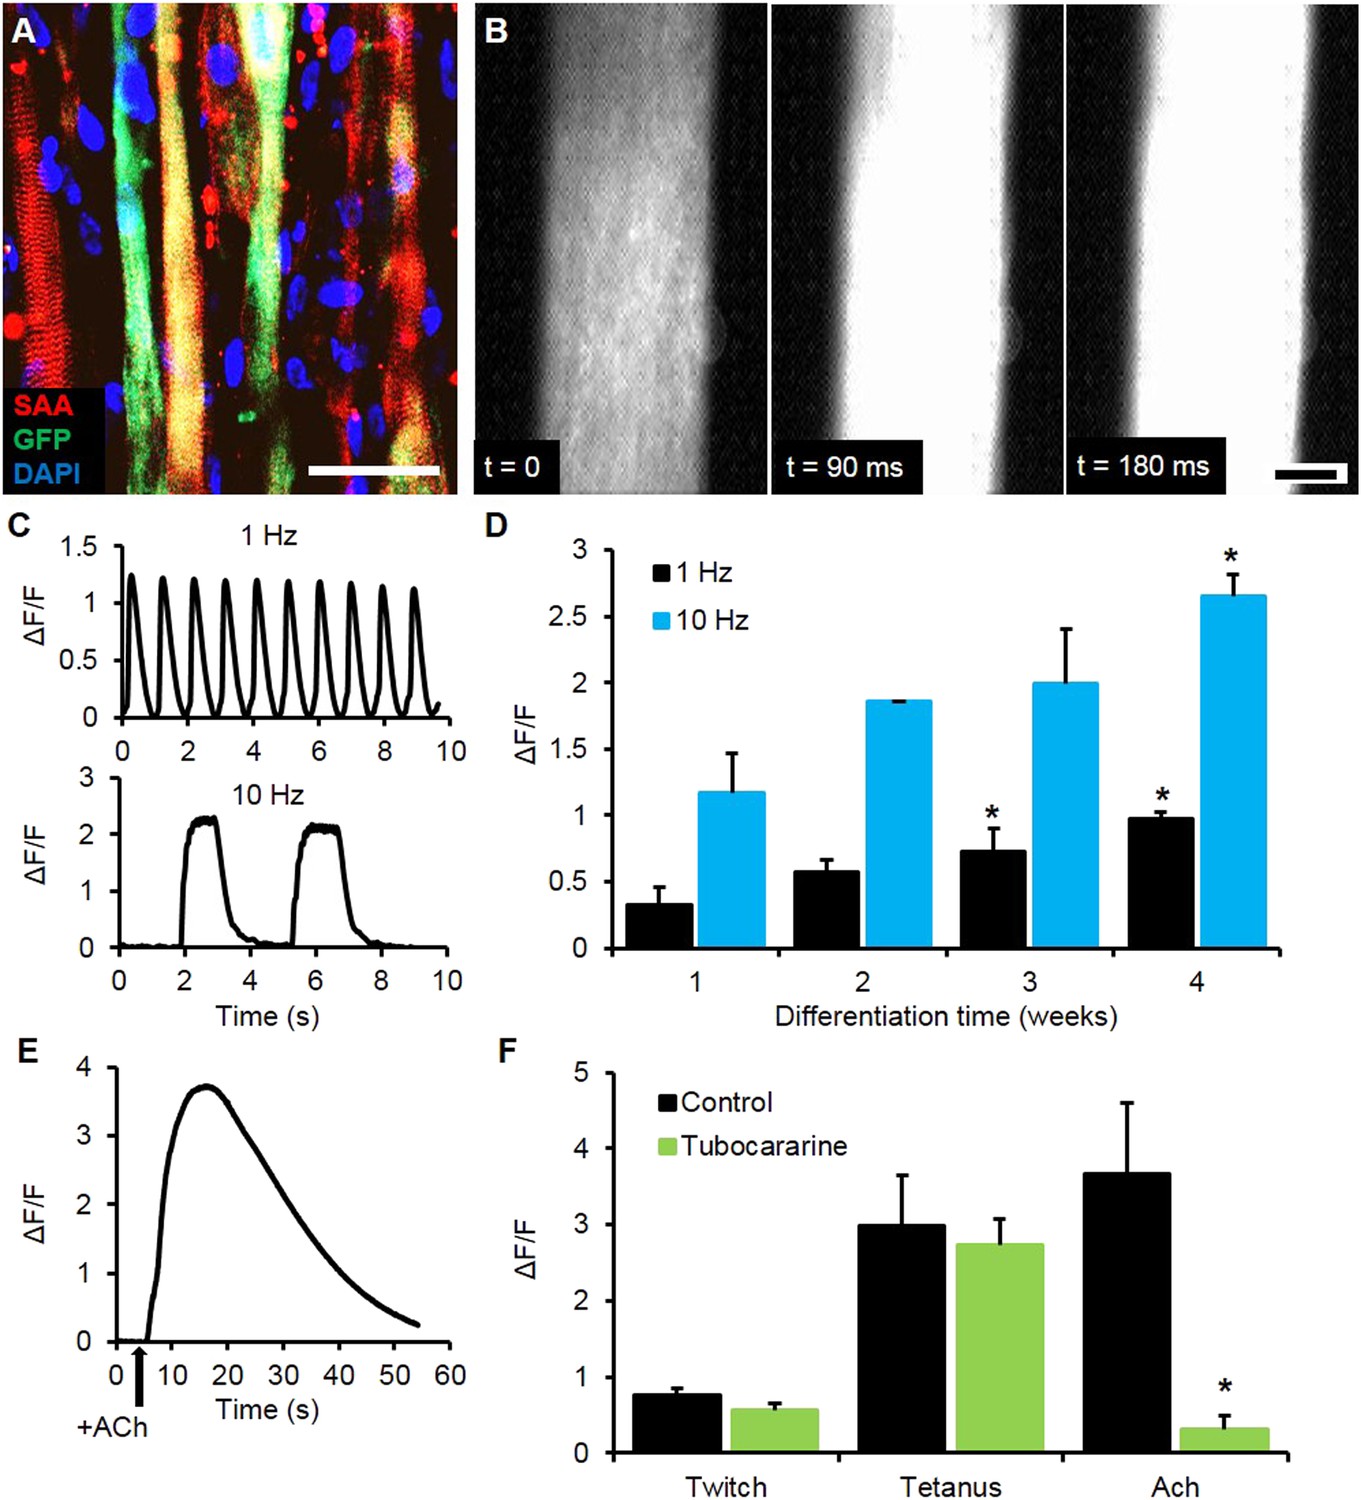
Calcium handling of myobundles.
(A) Myofiber-specific expression of GCaMP6 in lentivirally transduced myobundles. SAA, sarcomeric α-actinin (scale bar = 50 µm). (B) Time course of GCaMP6 fluorescence during a single electrically stimulated twitch (scale bar = 200 µm). (C) Representative fluorescence traces from 1 Hz and 10 Hz stimulations of 2-week old myobundles. (D) Amplitude of electrically stimulated calcium transient increases with time of culture and myobundle maturation (*p < 0.05 vs 1 week, n = 4 myobundles). (E) Representative fluorescence trace of acetylcholine (ACh, 100 mM bolus) stimulated calcium release in a 2-week myobundle. (F) ACh receptor blocker tubocurarine (25 µM) specifically and significantly reduces ACh induced calcium release without affecting electrically stimulated calcium transients (*p < 0.05, n = 5 myobundles). Note that amplitude of Ach-induced calcium release is similar to that of calcium transient induced by tetanic (10 Hz) electrical stimulation.
Figure 3—figure supplement 1
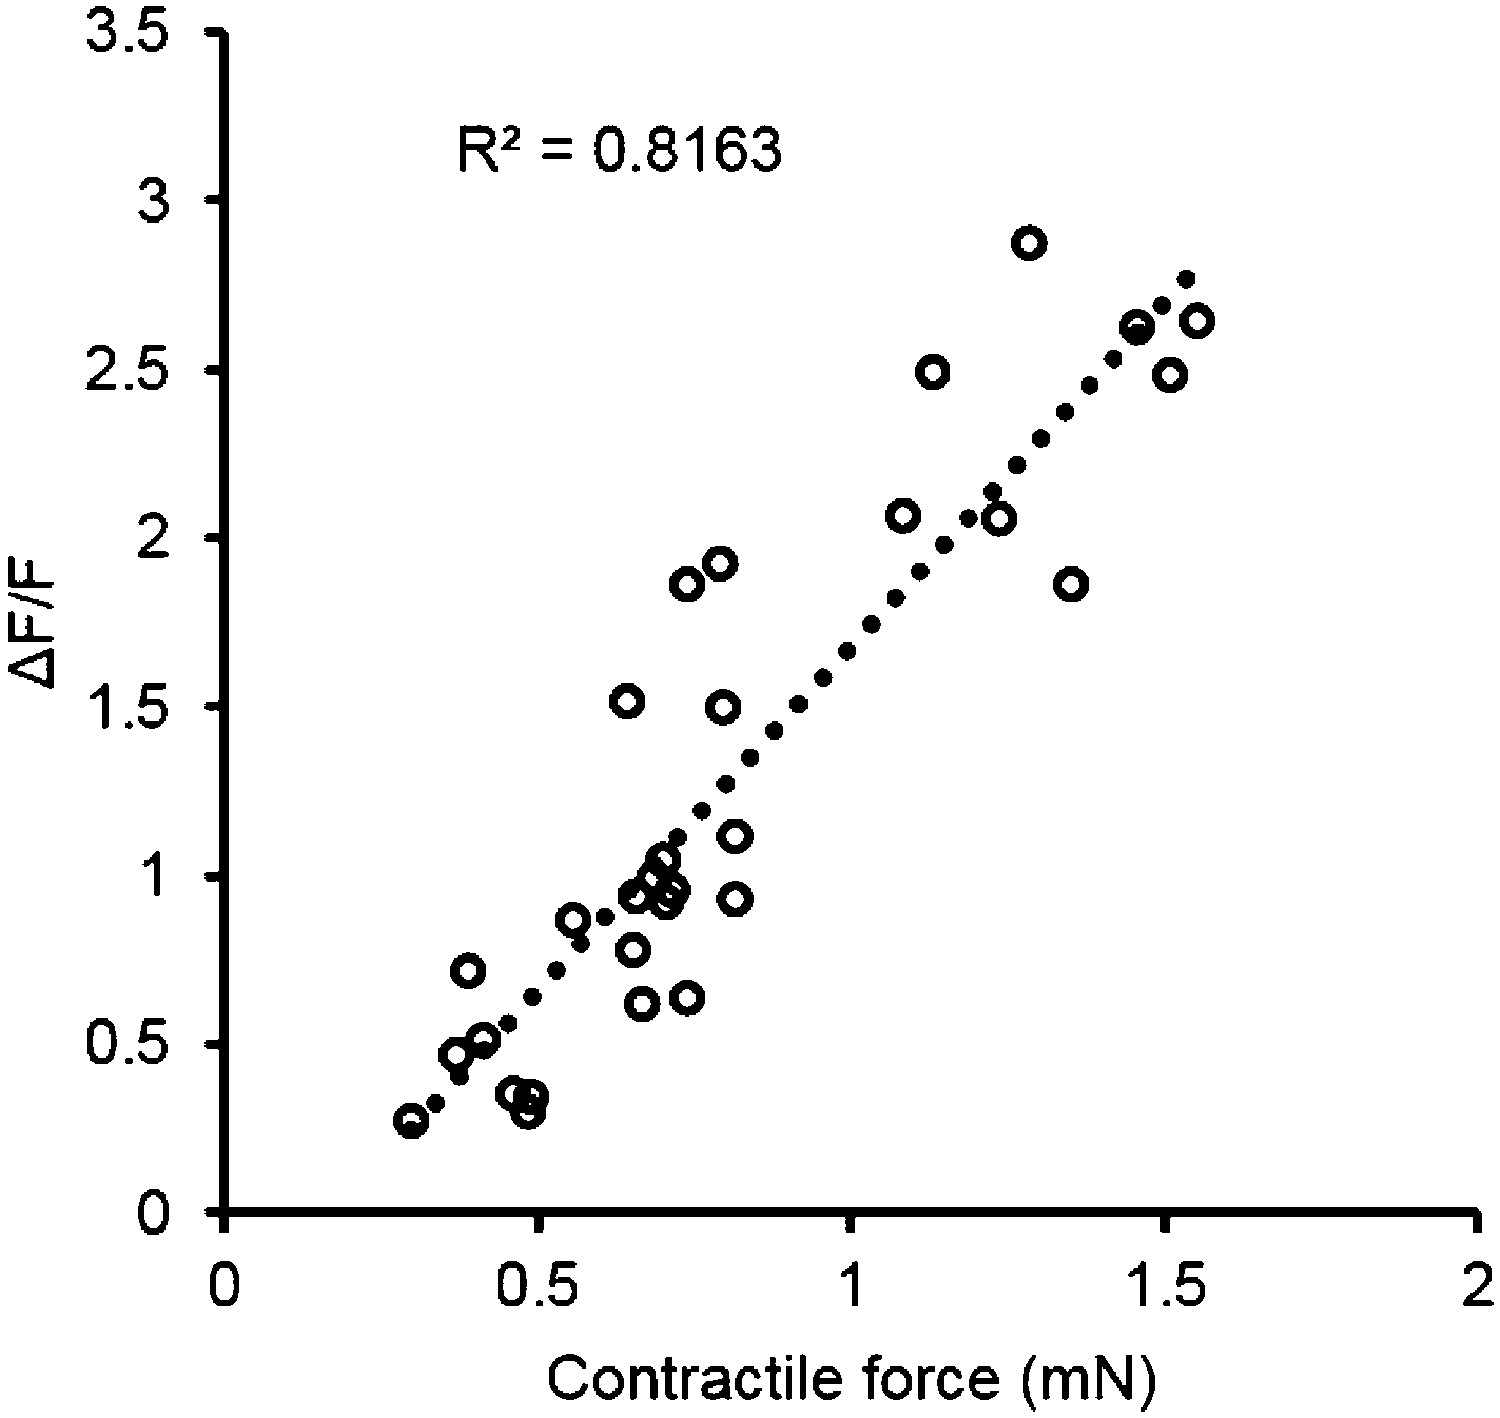
Correlation of contractile force and calcium transients.
Each point represents a single bundle calcium transient plotted against the corresponding force, either twitch or tetanus (at 10 Hz). Data was obtained from myobundles during 4 weeks in culture prepared from the same pool of MHCK7-GCaMP6 transduced myogenic precursors.
Figure 3—figure supplement 2

Caffeine induced calcium transients.
(A) A bolus of caffeine of different concentrations was added to the bath during video imaging and resulted in an increase in relative fluorescence amplitude (ΔF/F). (B) ΔF/F at 30 s following caffeine administration was calculated and positively correlated with caffeine concentration. (Donor A, n = 3 myobundles; Donor B n = 4 myobundles; *p < 0.05 vs 20 mM.)
Figure 3—figure supplement 3
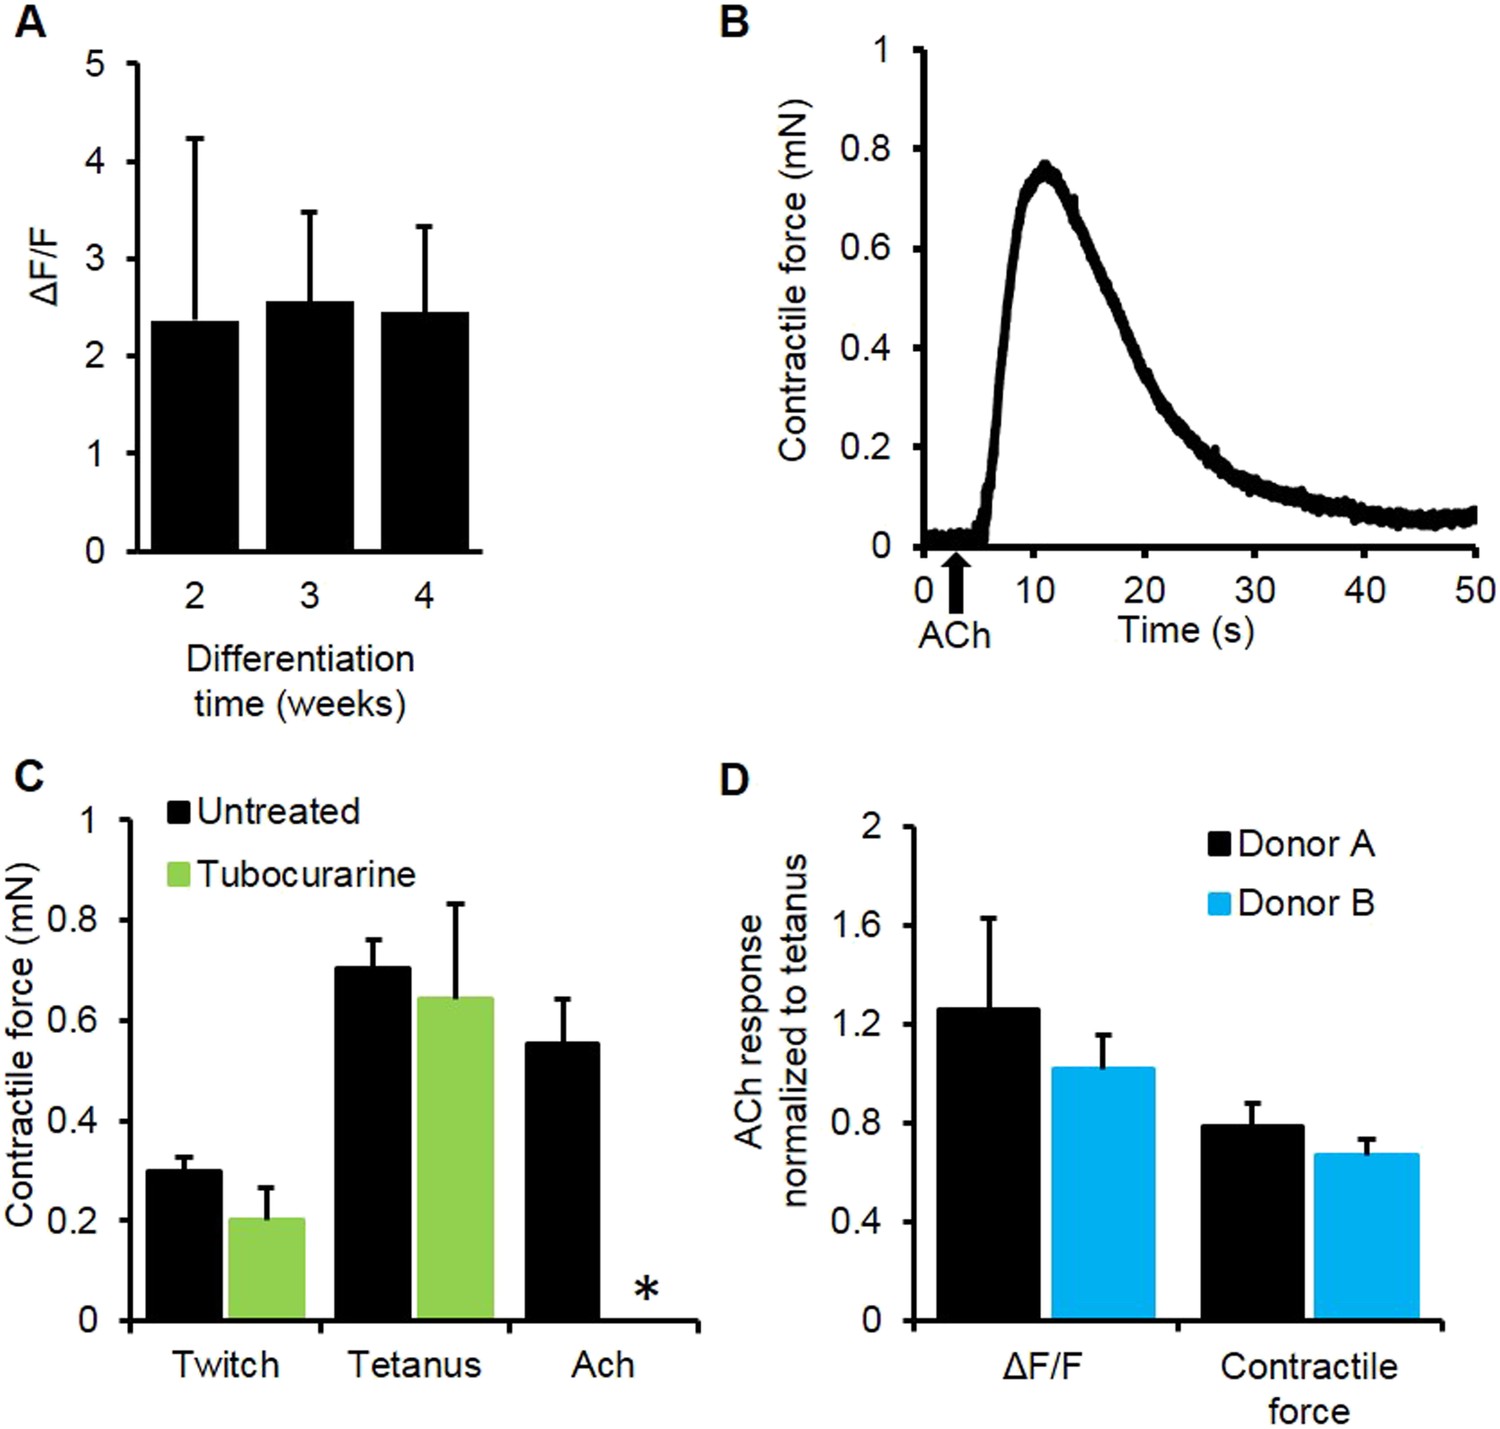
Myobundle response to acetylcholine.
(A) Myobundles exhibited a similar amplitude of calcium release in response to acetylcholine (Ach) throughout 4 weeks in culture (n = 4). (B) Representative trace of contractile force for a 3-week myobundle in response to a bolus of acetylcholine. (C) The amplitude of acetylcholine induced contractile force was similar to that induced by tetanic electrical stimulation. Incubation of myobundles with the ACh receptor blocker tubocurarine reduced acetylcholine induced contractile force without affecting electrically stimulated contraction at 3 weeks in culture (n = 5, *p < 0.05). (D) Amplitudes of calcium and contractile force responses to ACh are similar to those during tetanic electrical stimulation in myobundles from different donors. (A, n = 5 myobundles; B, n = 3 myobundles.)
Figure 4 with 2 supplements
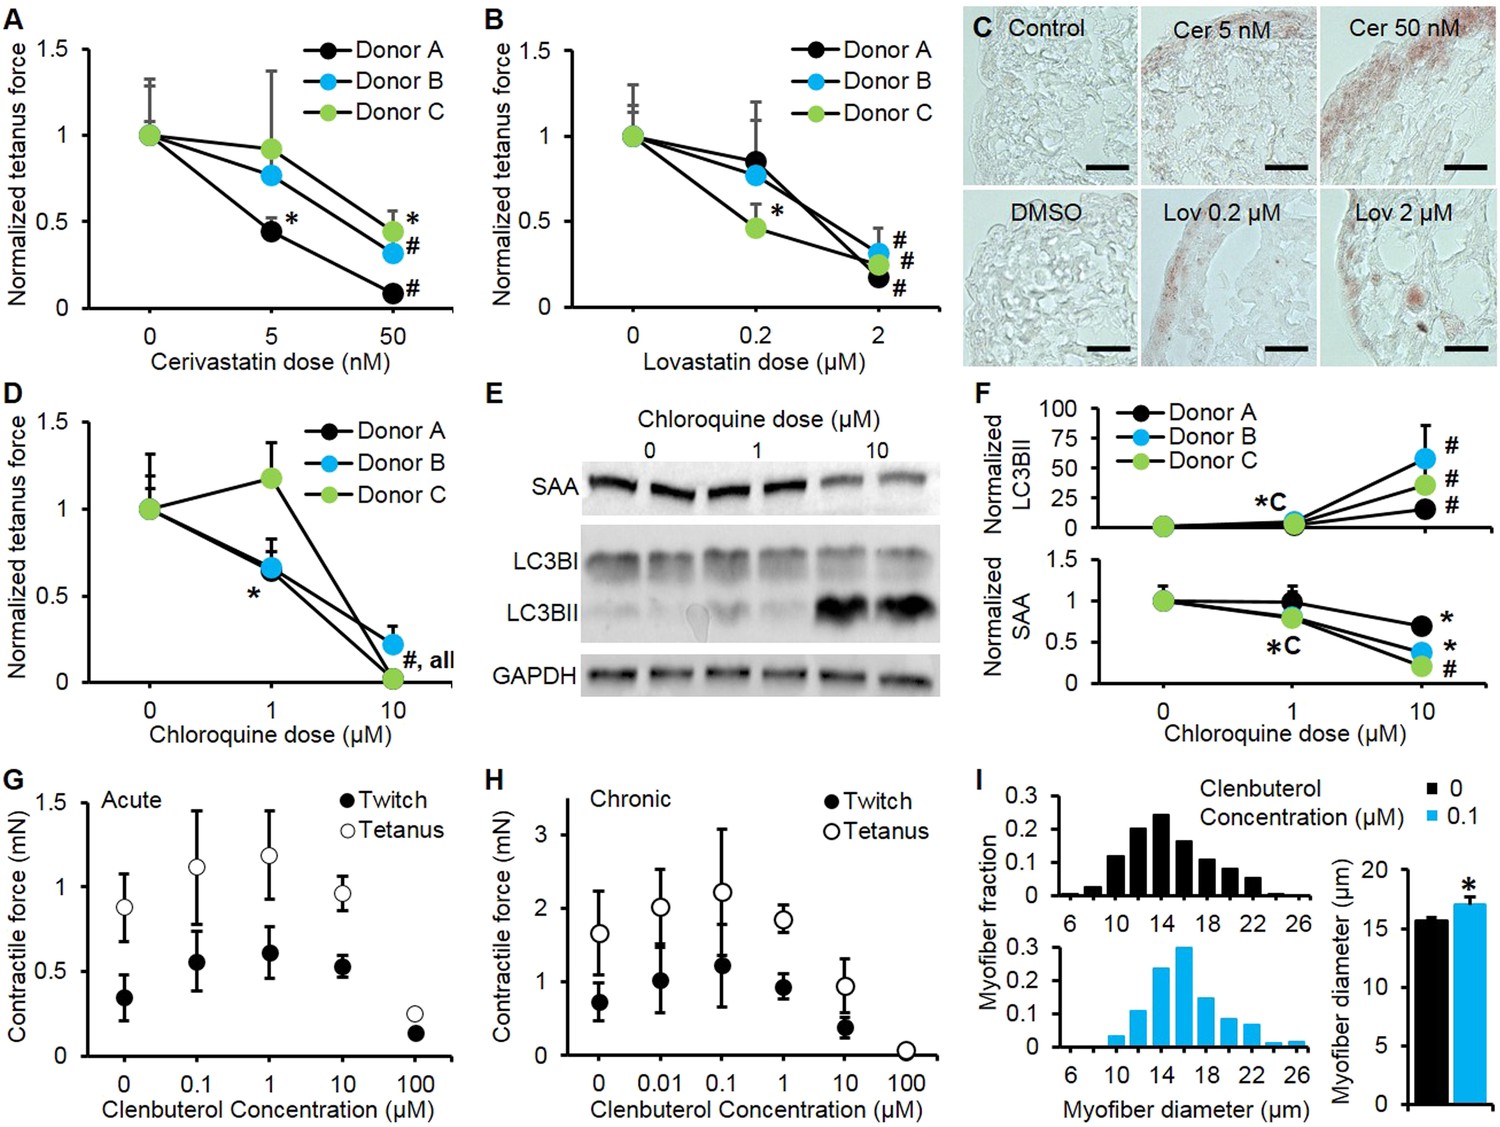
Pharmacological validation of myobundles.
(A and B) 2-week application of cerivastatin (A) and lovastatin (B) at increasing doses significantly reduced tetanus force, normalized to untreated or vehicle treated (DMSO for Lovastatin) control (n = 4 myobundles per donor). (C) Accumulation of lipids in myobundles, evaluated by Oil Red O stain, was absent from controls, moderate at lower concentrations, and considerable at higher concentrations of both statins (scale bar = 50 µm). (D–F) 1-week exposure of myobundles to chloroquine resulted in dose-dependent decrease of contractile force (n = 4 myobundles per donor) (D) as well as increased expression of the autophagic pathway marker LC3B-II and decreased expression of contractile protein sarcomeric α-actinin (SAA) (E–F, n = 4 myobundles per donor). (A–F) (*p < 0.05 vs 0 µM, #p < 0.05 vs all other concentrations). (G) Acute (30-min) and (H) chronic (2-week) application of clenbuterol to myobundles (shown in different donors) results in a dose-dependent increase in contractile force with peak effects observed at 1 µM (acute) and 0.1 µM (chronic) and significant reduction in force generation observed at 100 µM (acute, n = 3 myobundles; chronic, n = 4 myobundles). (I) Chronic administration of 0.1 µM Clenbuterol induced hypertrophy of myofibers as evident from a rightward shift in their diameter distribution and significant increase in the average myofiber diameter (untreated, 15.7 ± 0.3 µm vs 0.1 µM clenbuterol, 17.1 ± 0.6 µm, *p < 0.05, n ≥ 55 myofibers per myobundle, pooled for 3 myobundles).
Figure 4—figure supplement 1
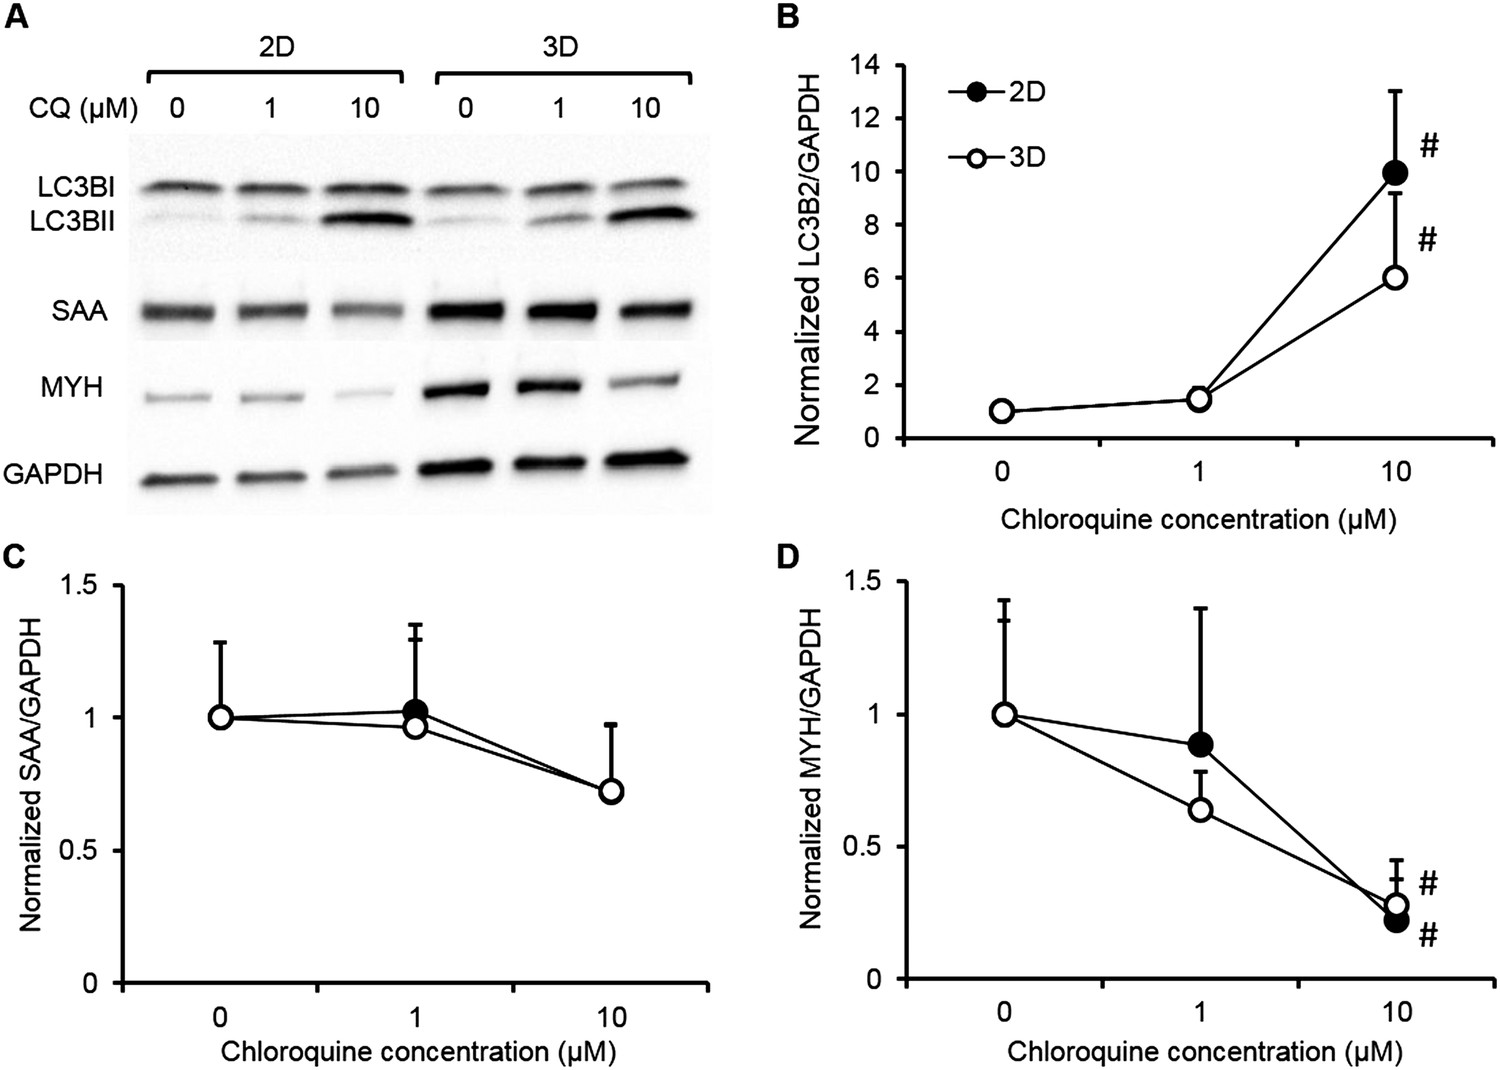
Biochemical responses of human 2D myotube and 3D myobundle cultures to chloroquine.
Human myogenic cells from a single donor were differentiated on 2D Matrigel coated dishes (black) or in 3D myobundles (white) then treated for 1 week with varying doses of chloroquine. The biochemical response of 2D and 3D muscle models were evaluated by western blot (A) and shown to be similar for (B) the dose-depended accumulation of LC3B-II and the reduction of contractile proteins (C) sarcomeric alpha actinin (SAA) and (D) myosin heavy chain (MYH) (n = 4 2D wells or myobundles, #p < 0.05 vs control and 1 µM).
Figure 4—figure supplement 2
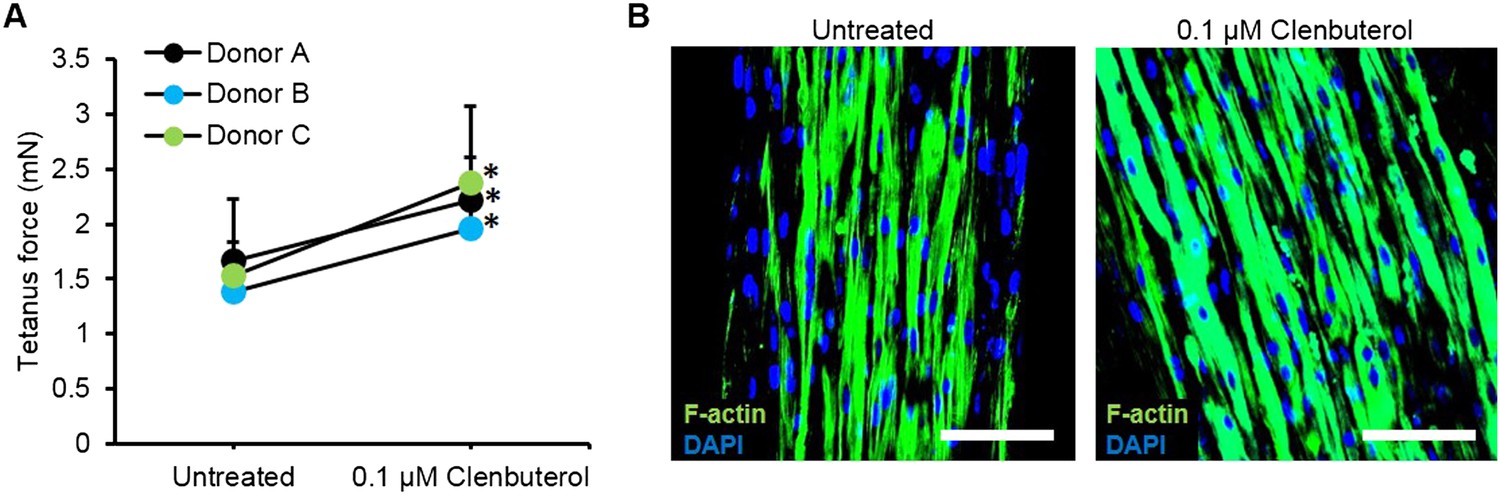
Improved myobundle function following clenbuterol treatment.
(A) Clenbuterol-induced increase in force was reproduced among multiple donors following 2 week treatment (n = 4 myobundles per donor, *p < 0.05). Dose response for donor A is shown in Figure 4H. (B) Clenbuterol increased myofiber diameter, visualized by F-actin staining. Scale bar = 100 µm. Quantification of these immunostainings is shown in Figure 4I.
Videos
Video 1
Spontaneous contractions of human myobundles.
Following 3–5 days of differentiation within the hydrogel construct, myofibers began spontaneously contracting. These contractions typically last for a few days, and are rarely seen beyond 2 weeks following differentiation. Video is shown in real time for 26 s duration and at field of view of 2 × 1.5 mm then 0.8 × 0.6 mm.
Video 2
Stimulated contractions of human myobundles.
Myobundles respond to electrical stimulation by forceful contraction. Here, a myobundle pair is contracting in concert with 1 Hz electrical stimulation with enough force to bend the frame on which it is attached. Video is shown in real time for 17 s duration and at field of view of 25 × 25 mm.
Video 3
GCaMP6 reported calcium release of human myobundles.
Myobundles formed using myogenic precursors that were lentivirally transduced with a GCaMP6 calcium reporter contain myofibers that produce fluorescence signal in response to calcium release. Here, myobundles show calcium release in response to both twitch (1 Hz) and tetanus (10 Hz) electrical stimulation. Video is shown in real time for 36 s duration and at field of view of 500 × 500 µm.
Video 4
Caffeine induced calcium release in human myobundles.
Similar to human skeletal muscle, application of caffeine to myobundles induces calcium release via the ryanodine receptors. This lease to an increase in fluorescence from the GCaMP calcium reporter. Video is shown in real time for 66 s duration and at field of view of 2 × 2 mm.
Video 5
Acetylcholine induced calcium release from human myobundles.
Function of myobundle acetylcholine receptors was confirmed by GCaMP6 detected calcium release in response to a bolus of 10 mM acetylcholine. Myobundle response to acetylcoline was significantly blocked by the muscle relaxant tubocurarine similar to that observed clinically in human skeletal muscle. Video is shown in real time for 75 s duration and at field of view of 2 × 2 mm.
Additional files
-
Source code 1
Source code for analysis of contractile force in MATLAB.
- https://doi.org/10.7554/eLife.04885.023
Download links
A two-part list of links to download the article, or parts of the article, in various formats.
Downloads (link to download the article as PDF)
Open citations (links to open the citations from this article in various online reference manager services)
Cite this article (links to download the citations from this article in formats compatible with various reference manager tools)
Bioengineered human myobundles mimic clinical responses of skeletal muscle to drugs
eLife 4:e04885.
https://doi.org/10.7554/eLife.04885


