Systematic imaging reveals features and changing localization of mRNAs in Drosophila development
- Max Planck Institute of Molecular Cell Biology and Genetics, Germany
- University of Veterinary Medicine Vienna, Austria
- Janelia Research Campus, Howard Hughes Medical Institute, United States
Figures
Figure 1 with 2 supplements
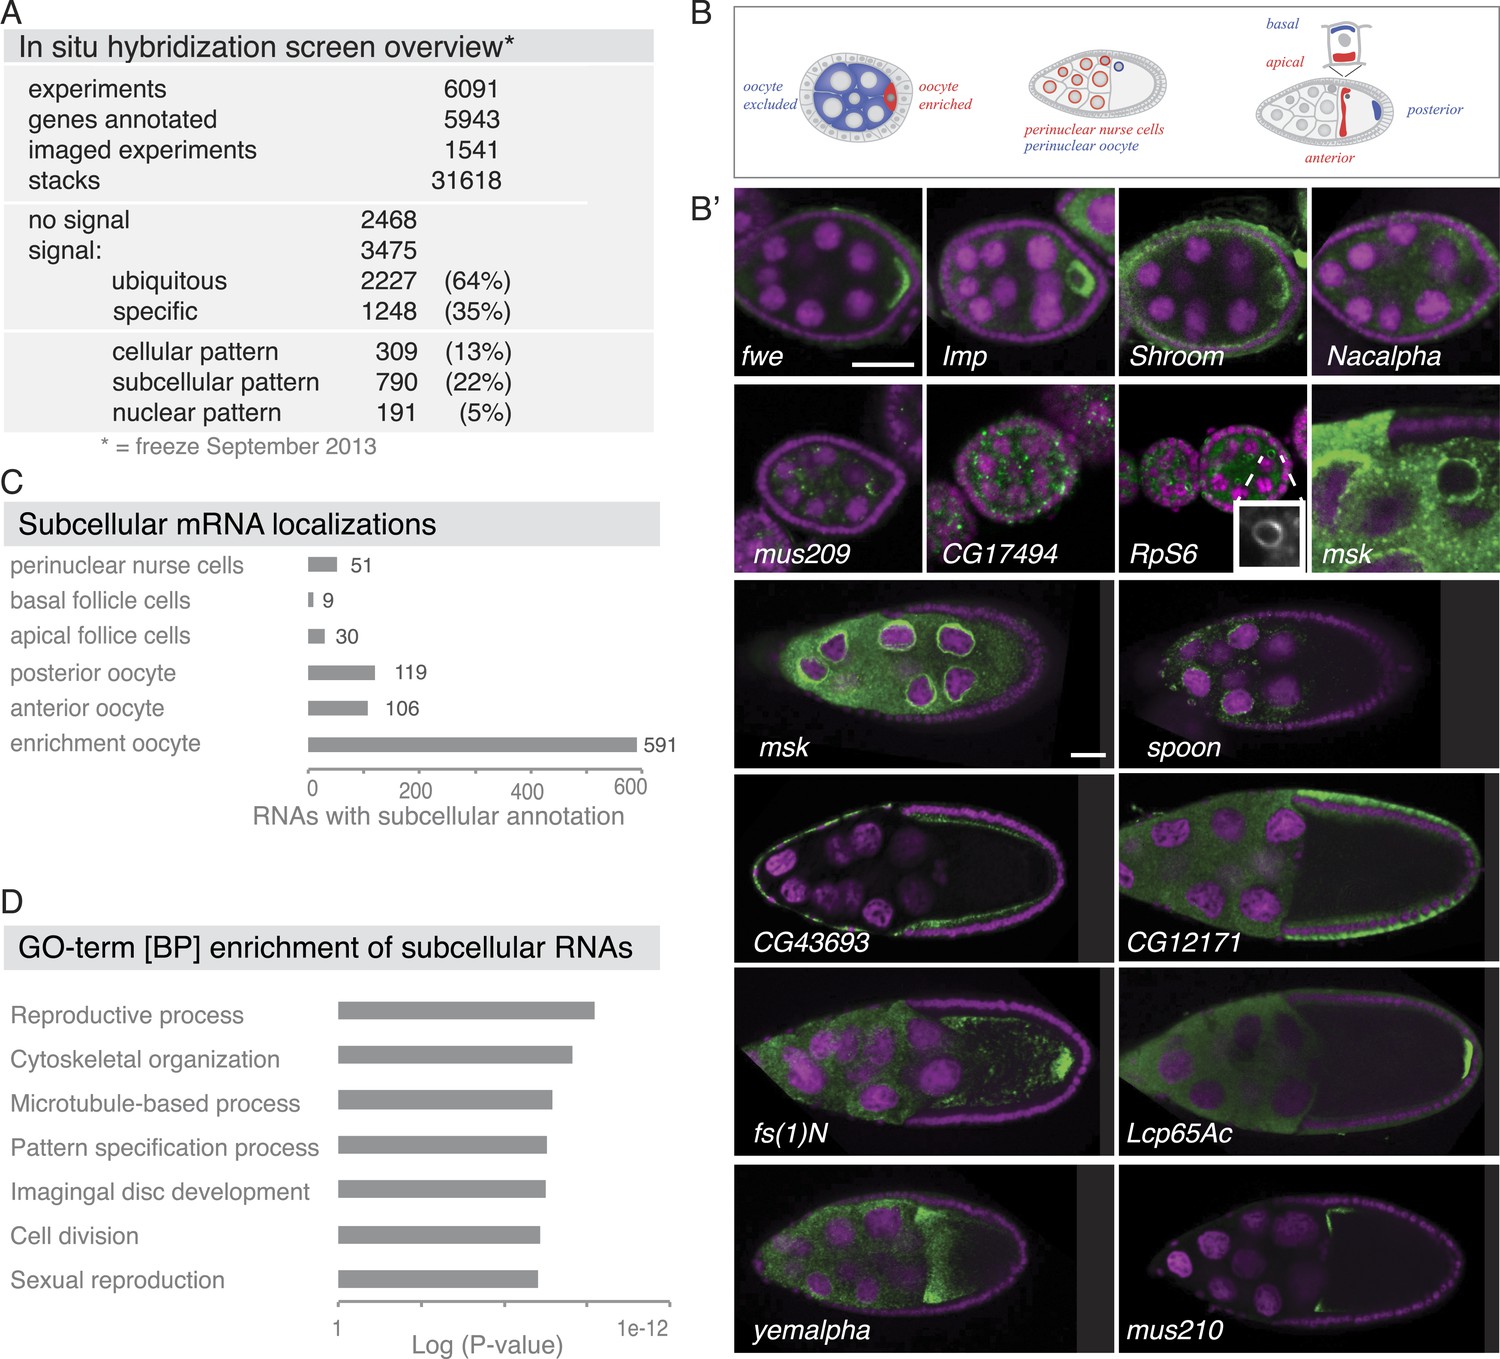
Summary of the fluorescent in situ hybridization (FISH) screen in ovaries.
(A) Summary of key numbers of the screen. For each of the 6091 FISH experiments, we annotated the signal as no signal, ubiquitous, or specific. Specific and some ubiquitous signals were imaged. (B) Schematic of exemplary subcellular expression patterns. (B′) Exemplary subcellular expression patterns. In the syncytial early egg-chamber, 591 mRNAs are transported from the site of transcription in the nurse cells into the developing oocyte: mRNAs are either restricted to a cortical domain (fwe) or detectable in the entire ooplasm (Imp). mRNAs also simultaneously enriched in the oocyte portion of the syncytial egg-chamber and at the apical membrane of the somatic epithelial cells (Shroom). Five mRNAs were specifically excluded from the oocyte portion and enriched in the nurse cells (Nacalpha). Few mRNAs were enriched anterior in stage 2–7 oocytes (mus209). mRNAs showed ubiquitous granules in the cytoplasm (CG17494) or rarely ring-like staining patterns (RpS6, inset [10 × 10 μm] showing only the RNA channel). mRNAs enriched around the nucleus of the oocyte and/or the nurse cells (msk) varying from a ring around the entire nucleus to restricted localization in sub-areas of the perinuclear space (spoon). Apical enrichment (CG43693) or basal localization (CG12171) was detected in late epithelial somatic cells. Anterior and posterior RNA localization varied between diffuse (fs(1)N, yemalpha) and tight cortical enrichments (Lcp65Ac, mus210). (C) Distribution of subcellular localized mRNAs in subcategories. Note: mRNAs can appear in more than one subgroup. (D) GO-term enrichment analysis of ubiquitous, cellular, nuclear, and subcellular gene sets.
Figure 1—figure supplement 1

Experimental outline and database features.
(A) Overview of the experimental procedure for transcriptome and genome-wide in situ hybridization experiments and evaluation. (B) Screenshot of the publicly available Dresden ovary table, DOT, and key search and download functions.
Figure 1—figure supplement 2
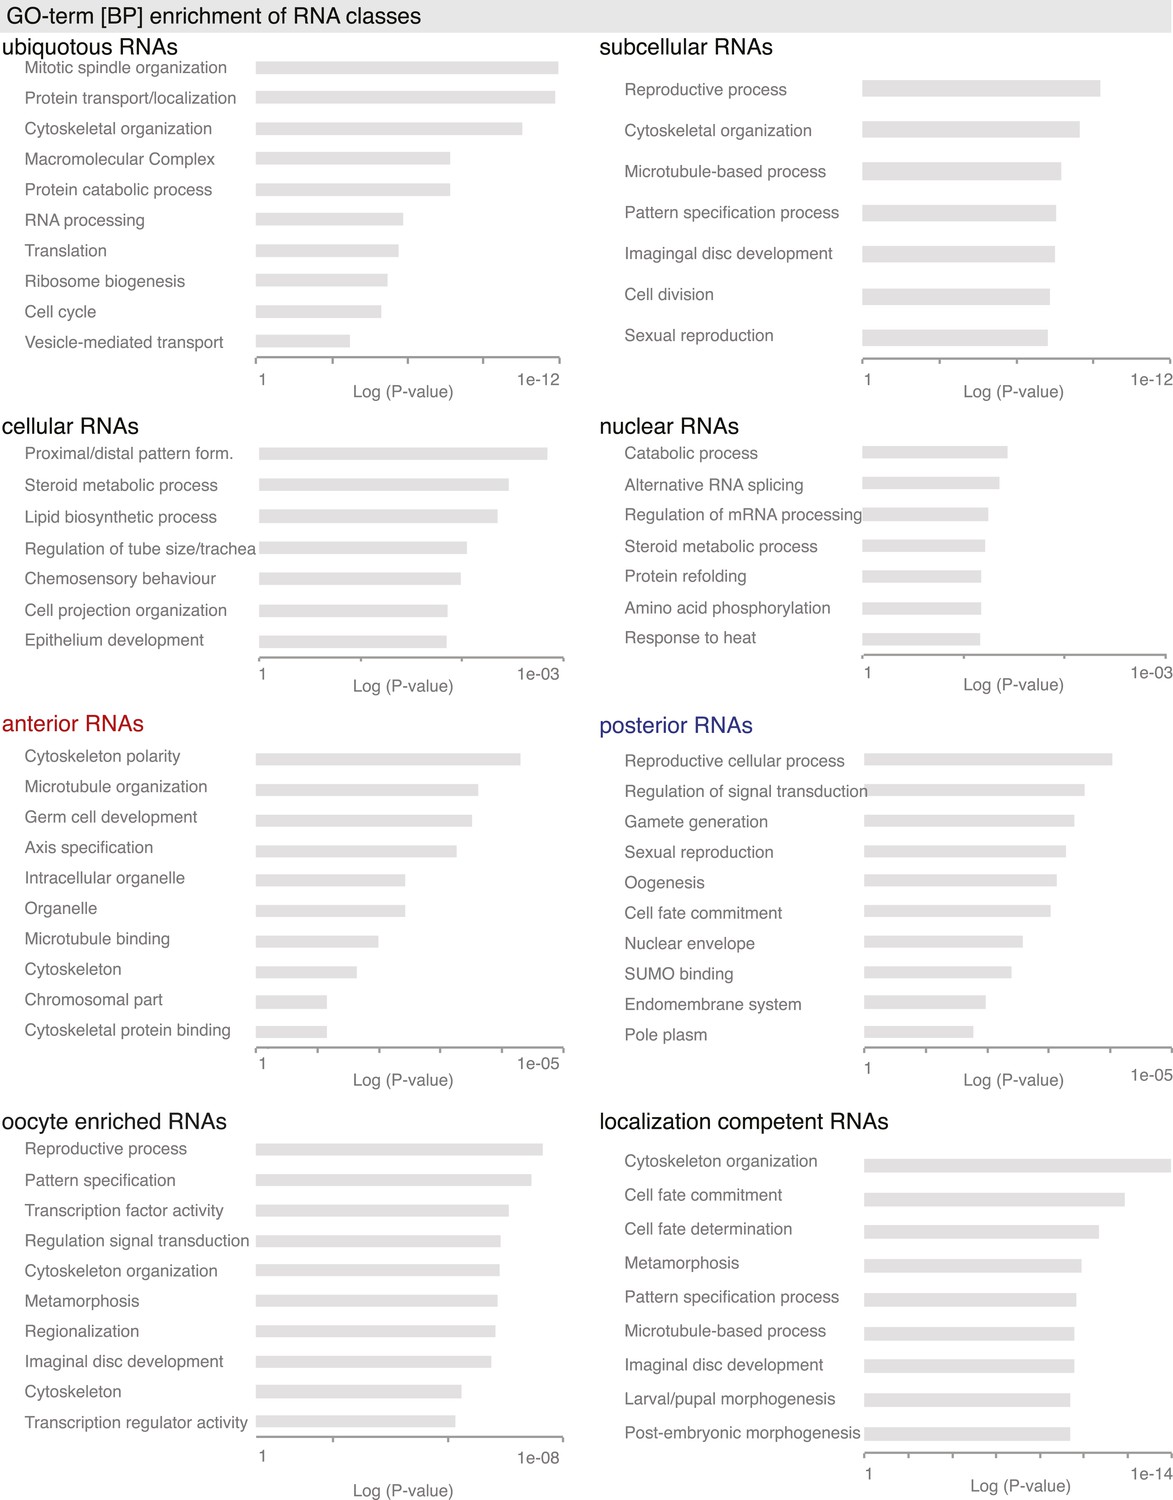
GO-term enrichment analysis for gene sets.
GO-terms associated with ubiquitous, subcellular, cellular, nuclear, oocyte enriched, anterior and posterior gene sets. Shown is also analysis of all ‘localization competent’ mRNAs. Bar plots show the p-values for each GO-term calculated by the modified Fisher Exact test, which results in the EASE score p-value.
Figure 2 with 1 supplement
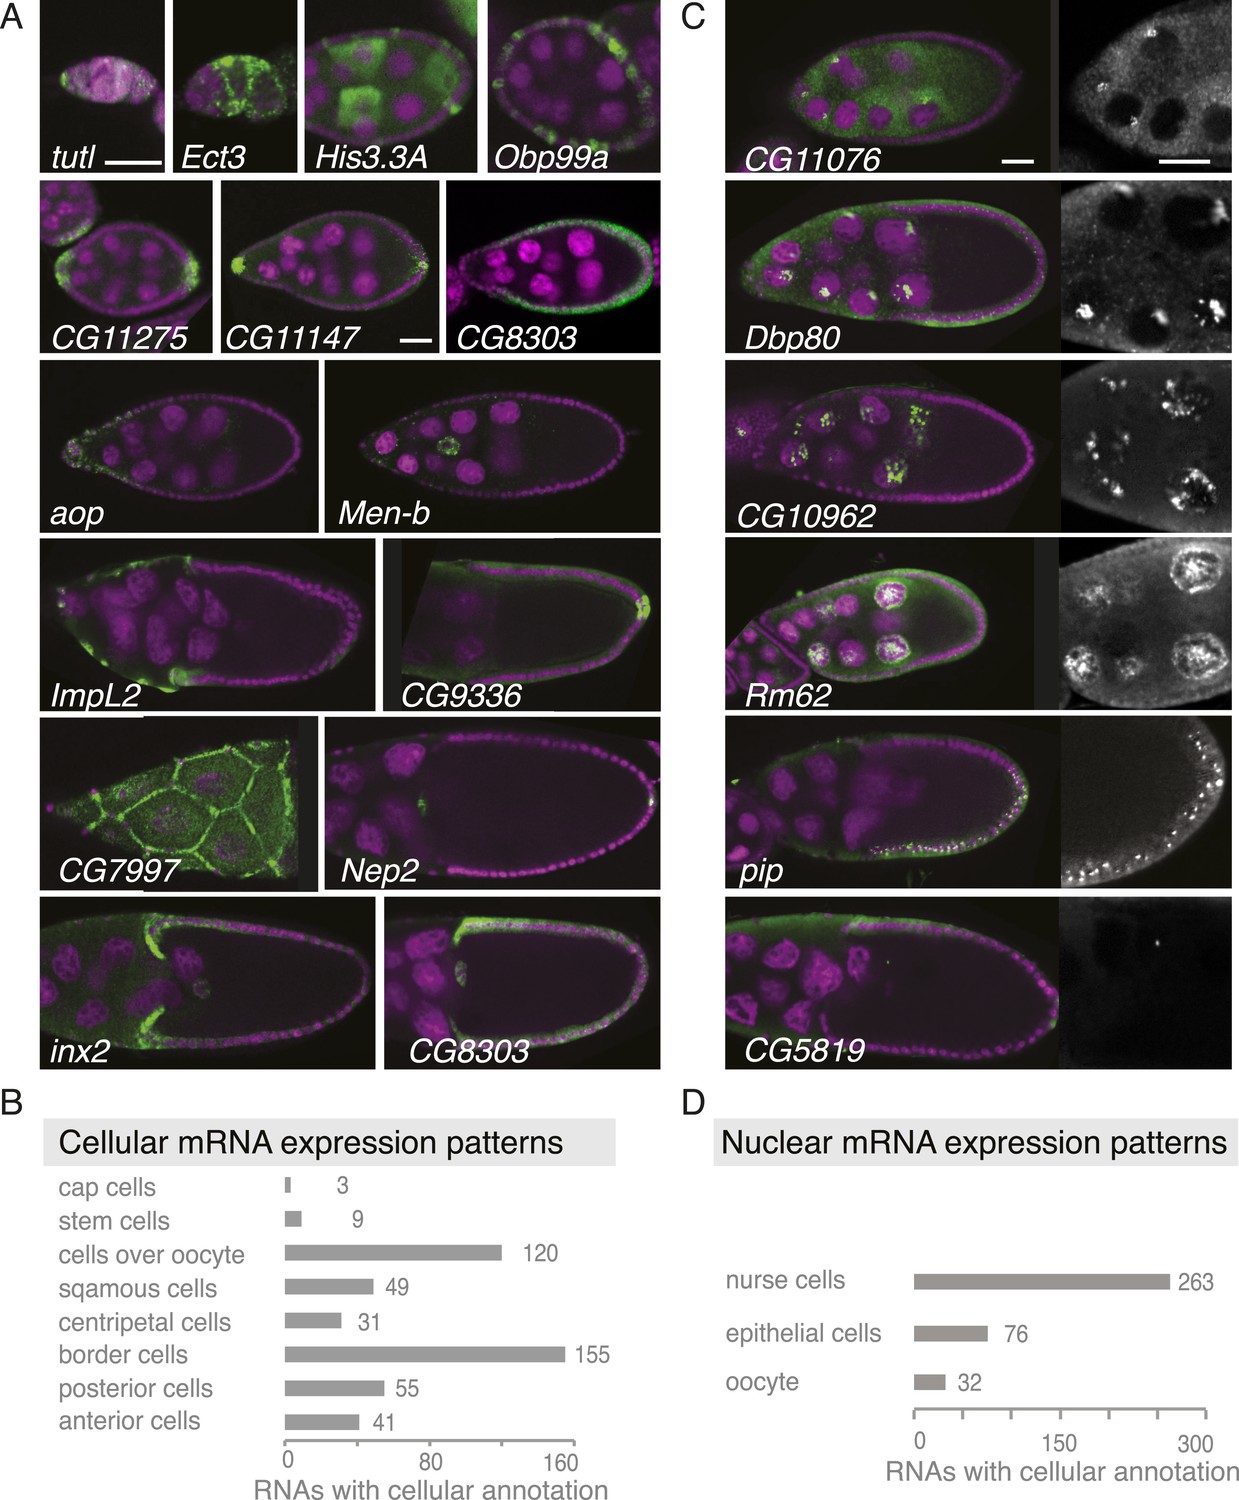
Summary of cellular and nuclear expression patterns.
(A,C) Exemplary FISH experiments for the cellular (A) and nuclear (C) expression sets. RNA is shown in green and the DNA (labelled with DAPI) is shown in magenta. Scale bars: 30 μm. (A) tutl is expressed in cap cells at the tip of the germarium, while Ect3 mRNA is detectable in the somatic epithelial cells of the germarium. Several mRNAs are expressed in mosaic pattern, indicating cell cycle control in somatic epithelial cells (His3.3A, Obp99a) and in nurse cells (His3.3A). Expression in the anterior and posterior follicle cells is often seen simultaneously (CG11275, CG11147, Nep2). Some mRNAs were expressed only in anterior follicle cells that become migratory border cells (Men-b) or in posterior follicle cells (CG9336). CG8303 is expressed in the somatic cells destined to become columnar epithelium. aop is exclusively seen in follicle cells that will give rise to the squamous epithelium and several mRNAs are specifically expressed here at later stages (ImpL2, CG7997). mRNAs are also expressed in cells forming the border of columnar and squamous epithelial cells (inx2). (C) Nuclei enrichments of RNAs in nurse cells varies from a ring-like expression (CG11076) to foci in a discrete area (Dbp80), widespread foci (CG10962), or nucleoplasm signal (Rm62). RNAs are also detectable in epithelial cell nuclei (pip) and for 28 RNAs also in the oocyte nucleus (e.g., CG5819). Greyscale image shows the respective RNA staining only in a zoomed-in view. (B) The cellular gene set was subcategorized according to the specific cellular expression pattern. Individual mRNAs can fall into several of these subgroups. (D) Instances of nuclear RNA enrichments in nurse cells, epithelial cells, and the oocyte.
Figure 2—figure supplement 1
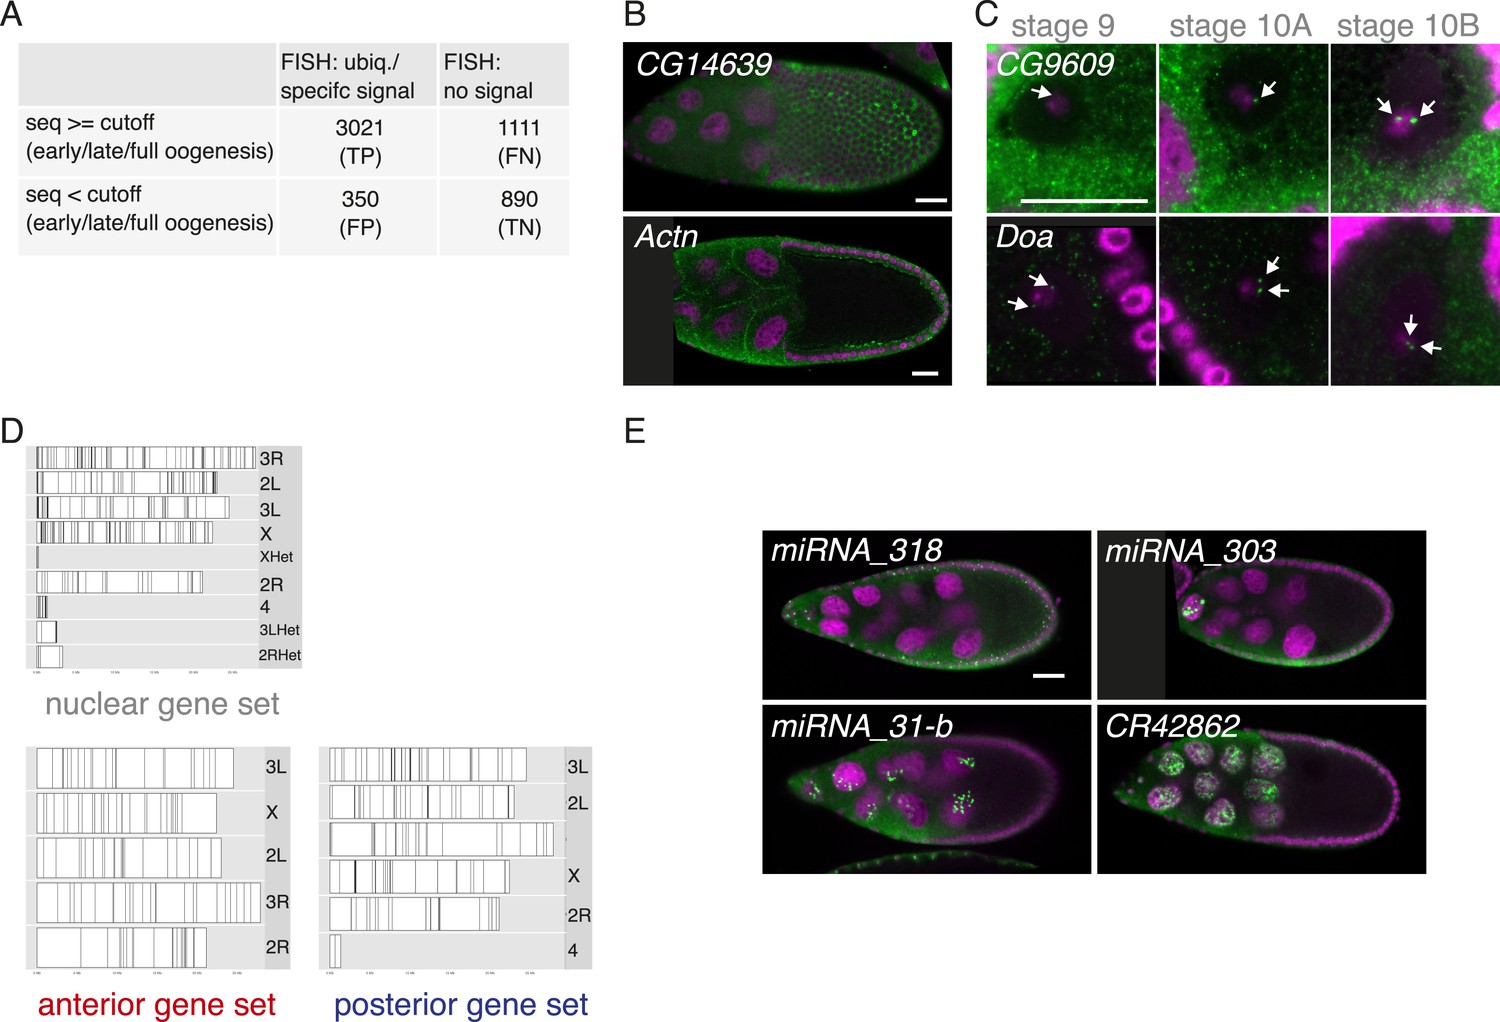
FISH screen results and controls.
(A) Estimate of false-positive/negative rate of the in situ screen using comparison with the independent transcriptomics data. A gene was classified as falsely positive if it was annotated as ubiquitous or specific by FISH but was not detectable by either 3Pseq or RNAseq at any time-point of oogenesis. In 20% of the experiments we failed to detect in situ signal (‘no signal’) although the transcript was detected at least at one time point by at least one deep sequencing method. These may represent false negative results, possibly due to non-functional RNA probes, however, we nevertheless included them in the downstream analysis in the no signal category. (B) mRNA enrichments in the somatic epithelial cells overlaying the oocyte (CG14639) and at the cortex of nurse cells (Actn). RNA signal shown in green. DNA, labelled with DAPI, is shown in magenta. Scale bar 30 μm. (C) CG9609 and Doa mRNAs detected in the oocyte nucleus showing the enrichment over time at stages 9, 10A and 10B. At stage 9 only few small mRNA foci are visible, at stage 10 the mRNAs were enriched in proximity of the DNA in two large foci (see arrows). (D) Karyogram showing the chromosomal position of genes for nuclear, anterior, and posterior RNA localization classes. Neither nuclear RNA genes, which often appear in foci-like enrichments nor anterior or posterior class genes appear clustered on the chromosome. (E) Examples of FISH experiment detecting distributions of non-coding RNA (in green). While pri-miRNA-318 is enriched in somatic epithelial cell nuclei, pri-miRNA-303, pri-miRNA-31-b and the long non-coding RNA CR42862 are restricted to nuclei of the germline nurse cells. Scale bar 30 μm, DNA in magenta.
Figure 3 with 5 supplements
Localized mRNAs show gene set specific features.
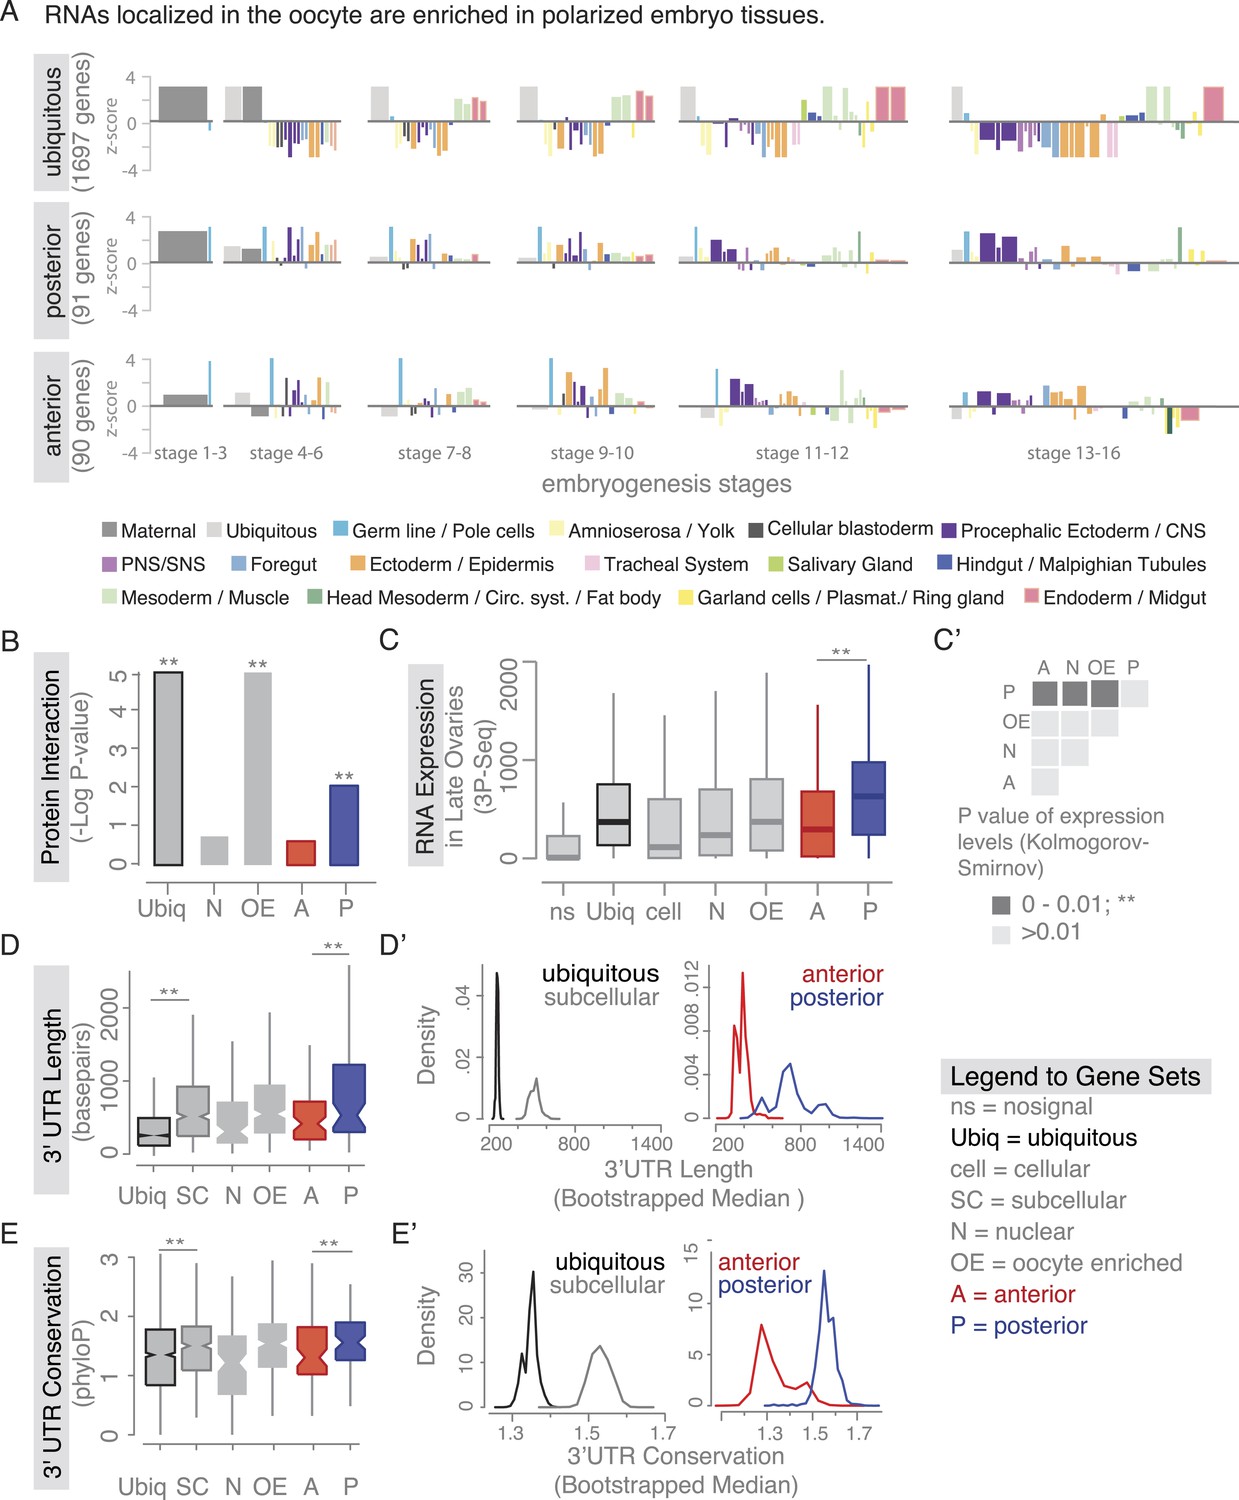
(A) Linear hierarchy plot (Tomancak et al., 2007) showing stage- and tissue-specific re-expression of the ovary gene sets in embryogenesis. (B) Protein interaction analysis per gene set revealed that posterior genes, but not anterior genes, share significantly more protein–protein interactions than would be expected by chance. (C) Boxplot showing the median mRNA expression level is significantly higher in the posterior gene set compared to anterior mRNAs (C′: Kolmogorov–Smirnov p-value: 3.9e-06). Shown are 3Pseq quantifications from late ovary mRNA (for early, full ovaries and early embryogenesis see Figure 3—figure supplement 2A). For description of gene sets see Supplementary file 1. (D–E) Distributions of median 3′UTR length (D) and conservation of the 3′UTR sequence (E, across 24 Drosophila species) for gene sets. (D′–E′) Results of a non-parametric randomization test to show that (D′) ubiquitous and subcellular genes (p-value = 0) and anterior and posterior genes (p-value = 0.0018) have significantly different median 3′UTR lengths (i.e., no or little overlap of densities) and (E′) that ubiquitous genes are significantly less conserved in their 3′UTRs than subcellular genes (p-value: 0) and posterior genes show higher conservation than anterior genes (p-value: 0.0032).
Figure 3—figure supplement 1
Ovary gene sets have specific expression patterns during embryogenesis.
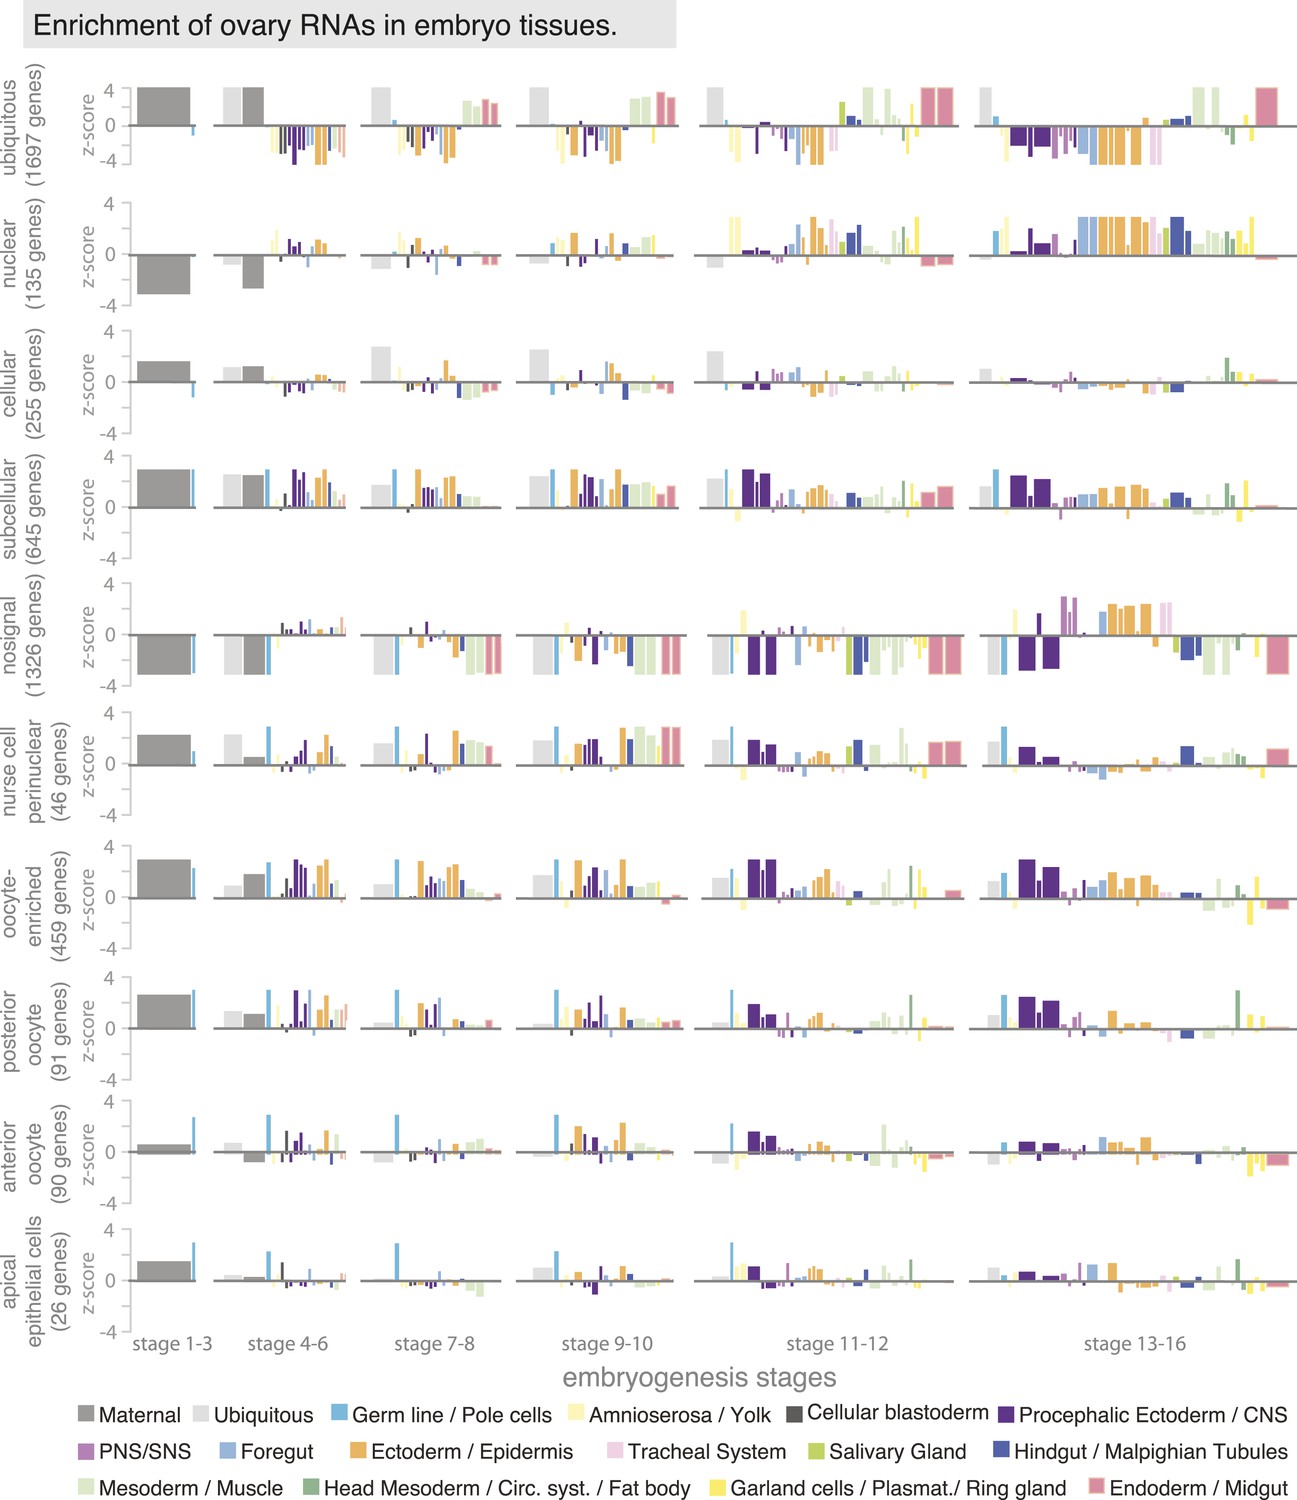
Linear hierarchy (Tomancak et al., 2007) plot showing at which embryonic stage and in which tissue the oogenesis gene sets are re-expressed during embryogenesis. Each colour-coded bar represents organ systems of the embryo from its stage-specific anlagen to primordia to final differentiated structures. The width of the bar is proportional to the frequency with which this annotation term was used in the embryo data set; the height corresponds to a z-score of over- (above axis) or under-representation (below axis) of the term in the set of genes defined by ovary annotation. The following oogenesis gene sets are shown: ubiquitous, nuclear, cellular, subcellular, no signal, nurse cells perinuclear, oocyte-enriched, oocyte anterior and oocyte posterior and apical in epithelial cells. Genes expressed ubiquitously in the ovary mostly remained ubiquitous in the embryo and were additionally enriched in meso- and endoderm; genes of the cellular gene set are enriched in ectoderm/epidermis cells of the late embryo; subcellular genes were highly expressed in the ectoderm and nervous system of the embryo. Most ‘no signal’ genes are also underrepresented in almost all stages and tissues of embryogenesis, apart from the PNS and ectodermal derivatives in the late stages of embryogenesis. Perinuclear enriched genes are highly expressed in meso- and endoderm tissues. Oocyte enriched, oocyte anterior, and oocyte posterior genes are overall very similarly expressed during embryogenesis, being high in the polarized CNS and ectoderm tissues.
Figure 3—figure supplement 2
Gene features of subcellular enriched mRNAs.
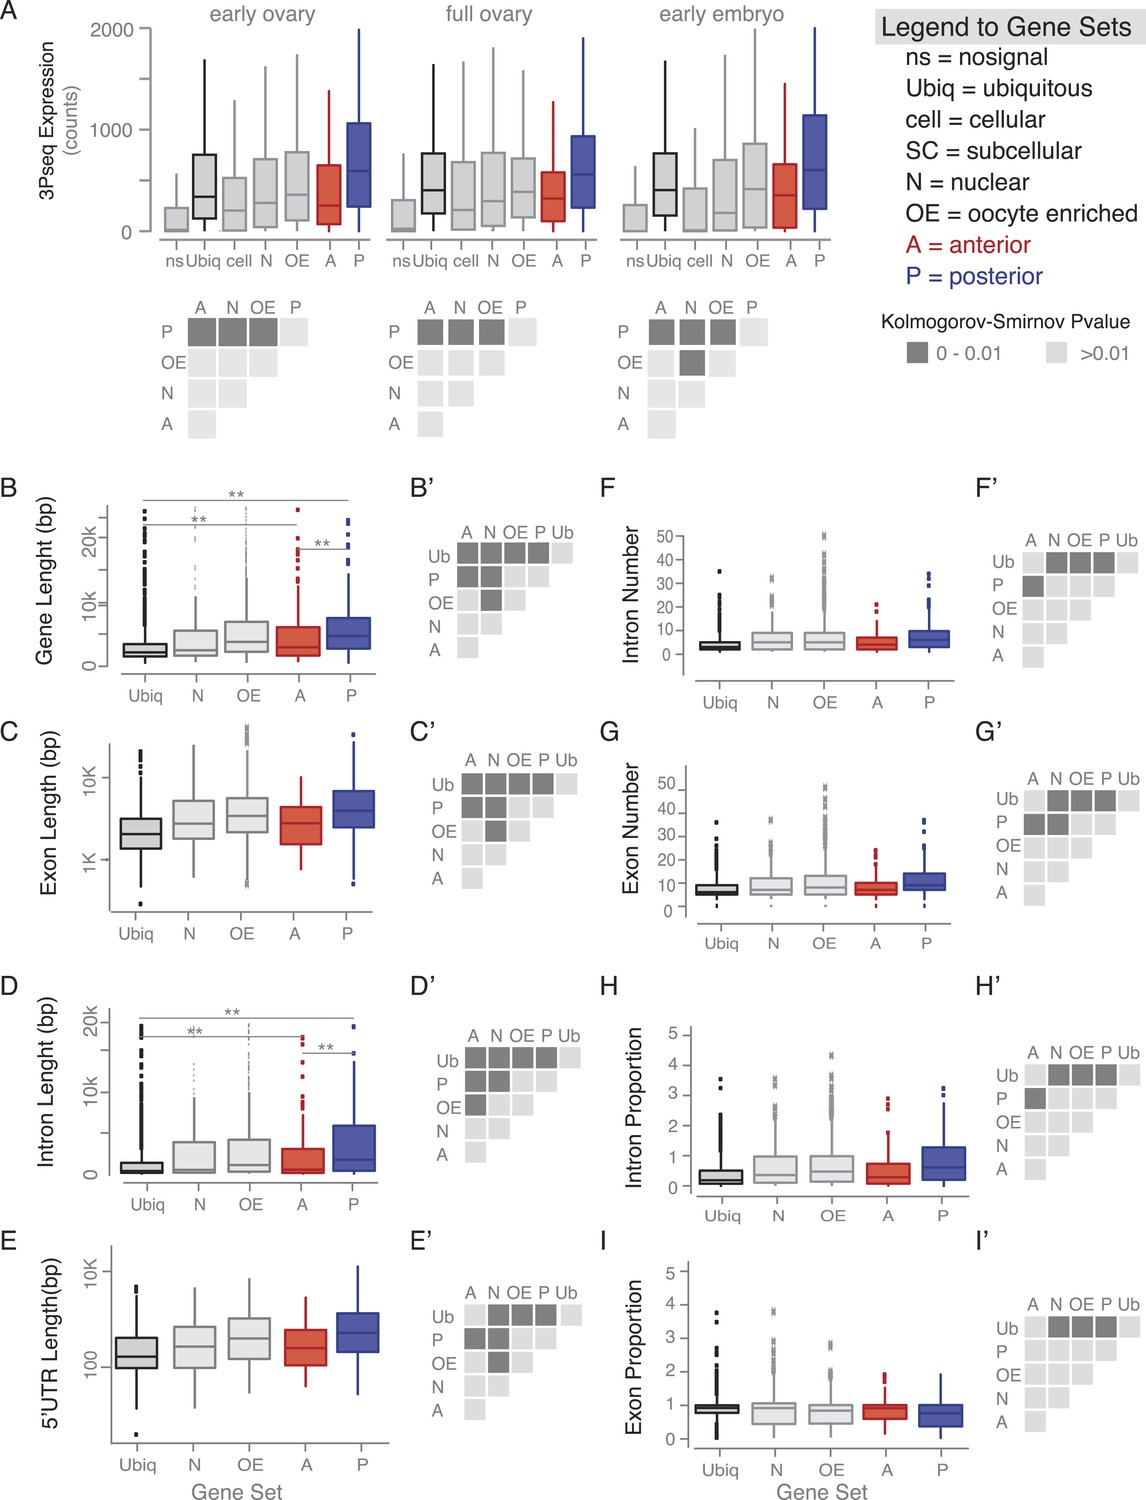
(A) Boxplots showing the median mRNA expression measured by 3Pseq per gene set in early and full ovaries and in 0–2 hr embryos. At the onset of embryogenesis, the cellular mRNAs were almost as low as the ‘no signal’ class, confirming their predominant expression in somatic cells that at this time-point have undergone apoptosis. Accompanying the boxplot is the matrix of statistical significance tests (Kolmogorov–Smirnov) of the null hypothesis that the distributions of median expression values across the subcellular gene sets are the same. Statistically significant differences (p < 0.01) are shown in dark grey, while gene sets that did not differ significantly are shown in light grey (p > 0.01). (B–I) Boxplots showing the median gene length (B), exon length (C), intron length (D), 5′UTR length (E), intron number (F), exon number (G), intron proportion (H), and exon proportion (I) for each gene set and the corresponding significance level calculated by the Kolmogorov–Smirnov (KS) test. Statistically significant differences (p < 0.01) are shown in dark grey, while gene sets that did not differ significantly are shown in light grey (p > 0.01).
Figure 3—figure supplement 3
Embryo localized mRNAs also have long, conserved 3′UTRs.
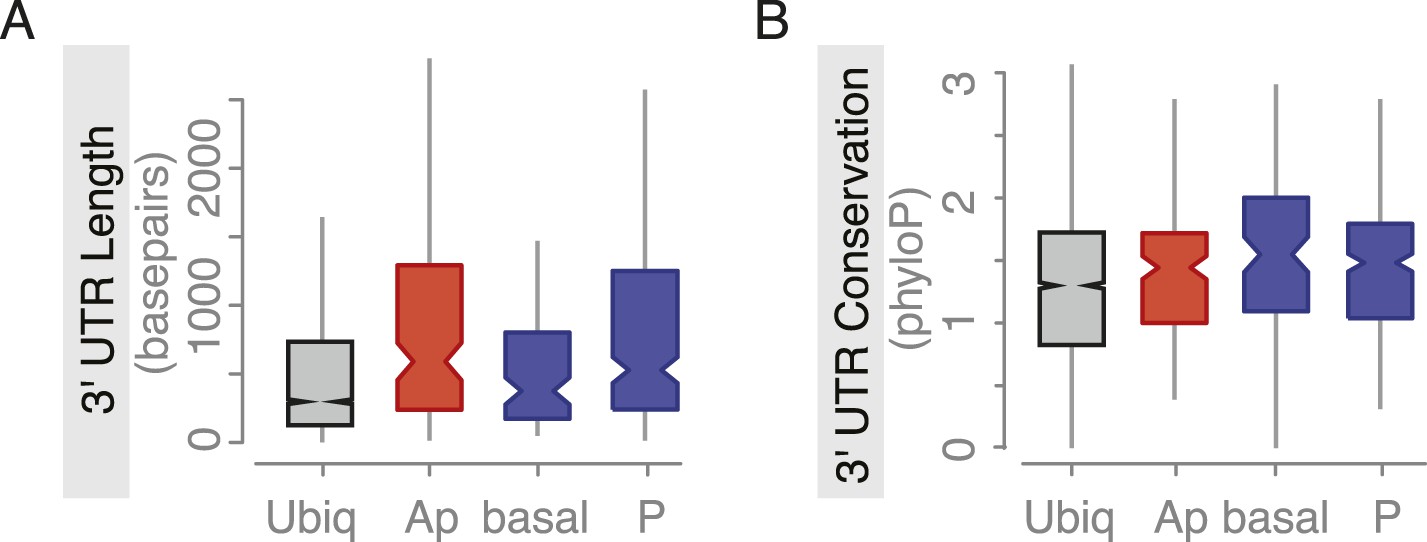
Distributions of median 3′UTR length (A) and conservation of the 3′UTR sequence (B, across 24 Drosophila species) for embryo gene sets. Shown are genes that are ubiquitously expressed during embryogenesis, genes whose RNAs were enriched at the apical or basal membrane in blastoderm embryos and RNAs at the posterior pole.
Figure 3—figure supplement 4
Cytoplasmic but not nuclear mRNA localization requires the cytoskeleton.
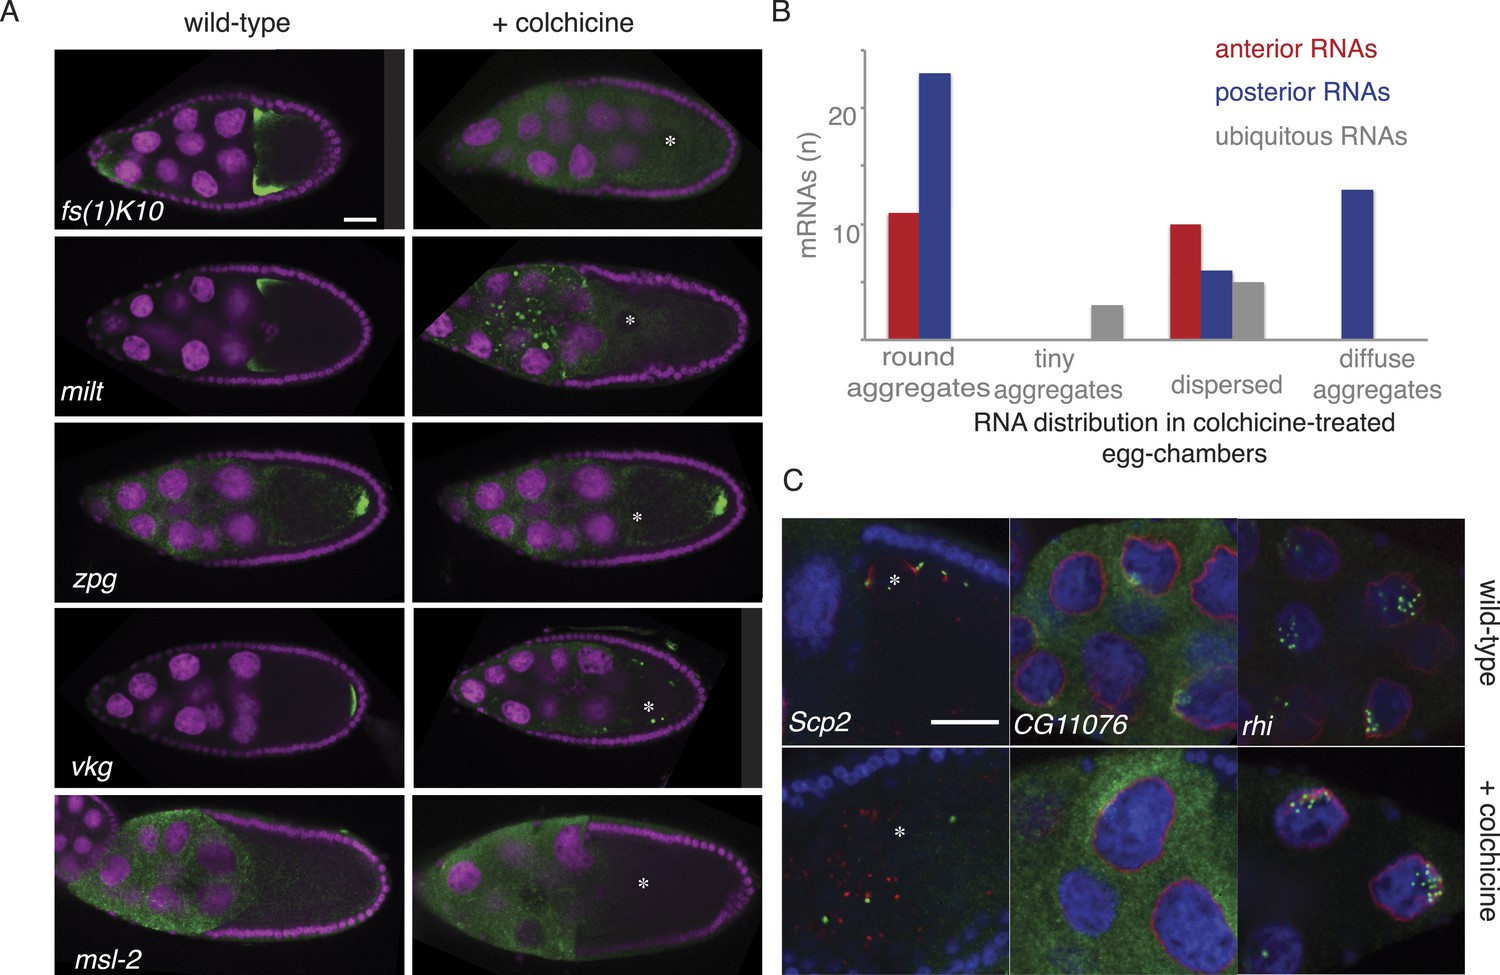
(A) Localization of anterior and posterior mRNAs is lost upon microtubule depolymerization by colchicine. Shown are the anterior mRNAs fs(1)K10 and milt (examples for diffuse-anterior and tight-anterior localization) and the and posterior mRNA vkg and zpg (examples for diffuse-posterior and tight-posterior). The appearance of the ubiquitous mRNA msl-2 is unchanged in colchicine treated egg-chambers. For details see Supplementary file 8. (B) Summary of the quality of all anterior and posterior mRNA distributions tested in colchicine treated egg-chambers (round aggregates, tiny aggregates, dispersed and diffuse aggregates). Diffuse aggregates were observed for those mRNAs that in wild type egg-chambers showed a diffuse posterior enrichment (e.g., Figure 1B’: fs(1)N). (C) mRNA localization in proximity to the nucleus is lost in colchicine treated egg-chambers (Scp2), RNAs localized partially nuclear and partially perinuclear loose the cytoplasmic localization (CG11076) while strictly nuclear RNAs are unaffected by microtubule depolymerization (rhi). (A,C) FISH experiments showing the RNA in green; DNA (labelled with DAPI) is shown in magenta (A) or blue (C), the nuclear membrane is stained with WGA dye shown in red (C). Scale bar 30 μm.
Figure 3—figure supplement 5
Posterior mRNA localization is impaired in posterior localization pathway mutants.
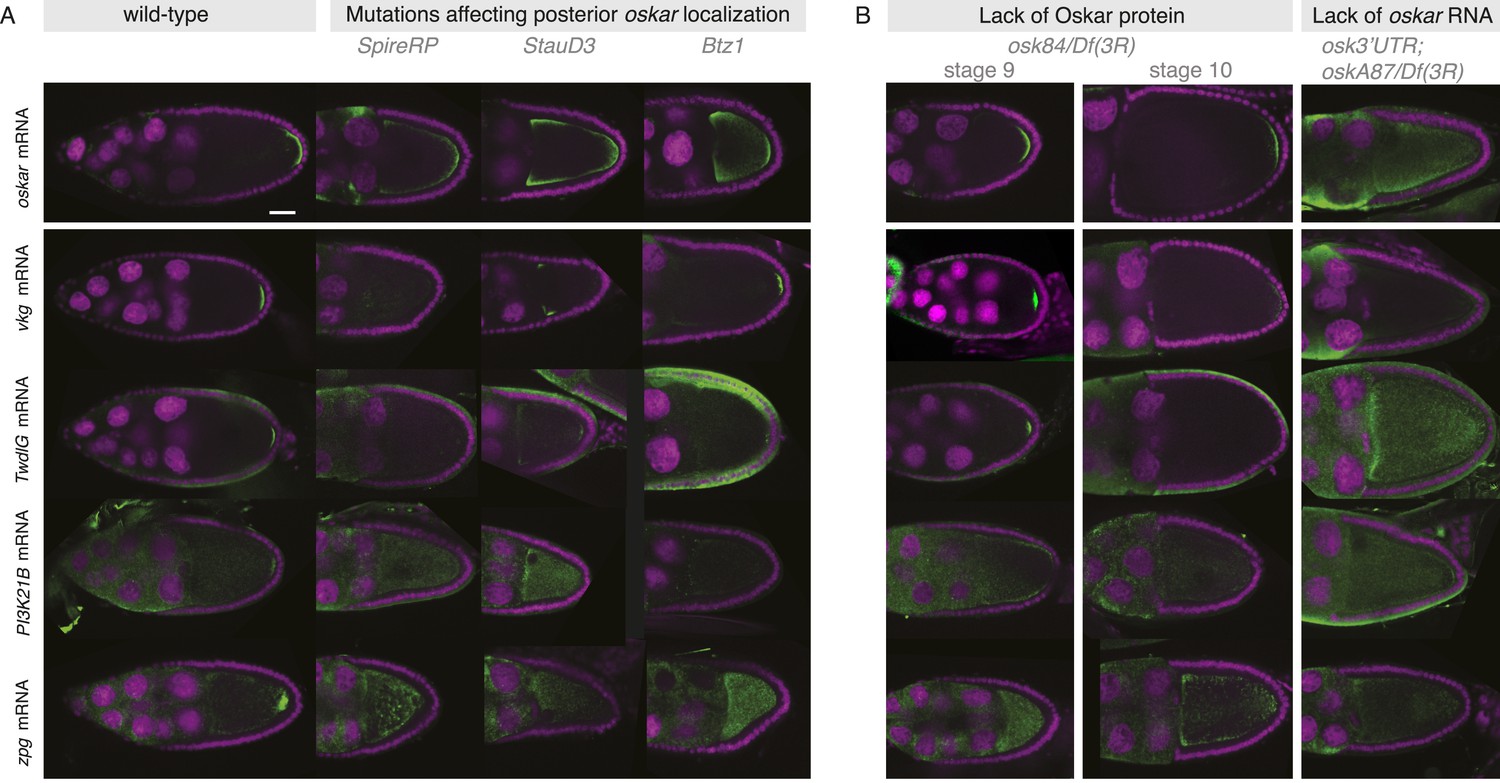
(A) Localization of the novel posterior candidate mRNAs vkg, TwdlG, PI3K21B, and zpg is lost in egg-chambers that prematurely depolymerize the microtubules (flies homozygous for SpireRP), are mutant for the RNA binding protein Staufen (flies homozygous for StauD3) or mutant for the EJC protein Barentz (flies homozygous for Btz1). The candidate mRNAs are mis-localized in a manner similar to oskar mRNA. In Btz1 egg-chambers a weak enrichment of vkg mRNA remained that in rare instances is also observed for oskar mRNA. (B) In egg-chambers either lacking functional Oskar protein or posterior oskar mRNA, the localization of the candidate posterior mRNAs was lost: In Oskar protein mutant egg-chambers (osk84/Df(3R)pXT103), oskar mRNA is initially localized at stage 9 but successively detaches from the posterior pole resulting in reduced oskar mRNA at the posterior pole from stage 10 onwards. A similar reduction from stage 9 to 10 was seen for vkg and TwdlG mRNAs, while PI3K21B (already in wild type being localized at low levels) and zpg mRNA (in wild type localized after stage 9) never showed localization. In egg-chambers that do not express posterior oskar mRNA (oskar 3′UTR/+; oskA87/Df(3R)pXT103; Jenny et al., 2006) none of the candidate posterior mRNAs localized. (Expression of the non-localizing oskar 3′UTR is necessary to rescue the early oogenesis arrest.) (A–B) FISH experiments showing the RNA in green and DNA (labelled with DAPI) in magenta. Scale bars 30 μm.
Figure 4
mRNA localizations change across time-points.
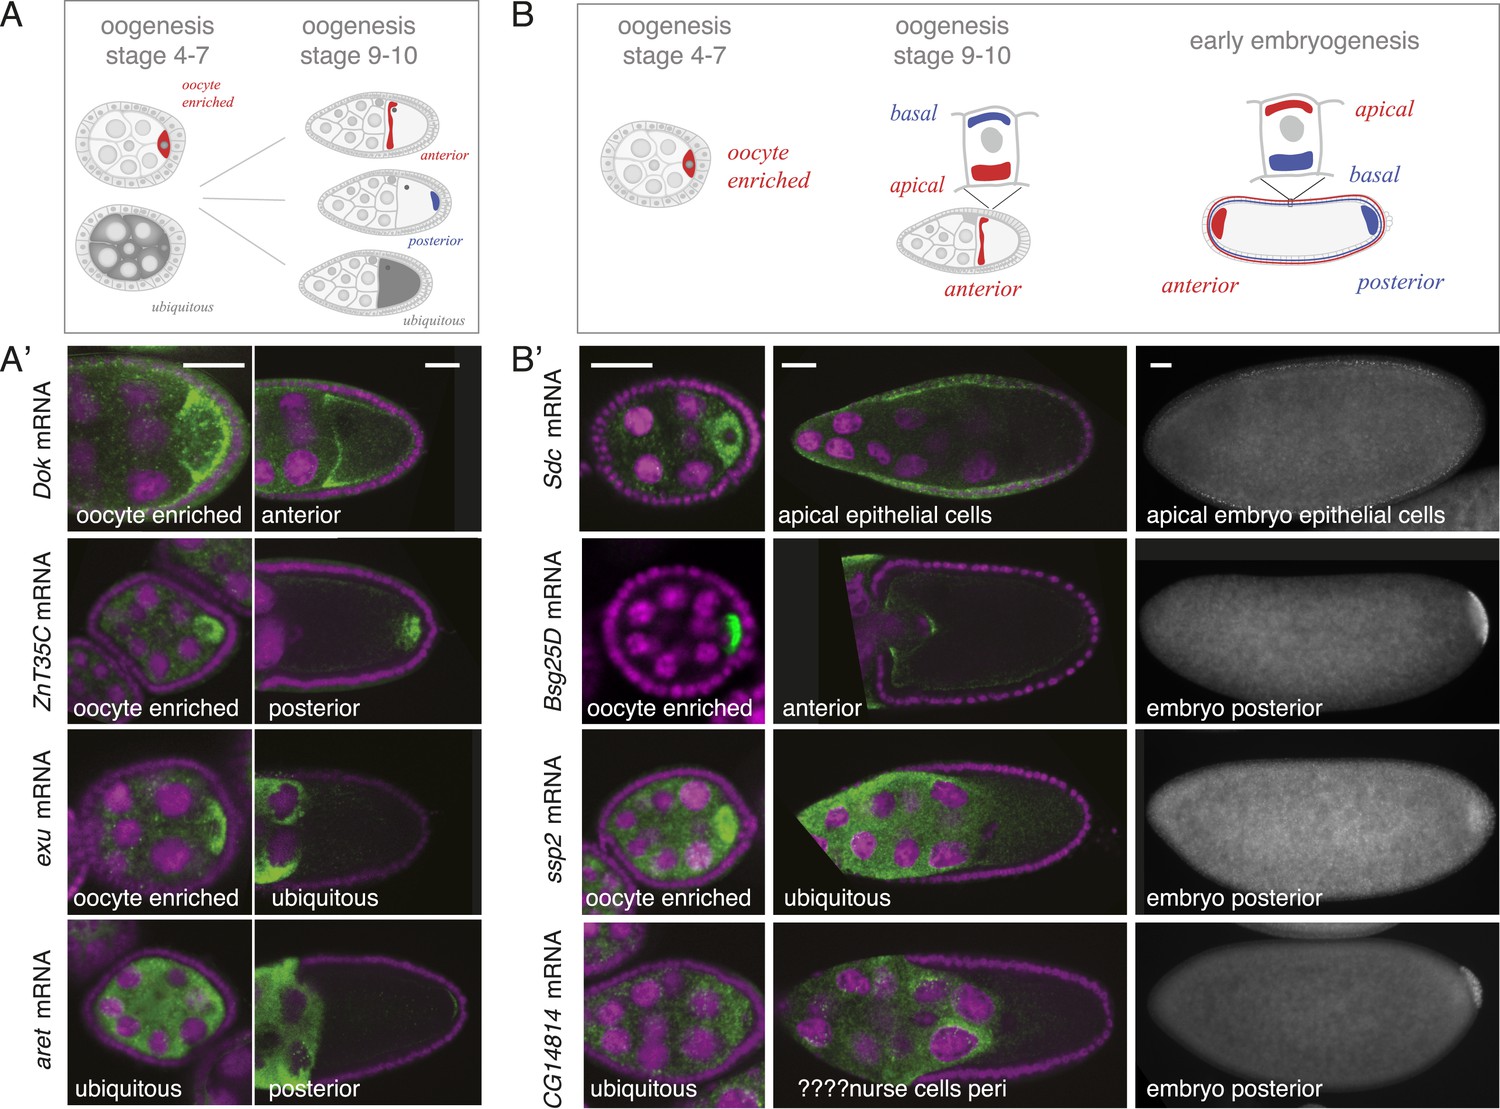
(A) Schematic of changing mRNA distributions in germline cells (nurse cells, oocyte) in stage 4–7 and stage 9–10 egg-chambers. (A′) Exemplary mRNAs that show diverging combinations of mRNA localizations over the course of oogenesis: After initially being oocyte enriched at stage 2–7, Dok mRNA becomes detectable at the anterior pole, ZnT35C mRNA at the posterior pole and exu mRNA becomes ubiquitously distributed at stage 9/10. aret mRNA being ubiquitously distributed at stage 2–7 becomes weakly detectable at the posterior pole. (B) Schematic of mRNA distributions in ovary and embryonic cell types. (B′) mRNA expressions in ovarian and embryonic cells. All embryo data are from http://fly-fish.ccbr.utoronto.ca/. Sdc mRNA is localized where microtubules minus ends are enriched (Callaini and Anselmi, 1988; Clark et al., 1997; Delanoue and Davis, 2005) in the syncytial egg-chamber, in epithelial cells of the ovary and of the stage 4–5 embryo. Bsg25D mRNA is oocyte enriched, then localizes at the anterior pole in the oocyte but enriches at the posterior pole in the early embryo. Similarly, ssp2 mRNA enriches in the oocyte during oogenesis and localizes towards the posterior pole in early embryos but during late oogenesis undergoes a ubiquitous phase. CG14814 mRNA is initially ubiquitous, then shows perinuclear localization and in early embryos is enriched at the posterior pole. (A′–B′): FISH showing the RNA in green and DNA (labelled with DAPI) in magenta. Scale bar 30 μm. Embryo data are from http://fly-fish.ccbr.utoronto.ca/ (Lecuyer et al., 2007).
Figure 5 with 1 supplement
mRNA expression is stable during oogenesis.
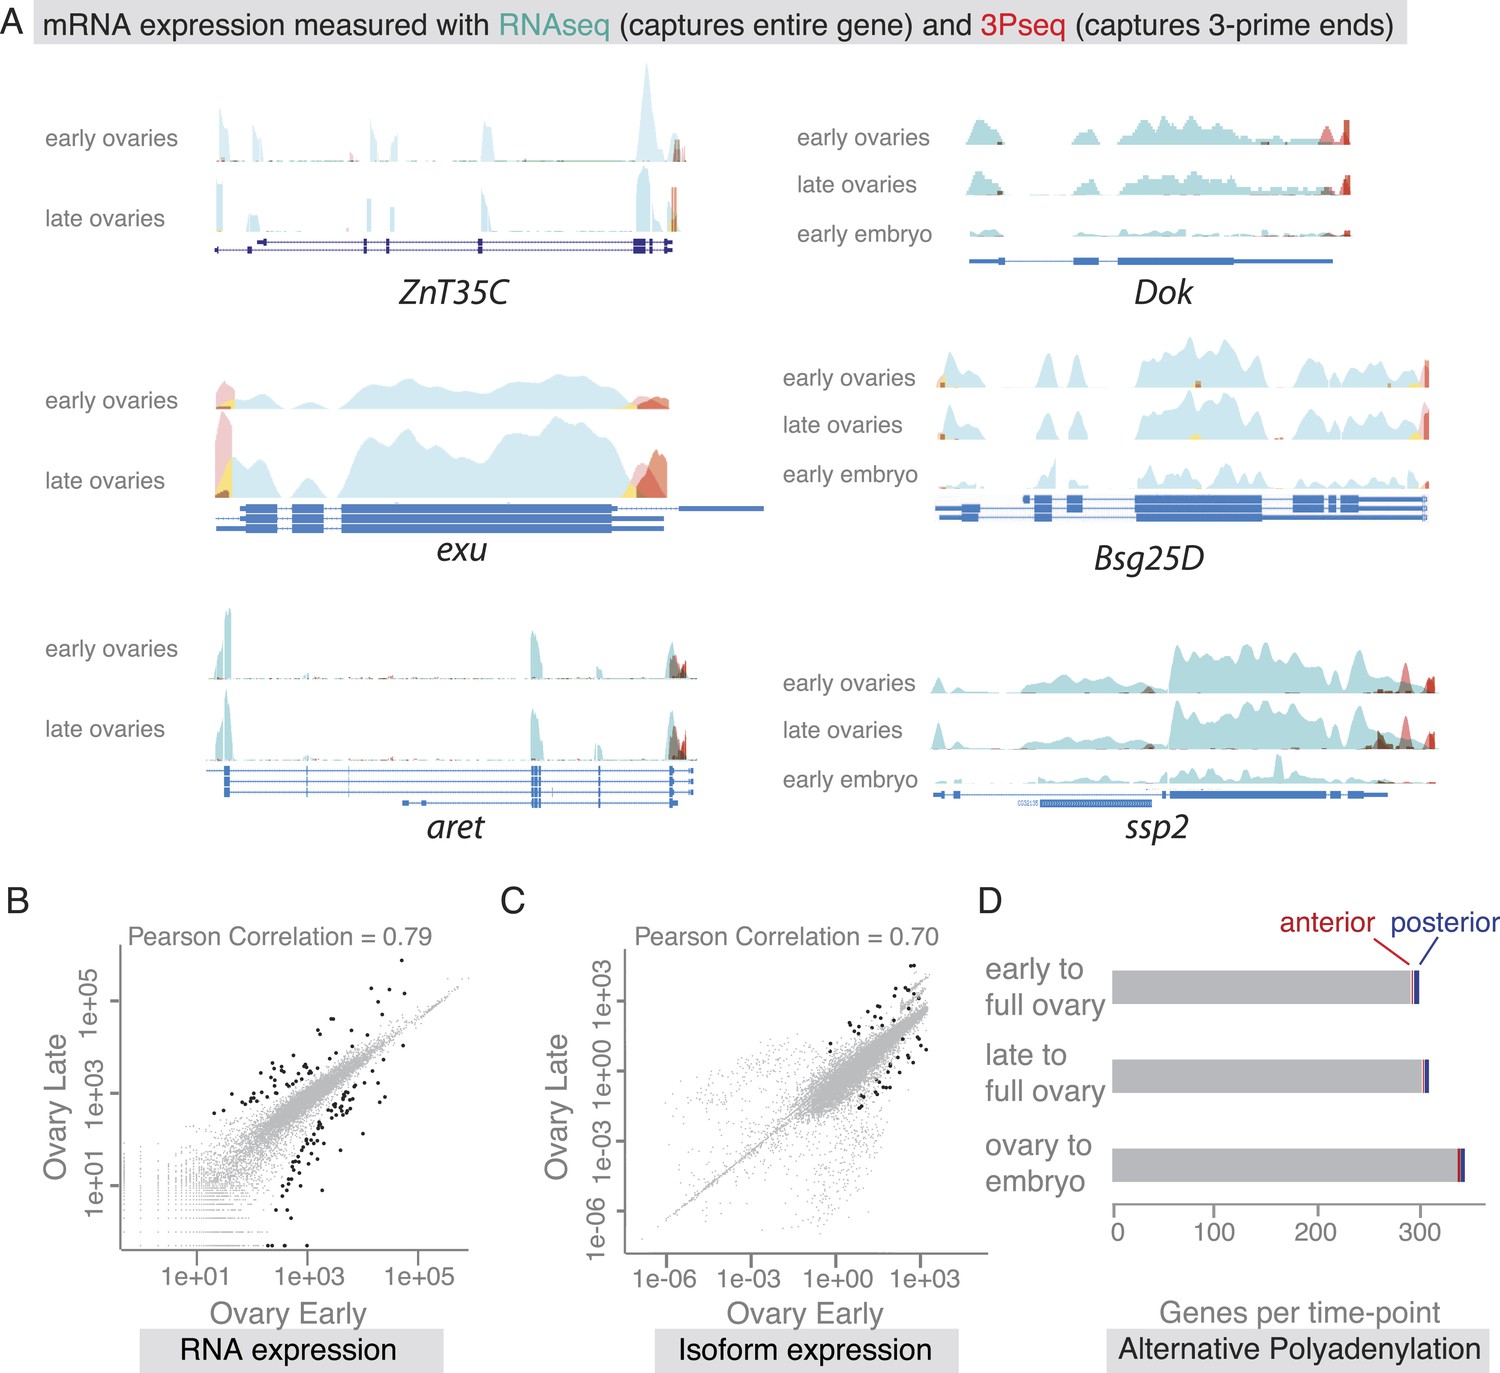
(A) Changing localization of ZnT35C, exu, aret, Dok, Bsg25D and ssp mRNAs across time-points (see Figure 4) does not coincide with a change in transcript expression: the expressed 3′UTRs (sampled by 3′prime sequencing, red) and transcript isoforms (sampled by RNAseq, green) do not change from early oogenesis to late oogenesis/early embryogenesis. (B) Pair-wise correlation of early/late 3Pseq data revealed that the stage-specific transcriptomes were highly similar (Pearson Correlation: 0.79); only few genes, highlighted in black, were significantly up- or down-regulated (p-value adjusted for multiple testing <0.1). (C) Correlation analysis of expressed transcript isoform (deduced from RNAseq data) revealed that from early to late ovaries almost no transcript-isoforms significantly changed in their expression level. Transcripts with significant changes are shown in black. (D) Only ∼300 genes (early-full: 298; late-full: 308; full-embryo: 346) changed their mean-weighted 3′UTR length that is indicative of an alternative polyadenylation. Alternative UTR form usage across oogenesis was found for 1 (early-late oogenesis)/4 (late-full oogenesis) anterior mRNAs (red) and for 4 (early to late oogenesis)/5 (late to full oogenesis) posterior mRNAs (blue).
Figure 5—figure supplement 1

The transcriptome shows little variation over the course of oogenesis.
(A) Scatterplot showing high correlation (Pearson Correlation 0.71) between RNAseq and 3Pseq sequencing results. (B) Stage-specific sequencing reveals that ∼5500 genes (grey) were detected by both mRNA sequencing (RNAseq) and 3′prime end sequencing (3Pseq). Additional 1000–2000 mRNAs were captures with either RNAseq (green) or 3Pseq (red) only, suggesting that at each time point about half of the D. melanogaster genome was expressed. (C) Venn diagram showing that most genes, 85%, are continuously expressed as they are detectable at each time point of oogenesis (3Pseq: red; RNAseq: green). (D) Across oogenesis RNA levels were highly correlated, suggesting minimal changes in the stage-specific transcriptomes (Pair-wise correlation, Pearson Correlation: 0.77; significantly up/down regulated genes shown in black: p-value adjusted for multiple testing <0.1, see also Figure 5B). (E) GO-term analysis of genes significantly up- (arrow up) or down- (arrow down) regulated during oogenesis/early embryogenesis. Particularly genes encoding components of the extra-embryonic layers (vitelline membrane, ECM, cuticle) changed expression levels. (F) nanos mRNA significantly changes gene expression from early to full ovaries measured by RNAseq (green) and 3Pseq (red). Below: gene model. (G) Boxplot showing that the vast majority of genes expressed only one 3′UTR form during oogenesis, suggesting low prevalence of alternative polyadenylation. (H) Correlation of expressed transcripts (measured by RNAseq) revealed that only few genes significantly (shown in black) changed the expressed isoform during oogenesis (see also Figure 5C). (I) Only few subcellular localized mRNAs showed significant changes in transcript expression (see H). (J) The number of transcripts expressed per gene did not change during oogenesis did not differ between ubiquitous and subcellular gene sets (highlighted: anterior [red] and posterior [blue] genes).
Figure 6 with 1 supplement
mRNA localizations are changing across cell types and within cells over time.
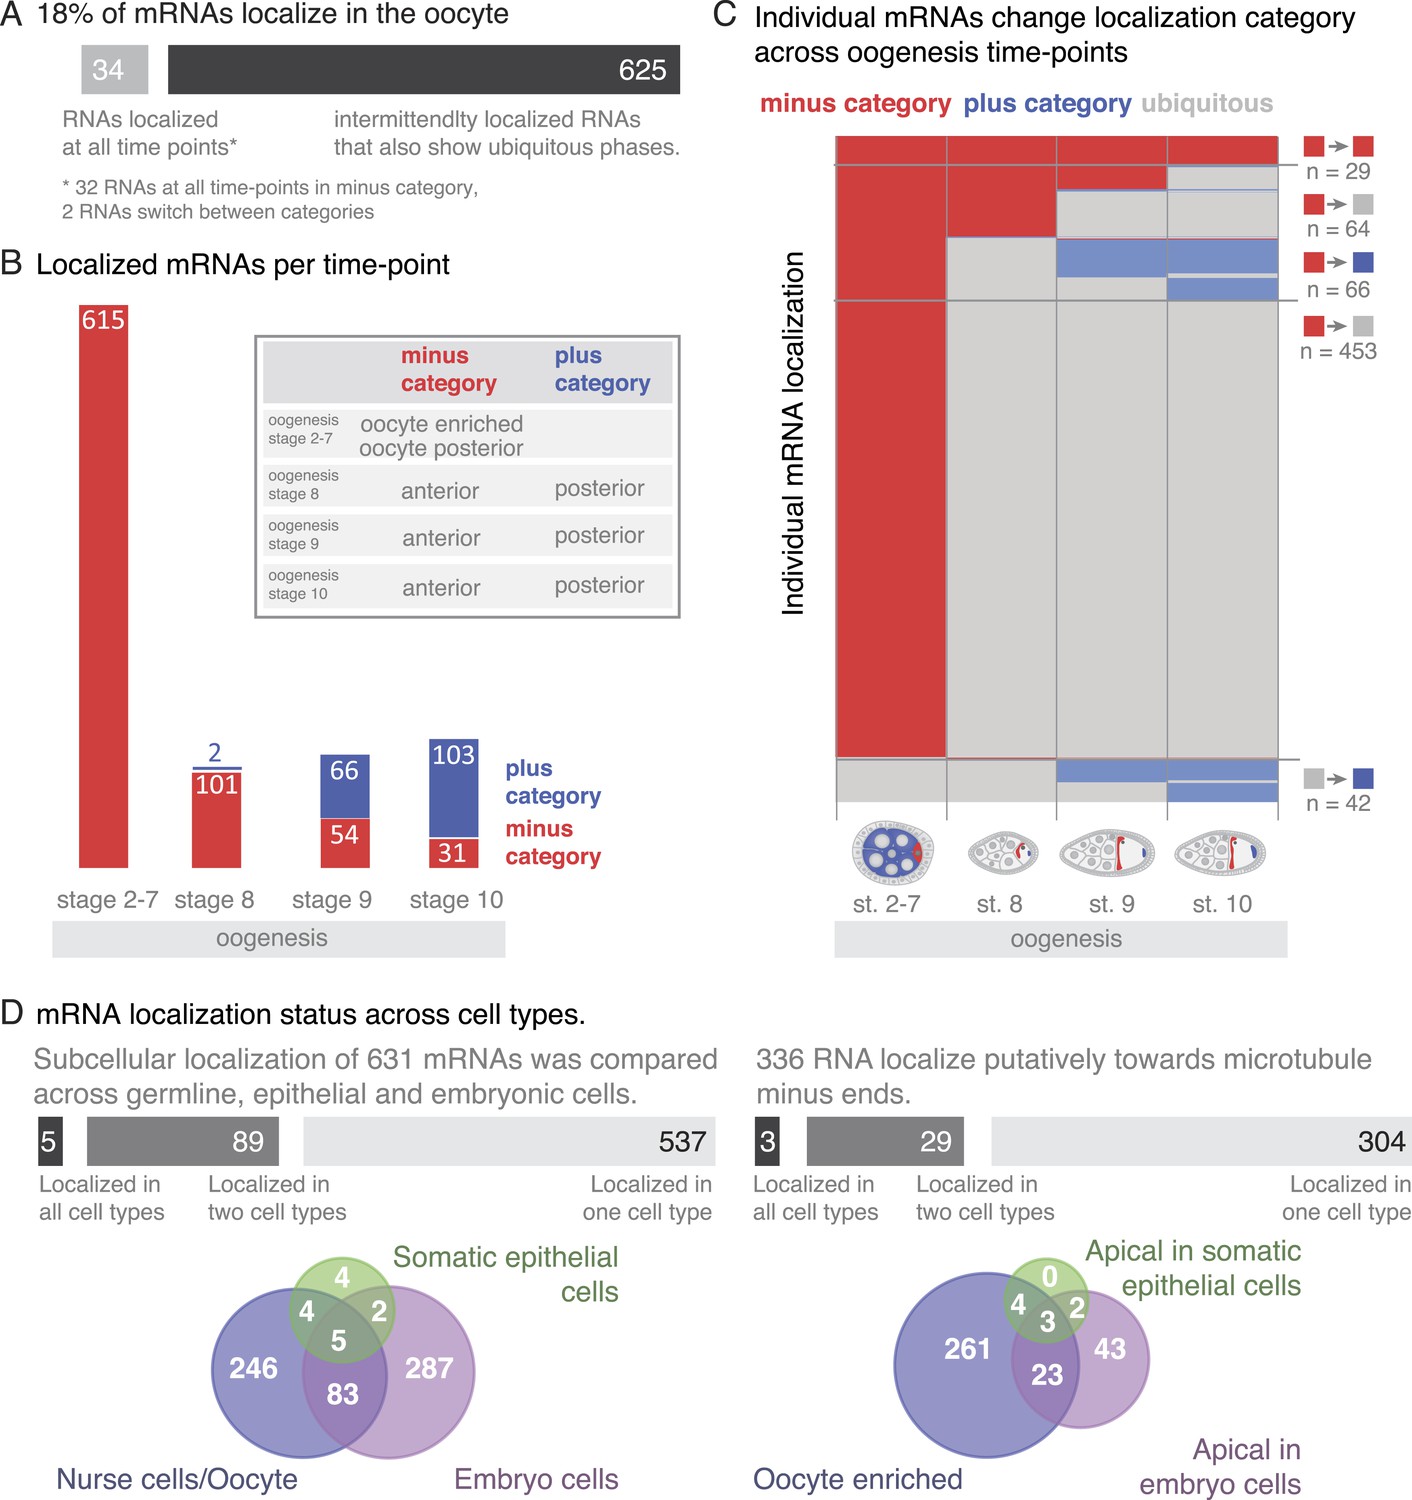
(A) In the oocyte, most mRNAs of the subcellular category also have phases with ubiquitous mRNA distribution. (B) The number of localized mRNAs in the oocyte varies over oogenesis time points. mRNAs are grouped according to their relative localization with respect to the polarised microtubule cytoskeleton (Steinhauer and Kalderon, 2006). Red = mRNAs that localize where microtubule minus ends are enriched (minus category), blue = mRNAs in proximity of microtubule plus ends (plus category). (C) Time course of clustered single mRNA localizations. Each line represents an mRNA, indicated below are the oogenesis time-points. Localizations to the poles of the oocyte are colour-coded in red (minus category) or blue (plus category); ubiquitous phases of the mRNA are shown in grey. A summary of the trend of mRNA localizations in each cluster and the number of entries is shown to the right. (D) Overlap of mRNAs localized in either germline (oocyte, nurse cells), epithelial (follicle cells) and embryonic cell types shown as a Venn-diagram: Only 5 (<1%) mRNAs localized in all sampled cell types, 89 (14%) mRNAs localized in at least two cell types. The largest group in each cell type was mRNAs localized in proximity to sites known to be enriched for microtubule minus-ends (Callaini and Anselmi, 1988; Clark et al., 1997; Delanoue and Davis, 2005); in the early egg-chamber: oocyte-enriched; in somatic epithelial follicle cells: apical; in embryonic epithelial cells: apical. Only 3 mRNAs (<1%) showed this localization in all cell types, 29 mRNAs (9%) in two cell types.
Figure 6—figure supplement 1

Changing localization of mRNAs in ovaries and embryos.
(A) Expanded dendrogram from Figure 6C including the data for the first two time-points of embryogenesis (Lecuyer et al., 2007). mRNAs at the anterior (minus category) and posterior (plus category) poles further decrease from oogenesis into early embryogenesis; more posterior (plus category) mRNAs remain localized in the embryo than anterior (minus category) mRNAs. A rise in localization of the oocyte-localized mRNAs was only observed at stage 4–5 of embryogenesis; the rise was more pronounced in the minus category (i.e., apical localization in embryo cells). (B) Minus and plus categories expanded to the embryo localization data. (C) Comparison of the in situ hybridization screens in ovaries (our data) and Drosophila embryos (Lecuyer et al., 2007). In total 1674 mRNAs are subcellularly localized during oogenesis and/or embryogenesis and therefore are ‘localization competent’ (see also Figure 1—figure supplement 2). (D) Venn diagram of the mRNAs showing nuclear enrichment in either oogenesis or embryogenesis. Only three mRNAs are nuclear at both developmental time-points.
Additional files
-
Supplementary file 1
Gene set definitions. Definition of Gene Sets used in this analysis from the ovary and the embryo (Lecuyer et al., 2007) FISH annotation matrices.
- https://doi.org/10.7554/eLife.05003.019
-
Supplementary file 2
Differentially expressed genes (early/late). Genes showing significant differential expression (padj <0.1) from early to late ovaries. Upregulated genes show log2FolgChange >0, downregulated genes show log2FolgChange ≤0.
- https://doi.org/10.7554/eLife.05003.020
-
Supplementary file 3
Differentially expressed genes (late/full). Genes showing significant differential expression (padj <0.1) from late to full ovaries. Upregulated genes show log2FolgChange >0, downregulated genes show log2FolgChange ≤0.
- https://doi.org/10.7554/eLife.05003.021
-
Supplementary file 4
Differentially expressed genes (full/0–2h embryos). Genes showing significant differential expression (padj <0.1) from full ovaries to 0–2 hr embryos. Upregulated genes show log2FolgChange >0, downregulated genes show log2FolgChange ≤0.
- https://doi.org/10.7554/eLife.05003.022
-
Supplementary file 5
Differential isoform expression (early/late). Transcripts that are differentially expressed from early to late ovaries.
- https://doi.org/10.7554/eLife.05003.023
-
Supplementary file 6
Differential isoform expression (late/full). Transcripts that are differentially expressed from late to full ovaries.
- https://doi.org/10.7554/eLife.05003.024
-
Supplementary file 7
Changes in 3′UTR length. Shown are the mean-weighted changes in 3′UTR length across oogenesis. Values >0 indicate 3′UTR lengthening, Values <0 indicate 3′UTR shortening. Only changes affecting >200 nt are shown.
- https://doi.org/10.7554/eLife.05003.025
-
Supplementary file 8
Effect of colchicine on oocyte mRNAs. Summary of experiments on colchicine treated egg-chambers; Shown are gene/clone name, localization in wild-type egg-chambers and mRNA appearance upon microtubule depolymerization. Data is available publicly at the DOT, the Dresden Ovary Table (http://tomancak-srv1.mpi-cbg.de/DOT/main.html).
- https://doi.org/10.7554/eLife.05003.026
Download links
A two-part list of links to download the article, or parts of the article, in various formats.
Downloads (link to download the article as PDF)
Open citations (links to open the citations from this article in various online reference manager services)
Cite this article (links to download the citations from this article in formats compatible with various reference manager tools)
Systematic imaging reveals features and changing localization of mRNAs in Drosophila development
eLife 4:e05003.
https://doi.org/10.7554/eLife.05003


