Heritable capture of heterochromatin dynamics in Saccharomyces cerevisiae
- University of California, Berkeley, United States
Figures
Figure 1
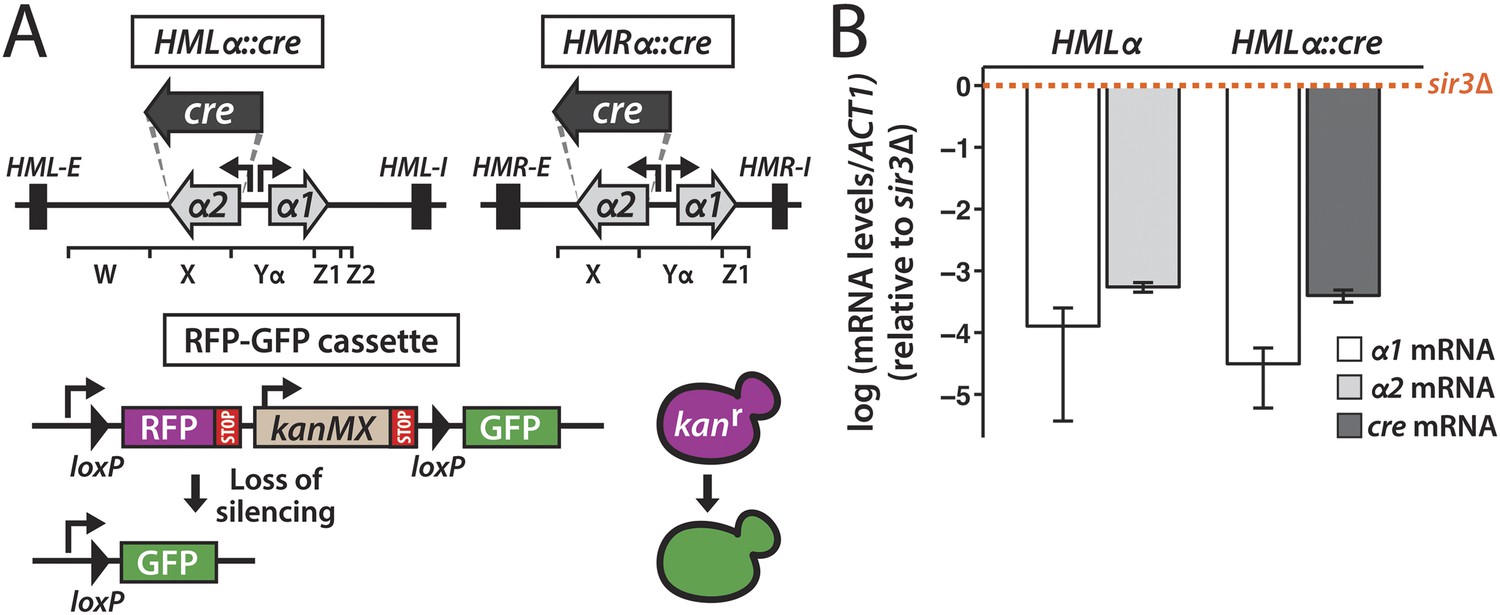
Cre-based assay.
(A) Design of assay to detect short-lived gene expression. The gene coding for the Cre recombinase was integrated at either HMLα or HMRα, replacing the α2 coding region, and was expressed from the native α2 promoter. Black rectangles denote the E and I silencers of HML and HMR. The W, X, Yα, Z1 and Z2 regions of the mating-type loci are indicated by brackets. Loss of cre silencing induces Cre-mediated recombination of the loxP sites (arrowheads) in the RFP-GFP reporter cassette, causing a switch from RFP to GFP expression and a loss of G418 resistance. (B) Quantitative RT-PCR analysis of α1 and α2 mRNA levels in a strain containing wild-type HMLα (JRY9623), and α1 and cre mRNA levels in a strain containing HMLα::cre (JRY9625). To determine the fold repression, mRNA levels were also measured in HMLα and HMLα::cre strains lacking Sir3 (JRY9624 and JRY9626). All strains carried matΔ and hmrΔ mutations to relieve the repression of α1 by the a1-α2 heterodimer in sir3Δ cells (Strathern et al., 1981). mRNA values were normalized to ACT1 mRNA values. Expression levels are shown relative to the corresponding sir3Δ values (set to 1) (orange dotted line). The fold repression of α2 and cre did not significantly differ (p = 0.12; Student's t test). Data are means ± standard deviation (SD) (n = 3).
Figure 2 with 1 supplement
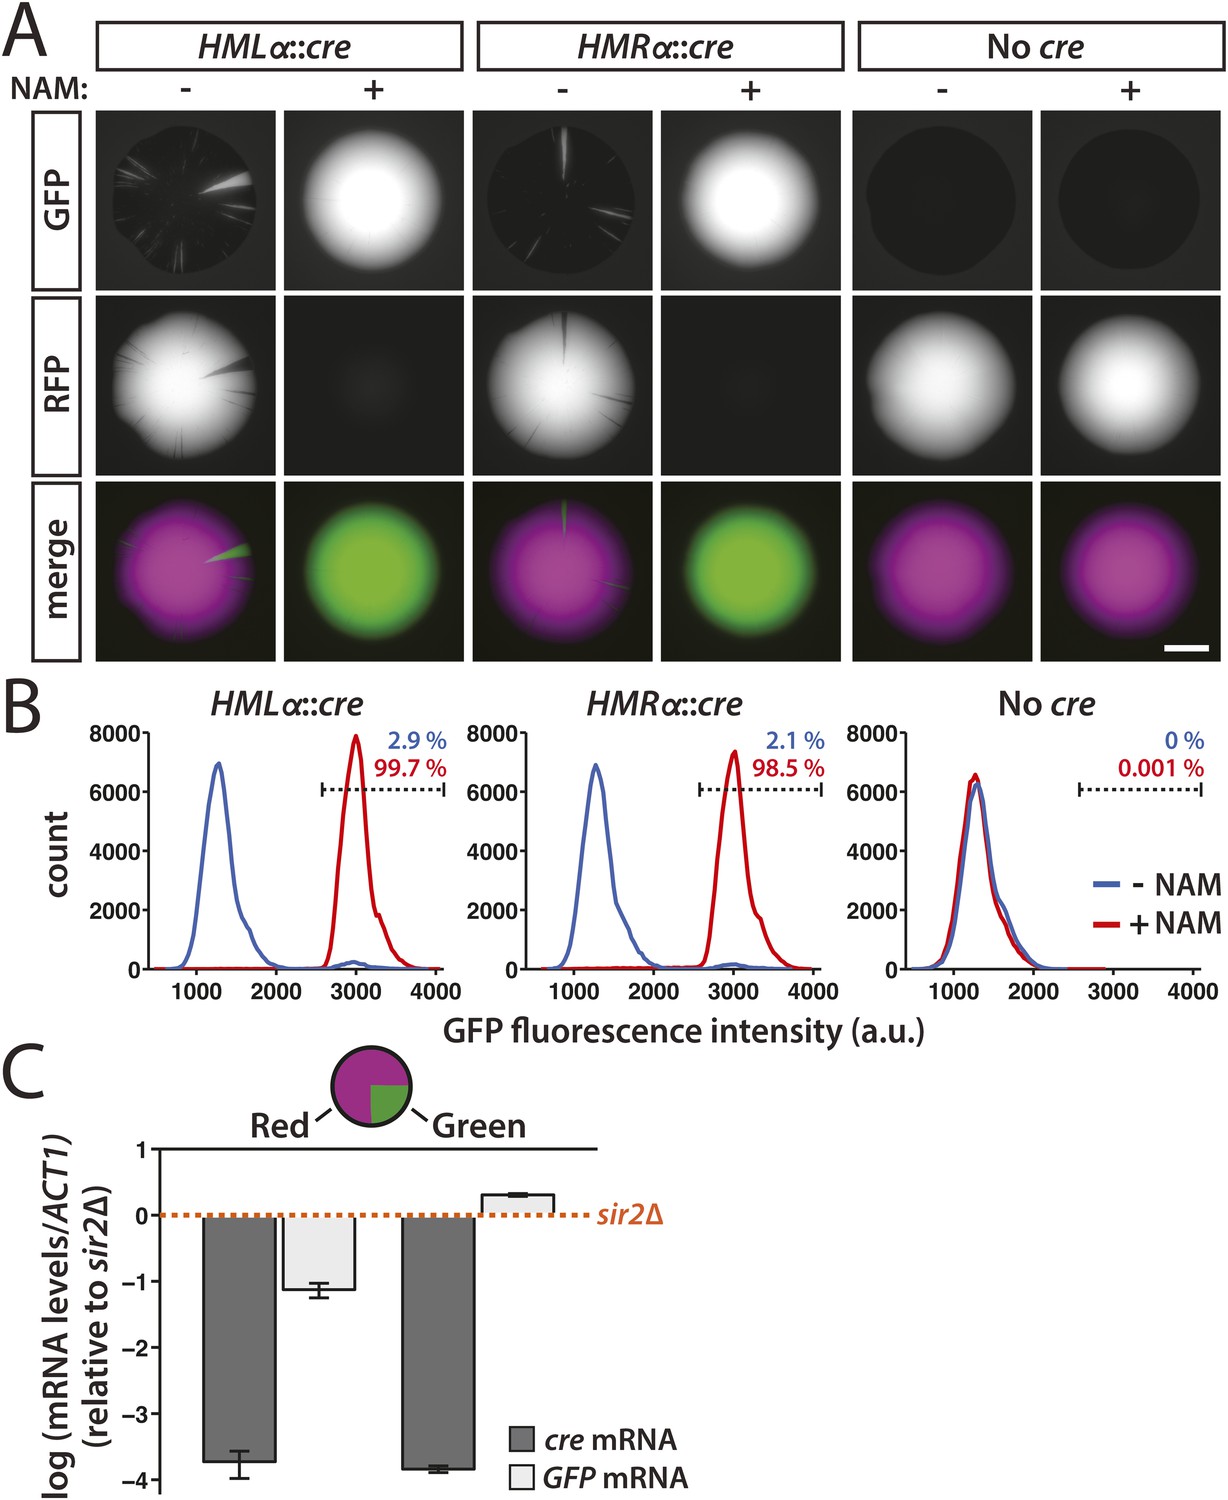
Transient transcription of HML and HMR captured by the Cre-based assay.
(A) Colonies derived from single cells containing the RFP-GFP cassette in addition to either HMLα::cre, HMRα::cre, or no source of the cre gene (No cre). Colonies of each genotype were grown in either the presence or absence of 5 mM nicotinamide (NAM). Additional colonies are shown in Figure 2—figure supplement 1. Scale bar, 2 mm. (B) Flow cytometry measurements of GFP fluorescence intensity in individual cells from within a single colony. Cells containing the RFP-GFP cassette and either HMLα::cre, HMRα::cre or no cre gene were plated on Complete Supplement Mixture (CSM) −Trp in the presence (red) or absence (blue) of 5 mM NAM. On day 6 of growth, representative colonies of each genotype and condition were resuspended in synthetic complete (SC) medium and grown to early log phase for analysis by flow cytometry. Each distribution represents approximately 105 cells. The percentage of GFP-positive cells shown for each sample was determined by a gate (dotted line) that was set based on the intensity profile of the HMLα::cre (+NAM) sample. (C) Quantitative RT-PCR measurements of HMLα::cre transcription in red and green sectors. To determine whether silencing loss was transient, cre and GFP mRNA levels were quantified in the GFP-expressing (green) and RFP-expressing (red) regions of a colony of cells containing HMLα::cre and the RFP-GFP cassette (JRY9628). Three independent experiments were performed, each on a different colony with a large green sector. Cells from the red and green regions of each colony were grown to log phase in YPD and harvested for RNA isolation. As a positive control for HMLα::cre expression, mRNA levels were also measured in a sir2Δ mutant (JRY9633). All mRNA values were normalized to ACT1 mRNA values. Expression levels are shown relative to the corresponding sir2Δ values (set to 1) (orange dotted line). The fold repression of HMLα::cre did not significantly differ between the red and green samples (p = 0.43; Student's t test). Data are means ± SD (n = 3).
Figure 2—figure supplement 1
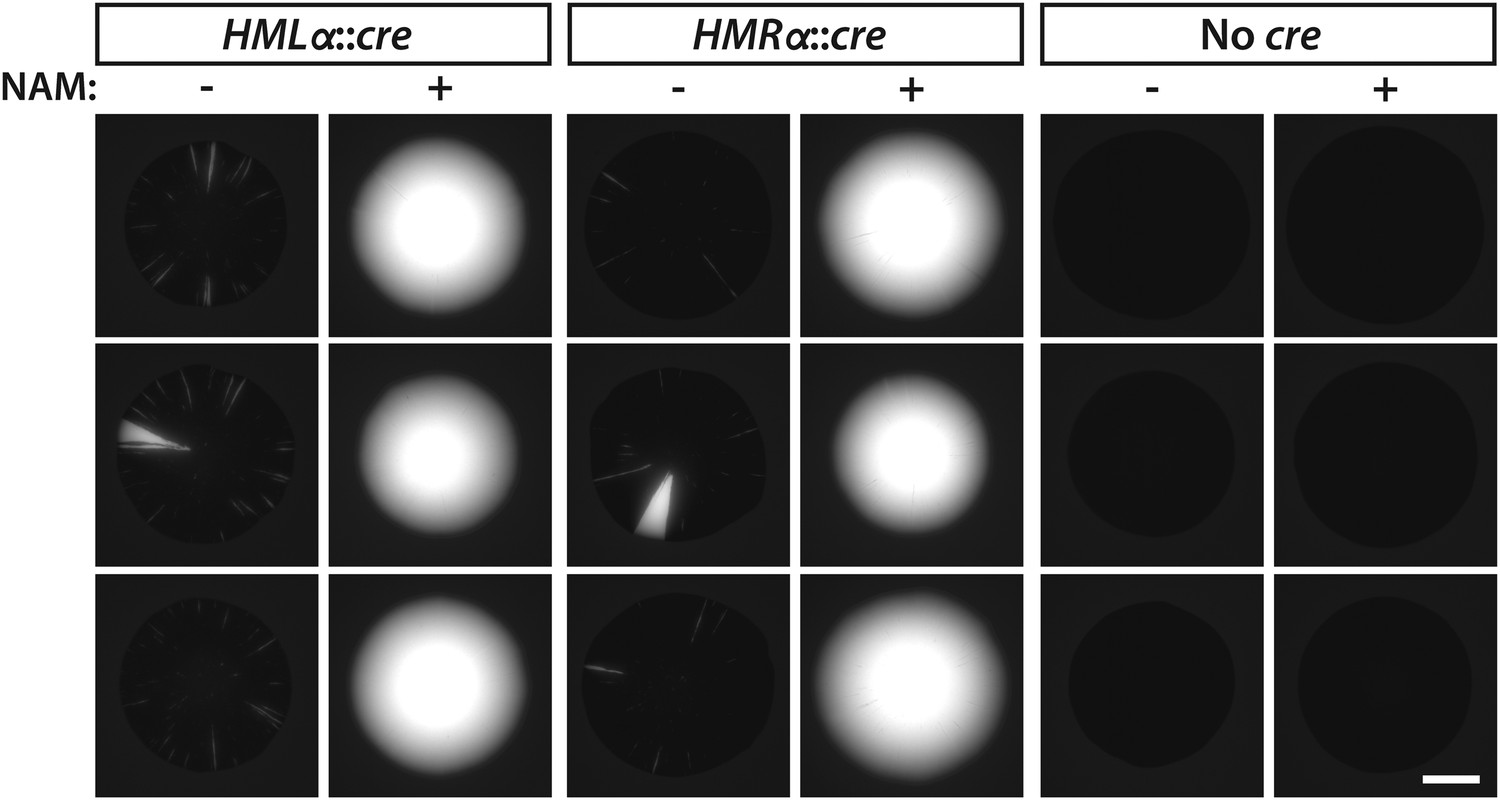
GFP fluorescence of additional colonies with either HMLα::cre, HMRα::cre, or No cre grown in the presence or absence of 5 mM nicotinamide (NAM).
Scale bar, 2 mm.
Figure 3
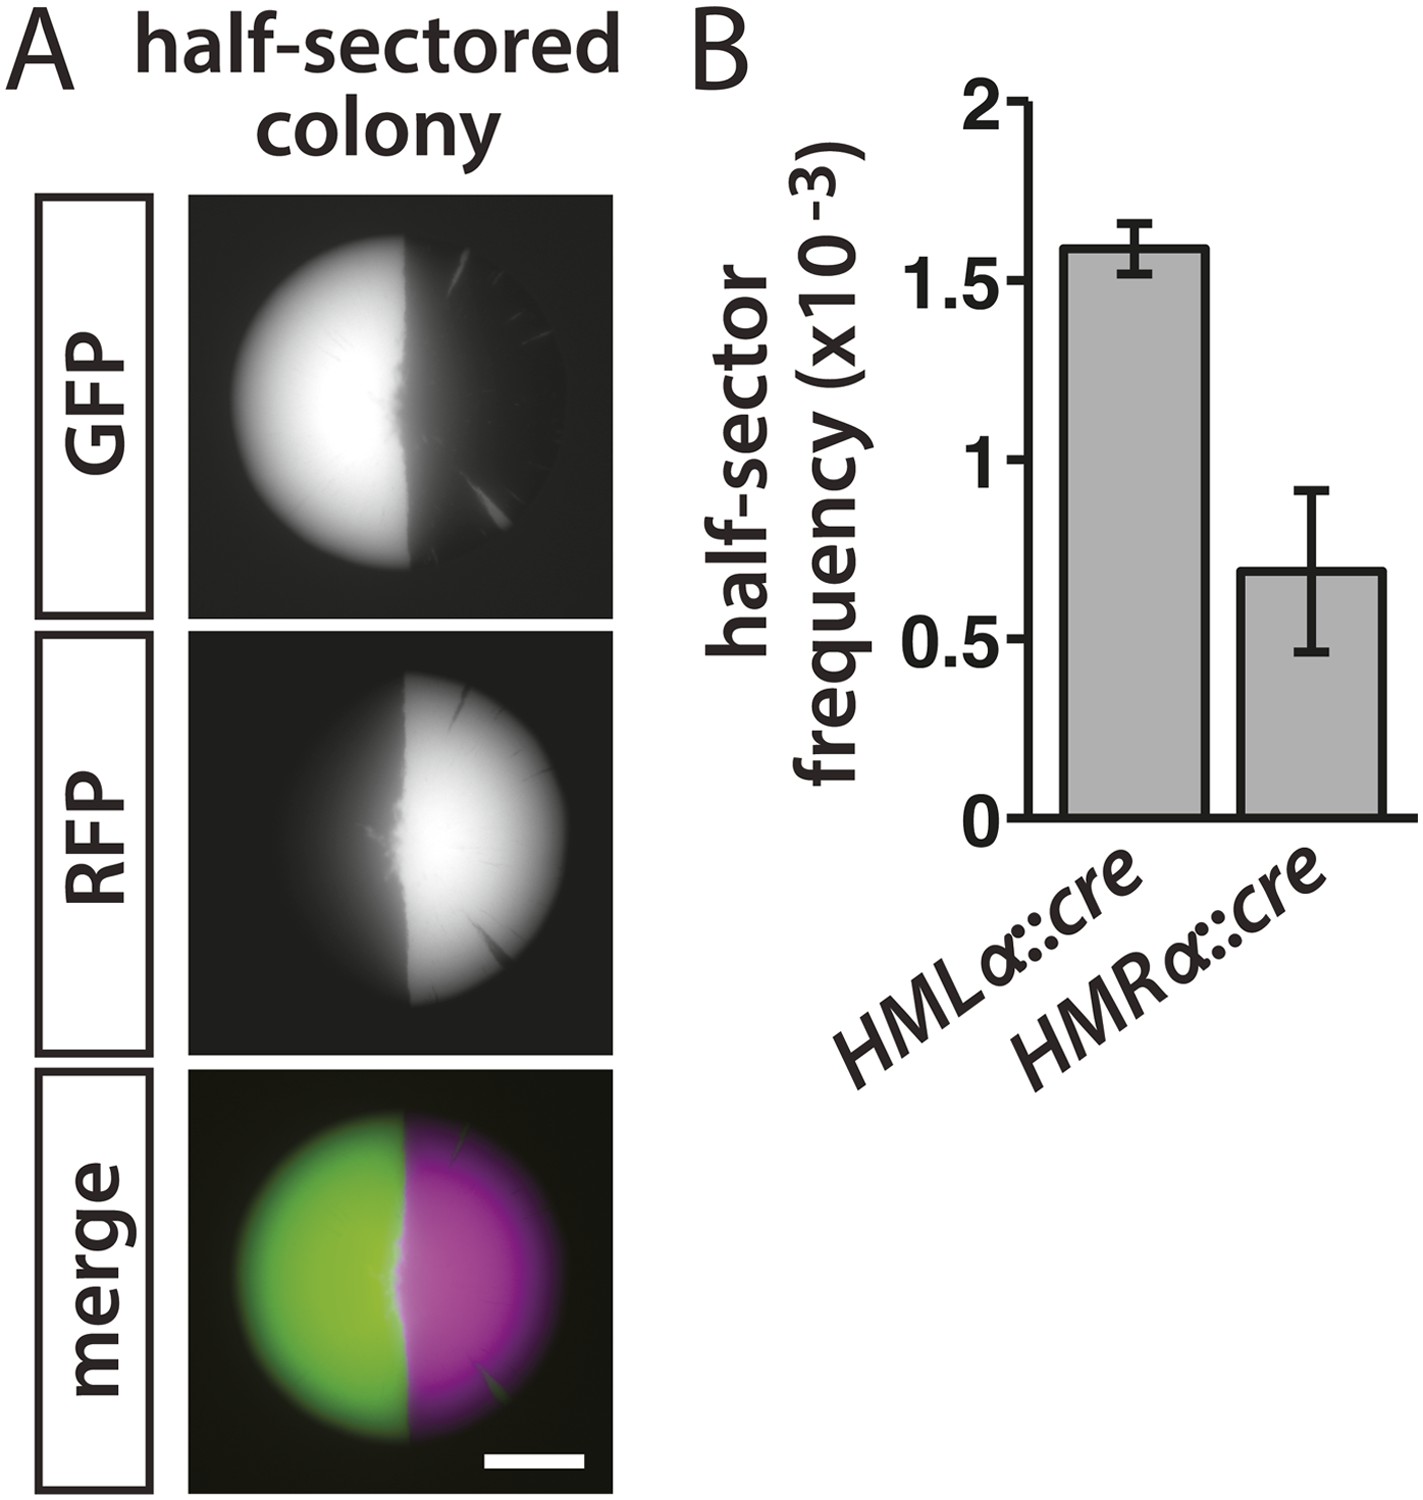
Rates of silencing loss as measured by half-sector frequency.
(A) Example of a half-sectored colony derived from a single cell containing HMLα::cre and the RFP-GFP cassette. Scale bar, 1 mm. (B) Frequency of half-sectored colonies. The half-sector frequency of a strain containing the cre gene at HMLα (JRY9628) was significantly different (p = 0.003; Student's t test) from the half-sector frequency of a strain containing the cre gene at HMRα (JRY9629). Data are means ± SD (n = 3).
Figure 4 with 2 supplements
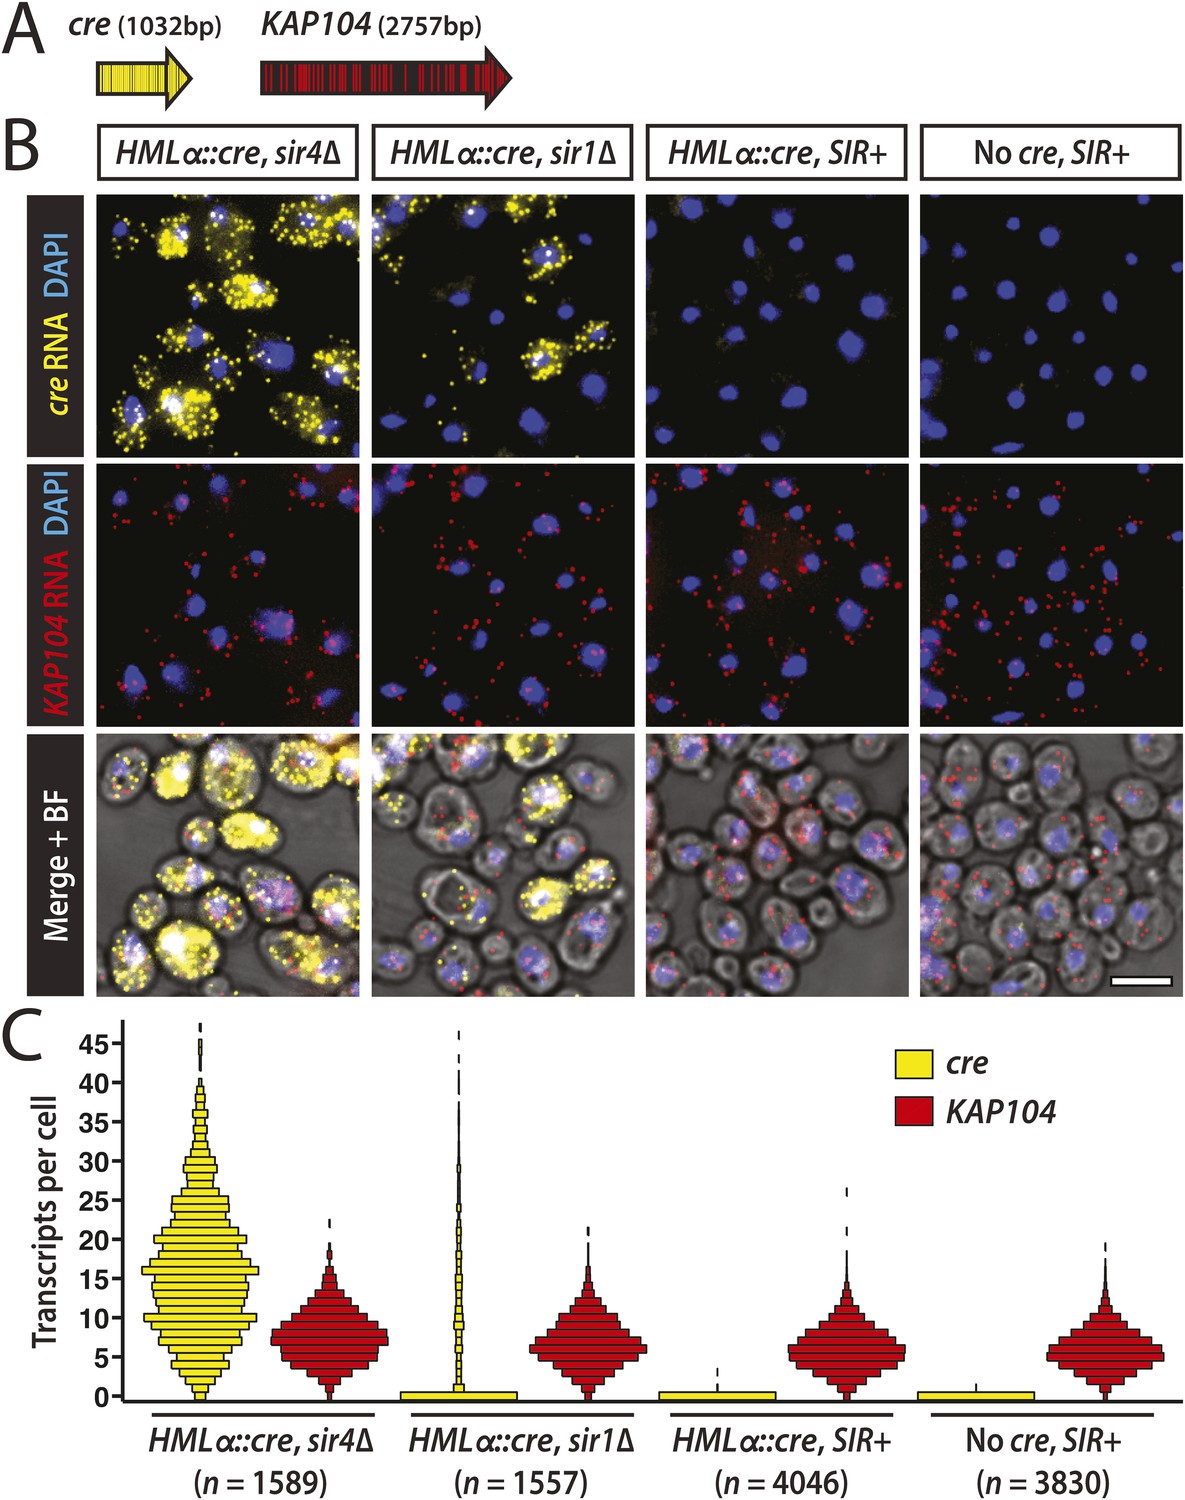
Single-molecule imaging of HMLα::cre transcription.
(A) Schematic of the cre and KAP104 coding sequences (black arrows), with colored lines representing sites targeted by the 20-nucleotide FISH probes (see Supplementary file 4 for probe sequences). To detect both RNA sequences in the same cell, the cre-specific and KAP104-specific probes were differentially labeled. (B) Single-molecule RNA FISH of cre (yellow) and KAP104 (red) transcripts shown as maximum-intensity projections of z-stacks. DNA was stained with 4′,6-diamidino-2-phenylindole (DAPI) (blue). Merged images were superimposed on the corresponding brightfield (BF) micrographs. Larger fields are shown in Figure 4—figure supplement 1. Scale bar, 5 μm. (C) Distributions of cre and KAP104 RNA abundance determined by FISH. Each violin plot was normalized so that maximum bin width was the same across all samples. Data shown are from a representative replicate.
Figure 4—figure supplement 1
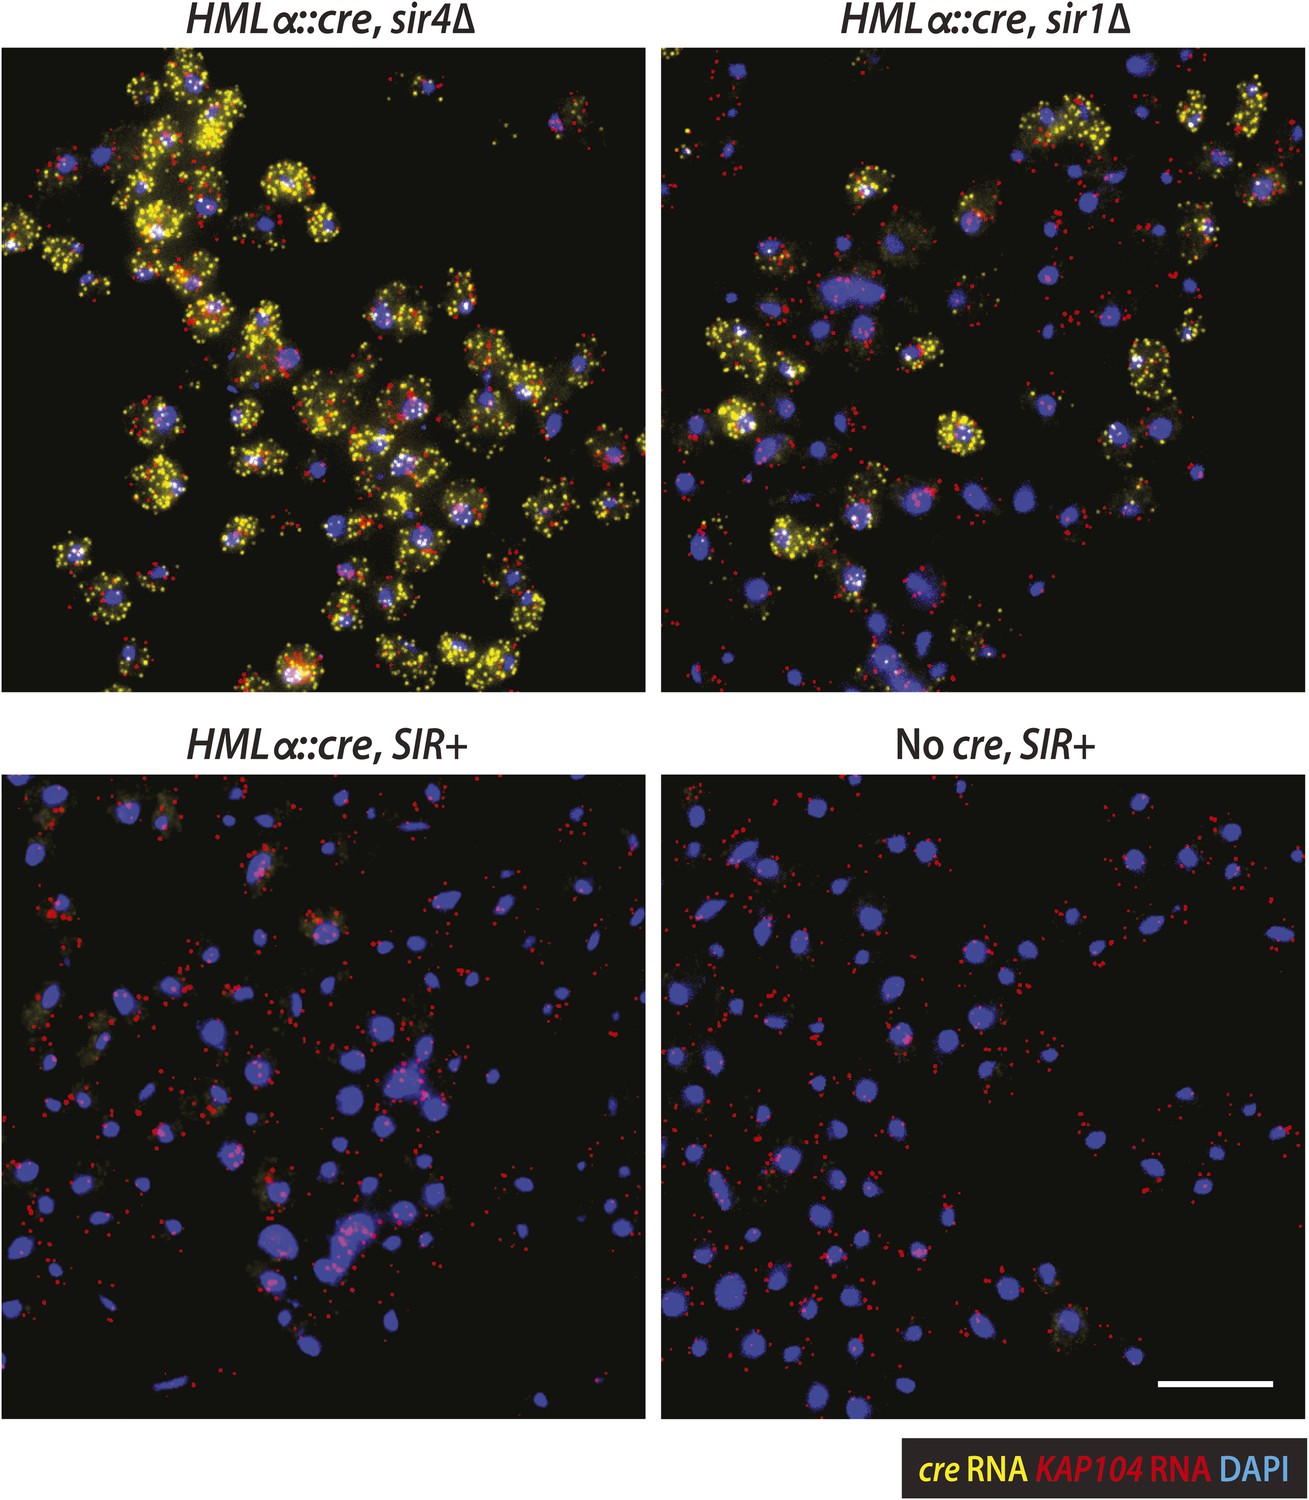
Imaging of HMLα::cre and KAP104 transcription.
Larger fields of the RNA FISH, as described in Figure 4. Maximum-intensity projections of cre RNA (yellow), KAP104 RNA (red) and 4′,6-diamidino-2-phenylindole (DAPI) (blue) were merged. Scale bar, 10 μm.
Figure 4—figure supplement 2
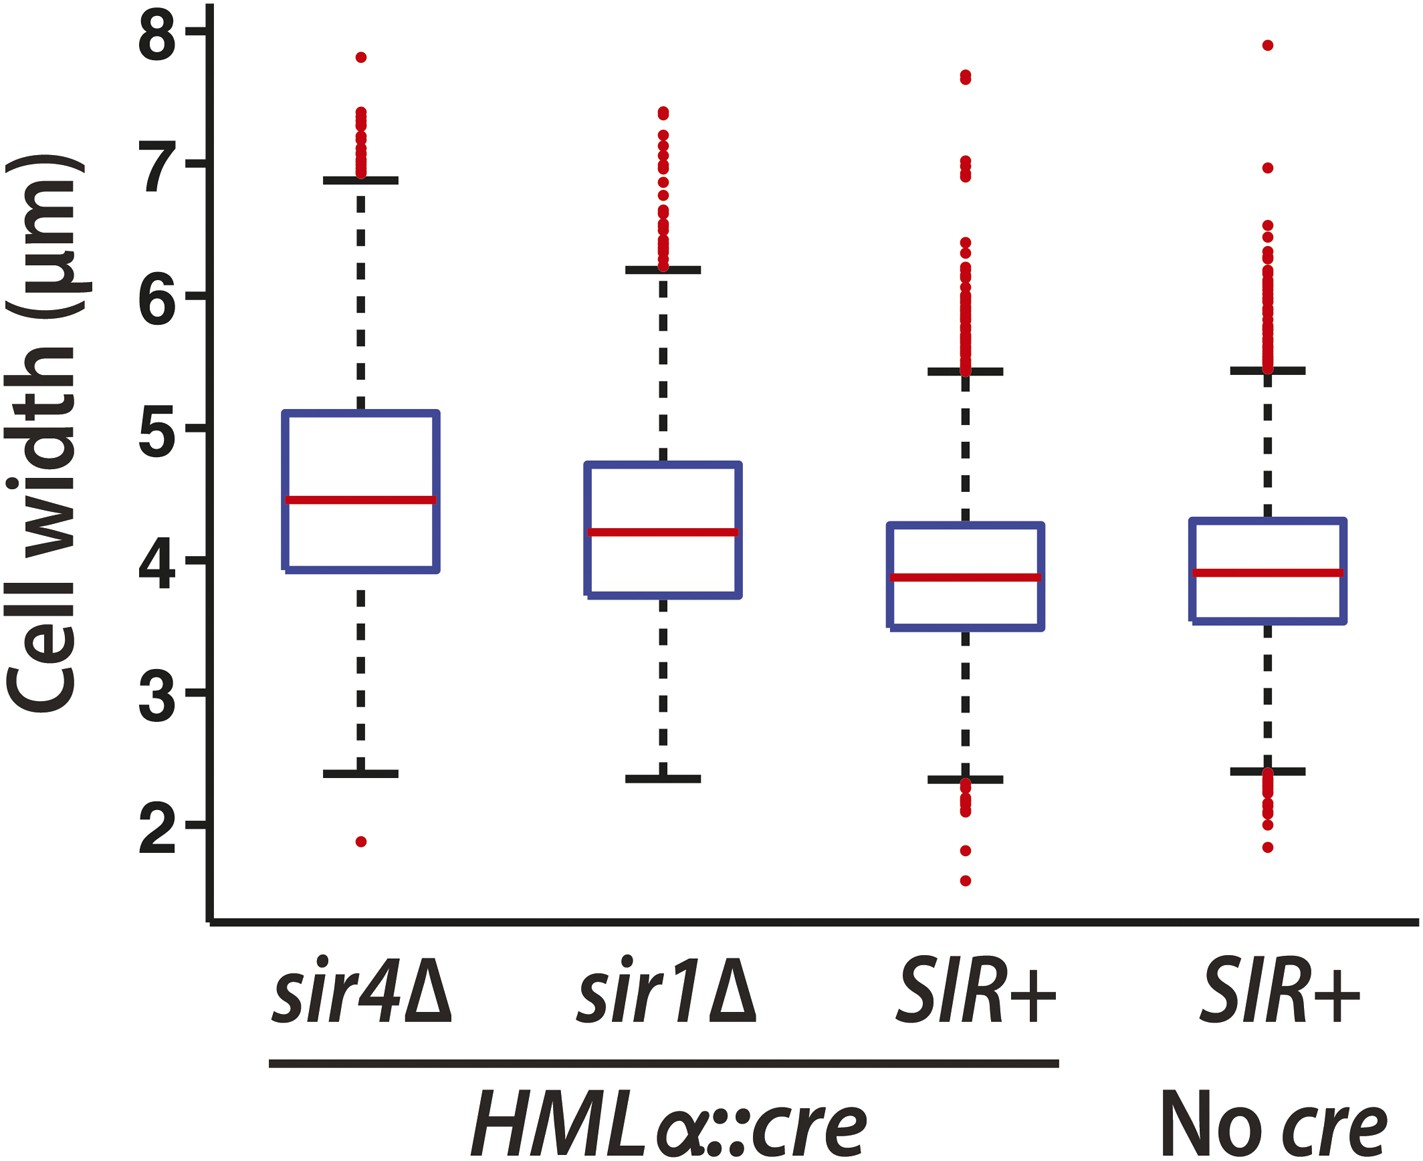
Boxplots of cell widths measured using brightfield images from the RNA FISH replicate shown in Figure 4C.
The widths of 1000s of hand-drawn cell boundaries were quantified using Matlab (MathWorks). Red lines represent the median values. The whiskers (dashed lines) extend to the values within 1.5 times the interquartile range (box). Outliers are shown as red points.
Figure 5 with 1 supplement
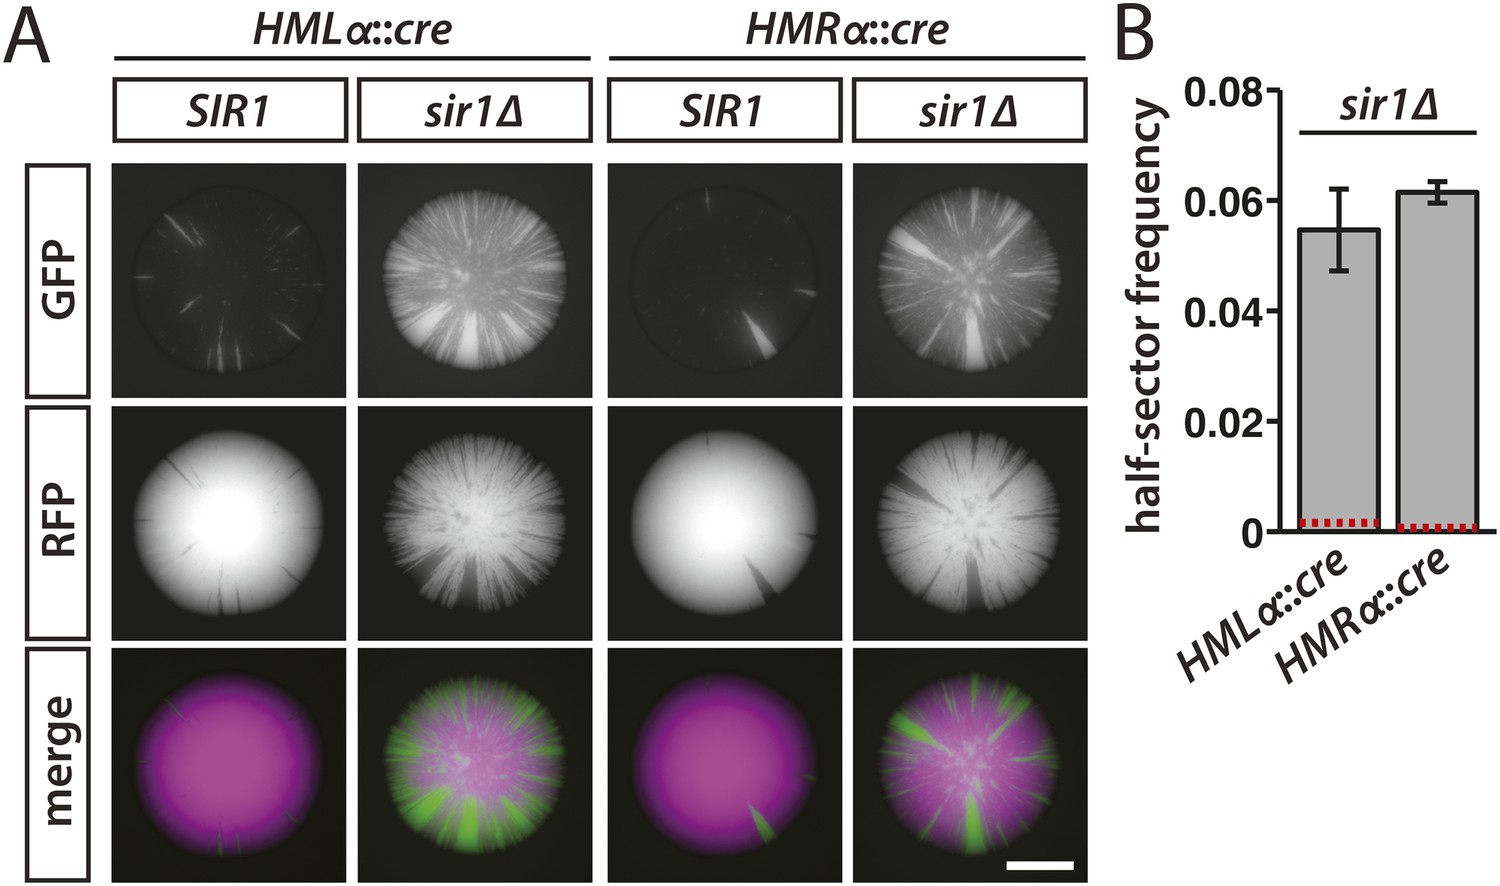
Increased silencing loss in cells lacking Sir1.
(A) Fluorescence of colonies derived from SIR1 and sir1Δ cells containing the RFP-GFP cassette and either HMLα::cre or HMRα::cre. All colonies shown were grown from MATa spores of JRY9729 and JRY9730 tetrad dissections. Additional colonies are shown in Figure 5—figure supplement 1. Scale bar, 1 mm. (B) Frequencies of half-sectored colonies for haploid strains carrying the sir1Δ mutation and either HMLα::cre (JRY9739) or HMRα::cre (JRY9740). For both HMLα::cre- and HMRα::cre-containing strains, the half-sector frequency of the sir1Δ mutant was significantly higher (p = 2 × 10⁻⁴ for HMLα::cre, p = 7 × 10⁻⁷ for HMRα::cre; Student's t test) than the half-sector frequency of wild type (red dotted lines represent the rates shown in Figure 3B). Data are means ± SD (n = 3).
Figure 5—figure supplement 1
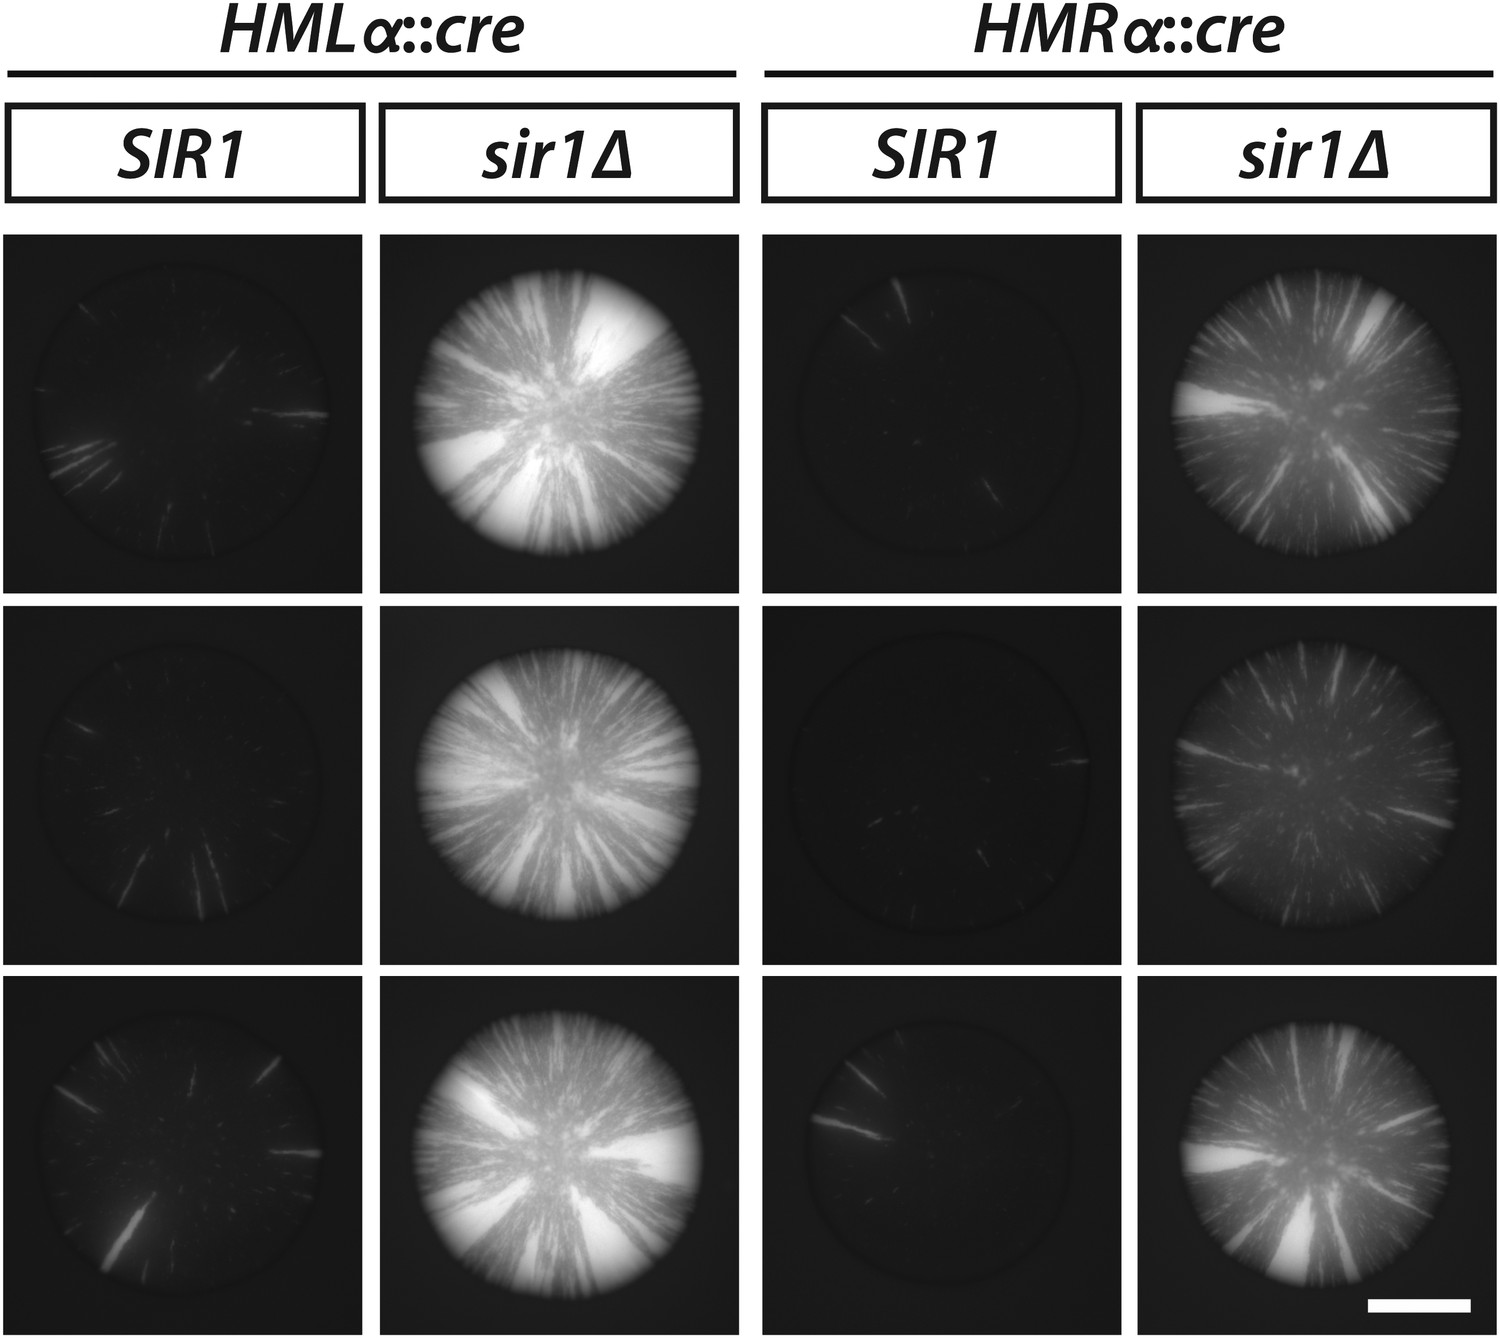
GFP fluorescence of additional SIR1 and sir1Δ colonies carrying the RFP-GFP cassette and either HMLα::cre or HMRα::cre.
Scale bar, 1 mm.
Figure 6 with 1 supplement
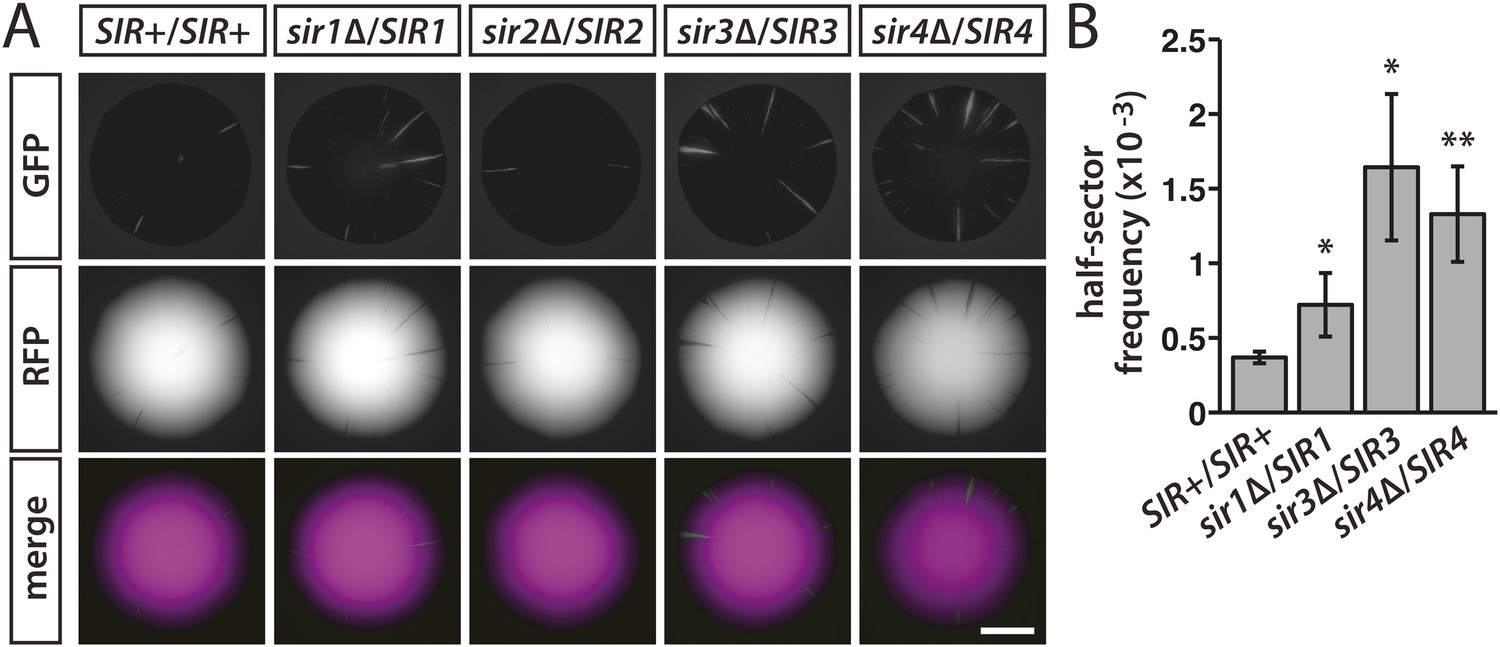
Stability of silencing at HML in diploids hemizygous for individual SIR genes.
(A) Fluorescence of colonies derived from single diploid cells containing one copy of HMLα::cre, one copy of the RFP-GFP cassette, and the indicated SIR genotypes. Additional colonies are shown in Figure 6—figure supplement 1. Scale bar, 2 mm. (B) Frequencies of half-sectored colonies for a wild-type diploid and different sir hemizygotes. The half-sector frequencies of the sir1, sir3 and sir4 hemizygotes were significantly higher (*p < 0.05, **p < 0.01; Student's t test) than the half-sector frequency of the wild-type diploid. Data are means ± SD (n = 3). The frequency of half-sectored colonies was not determined for the sir2 hemizygote.
Figure 6—figure supplement 1
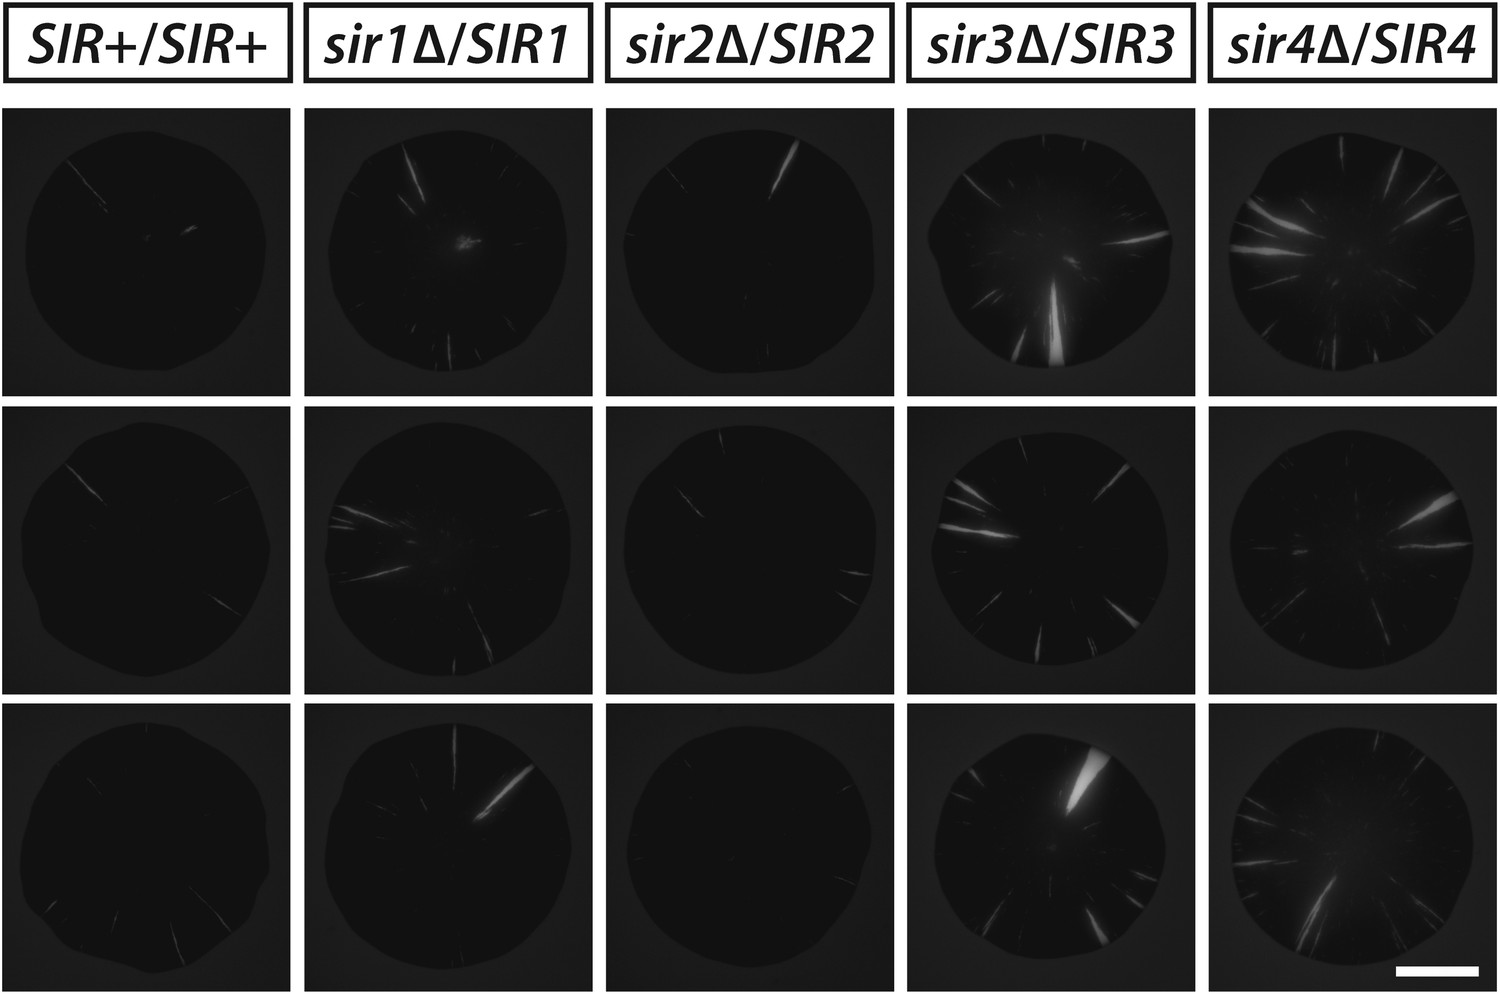
GFP fluorescence of additional colonies derived from single diploid cells hemizygous for individual SIR genes.
All strains contained one copy of HMLα::cre and one copy of the RFP-GFP cassette. Scale bar, 2 mm.
Figure 7 with 2 supplements
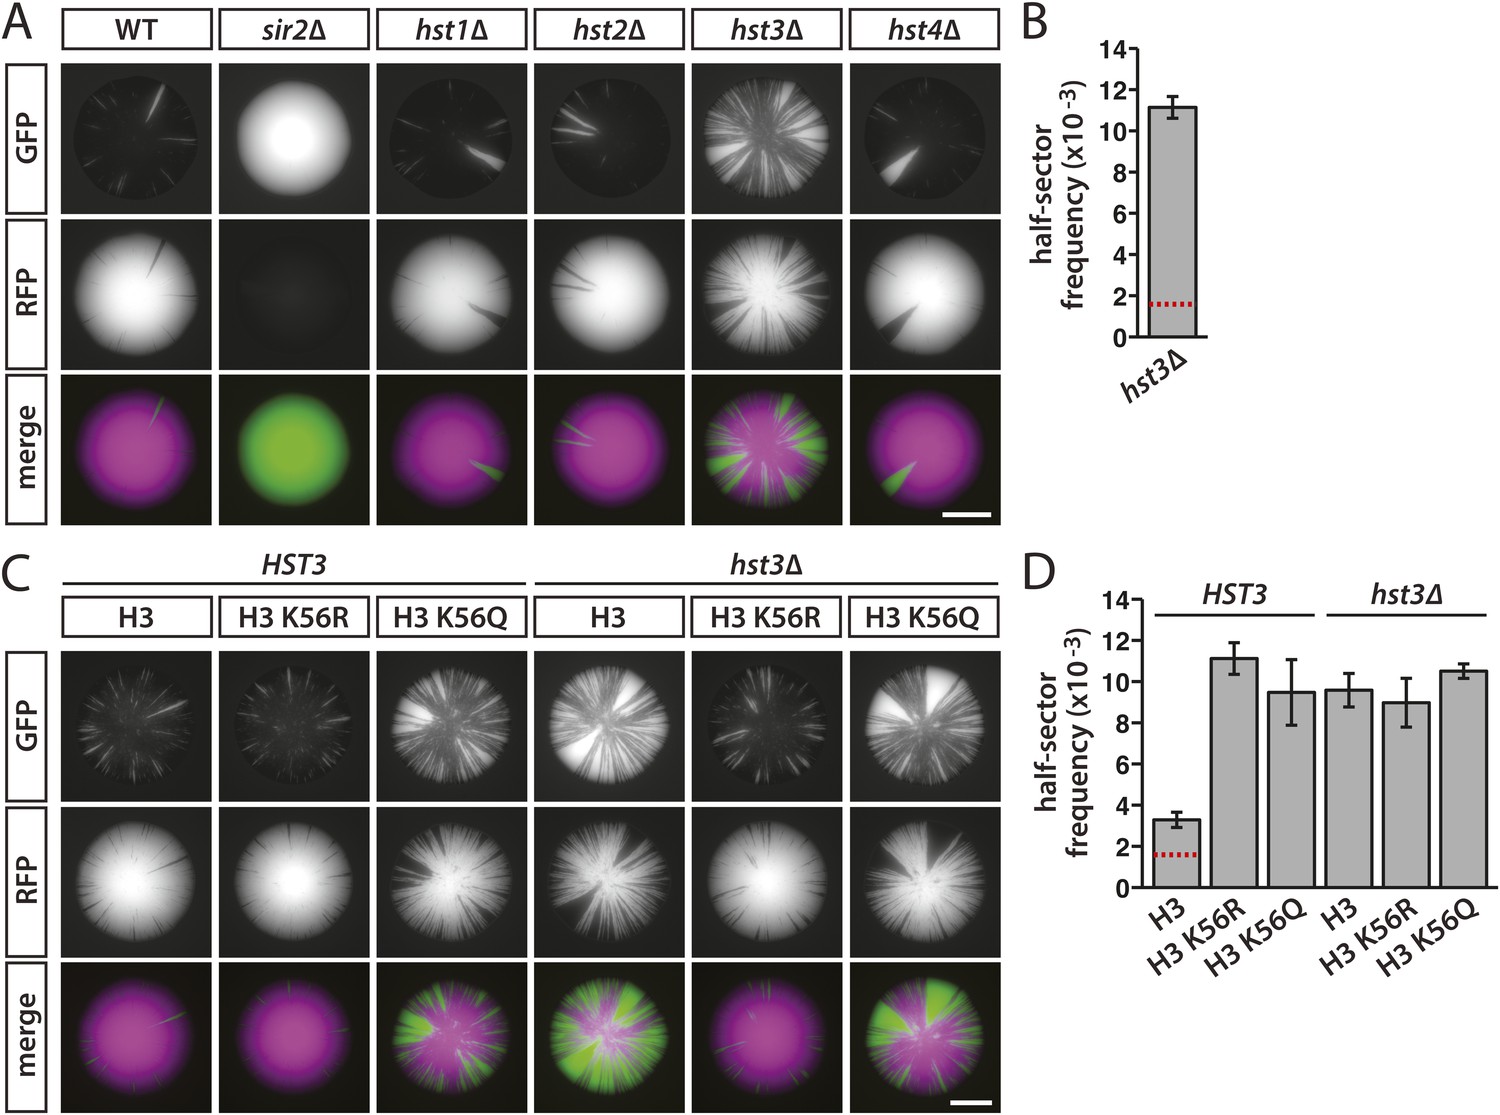
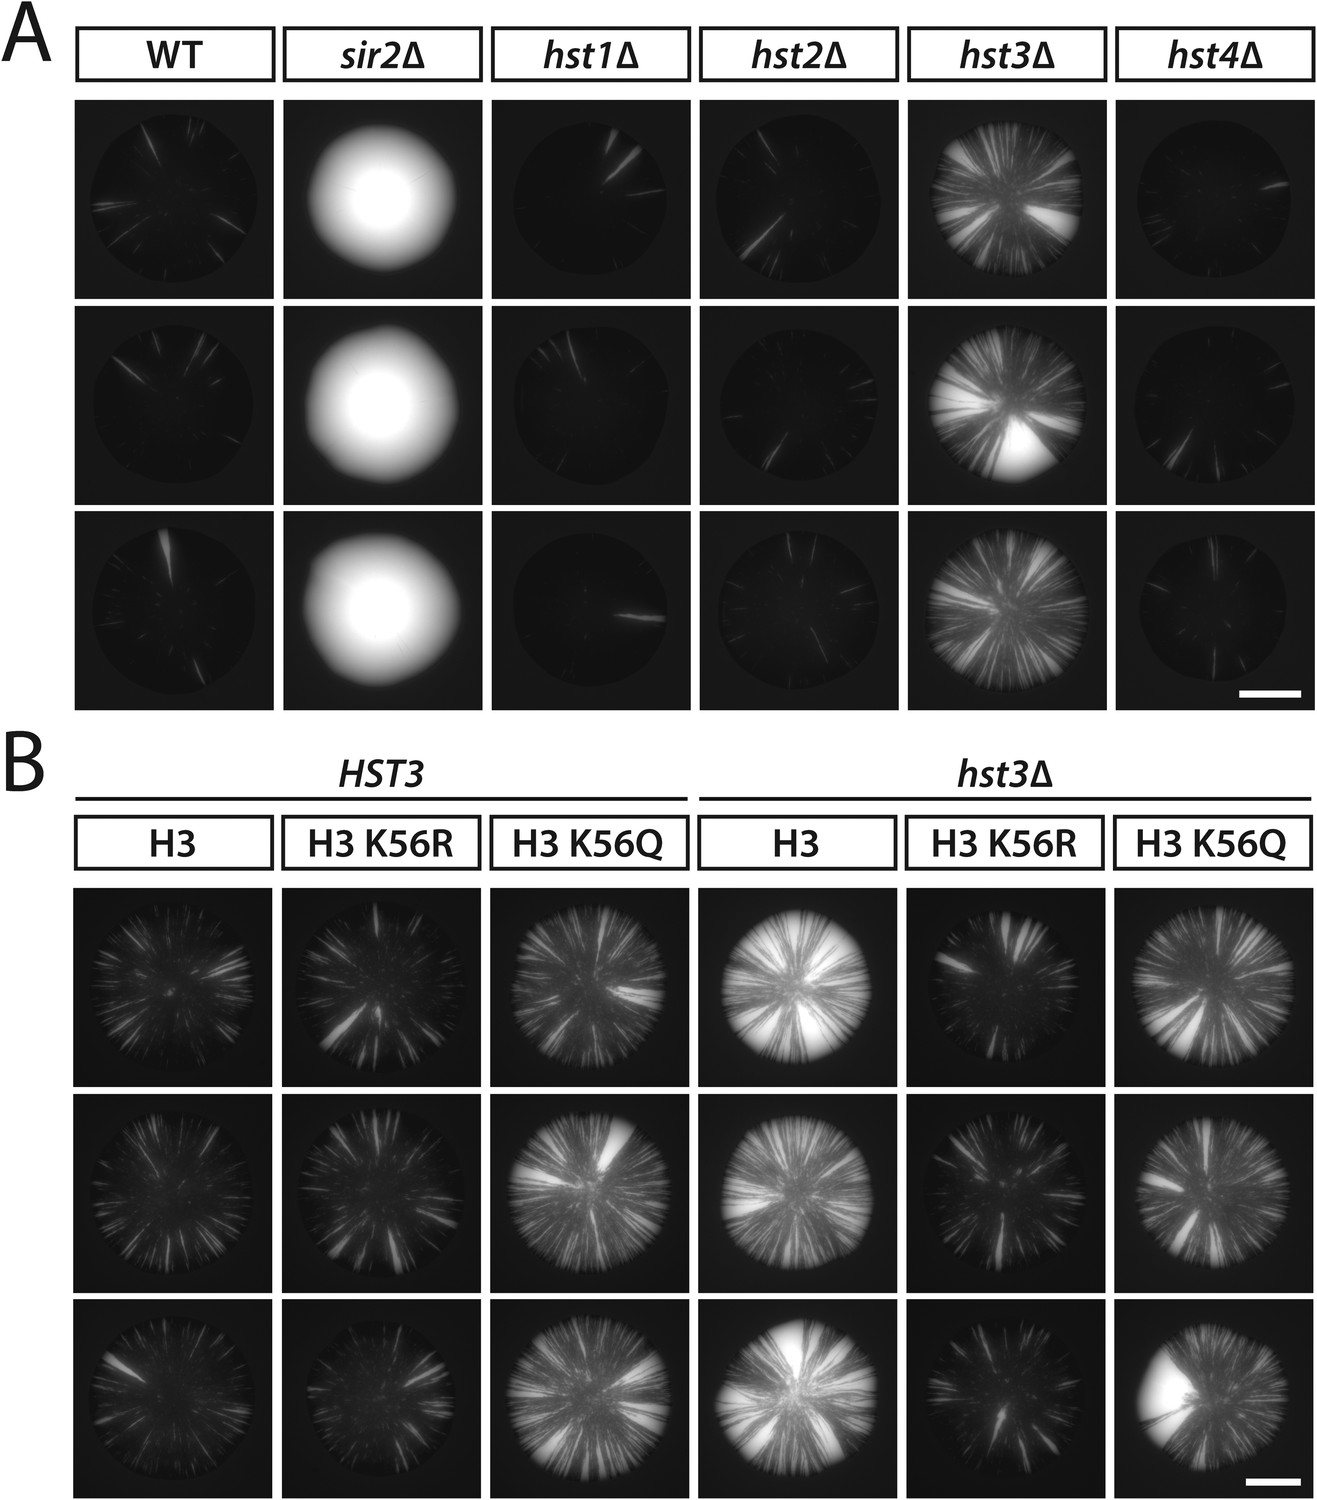
Effects of sirtuin gene deletions and histone H3 K56R or K56Q substitutions on the stability of silencing at HML.
(A) Fluorescence of colonies derived from single cells containing HMLα::cre, the RFP-GFP cassette, and the indicated deletions. Additional colonies are shown in Figure 7—figure supplement 1A. Scale bar, 2 mm. (B) Frequency of half-sectored colonies for the hst3Δ mutant shown in panel A. The half-sector frequency of the hst3Δ mutant was significantly greater (p = 6 × 10⁻⁶; Student's t test) than the half-sector frequency of wild type (red dotted line represents the rate shown in Figure 3B). Data are means ± SD (n = 3). The frequency of half-sectored colonies was not determined for the hst1Δ, hst2Δ or hst4Δ mutant. (C) Fluorescence of colonies derived from single cells containing HMLα::cre, the RFP-GFP cassette, hht1-hhf1Δ and hht2-hhf2Δ mutations, and a plasmid-borne copy of either HHT2-HHF2, hht2K56R-HHF2 or hht2K56Q-HHF2. Additional colonies are shown in Figure 7—figure supplement 1B. Scale bar, 2 mm. (D) Frequency of half-sectored colonies for the genotypes shown in panel C. The half-sector frequency of the wild-type strain containing only one copy of the histone H3–H4 gene pair was significantly higher (p = 0.001; Student's t test) than the half-sector frequency of the strain shown in Figure 3B containing both copies of the histone H3–H4 gene pair (red dotted line) (see Figure 7—figure supplement 2). Data are means ± SD (n = 3).
Figure 7—figure supplement 1
Additional colonies showing the effects of sirtuin gene deletions and histone H3 K56 substitutions on the stability of silencing at HML.
(A) GFP fluorescence of additional colonies lacking individual sirtuins. All strains contained HMLα::cre and the RFP-GFP cassette. Scale bar, 2 mm. (B) GFP fluorescence of additional HST3 and hst3Δ colonies carrying the indicated histone H3 K56 alleles. All strains contained HMLα::cre and the RFP-GFP cassette. Scale bar, 2 mm.
Figure 7—figure supplement 2
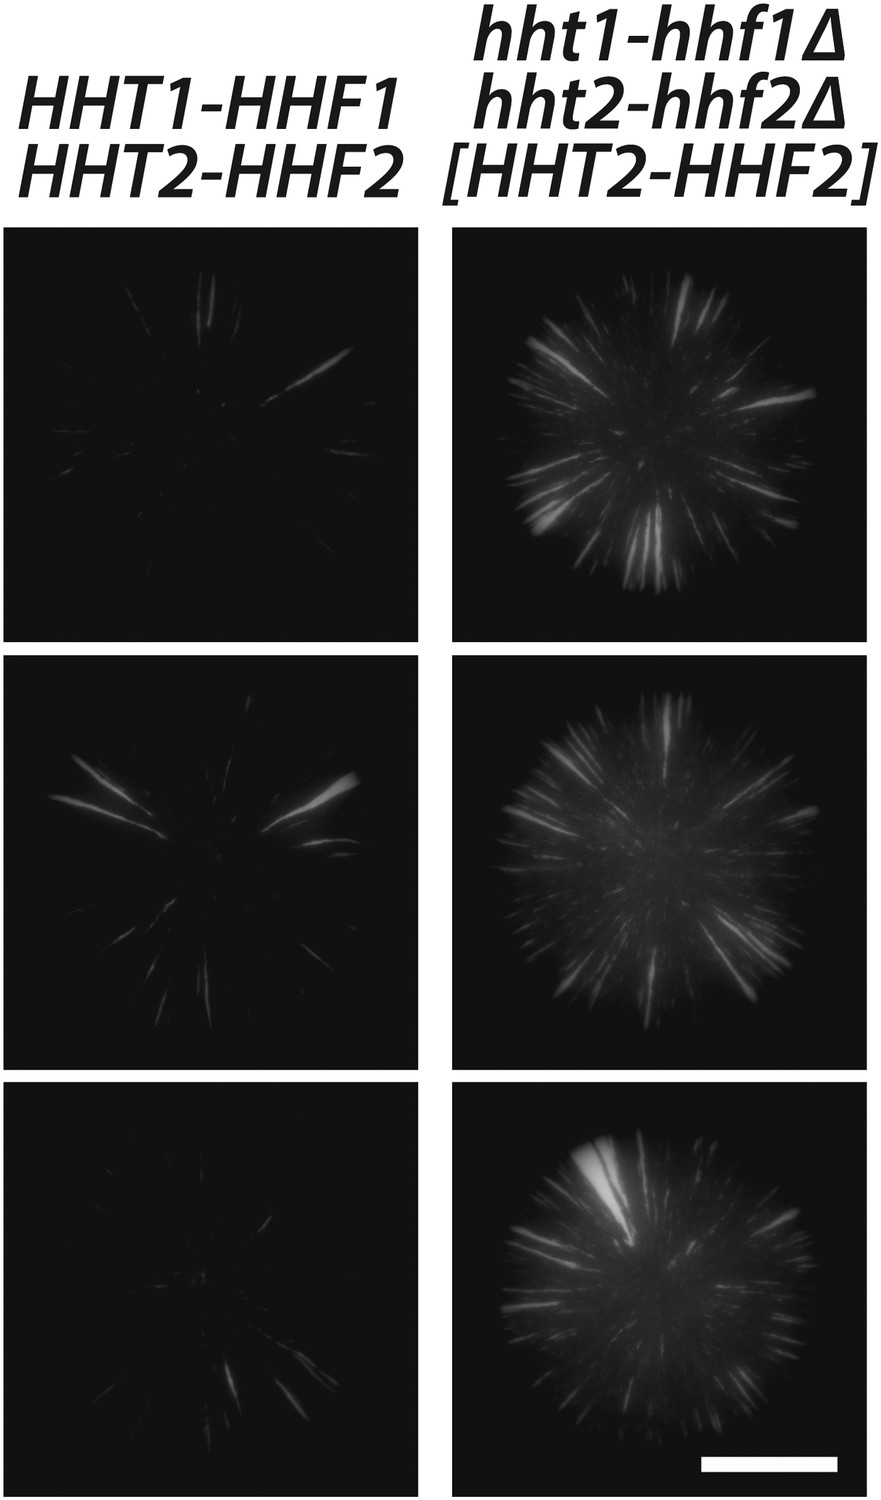
Histone H3–H4 gene dosage effect on silencing at HML.
GFP fluorescence of colonies derived from single cells containing HMLα::cre, the RFP-GFP cassette, and either the native histone H3–H4 gene pairs (JRY9628), or deletions of both histone H3–H4 gene pairs and a plasmid-borne copy of HHT2–HHF2 (JRY9639). Scale bar, 2 mm.
Figure 8 with 1 supplement
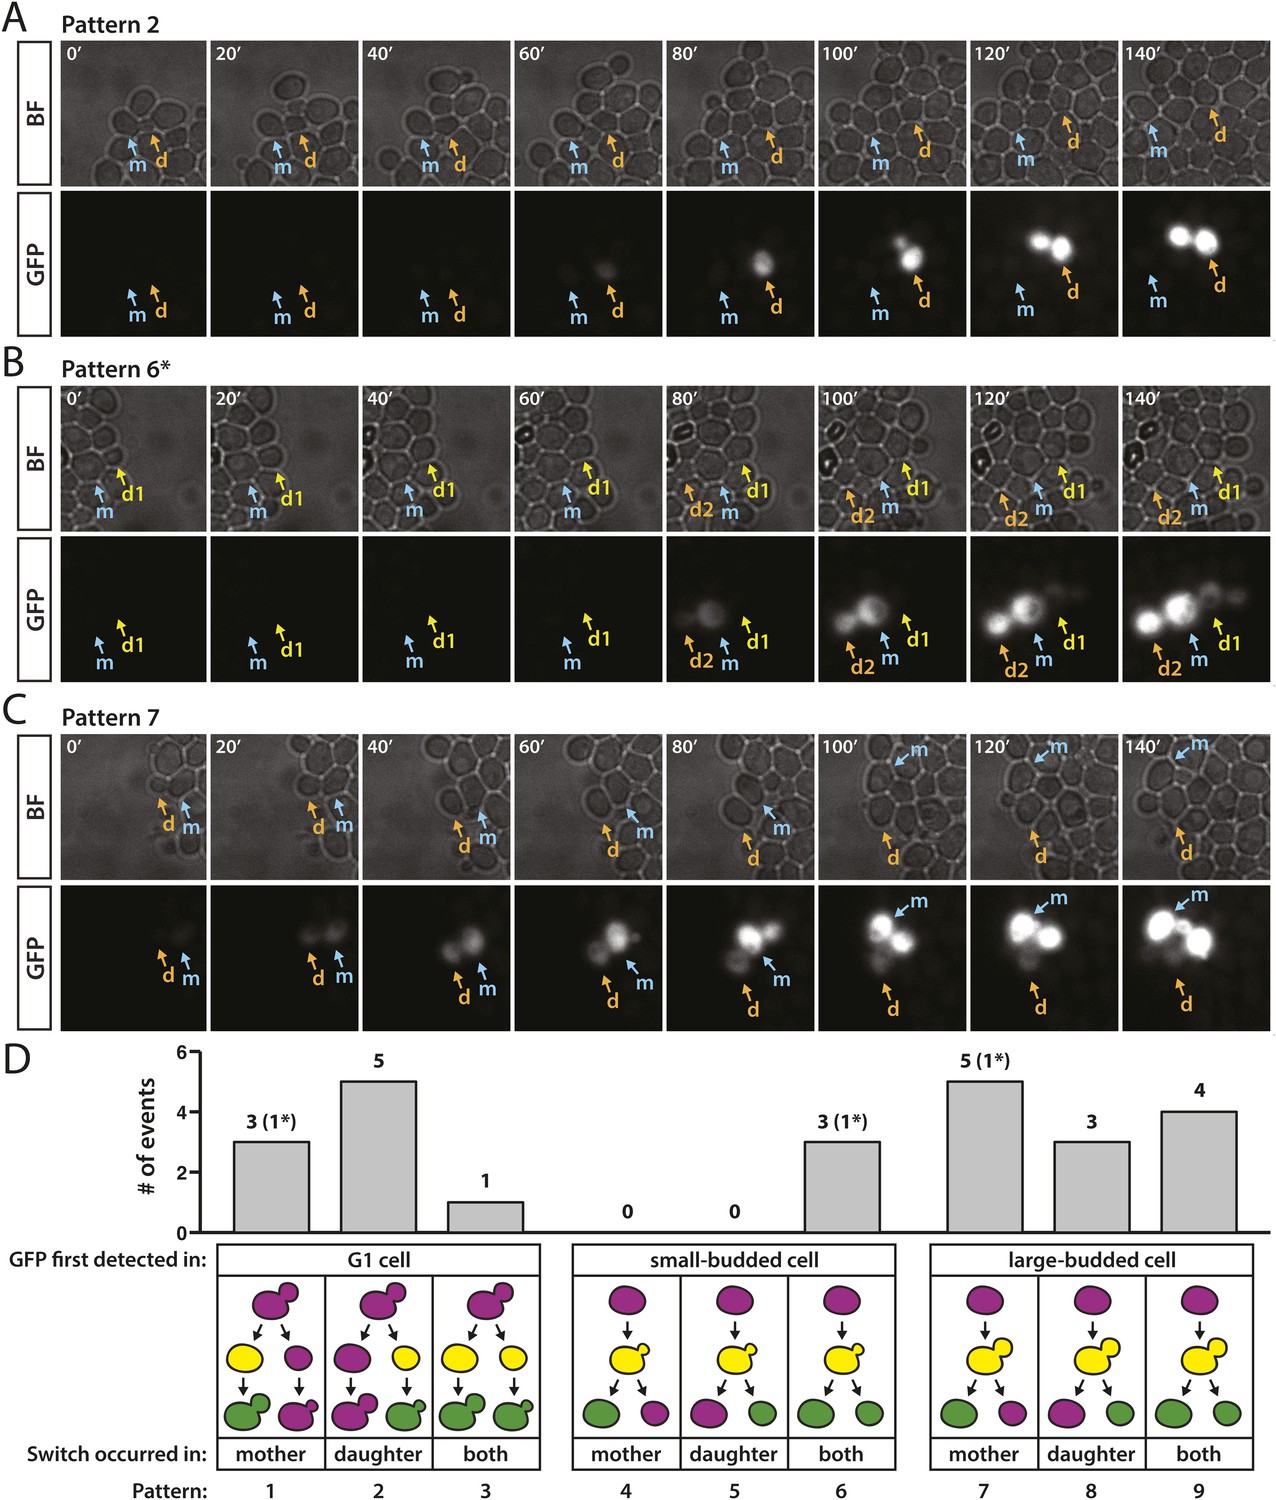
Patterns of RFP-to-GFP switches observed in real time.
(A–C) Brightfield (BF) and GFP fluorescence montages (shown in 20-min intervals, 140 min total) showing different switching patterns of wild-type cells containing HMLα::cre and the RFP-GFP cassette. Labeled arrows track the mother (m) and daughter (d) cells of interest. (A) GFP expression first detected in an unbudded daughter cell. (B) GFP expression first detected in a small-budded cell. Both the mother (m) and daughter (d2) cells remained GFP-positive (pattern 6). *A second RFP-to-GFP switch occurred in the daughter (d1) of the preceding cell division (see Figure 8—figure supplement 1, pedigree B). (C) GFP expression first detected in a large-budded cell. Only the mother (m) cell remained GFP-positive. (D) Distribution of different switch patterns. RFP-to-GFP switches were initially categorized by bud morphology at the time that GFP expression was first detected (depicted as yellow cells in the cartoons since RFP was still present). Events in each bud category were then classified according to whether the mother cell, daughter cell, or both underwent recombination of the RFP–GFP cassette, as determined by whether they continued to express GFP (depicted as green cells in the last phase of the pedigree cartoons). Asterisks denote the number of events within a particular category that were associated with a second switch in a directly related cell (see Figure 8—figure supplement 1).
Figure 8—figure supplement 1
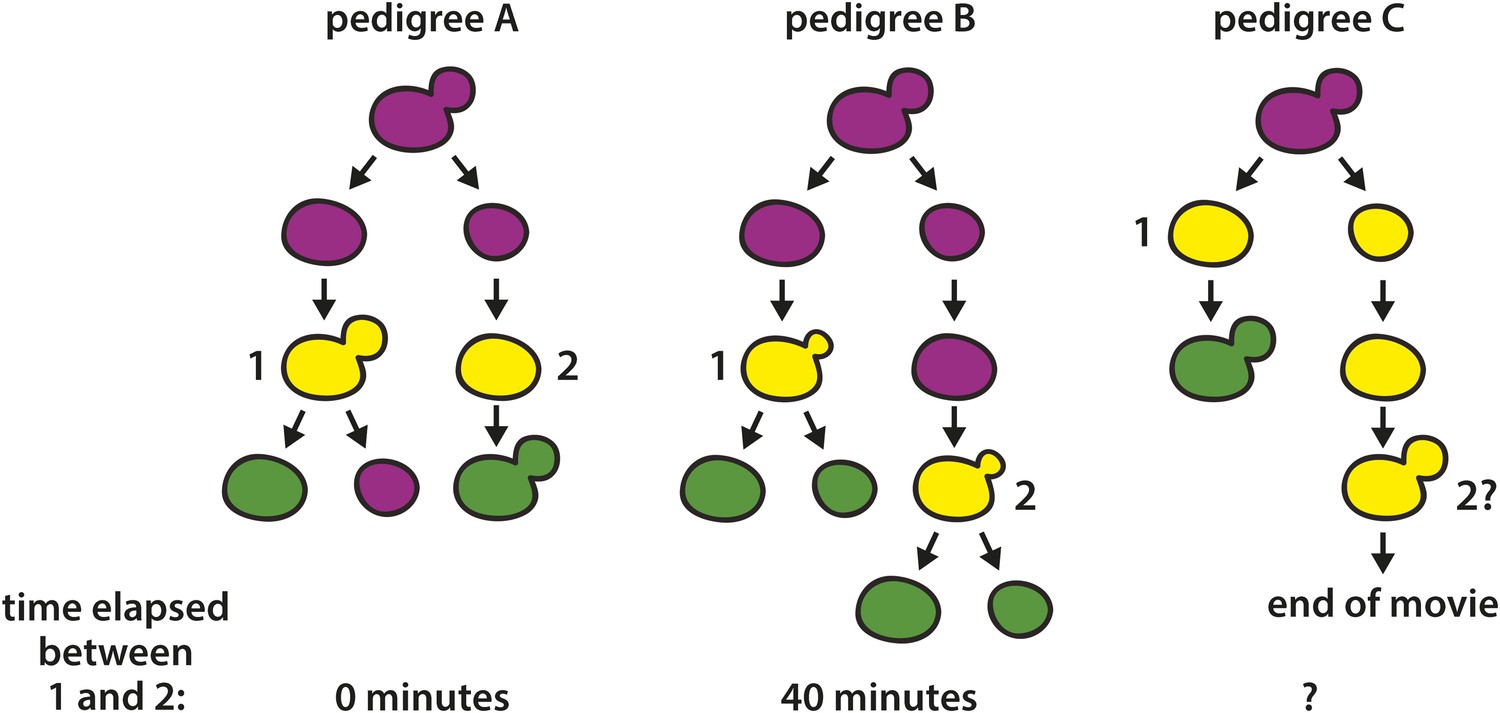
Cartoons of lineages that showed two RFP-to-GFP switches in directly related cells.
Switches are labeled with the numbers 1 and 2. In pedigree A, onset of GFP expression (depicted as yellow) was detected in a large-budded cell (1). At the same time, GFP also appeared in the daughter cell that arose from the previous cell division (2). Due to the assymetry of switch 1 (only the mother cell remained green, implying that recombination occurred after DNA replication), switches 1 and 2 must have arisen from independent recombination events. It is unknown, however, whether the two recombination events resulted from two losses of silencing, or rather one loss of silencing that occurred when the two cells shared a cytoplasm (earliest stage shown for the pedigree). In pedigree B (montage shown in Figure 8B), GFP fluorescence was first detected in a small-budded cell that gave rise to two cells that remained green (1). Approximately 40 min later, the daughter cell of the preceding cell division also began to show GFP fluorescence as a small-budded cell. In pedigree C, GFP expression was first detected in a mother-daughter pair subsequent to cytokinesis, but prior to both cells budding. Whereas the mother cell became green, however, the daughter cell developed a large bud without ever reaching a similar level of GFP expression, at which point the experiment ended. This pattern could be explained by two switching events, one early asymmetric switch where only the mother inherited a recombined RFP–GFP cassette and the daughter cell inherited GFP molecules along with an intact RFP–GFP cassette, followed by a later switch that occurred in the daughter cell. Alternatively, there could have been only one early switch where the RFP–GFP cassette inherited by the daughter cell either did not undergo recombination and GFP perdurance was especially long, or the cassette did undergo recombination, but GFP expression was weak, perhaps due to an error in recombination.
Videos
Video 1
RFP-to-GFP switch captured in real time.
Time-lapse imaging of wild-type cells containing HMLα::cre and the RFP-GFP cassette. Images were taken every 10 min for 13 hr.
Tables
Table 1
Frequency of half-sectored colonies for each strain that showed a sectoring phenotype
| Figure | Strain | Relevant genotype | Half-sector frequency |
|---|---|---|---|
| 3 | JRY9628 | matΔ HMLα::cre | 0.00158 ± 0.00007 |
| JRY9629 | matΔ HMRα::cre | 0.0007 ± 0.0002 | |
| 5 | JRY9739 | MATa HMLα::cre sir1Δ | 0.055 ± 0.007 |
| JRY9740 | MATa HMRα::cre sir1Δ | 0.061 ± 0.002 | |
| 6 | JRY9731 | MATα/matΔ HMLα/HMLα::cre | 0.00037 ± 0.00004 |
| JRY9732 | MATα/matΔ HMLα/HMLα::cre sir1Δ/SIR1 | 0.0007 ± 0.0002 | |
| JRY9734 | MATα/matΔ HMLα/HMLα::cre sir3Δ/SIR3 | 0.0016 ± 0.0005 | |
| JRY9735 | MATα/matΔ HMLα/HMLα::cre sir4Δ/SIR4 | 0.0013 ± 0.0003 | |
| 7 | JRY9636 | matΔ HMLα::cre hst3Δ | 0.0111 ± 0.0005 |
| JRY9639 | MATa HMLα::cre hht1-hhf1Δ hht2-hhf2Δ [HHT2-HHF2] | 0.0033 ± 0.0004 | |
| JRY9640 | MATa HMLα::cre hht1-hhf1Δ hht2-hhf2Δ [hht2K56R-HHF2] | 0.0111 ± 0.0008 | |
| JRY9641 | MATa HMLα::cre hht1-hhf1Δ hht2-hhf2Δ [hht2K56Q-HHF2] | 0.009 ± 0.002 | |
| JRY9736 | MATa HMLα::cre hst3Δ hht1-hhf1Δ hht2-hhf2Δ [HHT2-HHF2] | 0.0096 ± 0.0008 | |
| JRY9737 | MATa HMLα::cre hst3Δ hht1-hhf1Δ hht2-hhf2Δ [hht2K56R-HHF2] | 0.009 ± 0.001 | |
| JRY9738 | MATa HMLα::cre hst3Δ hht1-hhf1Δ hht2-hhf2Δ [hht2K56Q-HHF2] | 0.0105 ± 0.0004 |
-
All values represent the mean of three independent experiments ± standard deviation. Full dataset is shown in Table 1—source data 1. All strains contained a copy of the RFP-GFP cassette. See Supplementary file 1 for full genotypes.
-
Table 1—source data 1
Half-sector frequencies from three independent experiments.
- https://doi.org/10.7554/eLife.05007.008
Table 2
Summary of single-molecule RNA FISH statistics
| RNA | Genotype | Mean spots per cell | Variance | % Cells with >0 spots | % Cells with >1 spot |
|---|---|---|---|---|---|
| cre | HMLα::cre, sir4Δ | 12 ± 2 | 53 ± 9 | 98 ± 1 | 95 ± 2 |
| HMLα::cre, sir1Δ | 5 ± 1 | 58 ± 13 | 46 ± 7 | 41 ± 7 | |
| HMLα::cre, SIR+ | <0.005 | – | 0.42 ± 0.07 | 0.04 ± 0.01 | |
| No cre, SIR+ | <0.003 | – | 0.3 ± 0.1 | 0 | |
| KAP104 | HMLα::cre, sir4Δ | 7.3 ± 0.4 | 11 ± 1 | 99.0 ± 0.3 | 97.2 ± 0.8 |
| HMLα::cre, sir1Δ | 7.1 ± 0.2 | 10.8 ± 0.9 | 99.28 ± 0.04 | 97.5 ± 0.1 | |
| HMLα::cre, SIR+ | 6.1 ± 0.2 | 7.8 ± 0.3 | 99.1 ± 0.2 | 96.5 ± 0.8 | |
| No cre, SIR+ | 5.9 ± 0.5 | 7.1 ± 0.5 | 99.0 ± 0.7 | 96 ± 2 |
-
All values represent the mean of three independent experiments ± standard error of the mean. Full dataset is shown in Table 2—source data 1.
-
Table 2—source data 1
Single-molecule RNA FISH values from three independent experiments.
- https://doi.org/10.7554/eLife.05007.013
Additional files
-
Supplementary file 1
Table of yeast strains used in this study. Strain JRY4012 originated from Fox et al. (1995). All other strains were constructed for this study.
- https://doi.org/10.7554/eLife.05007.024
-
Supplementary file 2
Table of plasmids used in this study. Plasmid pJR3214 was constructed for this study. Plasmid pJR2657 originated from Dion et al. (2005). All other plasmids originated from the Rine laboratory plasmid collection.
- https://doi.org/10.7554/eLife.05007.025
-
Supplementary file 3
Table of oligonucleotides used in this study.
- https://doi.org/10.7554/eLife.05007.026
-
Supplementary file 4
Table of FISH probes used in this study.
- https://doi.org/10.7554/eLife.05007.027
Download links
A two-part list of links to download the article, or parts of the article, in various formats.
Downloads (link to download the article as PDF)
Open citations (links to open the citations from this article in various online reference manager services)
Cite this article (links to download the citations from this article in formats compatible with various reference manager tools)
Heritable capture of heterochromatin dynamics in Saccharomyces cerevisiae
eLife 4:e05007.
https://doi.org/10.7554/eLife.05007


