Specificity in endoplasmic reticulum-stress signaling in yeast entails a step-wise engagement of HAC1 mRNA to clusters of the stress sensor Ire1
- San Raffaele Scientific Institute, Italy
- Howard Hughes Medical Institute, University of California, San Francisco, United States
- University of California, San Francisco, United States
- Center for Applied Medical Research, Spain
Figures
Figure 1
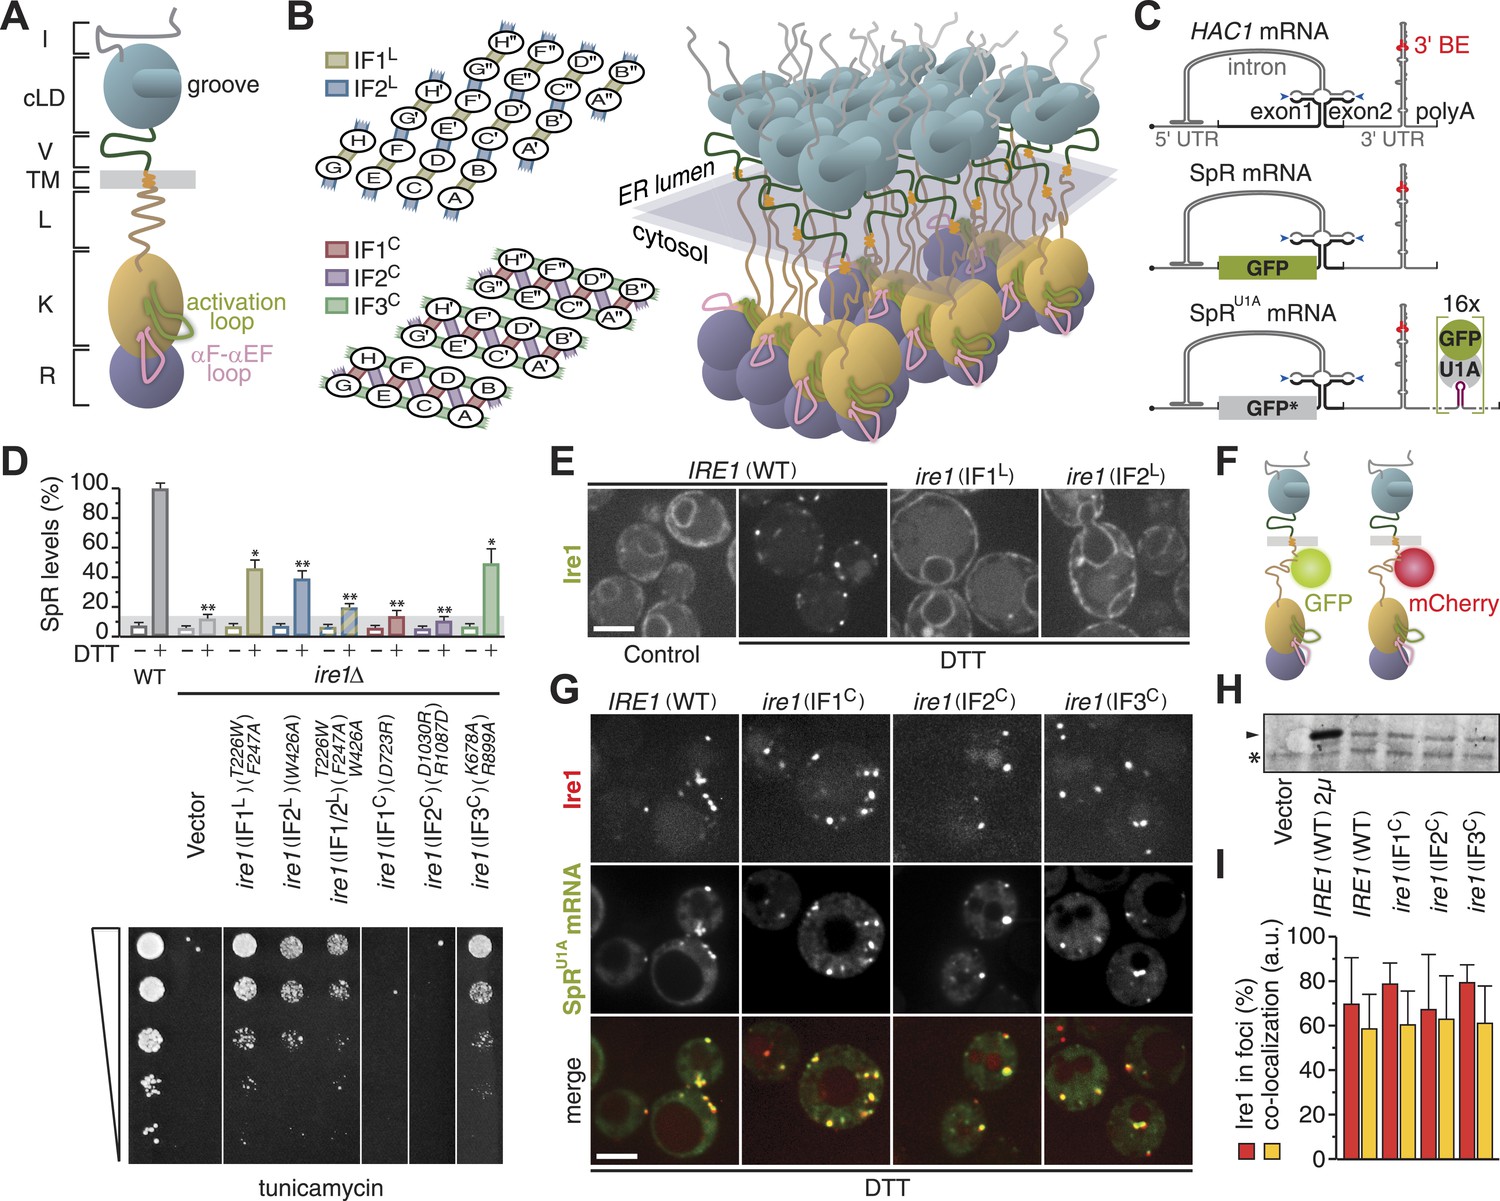
Oligomerization of Ire1's cytosolic domain is required for UPR signaling but not for Ire1 cluster formation or HAC1 mRNA recruitment.
(A) Schematic of S. cerevisiae Ire1. The ER-lumenal portion of Ire1 is divided in an N-terminal domain (I, gray), a core lumenal—ER-stress-sensing—domain (cLD, light blue), and BiP binding domain (V, dark green), which is tethered via a transmembrane (TM, orange) stretch to Ire1's cytosolic portion that is composed of a linker (L, brown), a kinase (K, ochre), and an RNase (R, purple) domain (Walter and Ron, 2011). The activation loop (light green) and the αF–αEF (pink) loop protrude from the kinase domain (Lee et al., 2008; Korennykh et al., 2009). (B) A model architecture of a 24mer Ire1 cluster after oligomerization on either side of the ER membrane. Left: oligomerization via ER-lumenal interfaces IF1L (tan) and IF2L (steel blue) (top) and via cytosolic interfaces IF1C (indian red), IF2C (sea green), and IF3C (plum) (bottom). The 24 Ire1 molecules are labeled (A–H) A′–H′, and A′′–H′′. IF1C-mediated back-to-back dimers are between A & B and C & D, etc. IF2C, is formed between Ire1 molecules A and D, C and F, and so on. The third interface, IF3C, is stabilized by a phosphate in the activation loop resulting from Ire1 trans-autophosphorylation. Dimerization via IF3C is therefore directional from B → D → F and from E → C → A, etc. (Korennykh et al., 2009). Right: three-dimensional rendering of the same 24 Ire1 molecules colored as in (A). (C) Top: schematic of HAC1 mRNA. The HAC1 open reading frame (ORF) is divided into two exons (black). The intron (gray) base pairs with the 5′ UTR (gray), causing stalling of ribosomes. Ire1 cleaves the intron at the splice sites indicated by blue arrowheads. The 3′ UTR (gray) harbors a stem-loop structure with the 3′ BE (red) that facilitates recruitment of the HAC1 mRNA to Ire1 foci (Aragón et al., 2009). The 5′ m7G cap (•) and polyadenylation (polyA) signal are indicated. Middle: the green bar depicts the GFP ORF (green) that replaces part of the HAC1 sequence in the splicing reporter (SpR). Translation of GFP only occurs when the intron is spliced from the mRNA, because removal of the intron by Ire1's endonuclease activity lifts a translational block caused by base pairing between the intron and the 5′ UTR (Pincus et al., 2010). Bottom: 16 U1A binding sites (violet) were inserted into the 3′ UTR of the SpR mRNA, bearing the non-fluorescent GFP-R96A mutant (GFP*, gray), downstream of the 3′ BE containing stem-loop. Binding of GFP-tagged U1A protein allows visualization of the mRNA (Aragón et al., 2009). (D) Wild-type (WT) or ire1Δ cells, having a genomic copy of the SpR, were complemented with centromeric empty vector or bearing ire1 IF mutant alleles (Aragón et al., 2009; Korennykh et al., 2009) as indicated. Top: SpR assay of cells. GFP fluorescence for 10,000 cells was measured by FACS analysis before or after ER-stress induction with 2 mM DTT for 2 hr, as described (Pincus et al., 2010); mean and s.d. are shown (n = 2). Bar diagrams for IF mutants are color-coded as in (B) left. The signal of DTT treated WT was set at 100%, while the signal reached in DTT treated ire1Δ cells due to auto-fluorescence of 14% was set as background (light gray bar). Statistical significance in a Student's t-test of differences in splicing levels as compared with wild-type is indicated (*p ≤ 0.05; **p ≤ 0.01). Bottom: viability assay by 1:5 serial dilutions spotted onto solid media with 0.2 µg ml−1 of the ER-stress-inducer tunicamycin. Plates were photographed after 2–3 days at 30°C. (E) Localization of Ire1–GFP WT or IFL mutants before (left panel, control) and after (right panels, DTT) induction of ER-stress. (F) Schematic of Ire1–GFP and Ire1–mCherry with the fluorescent modules placed in the juxtamembrane region of the cytosolic linker. (G) Localization of Ire1–mCherry WT or IFC mutants, as well as SpRU1A mRNA decorated with U1A–GFP, after induction of ER-stress with DTT. (E, G) ER-stress was induced with 10 mM DTT for 45 min; imaging was performed in ire1Δ cells, complemented with Ire1 imaging constructs, as described (Aragón et al., 2009). Scale bars represent 5 µm. (H) Immunoblot of hemagglutinin (HA)-tagged Ire1 protein from lysates from strains as in panel (D) and (G). A sample from a strain that overexpressed HA-tagged Ire1 from a 2 µ plasmid served as a positive reference. Ire1 is denoted by an arrowhead. A background band, denoted by an asterisk (*), conveniently serves as a loading reference. (I) Bar diagrams depict the percentage of Ire1 signal in foci (red bars) and the co-localization index expressed in arbitrary units (yellow bars), as described (Aragón et al., 2009), for SpRU1A mRNA recruitment to foci of Ire1 variants shown in (G); mean and s.e.m. are shown, n = 5–8. There is no statistical significance in a Student's t-test of differences in foci formation and mRNA recruitments as compared with wild-type.
-
Figure 1—Source data 1
- https://doi.org/10.7554/eLife.05031.004
Figure 2
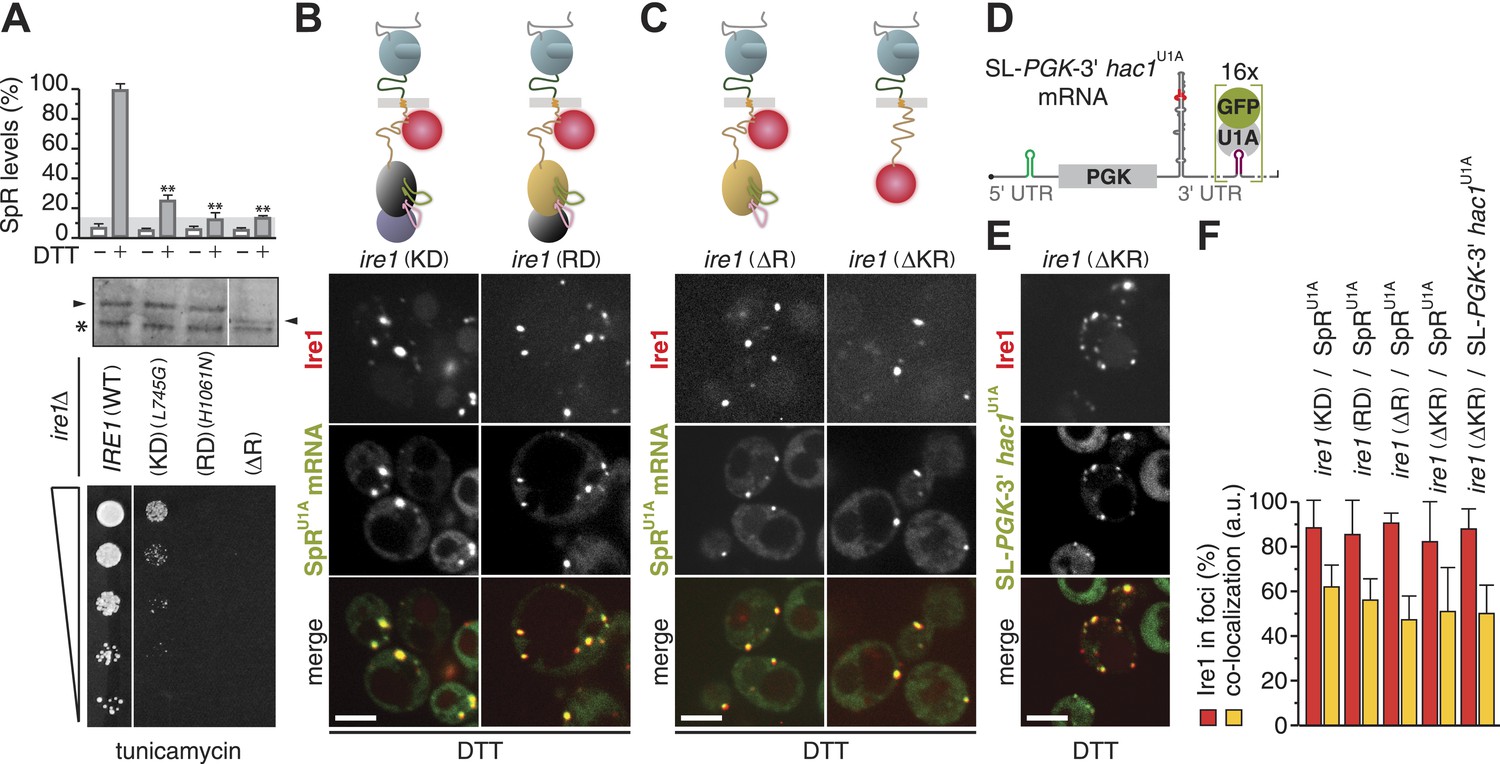
The kinase and RNase domains of Ire1 are dispensable for foci formation and mRNA recruitment.
(A) Splicing reporter assay before or after ER-stress induction with 2 mM DTT for 2 hr (top), Western blot of Ire1 (middle), and viability assay under ER-stress conditions (0.2 µg ml−1 tunicamycin; bottom) were performed in ire1Δ yeast containing a genomic copy of the SpR, complemented with wild-type (WT), kinase dead (KD), RNase dead (RD), and RNase truncation (ΔR) mutant alleles of ire1. Maximal (100%) and background level (14%, light gray bar) fluorescence are set as in Figure 1A. Mean and s.d. are shown (n = 2). Statistical significance in a Student's t-test of differences in splicing levels as compared with wild-type is indicated (**p ≤ 0.01). The arrowheads denote (mutant or truncated) Ire1 protein and the asterisk a background band on the immunoblot as in Figure 1H. (B, C) Top: schematic of the mCherry-tagged versions of the same ire1 mutants as in (A) as well as a kinase/RNase truncation (ΔKR) mutant, color-coded as in Figure 1A, except defective domains are black. (D) Schematic of a chimeric mRNA, SL-PGK1-3′ hac1U1A, which is PGK1U1A, bearing in its 3′ UTR the stem-loop structure with the 3′ BE of the HAC1 mRNA and in its 5′ UTR a small stem-loop (green) that confers translational repression (Aragón et al., 2009). (B, C, E) Localization of Ire1–mCherry and of U1A–GFP decorating either SpRU1A (B, C) or SL-PGK1-3′ hac1U1A (E) mRNA. ER-stress was induced with 10 mM DTT for 45 min; imaging was performed of ire1Δ cells, complemented with Ire1 imaging constructs, as depicted. Scale bars represent 5 µm. (F) Bar diagrams depict the percentage of Ire1 signal in foci (red bars) and the co-localization index for mRNA recruitment into foci of Ire1 variants shown in B, C, and E (mean and s.e.m., n = 5–10). There is no statistical significance in a Student's t-test of differences in foci formation and mRNA recruitments as compared with wild-type.
-
Figure 2—Source data 1
- https://doi.org/10.7554/eLife.05031.006
Figure 3
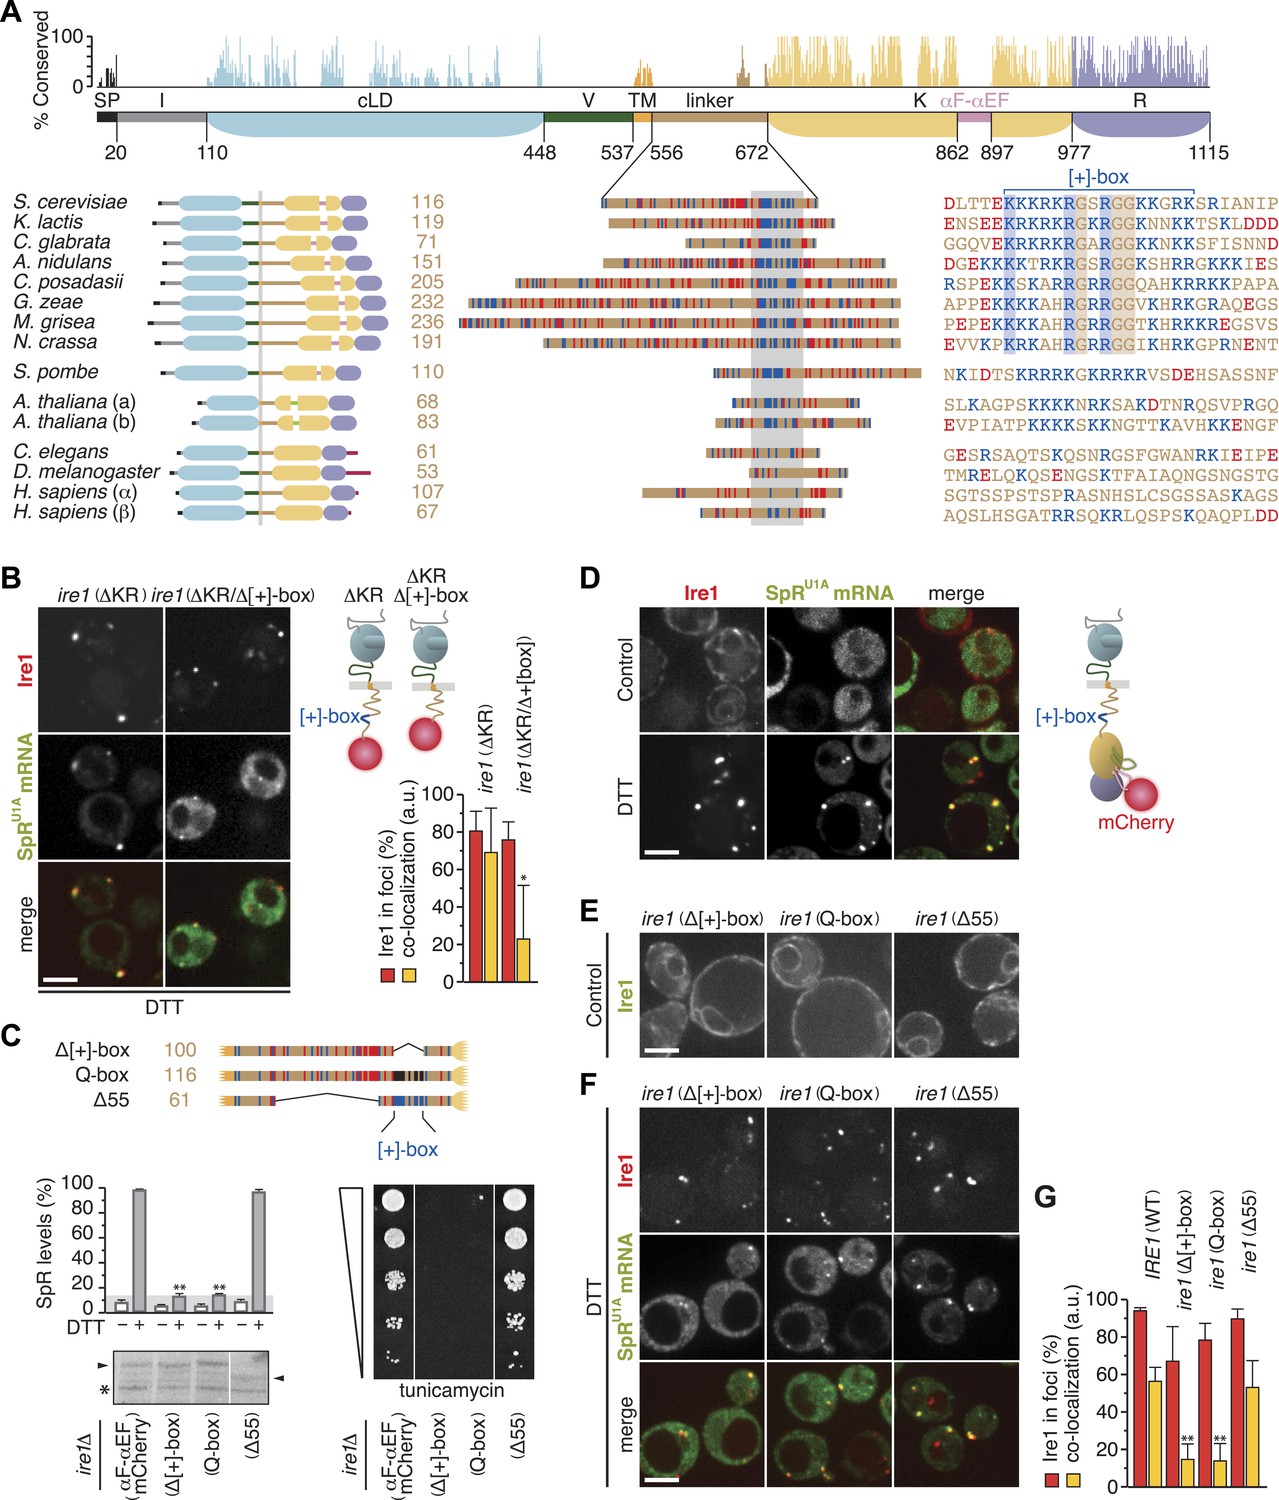
The cytosolic linker of Ire1 harbors a positively charged motif that is key for mRNA recruitment and splicing.
(A) Conservation of Ire1. Top: mapped onto a schematic of Ire1 domains bordered by residues of which the number is denoted, bar diagrams display relative conservation of the Saccharomyces cerevisiae Ire1 protein sequence to homologs (lower, left) from other fungal species Kluyveromyces lactis, Candida glabrata, Aspergillus nidulans, Coccidioides posadasii, Gibberella zeae, Magnaporthe grisea, Neurospora crassa, and Schizosaccharomyces pombe, as well as from the animals Caenorhabditis elegans and Drosophila melanogaster, the two paralogues from the plant Arabidopsis thaliana (a and b) and from Homo sapiens (α and β). Domains are color-coded as in Figure 1A, except signal peptides (SP) are black; light green represents a loop inserted into the kinase domain of the A. thaliana Ire1s and crimson denotes C-terminal extensions in animal Ire1s. Expanded view (middle) of the linker domains that are aligned based on the stretch (gray box) for which the sequence alignment is shown on the right. Strictly conserved residues among fungal species except S. pombe are boxed. (A) lower right, (C) top, Basic (arginine and lysine) residues are shown in blue and acidic (aspartate and glutamate) residues in red. Glutamines replacing arginines and lysines in the Q-box mutant are black. (A) lower right, (B, C) Position of the [+]-box is indicated. (B, D–F) Localization of Ire1–GFP or Ire1–mCherry and of U1A–GFP decorated SpRU1A mRNA. Imaging was performed in ire1Δ yeast complemented with a genomic copy of C-terminally mCherry-tagged (ΔKR) or (ΔKR/Δ[+]-box) ire1 mutant alleles, as schematically shown (B top right), or with plasmids encoding IRE1 wild-type (C) or ire1 linker mutants (E, F), with the fluorescent modules GFP (E) and mCherry (C, F) placed in the αF–αEF loop, as schematically shown (D right), before (D upper panels, E, control) and after (B, D lower panels, F, DTT) induction of ER-stress with 10 mM DTT for 45 min. Scale bars represent 5 µm. Bar diagrams depict the percentage of Ire1 signal in foci (red bars) and the co-localization index for mRNA recruitment into foci of Ire1 variants (mean and s.e.m., n = 5–10) (B, bottom right, G). Statistical significance in a Student's t-test of differences in foci formation and mRNA recruitments as compared with wild-type is indicated (*p ≤ 0.05; **p ≤ 0.01). (C) Schematic of linker domains with mutations or truncations as in (A) (top). Splicing reporter assay before or after ER-stress induction with 2 mM DTT for 2 hr (left, middle), Western blot of Ire1 (left, bottom), and viability assay under ER-stress conditions (0.2 µg ml−1 tunicamycin; right, bottom). Assays were performed in ire1Δ yeast containing a genomic copy of the SpR, complemented with either IRE1 wild-type or ire1 linker mutants with mCherry in the αF–αEF loop. Mean and s.d. are shown (n = 2). Maximal (100%) and background level (14%, light gray bar) fluorescence are set as in Figure 1A. Statistical significance in a Student's t-test of differences in splicing levels as compared with wild-type is indicated (**p ≤ 0.01). The arrowheads denote (mutant or truncated) Ire1 protein and the asterisk a background band on the immunoblot as in Figure 1H.
-
Figure 3—Source data 1
- https://doi.org/10.7554/eLife.05031.008
Figure 4
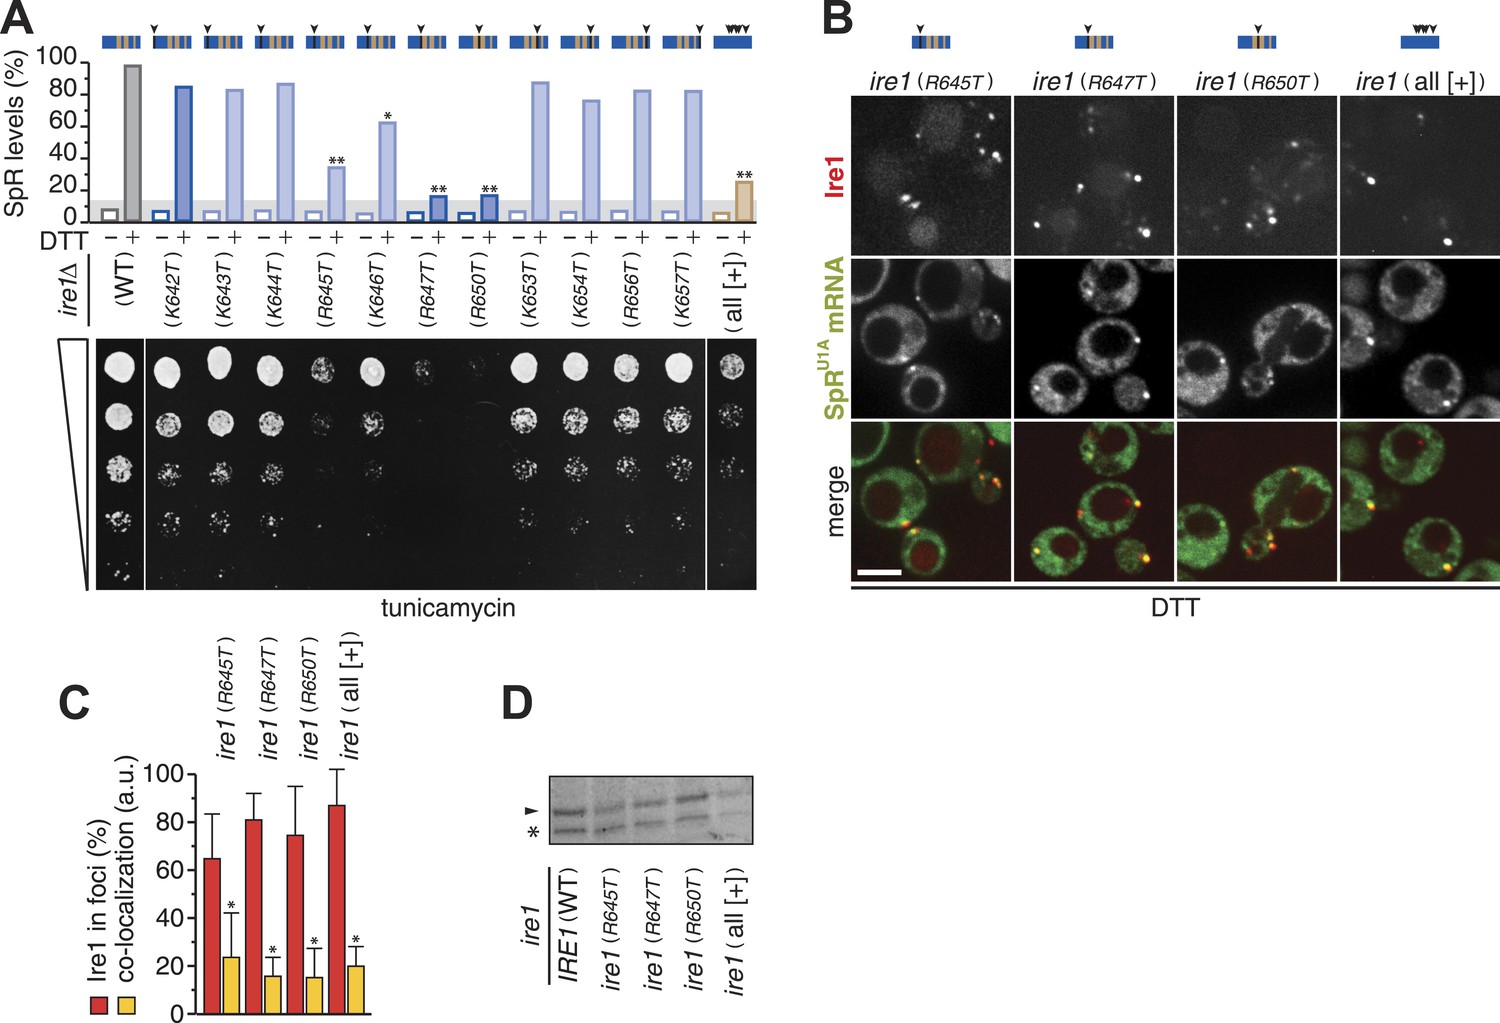
Three arginines in Ire1's linker are essential for mRNA docking.
(A) Splicing reporter assay before or after ER-stress induction with 2 mM DTT for 2 hr (top) and viability assay under ER-stress conditions (0.2 µg ml−1 tunicamycin; bottom). Assays were performed in ire1Δ yeast containing a genomic copy of the SpR, complemented with ire1 mutants having within the [+]-box a single arginine or lysine replaced with a threonine, as indicated, or all non-positively charged residues replaced with arginines or lysines (KKKRKRKKRKRKKRRK; all [+]). Bar diagrams reporting on mutants of positively charged residues are blue with conserved residues in a darker shade; bar diagrams of the all [+] box mutant in brown. Statistical significance in a Student's t-test of differences in splicing levels as compared with wild-type is indicated (*p ≤ 0.05; **p ≤ 0.01). Maximal (100%) and background level (14%, light gray bar) fluorescence are set as in Figure 1D. (B) Localization of Ire1–mCherry and U1A–GFP decorated SpRU1A mRNA. Imaging was performed in ire1Δ yeast complemented with ire1 linker mutants having the mCherry module in the αF–αEF loop. Scale bar represents 5 µm. (A, B) Schematics of [+]-box variants are color-coded as in Figure 3A with arrow heads denoting the position of point mutations in black. (C) Co-localization index for mRNA recruitment into foci of Ire1 variants shown in B (mean and s.e.m., n = 5–10). Statistical significance in a Student's t-test of differences in foci formation and mRNA recruitments as compared with wild-type is indicated (*p ≤ 0.05). (D) Immunoblot as in Figure 1H of Ire1 of lysates from strains in panel (B); the arrowhead denotes Ire1 protein and the asterisk a background band as in Figure 1H.
-
Figure 4—Source data 1
- https://doi.org/10.7554/eLife.05031.010
Figure 5
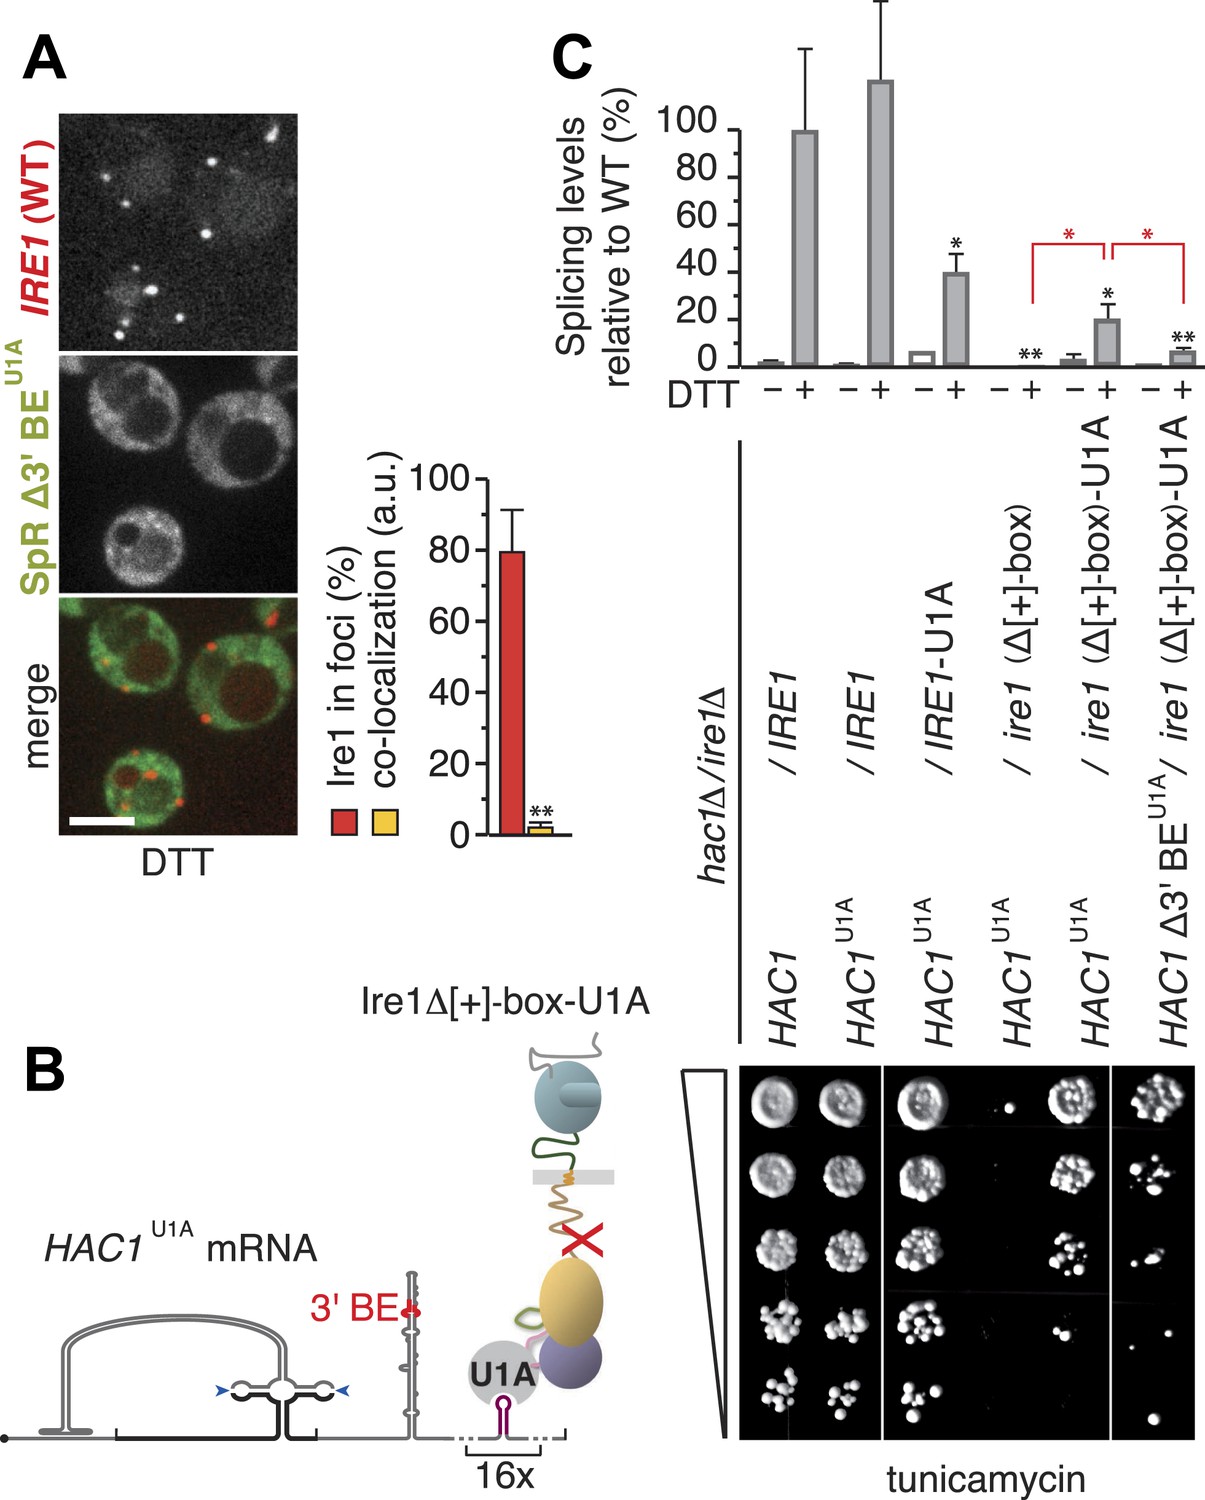
Step-wise targeting and docking of mRNA are pre-requisite for activating Ire1.
(A) Localization of mCherry-tagged Ire1 and SpR Δ3′ BEU1A mRNA decorated with U1A–GFP. ER-stress was induced with 10 mM DTT for 45 min; imaging was performed in ire1Δ cells, complemented with wild-type IRE1 having the mCherry module in the αF–αEF loop (left). Scale bar represents 5 µm. Co-localization index for mRNA recruitment into foci (mean and s.e.m., n = 10) (right). Statistical significance of the difference in mRNA recruitment of SpR Δ3′ BEU1A as compared with SpRU1A to Ire1–mCherry clusters (Figure 3D,G) was tested using a Student's t-test (**p ≤ 0.01). (B) Schematic of mRNA docking ‘bypass’. The U1A module placed in the αF–αEF loop of Δ[+]-box mutant ire1 facilitates binding of HAC1U1A mRNA via its U1A motifs. (C) Splicing was measured by quantitative RT-PCR before or after ER-stress induction with 2 mM DTT for 30 min (top) and viability assay under ER-stress conditions (0.2 µg ml−1 tunicamycin) of hac1Δ/ire1Δ yeast complemented with centromeric plasmids bearing wild-type IRE1 or Δ[+]-box mutant ire1 either untagged or tagged with the U1A module in the αF–αEF loop, as well as with centromeric plasmids bearing wild-type HAC1, HAC1U1A, or HAC1 Δ3′ BEU1A. For display of RT-PCR results, the signal for hac1Δ/ire1Δ yeast complemented with wild-type HAC1 and IRE1 under ER-stress conditions was set at 100%; mean and s.d. (n = 2) are shown. Statistical significance in a Student's t-test of differences in splicing levels as compared with wild-type is indicated in black and of differences in splicing levels compared with the ‘bypass’ (HAC1U1A + ire1 Δ[+]-box-U1A) is indicated in red (*p ≤ 0.05; **p ≤ 0.01).
-
Figure 5—Source data 1
- https://doi.org/10.7554/eLife.05031.012
Figure 6
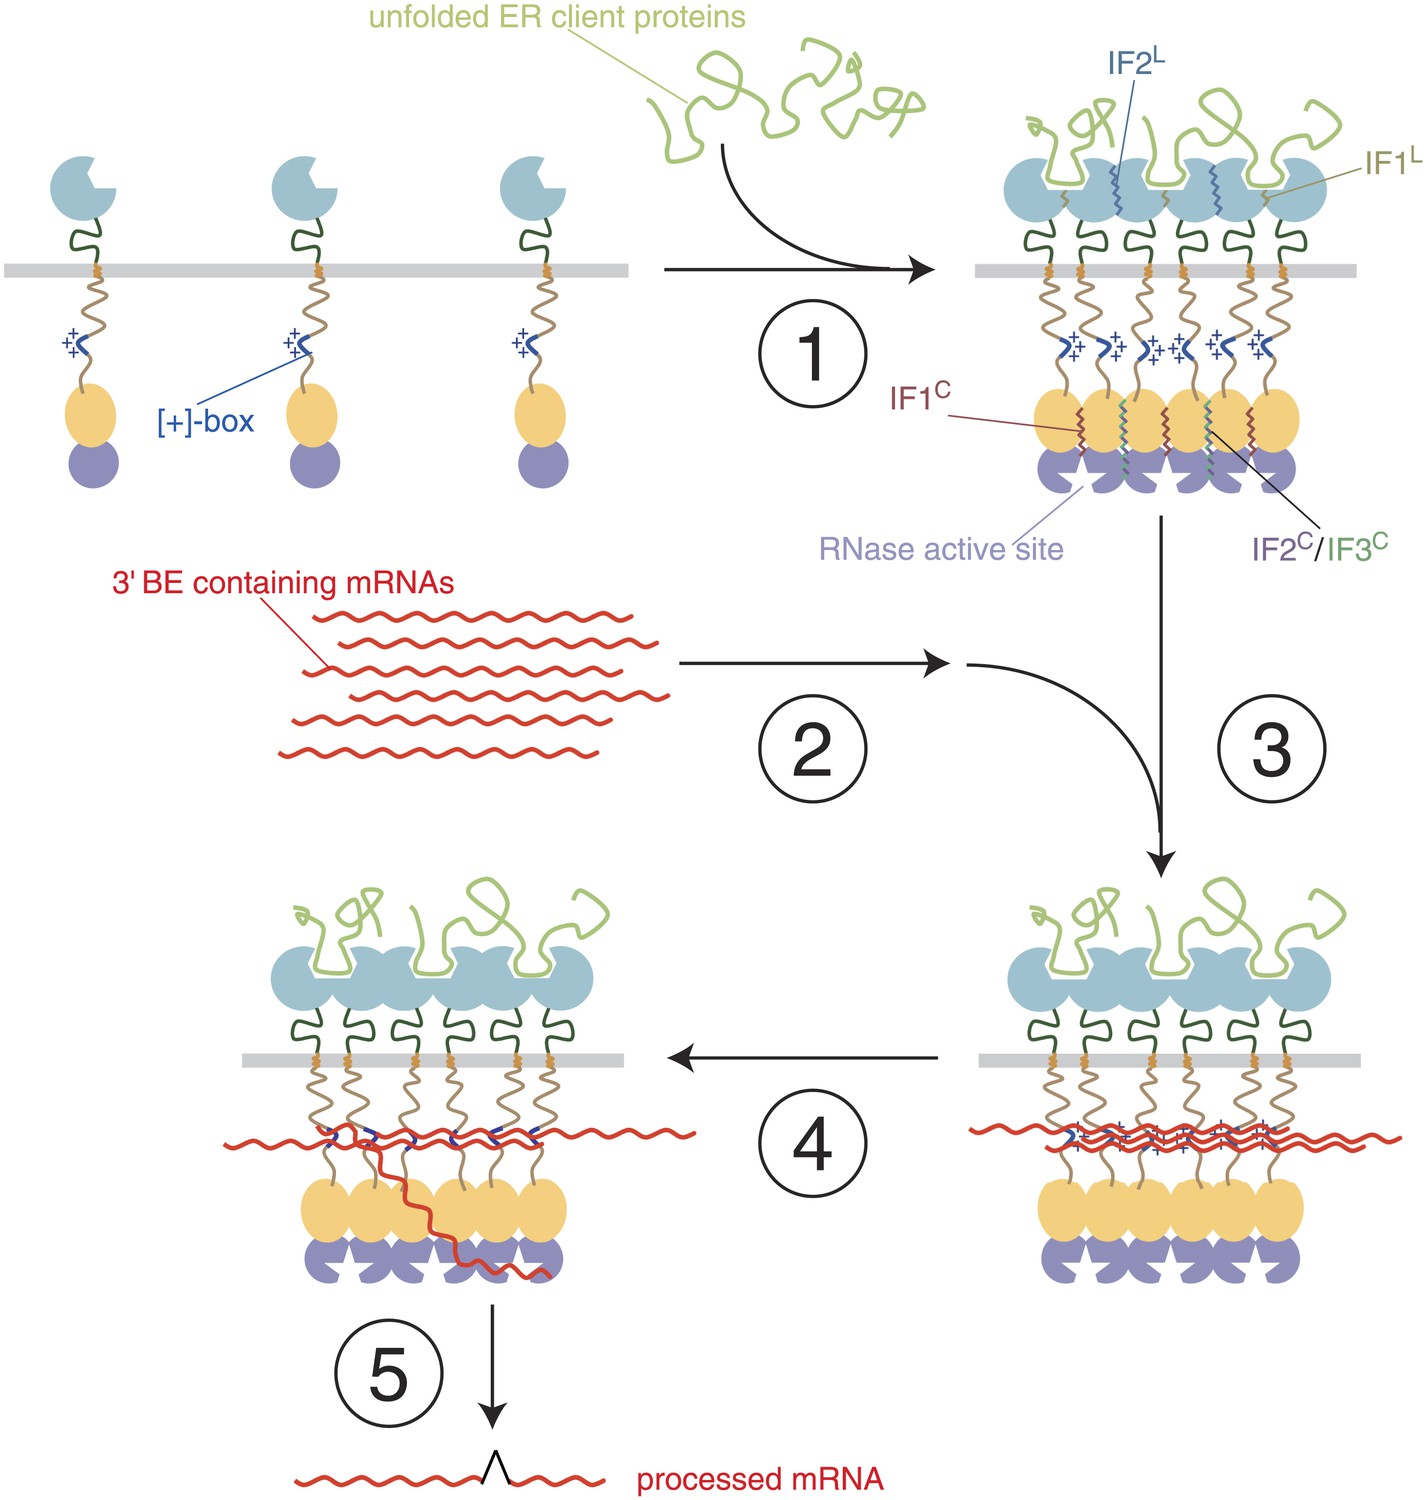
A model of step-wise activation of the Ire1/HAC1 mRNA signaling relay.
The steps are described in the Discussion. Color-coding is as in Figure 1, except that unfolded proteins are depicted in light green and mRNA in red. Ire1 domain interfaces are indicated by wiggly lines.
Additional files
-
Supplementary file 1
Overview of all constructs used in this study.
- https://doi.org/10.7554/eLife.05031.014
Download links
A two-part list of links to download the article, or parts of the article, in various formats.
Downloads (link to download the article as PDF)
Open citations (links to open the citations from this article in various online reference manager services)
Cite this article (links to download the citations from this article in formats compatible with various reference manager tools)
Specificity in endoplasmic reticulum-stress signaling in yeast entails a step-wise engagement of HAC1 mRNA to clusters of the stress sensor Ire1
eLife 3:e05031.
https://doi.org/10.7554/eLife.05031


