Deletion of a kinesin I motor unmasks a mechanism of homeostatic branching control by neurotrophin-3
- Centre de Recherche, France
- CNRS UMR 3215, France
- INSERM U934, France
- University of Heidelberg, Germany
- University of California San Francisco, United States
- University of California, Berkeley, United States
- Muséum National d'Histoire Naturelle, France
- Sorbonne Universités, UPMC University Paris 6, France
- Uni Research AS High Technology Centre, Norway
- National Institute of Genetics, Japan
- Max Planck Institute of Neurobiology, Germany
Figures
Figure 1 with 1 supplement
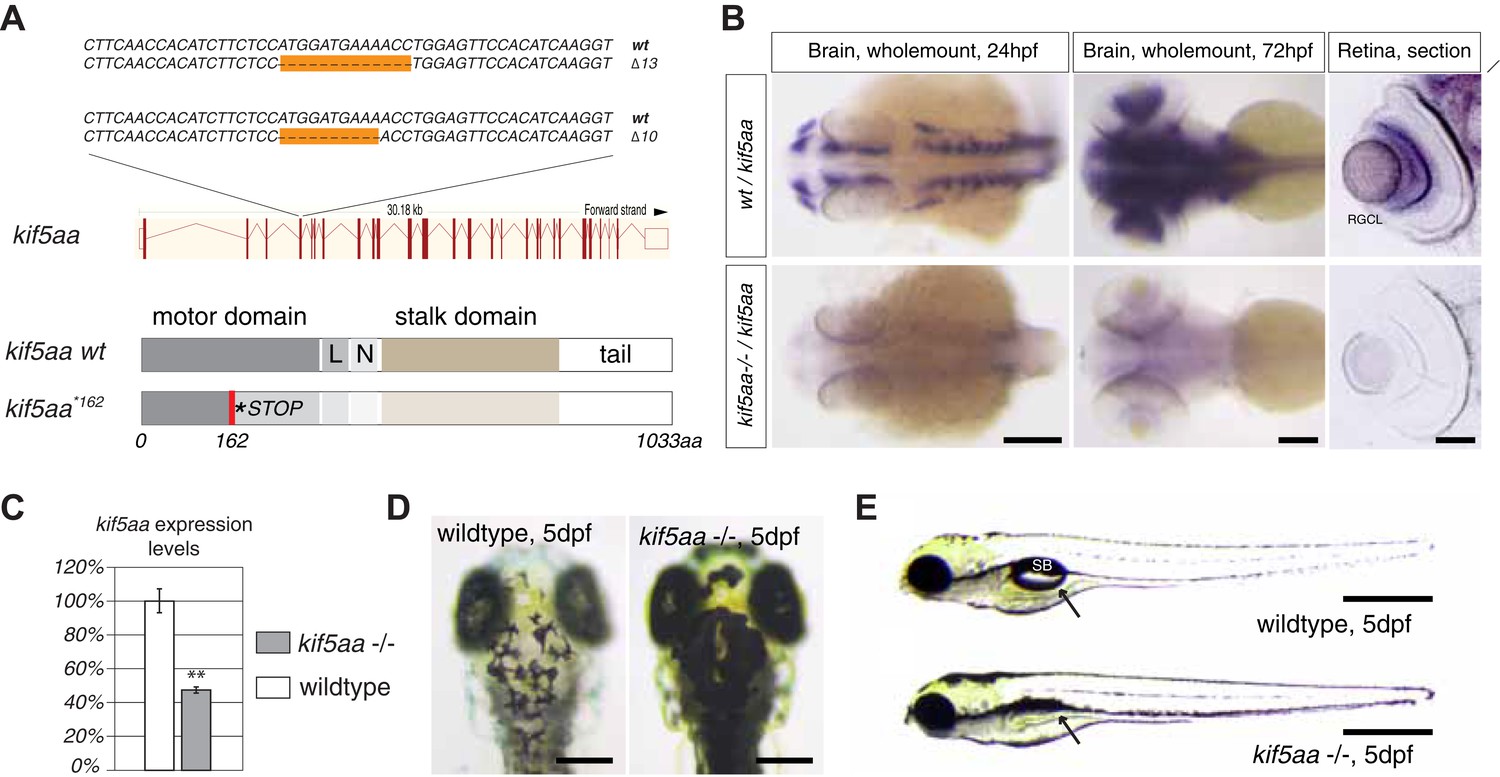
Generation of loss-of-function alleles of the anterograde motor protein Kif5aa.
(A) Employing TALENs targeting exon4 of the kif5aa open reading frame, we generated two loss-of-function alleles with a 10 bp and 13 bp deletion, respectively. These result in a frameshift at amino acid 122 and a premature stop codon after 162 of 1033aas within the motor domain of Kif5aa. L = linker region, N = neck region. (B) In situ hybridization shows a substantial downregulation of kif5aa mRNA in 24 hpf and 72 hpf old embryos. Scale bars (from left to right) = 150 μm, 100 μm, 50 μm. RGCL = Retinal Ganglion Cell layer. (C) Quantitative reverse transcription PCR confirms that only 47% of wild-type kif5aa mRNA expression levels are reached in homozygote mutant embryos at 4 dpf (p < 0.01). (D) Kif5aa mutant embryos show expanded melanosomes within their melanocytes and appear dark compared to wild-type embryos. Scale bars = 200 μm. (E) They fail to inflate their swim bladder and die 10 days post fertilization. Scale bars = 400 μm. Arrow: pointing at the respective location of the swim bladder. SB = swim bladder.
Figure 1—figure supplement 1
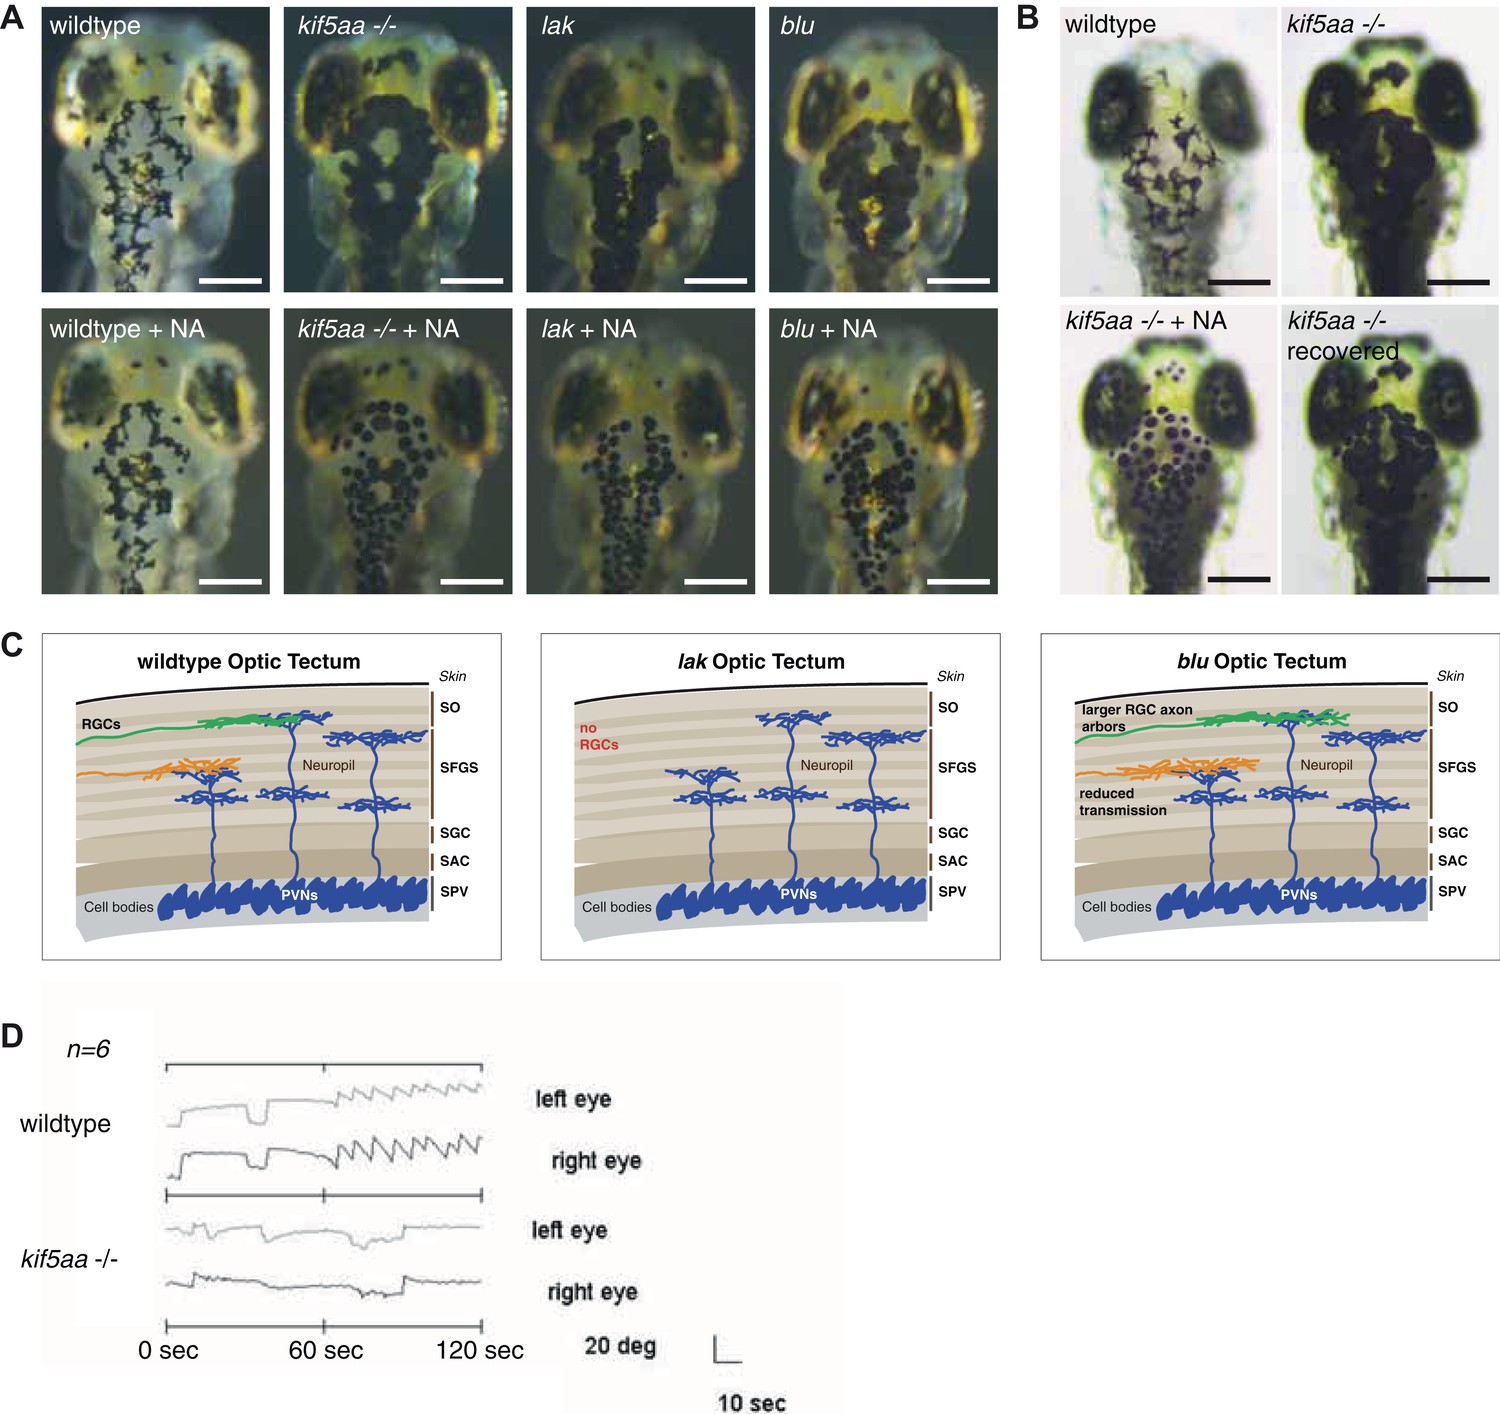
Melanosomes transport is not abolished in kif5aa mutants but they show no optokinetic response.
(A) Phenotype of wild-type, kif5aa*162 mutant, lakritz and blumenkohl embryos at 5 dpf. All three mutants show expanded melanosomes and appear dark. Application of norepinephrine (NA) results in aggregation of melanosomes. Scale bar = 200 μm. (B) Application of NA leads to aggregation of melanosomes in kif5aa mutant embryos; washing out of the drug results in their re-expansion. Scale bar = 200 μm. (C) Schematics illustrating the organization of the optic tectum in wild-type, lakritz and blumenkohl embryos. The tectum is subdivided in multiple sublaminae. Retinal Ganglion Cells (RGC) axonal arbors grow into distinct layers within the tectal neuropil where they form functional synaptic connections with dendrites of periventricular neurons (PVNs). Lakritz mutant embryos lack all retinal input as they fail to specify RGCs. Blumenkohl mutants grow RGCs with increased axonal arbor sizes. The rate of synaptic transmission between RGCs and periventricular neurons is reduced. SO = stratum opticum, SFGS = stratum fibrosum et griseum superficiale, SGC = stratum griseum central, SAC = stratum album central, SPV = stratum periventriculare. (D) Kif5aa*162 mutant embryos do not show an optokinetic response. Eye positions (angles relative to a horizontal axis) were plotted over time during optokinetic stimulation in one direction. During the first 60 s, no stimulus is shown followed by 60 s of motion stimulation. The OKR has a sawtooth profile in siblings, consisting of alternating quick and slow phases while kif5aa*162 mutants do not show any response to the stimulus (n = 6).
Figure 2 with 1 supplement
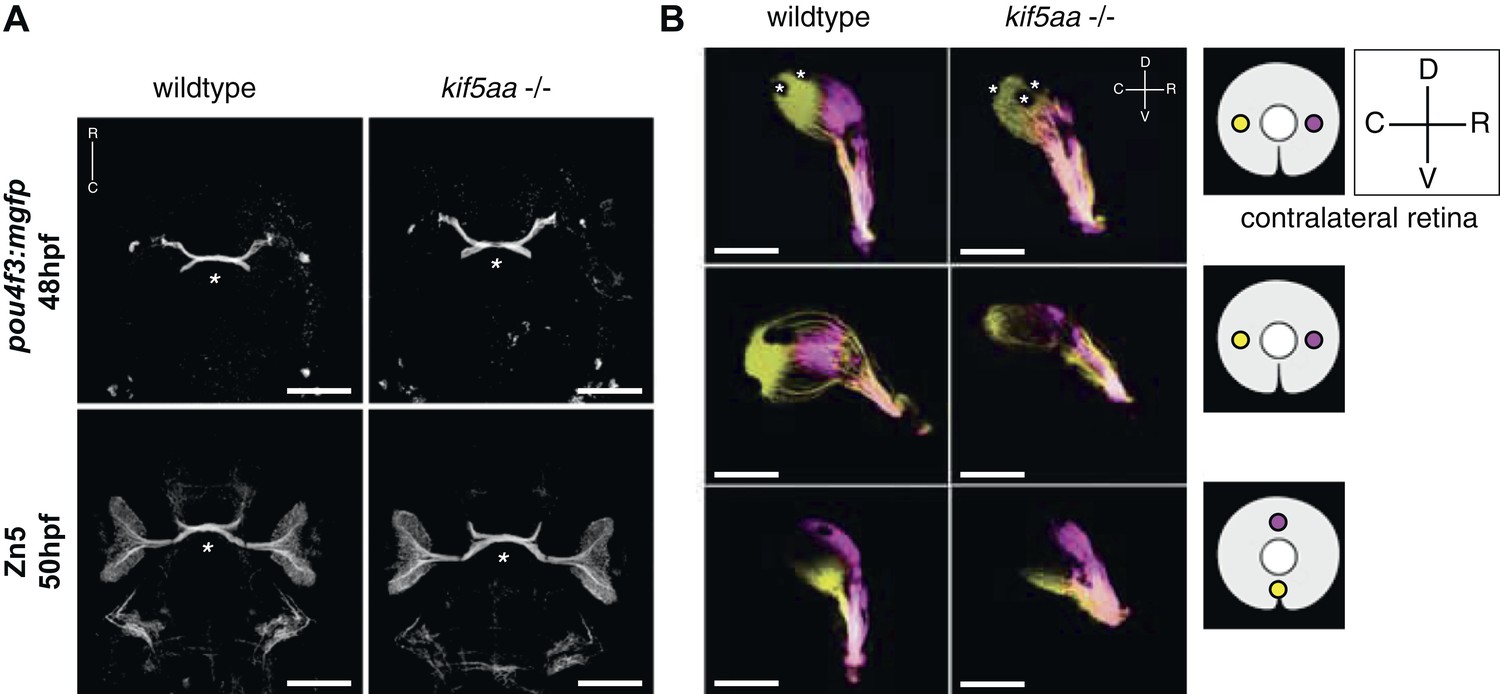
Outgrowth of the optic nerve and retinotopic mapping is normal in kif5aa mutants.
(A) Confocal imaging of the Tg(pou4f3:mGFP) transgene, labeling a subpopulation of Retinal Ganglion Cells (RGCs) with membrane bound GFP, at 48 hpf reveals that outgrowth of the optic nerve formed by RGC axons from the retina is not affected by the kif5aa mutation. Immunostaining against the Zn5 antigen (DM- GRASP/neurolin present within the visual system only on RGCs [Laessing and Stuermer, 1996; Fashena and Westerfield, 1999]) confirms that optic chiasm formation is normal (marked with an asterisk). No pathfinding errors occur at this level of axonal growth. Scale bars = 200 μm. Embryos facing upwards. R = rostral, C = caudal. (B) Injections of the lipophilic dyes DiI and DiO in different quadrants of the contralateral retina (depicted in the right panel) show that retinotopic mapping to the optic tectum is performed in the correct manner. Asterisks = pigment cells in the skin. D = dorsal, V = ventral, R = rostral, C = caudal. No misrouting of RGC axons to the ipsilateral tectum was observed (data not shown). Scale bars = 150 μm.
Figure 2—figure supplement 1
Patterning of the mutant retina and neurogenesis is not affected in mutants.
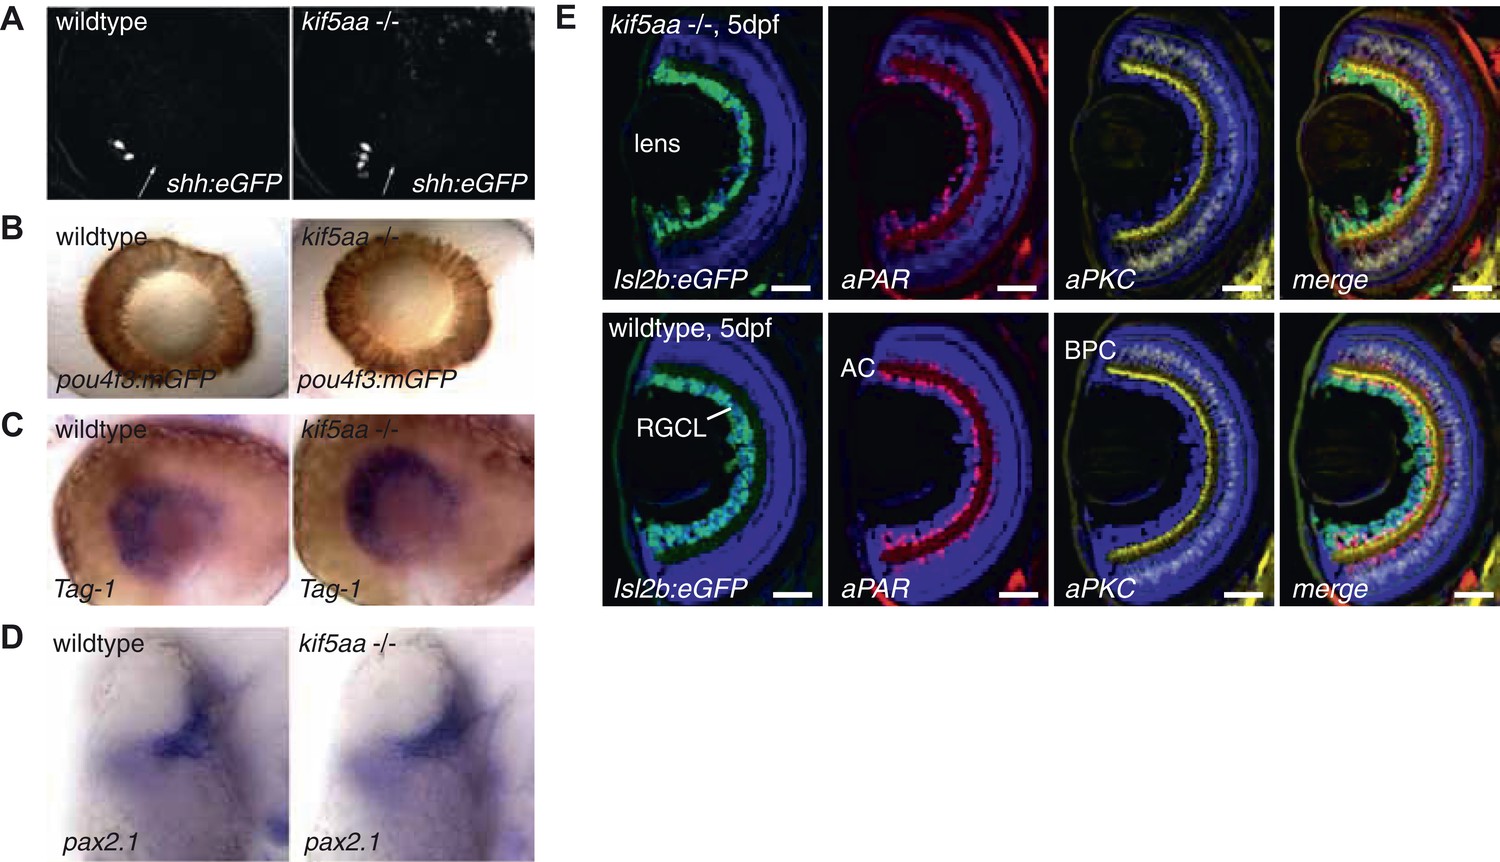
(A) The expression of the Tg(shh:eGFP) transgene marks the onset of neurogenesis (white arrow) in the developing retina (Shkumatava et al., 2004) and its expression is not altered in kif5aa mutant retinae. (B) RGC differentiation marked by Tg(pou4f3:mGFP) (Xiao et al., 2005) expression is not affected. (C) The glycosylphosphatidyl inositol (GPI)-anchored protein of the immunoglobulin (Ig) superfamily Tag-1 I is expressed in nasal RGCs (Lang et al., 2001). In situ staining shows that nasal patterning is identical in wild-type and kif5aa mutant retinae. (D) Pax2.1, whose expression is restricted to the optic stalk and retinal cells around the choroid fissure and that mediates optic stalk and chiasm formation in fish (Krauss et al., 1991; Puschel et al., 1992) shows a normal expression pattern in kif5aa mutants. (E) Cryosection of Tg(Isl2:Gal4, UAS:eGFP) transgenic wild-type and mutant retinae and immunostaining against eGFP (RGCs) (Ben Fredj et al., 2010), Parvalbumin (marking amacrine cells) (Godinho et al., 2005) and protein kinase C (marking bipolar cells) (Godinho et al., 2005) shows that all cell types are present in the right retinal layer. Blue = DAPI. Scale bar = 10 μm. RGCL = RGC layer, AC = amacrine cells, BPC = bipolar cells.
Figure 3 with 1 supplement
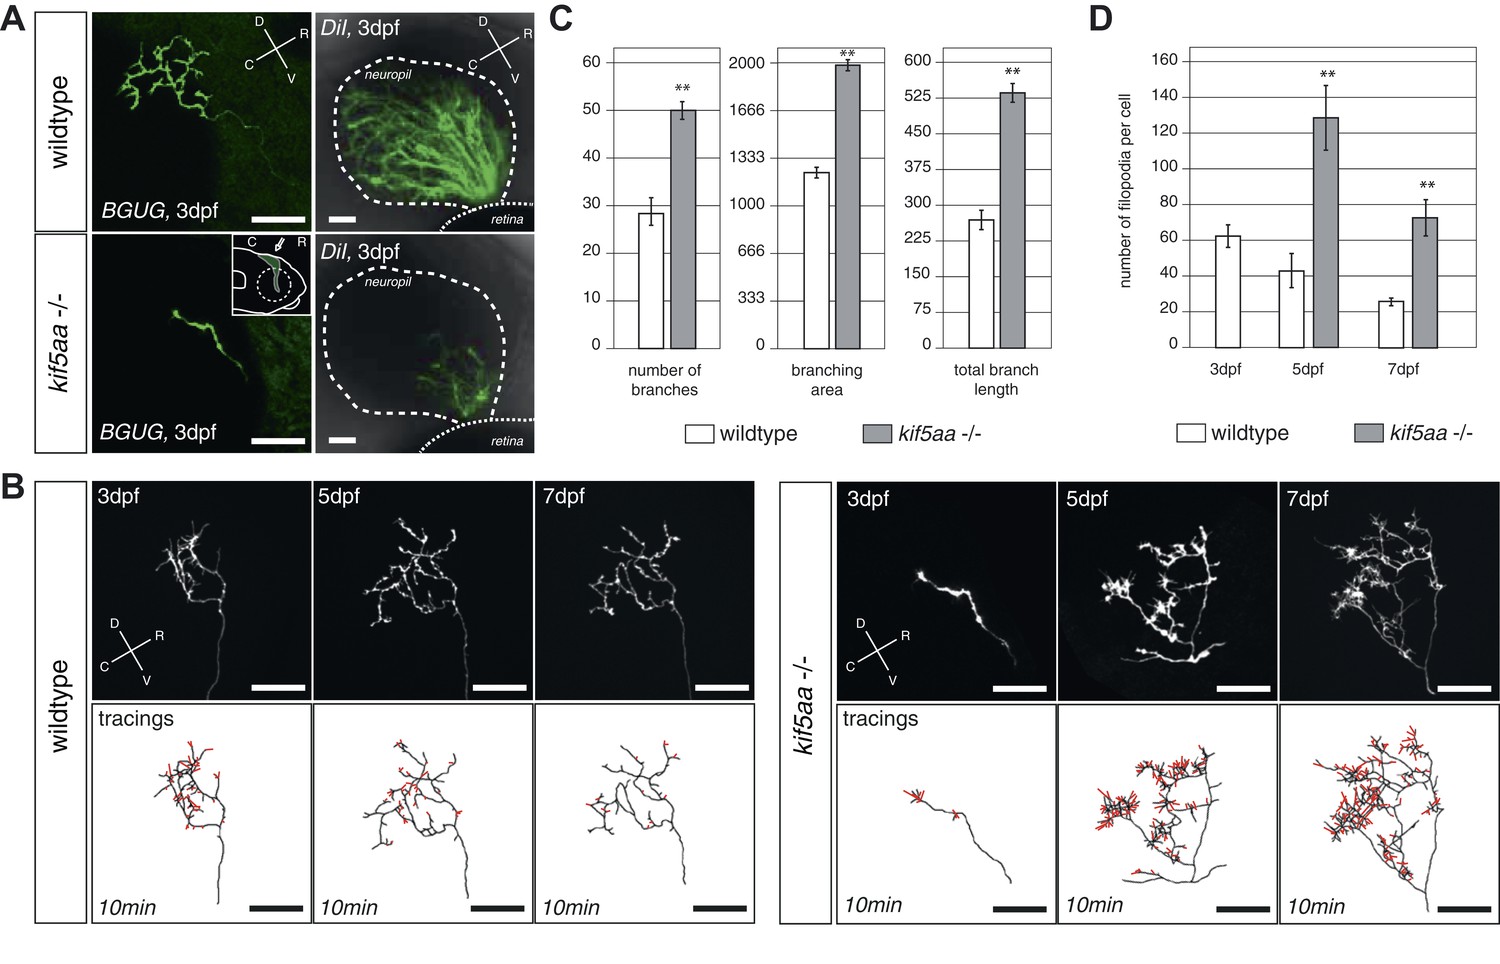
RGC axons in kif5aa mutants show a delayed ingrowth into the optic tectum and grow larger arbors at later stages.
(A) Single membrane-GFP expressing RGC axons from the Tg(BGUG) transgene (left panel) and DiI injections into the contralateral retina of 3 dpf old wild-type and kif5aa mutant embryos (right panel) illustrate the delay of tectal innervation in mutants. Scale bars = 20 μm. The schematic in the lower left panel illustrates the perspective chosen for image acquisition (indicated by an arrow). D = dorsal, V = ventral, R = rostral, C = caudal. (B) Upper panel, left: Axonal arbor of a single wild-type RGC at 3, 5, and 7 dpf. Lower panel, left: Tracings of an axonal arbor at time point zero. In red: Overlay of filopodia formed and retracted within 10 min (1 frame/2 min). Scale bars = 20 μm. Upper panel, right: Axonal arbor of a single kif5aa mutant RGC axonal arbor at 3, 5, and 7 dpf. Lower panel, right: Tracing of an axonal arbor at time point zero. In red: Overlay of filopodia formed and retracted within 10 min (1 frame/2 min). Scale bars = 20 μm. (C) Kif5aa mutant RGC axons grow significantly more branches, cover a larger area of the optic tectum with their arbors (in μm2) and grow longer arbors (in μm) than wild-type cells at 7 dpf (n = 10, p < 0.01). Scale bars = 20 μm. For quantification, only branches stable within 10 min of image acquisition were selected. (D) Quantification of filopodia numbers formed and retracted within 10 min per cell at 3, 5, and 7 dpf. While wild-type RGC arbors form most filopodia at 3 dpf and reduce this rate constantly until 7 dpf, kif5aa mutant RGC axons grow almost three times more filopodia at 5 dpf (n = 4, p < 0.01). At 7 dpf, the rate is still more as double as high as for their wild-type counterparts (n = 4, p < 0.01).
Figure 3—figure supplement 1
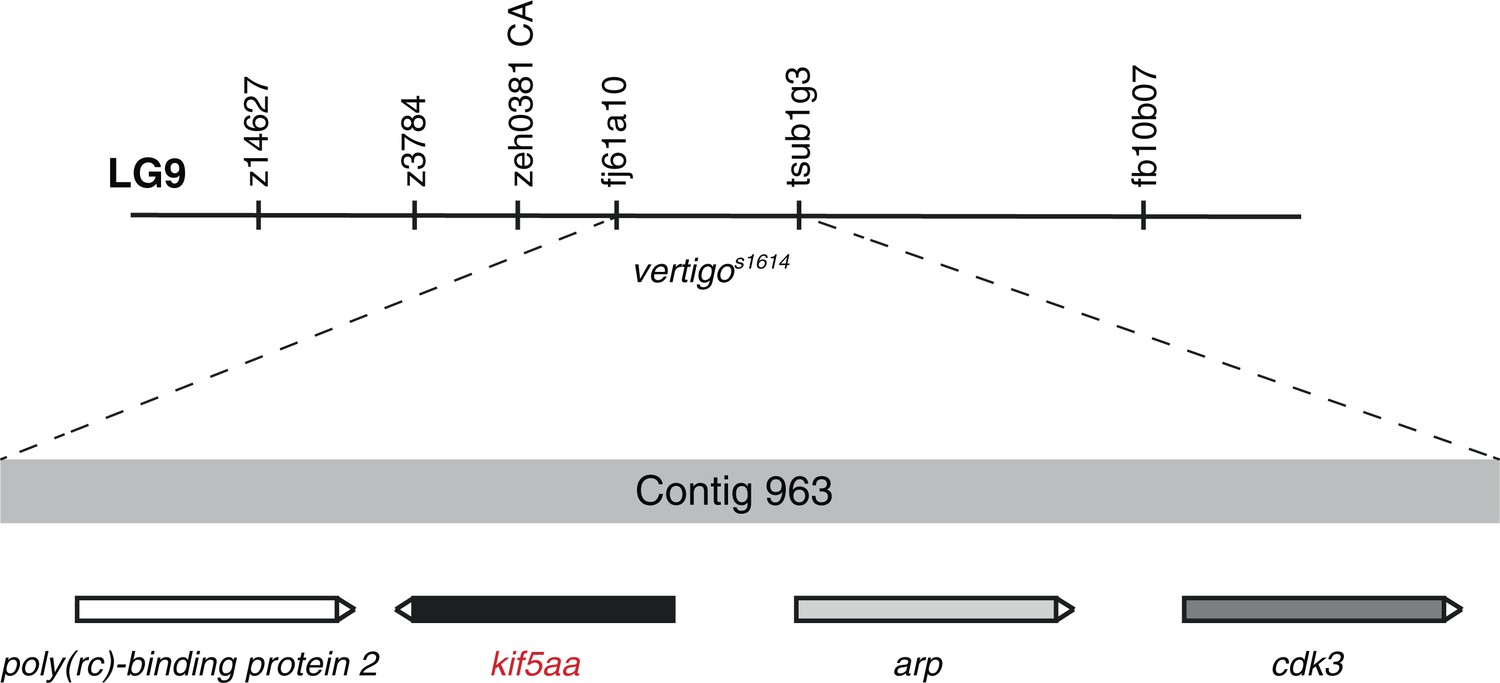
Mapping of the vertigos1614 locus by genetic linkage analysis.
In 1800 meioses, the vertigos1614 allele was co-segregating with the two polymorphic markers fj61a10 and tsub1g3 located on Contig 963 of linkage group 9 (LG9). Four genes encoding for Poly(rc)-binding protein 2, Kif5aa, Arp and Cdk3 are found in this genomic region. In complementation crosses the kif5aa*162 allele was not complementing with the vertigos1614 allele. This strongly suggests that vertigo represents another loss-of-function allele of kif5aa.
Figure 4 with 1 supplement
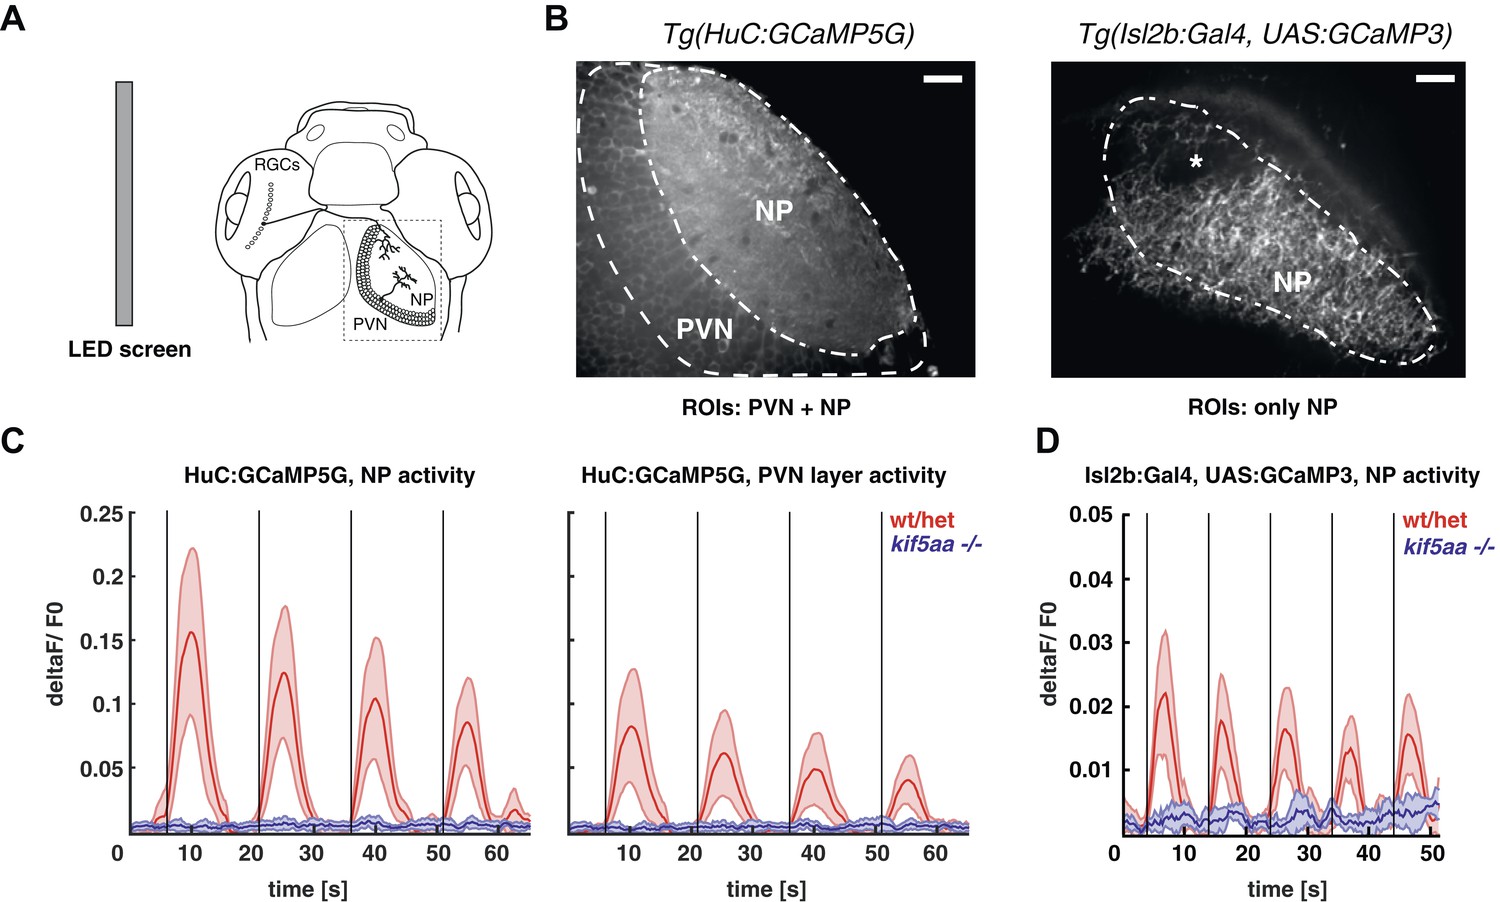
Kif5aa mutant larvae show no activity in RGCs and no synaptic transmission to tectal cells.
(A) 5–7 dpf larvae were visually stimulated by bars on an LED screen running in caudal-to-rostral direction across the larva's visual field. Wild-type and kif5aa mutant larvae expressing genetically encoded calcium indicators (GCaMPs) in different subsets of neurons of the visual system were confocally imaged in the tectum contralaterally to the stimulated eye (dashed box inset). RGCs = Retinal Ganglion Cells, PVNs = periventricular neurons, NP = neuropil. (B) The activity of visual system neurons in response to visual stimuli is shown as normalized GCaMP fluorescence intensity changes (deltaF/F0) over time. GCaMP intensity was averaged over manually determined regions of interest (ROIs) that corresponded to well-distinguishable anatomical regions in the larval tectum, the neuropil (NP) and the periventricular cell bodies area (PVNs). In Tg(HuC:GCaMP5) fish (left), GCaMP5 is expressed pan-neuronaly, that is, in both neuropil and PVNs, whereas in Tg(Isl2b:Gal4) × Tg(UAS:GCaMP3) fish (right), it is expressed in all RGCs and their processes. Scale bars = 20 μm. Asterisk = pigment cell in the skin. (C) Averaged deltaF/F0 ratio over time in response to a moving bar visual stimulation (black vertical line denotes the time point of the stimulus onset) in fish with pan-neuronal GCaMP5G expression. Four sequential rounds of stimulus presentation and the time-courses of Ca2+-transients in the neuropil ROIs (left panel) and periventricular cell bodies ROIs (right panel) of wild-type/heterozygous (red curve) and kif5aa mutant larvae (blue curve) (n = 7 each) are shown. Activity in the visual system of kif5aa mutants was almost absent between 5 and 7 dpf compared to wild-type larvae. Light red and blue zones indicate the 95% confidence intervals around the averaged deltaF/F0 curves for each region of interest (NP and PVN), respectively. (D) Averaged deltaF/F0 ratio over time in response to a moving bar visual stimulation (black vertical line denotes stimulus onset) in fish with GCaMP3 expression in RGC axons. Five sequential rounds of stimulus presentation and time-courses of Ca2+-transients in the neuropil of wild-type/heterozygous (red curve) and kif5aa mutant larvae (blue) (n = 9 each). RGC arbor activity in kif5aa mutants was strongly diminished. Light red and blue zones indicate the 95% confidence intervals around the averaged deltaF/F0 curves for the neuropil region of interest (NP).
Figure 4—figure supplement 1
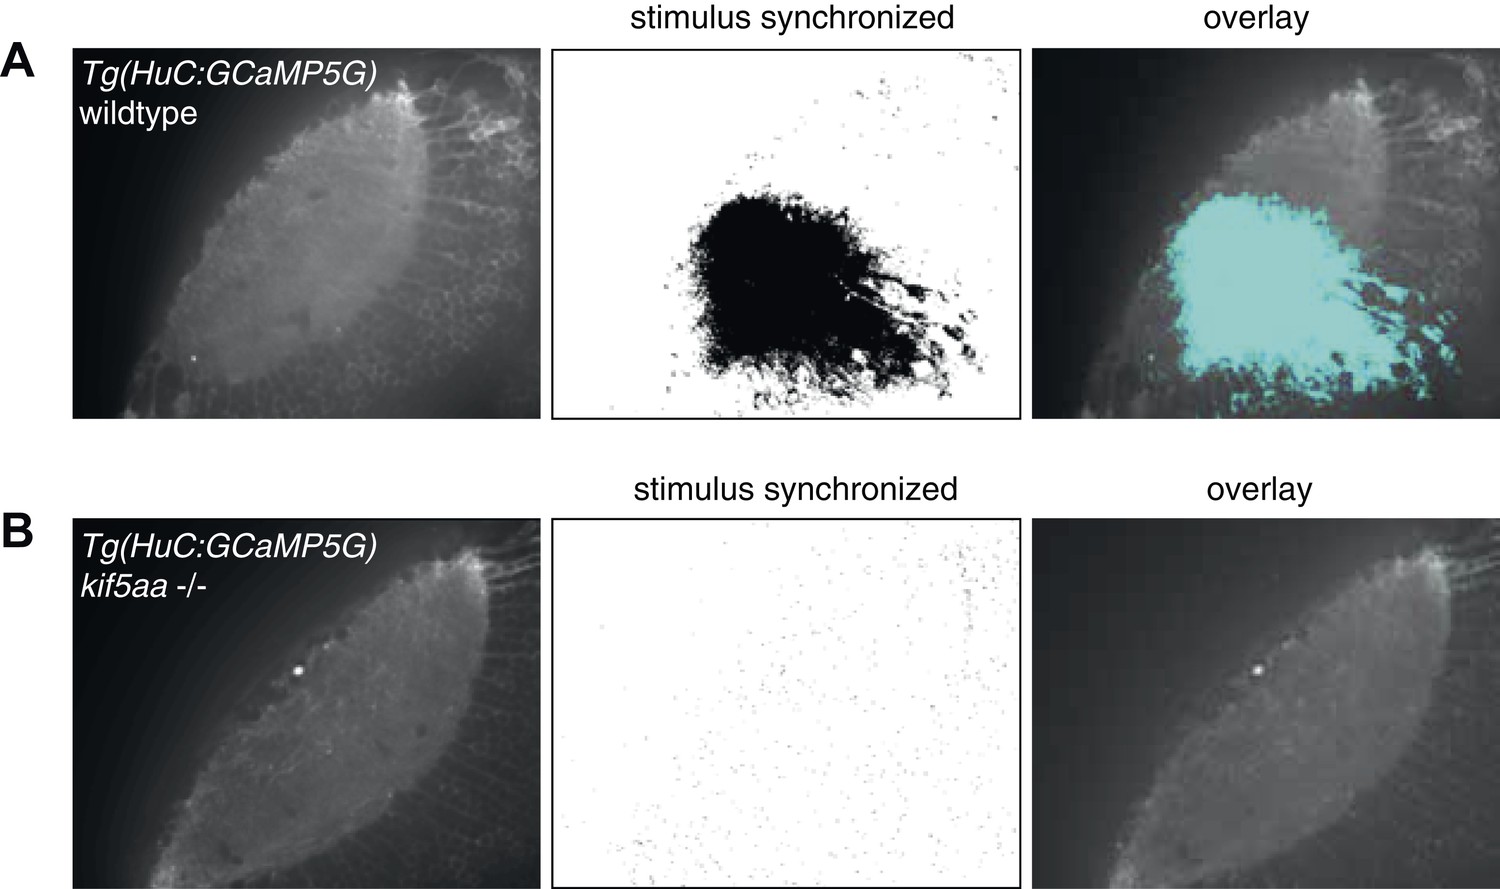
Regression-based analysis of wild-type/heterozygous vs kif5aa−/− Tg(HuC:GCaMP5G) mutants to a visual stimulus.
Kif5aa sibling and mutant Tg(HuC:GCaMP5G) larvae were stimulated with a visual bar running from caudal to rostral in the visual field. Subsequently, regression analysis of the measured Calcium time-series and a time-series representing an expected calcium response to the stimulus was performed (Miri et al., 2011). In wild-type/heterozygous a large number of correlated pixels could be identified spanning the neuropil and PVN layers (A), whereas in kif5aa mutants no pixels were activity correlated with the stimulus (B).
Figure 5 with 3 supplements
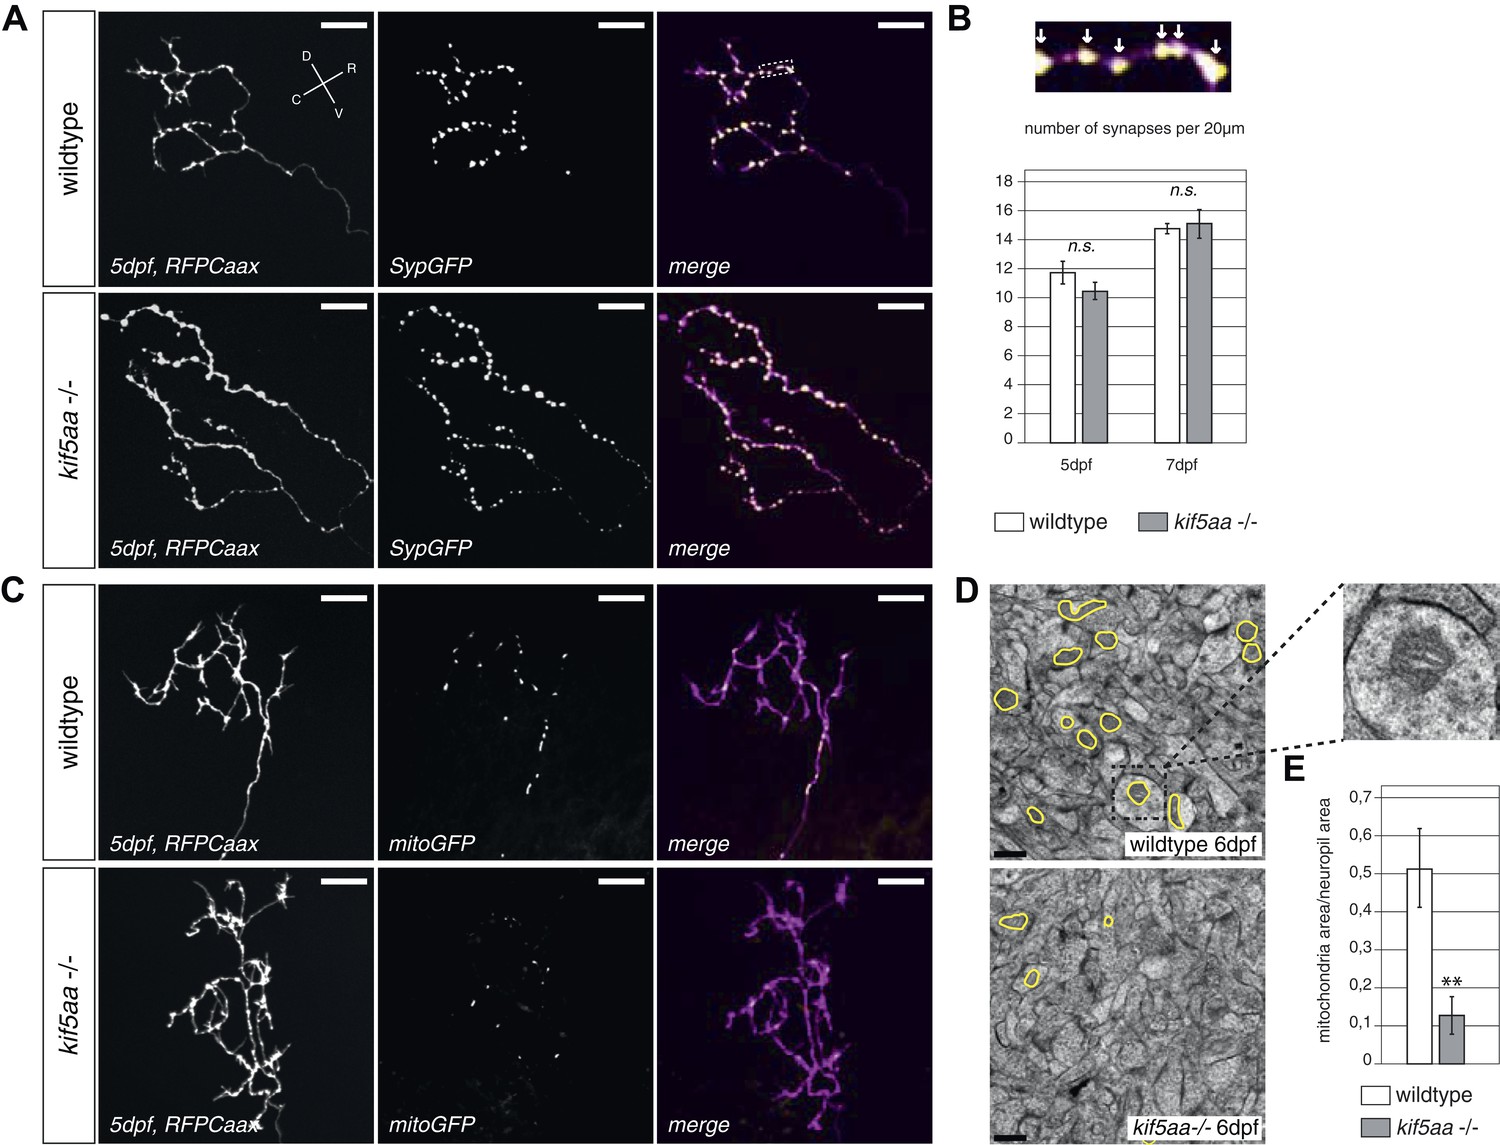
Kif5aa mutant RGC arbors show the same density of presynaptic sites but are depleted of mitochondria.
(A) In vivo imaging shows the distribution of presynaptic sites marked by Synaptophysin-GFP (SypGFP) in single kif5aa mutant and wild-type RGC arbors expressing membrane localized RFP (RFPCaax). Upper panel: wild-type cell arbor, lower panel: kif5aa mutant cell arbor. Scale bars = 20 μm. D = dorsal, V = ventral, R = rostral, C = caudal. (B) Upper panel: Zoom in to an axonal segment indicated in the right panel of (A). Stable presynaptic clusters of SypGFP larger than 0.4 μm were defined as synapses (white arrows in the upper panel) and synapse density in axonal segments of wild-type and mutant cell arbors does not show a significant difference at 5 and 7 dpf (lower panel). (C) Distribution of mitochondria (labeled by mitoGFP) in single mutant and wild-type RGC arbors expressing membrane localized RFP (RFPCaax) in vivo. Upper panel: wild-type cell arbor, lower panel: kif5aa mutant cell arbor. Mutants RGC cell arbors show substantially less mitochondria. Scale bars = 20 μm. (D) Transmission electron micrograph of a transvers section of the neuropil containing RGC axonal arbors. Upper panel: wild-type neuropil, lower panel: kif5aa mutant neuropil. In yellow circles: mitochondria. Left panel: Zoom in into a single axonal segment containing a mitochondrion. The kif5aa mutant neuropil contains less mitochondria. Scale bar = 500 nm. (E) Quantification of mitochondria area per neuropil area comparing wild-type and mutant tecta at 6 dpf. Mutant cells contain significantly less mitochondria than wild-type cells (p < 0.01).
Figure 5—figure supplement 1
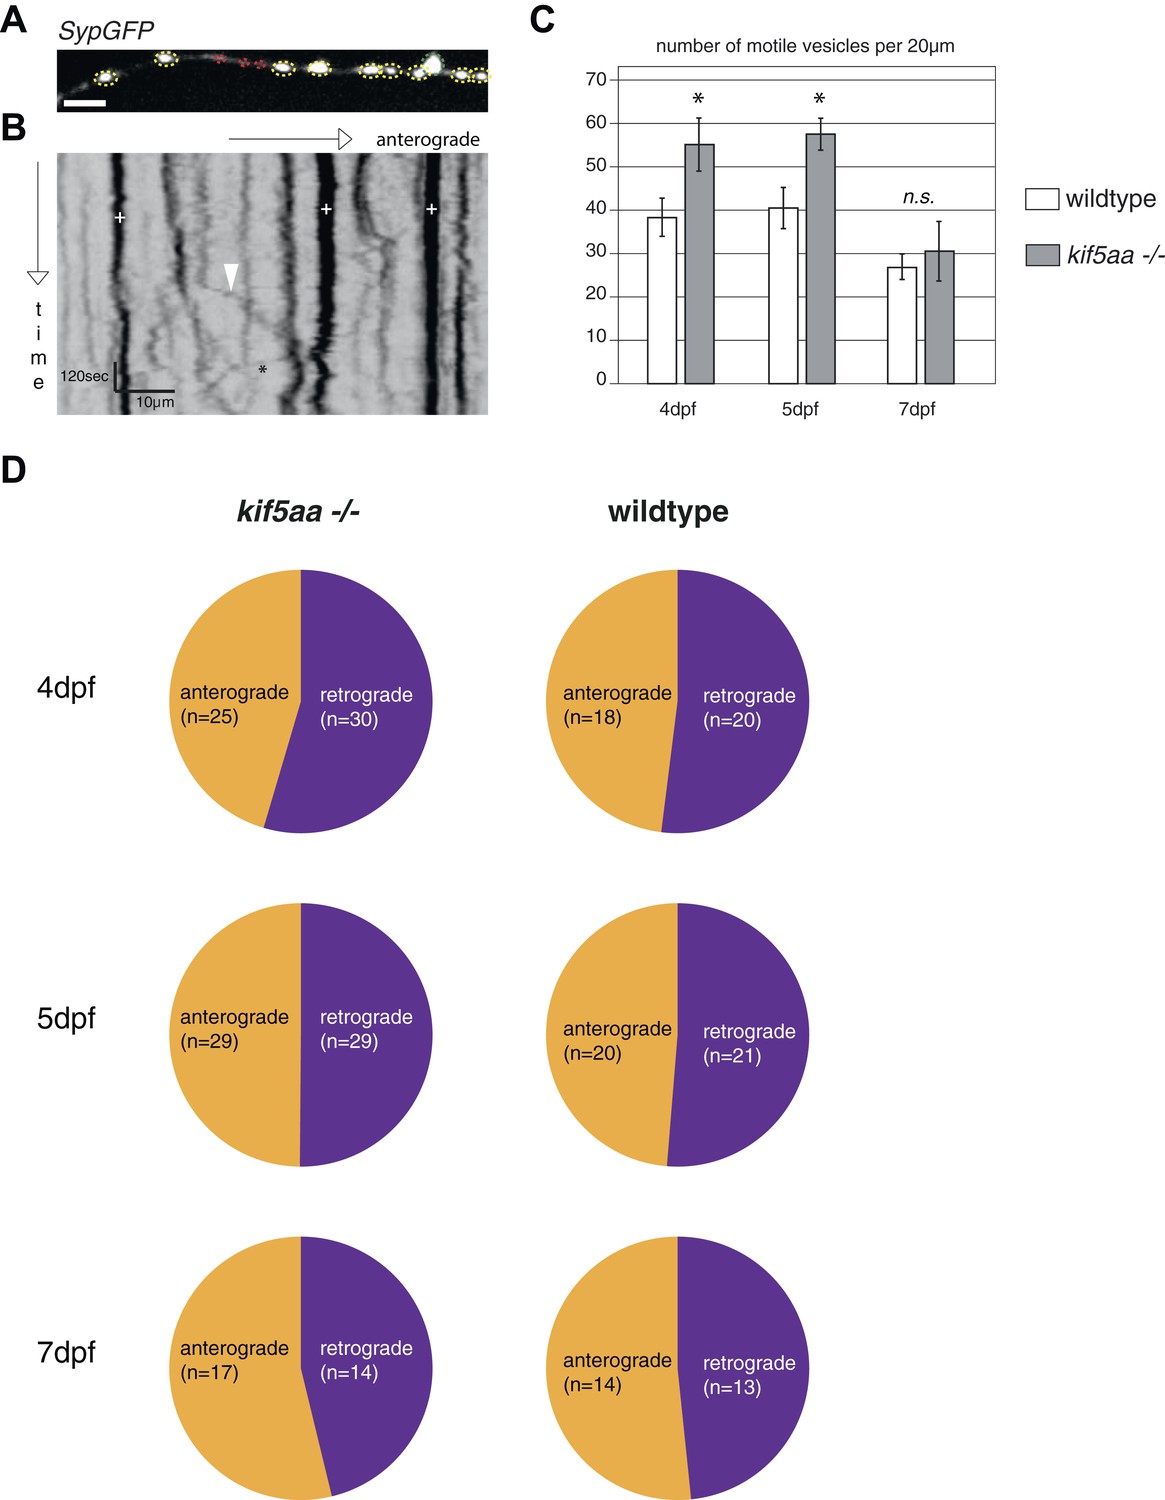
Analysis of transport dynamics of synaptic vesicles in wild-type and kif5aa mutant cells during visual system development.
(A) Synaptic vesicles were visualized by Synaptophysin-GFP (SypGFP) expression and imaged in axonal segments of wild-type and kif5aa mutant cell RGC arbors. Depending on the size of vesicles we defined two different categories (Meyer and Smith, 2006): small vesicles (<0.4 μm) (shown in red) and medium sized and large vesicles (>0.4 μm) (shown in yellow and green). (B) Transport dynamics of synaptic vesicles were analyzed in kymographs (see Video 3). White cross: stable vesicles. White arrowhead: vesicle transported in anterograde direction. Black star: vesicle transported in retrograde direction. Scale bar = 3 μm. (C) While the number of stable presynaptic sites was not altered in kif5aa mutant cells (see Figure 5), they show an increased number of small, motile vesicles at 4 and 5 dpf reflecting their highly dynamic growth state (p < 0.05). This difference disappears at 7 dpf. (D) Quantification of anterograde and retrograde transport rates at 4, 5, and 7 dpf does not show a difference between wild-type and kif5aa mutant RGC arbors.
Figure 5—figure supplement 2
Analysis of mitochondria localization and transport dynamics in wildtype and kif5aa mutant RGC arbors.
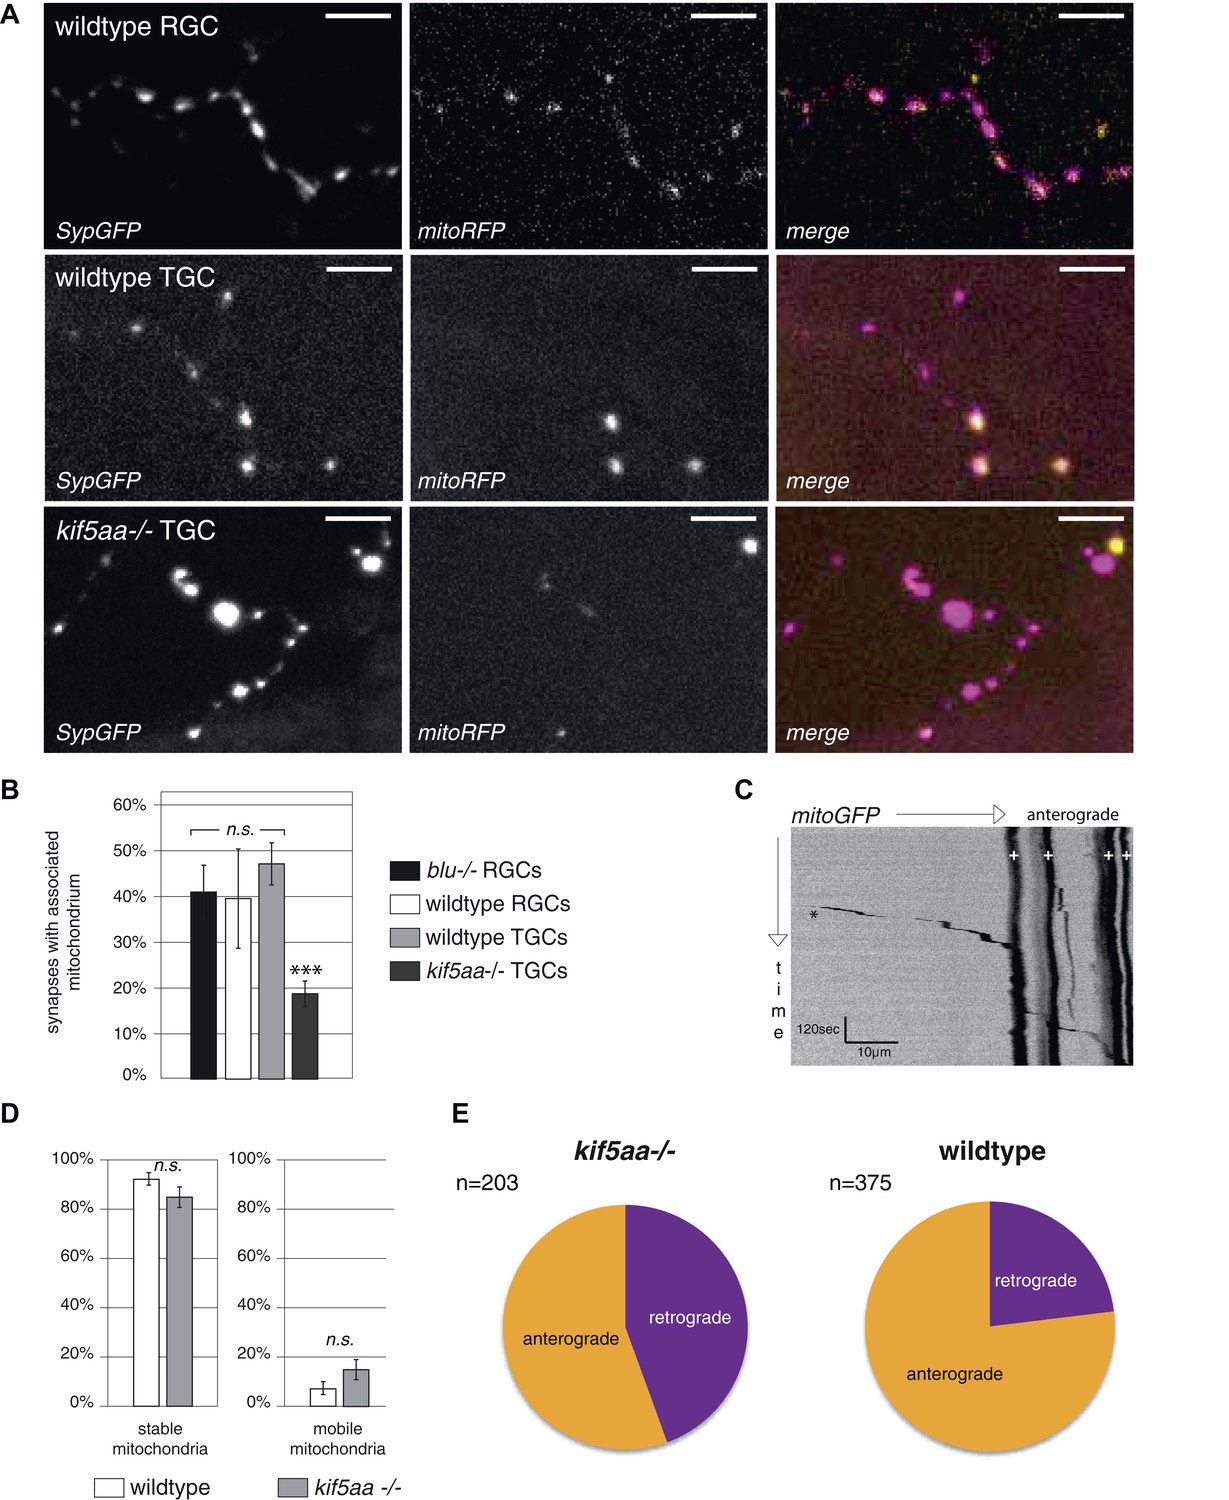
(A) As previously shown in other experimental systems (Obashi and Okabe, 2013) mitochondria are often localized in close proximity to synapses. In the upper panel, an axonal segment of a single RGC axon with labeled synapses (SypGFP) and mitochondria (mitoRFP) is shown. Scale bar = 5 μm. The middle panel and the lower panel show an axonal segment of a trigeminal Ganglion Cell (TGC) with labeled synapses and mitochondria in wild-type and kif5aa mutant embryos, respectively. Scale bar = 5 μm. (B) In wildtype and blumenkohl mutant embryos about 40% of synapses in RGCs possess an associated mitochondrion (blu RGCs: 41/91, wt RGCs: 68/153). This percentage is also observed in wild-type TGCs while in kif5aa mutant TGCs only about 20% of synapses contain a colocalized mitochondrion (wt TGCs: 117/235, kif5aa TGCs: 99/452). (C) Kymograph of labeled mitochondria within an RGC axonal segment (see Video 4). White crosses = stable mitochondria. Black asterisk = Single mitochondrion moving in anterograde direction. (D) Comparison of mitochondria dynamics between wild-type and kif5aa mutant RGC axons at 5 dpf. In both, most mitochondria are stable while only about 15% of mitochondria are motile. (E) Of these, in mutant cells mitochondria move significantly more often in retrograde direction (p < 0.05). Wild-type cells show a higher proportion of anterograde transport.
Figure 5—figure supplement 3
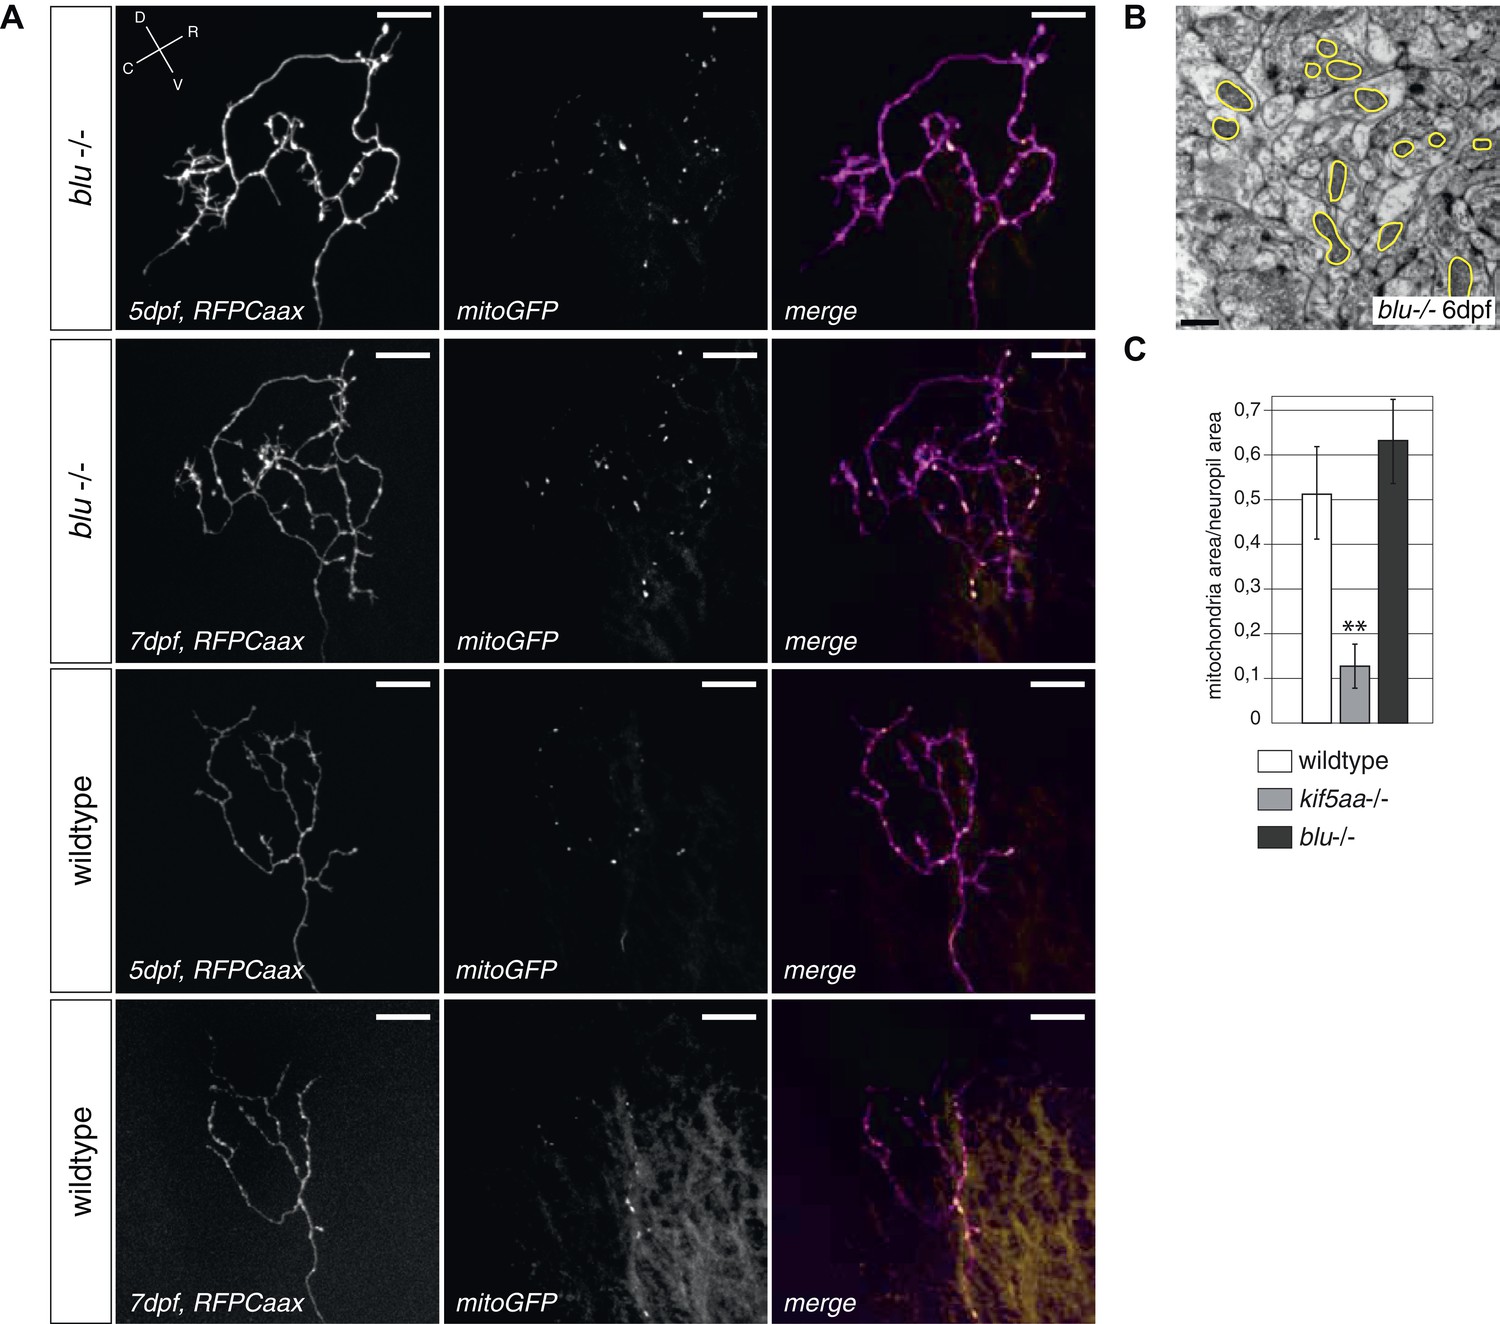
Retinal Ganglion Cells show a normal mitochondria distribution in blumenkohl mutants.
(A) Distribution of mitochondria (labeled by mitoGFP) in single blumenkohl mutant and wild-type RGC arbors expressing membrane localized RFP (RFPCaax) in vivo. Upper two panels: blumenkohl mutant cell arbors at 5 and 7 dpf, lower two panels: wild-type cell arbors at 5 and 7 dpf. D = dorsal, V = ventral, R = rostral, C = caudal. Scale bars = 20 μm. (B) Transmission electron micrograph of a transvers section of the blumenkohl mutant neuropil containing RGC axonal arbors. In yellow circles: mitochondria. Scale bar = 500 nm. (C) Quantification of mitochondria area per neuropil area comparing wildtype, blumenkohl and kif5aa mutant tecta at 6 dpf. No difference is observed between wild-type and blumenkohl mutant cells while kif5aa mutants contain significantly less mitochondria than wild-type cells (p < 0.01). The graphs for kif5aa and wild-type cells were taken from Figure 5.
Figure 6 with 1 supplement
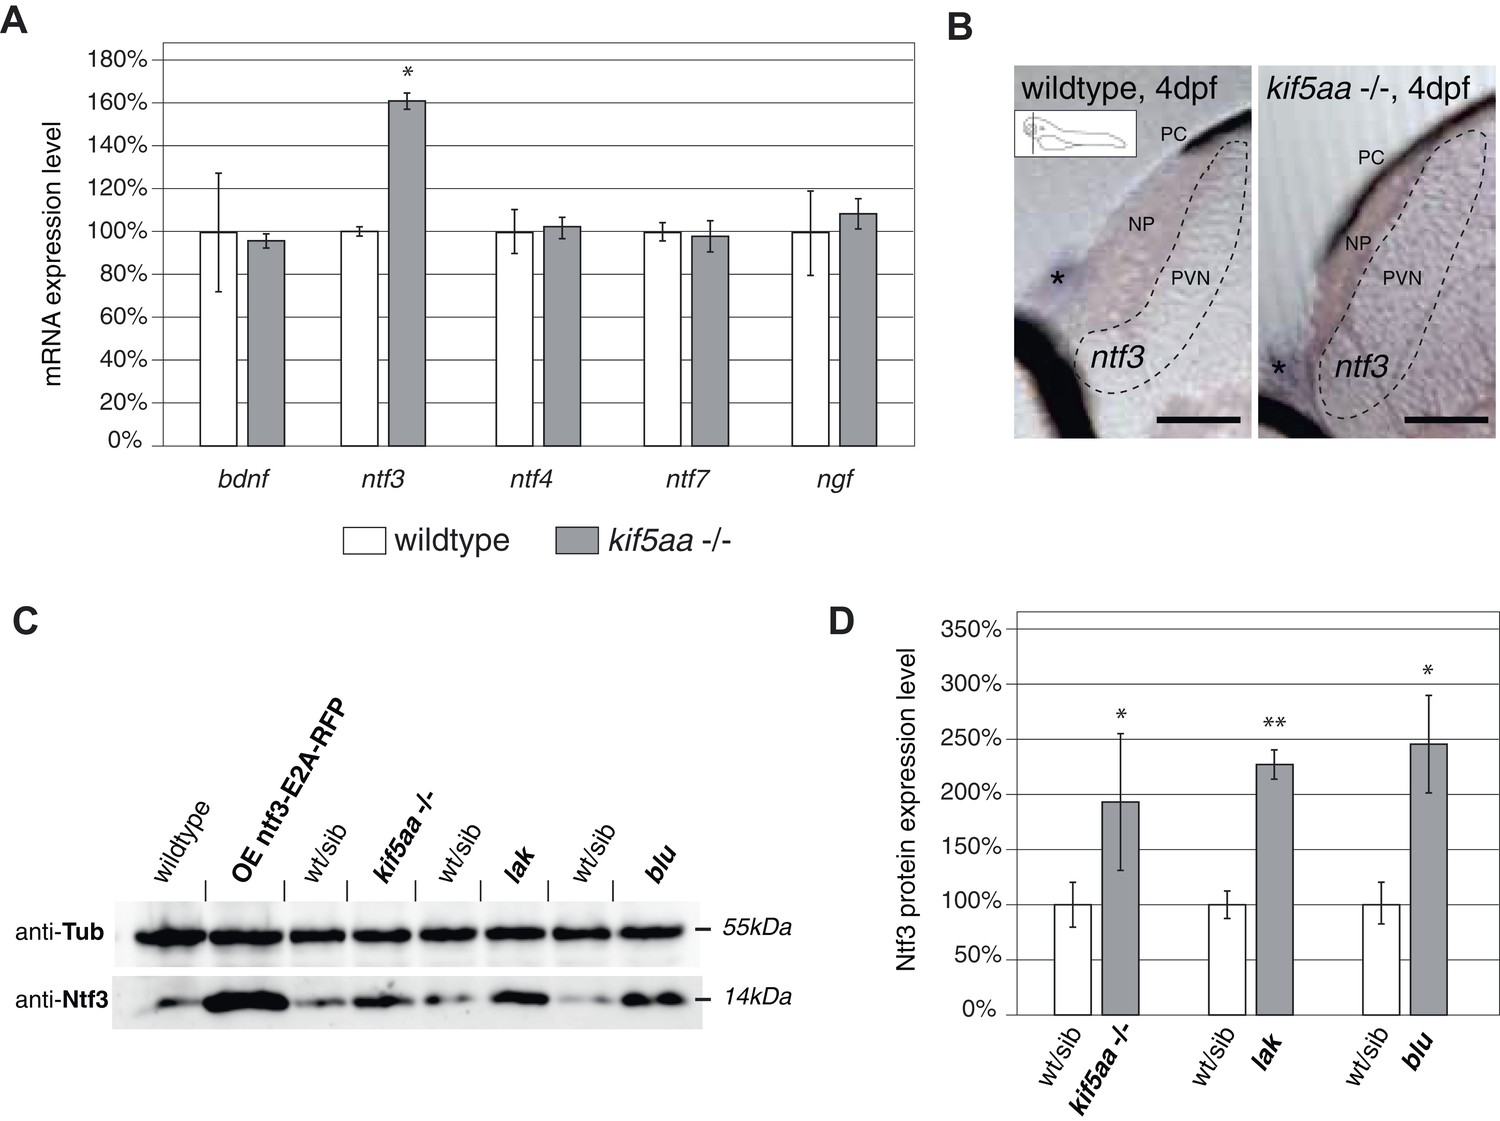
Expression of the neurotrophic factor neurotrophin 3 in visually impaired mutants.
(A) Relative expression levels of bdnf, ntf3, ntf4, ntf7, and ngf in 4 dpf old wild-type and kif5aa mutant embryos. ntf3 is upregulated to 160% of wild-type expression levels (p < 0.05) while all other neurotrophic factors show the same expression levels between wild-type and mutant embryos. (B) Transversal sections through the tectum after in situ hybridization with an ntf3 specific antisense probe detect higher expression levels of ntf3 in tecta of kif5aa. Scale bars = 25 μm. PC = pigment cell, NP = neuropil, PVN = periventricular neurons. Asterisk = strong ntf3 signal in the otic vesicle. (C) Confirmation of Ntf3 overexpression by Western blotting in 4 dpf old embryos. To show the specificity of the antibody, we generated a Ntf3 overexpression construct (UAS:ntf3-E2A-RFP). The two visually impaired mutant lines lakritz and blumenkohl also show a substantial upregulation of ntf3 expression levels. (D) Quantification of Ntf3 protein expression levels based on Western blotting data in wild-type and visually impaired mutant embryos. All three mutant lines show a substantial upregulation of Ntf3 protein levels.
Figure 6—figure supplement 1
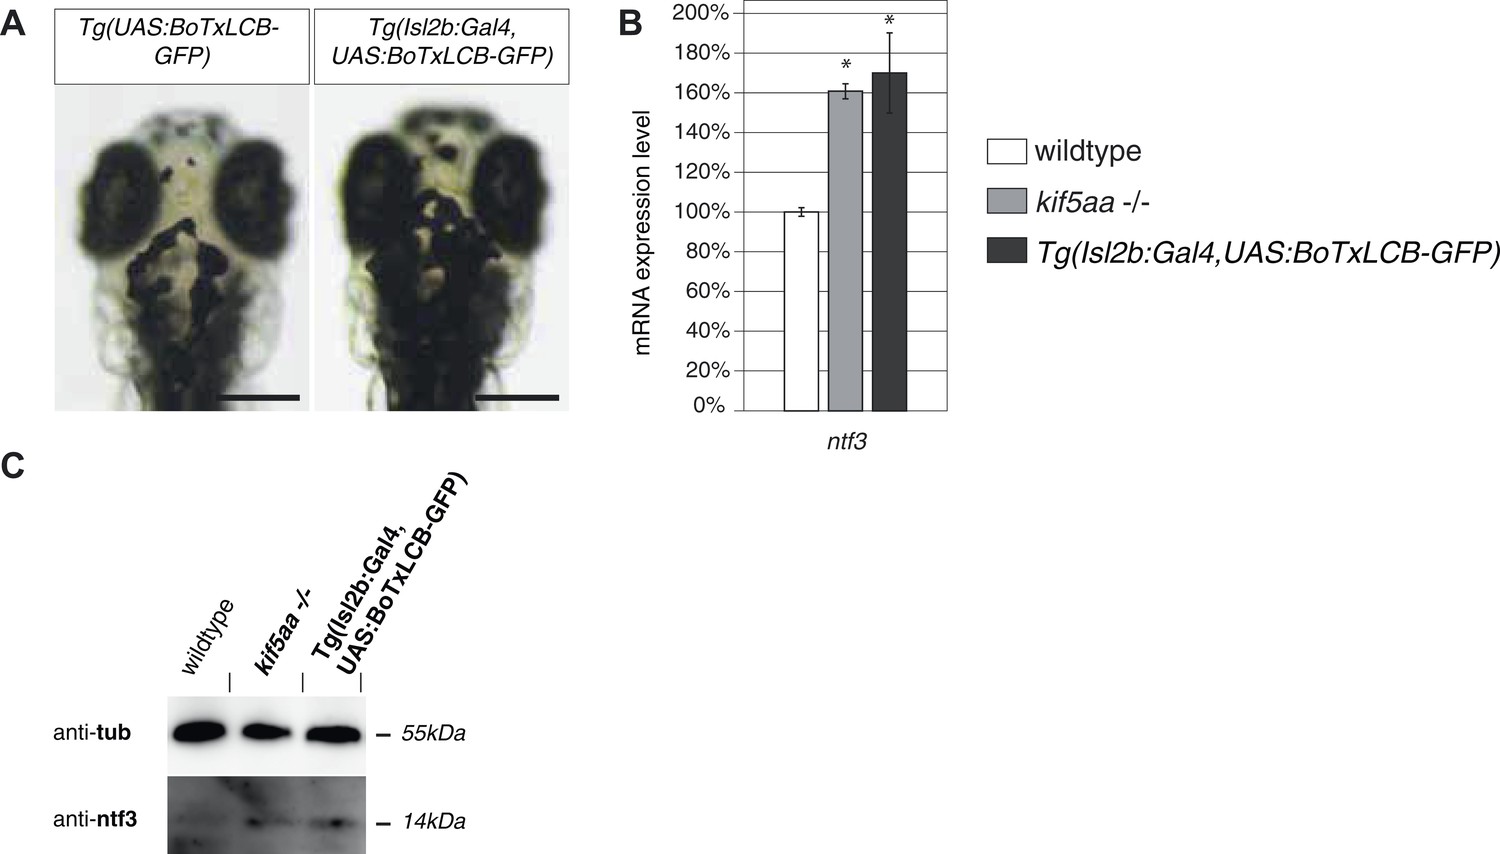
Silencing of all Retinal Ganglion Cells by BoTx expression leads to Ntf3 upregulation.
(A) Expression of botulinum toxin light chain B (Brunger et al., 2008; Nevin et al., 2008) in all RGCs leads to expansion of melanosomes similar to blind mutant fish as shown in Figure 1—figure supplement 1. Scale bar = 200 μm. (B) Relative expression levels of ntf3 in 4-dpf old wildtype, kif5aa mutant, and Tg(Isl2b:Gal4, UAS:BoTxLCB-GFP) transgenic embryos. ntf3 is upregulated to a similar extent in Tg(Isl2b:Gal4, UAS:BoTxLCB-GFP) transgenic embryos as in kif5aa mutants. (C) Western blotting confirms the overexpression of Ntf3 protein in embryos without presynaptic activity.
Figure 7 with 1 supplement
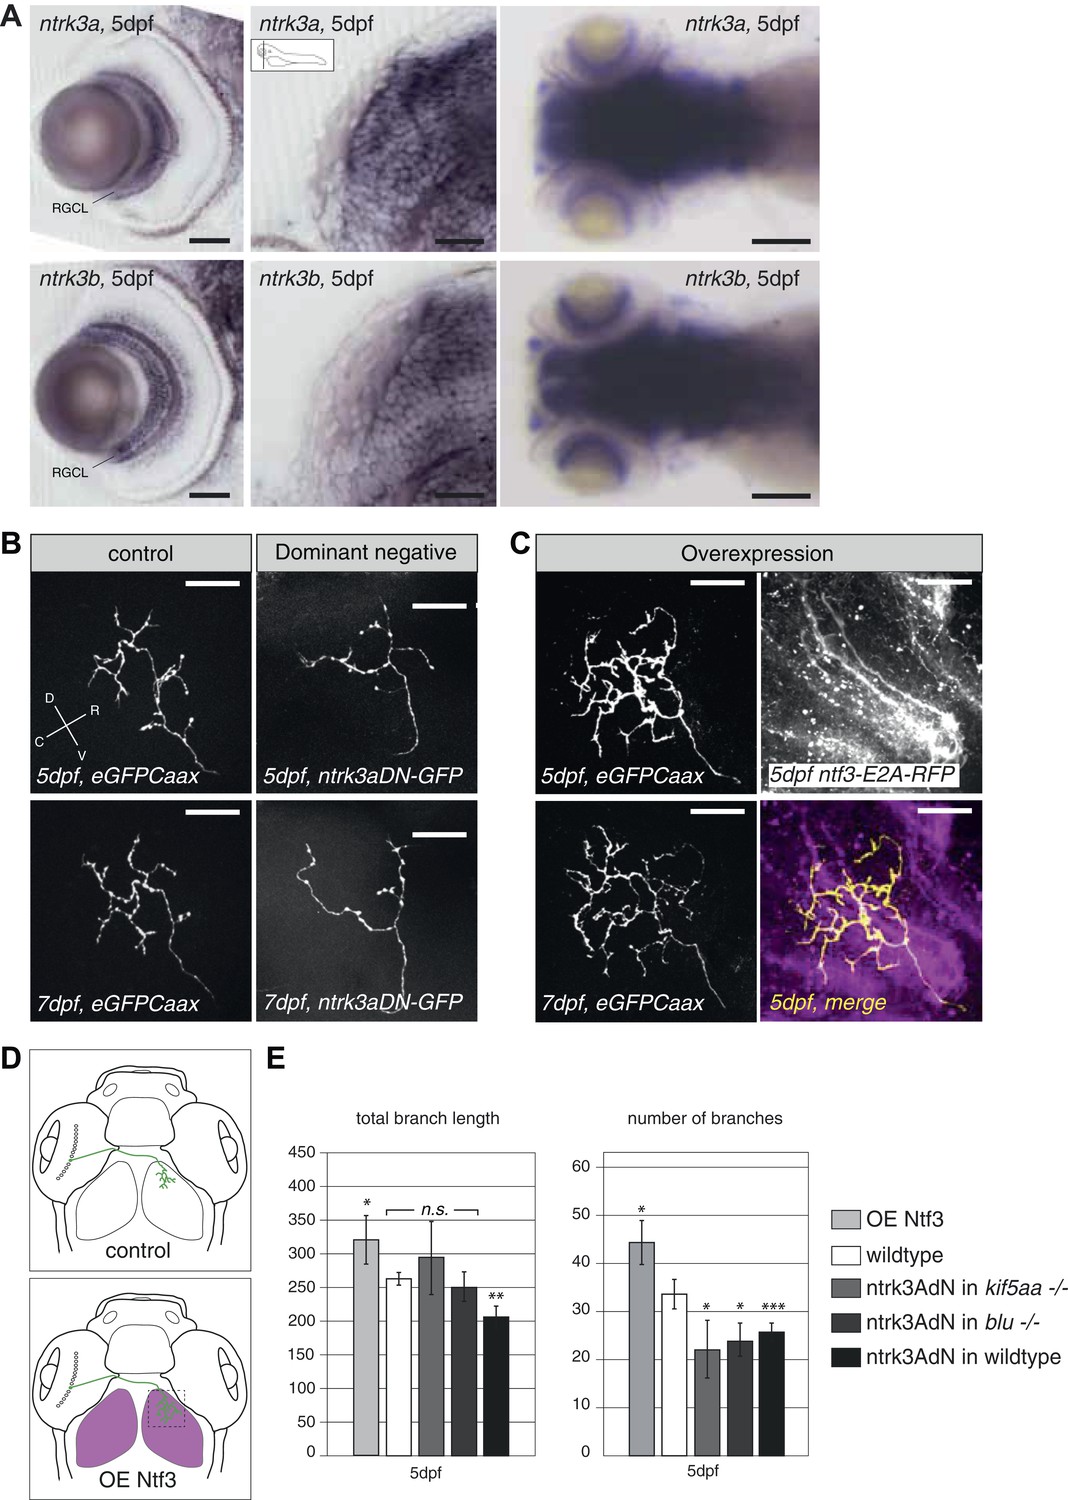
Neurotrophin 3 signaling alters axonal branch size in RGCs.
(A) In situ hybridization with ntrk3a and ntrk3b specific antisense probes shows expression of both paralogues in broad parts of the nervous system in 5 dpf larvae. Both receptors are strongly expressed in RGCs. RGCL = Retinal Ganglion Cell Layer. Scale bars (from left to right) = 50 μm, 50 μm, 150 μm. (B) Representative pictures of single RGC axons at 5 (upper) and 7 dpf (lower panel). Control RGC cells express a membrane bound eGFP (control; left panel). To render cells unresponsive to the TrkC pathway, single RGCs express a dominant negative, kinase dead and eGFP-tagged form of the neurotrophic factor receptor ntrk3a (ntrk3adN-GFP) (dominant negative, right panel). Consequently, RGCs grow smaller arbors with less branches. (C) To investigate the effect of Ntf3 on RGC axonal growth, we monitored single eGFP positive RGCs while growing into a tectum overexpressing Ntf3 (overexpression) at 5 (upper left panel) and 7 dpf (lower left panel). Overexpression of Ntf3 was driven by an UAS:ntf3-E2A-RFP construct in the Tg(gSA2AzGFF49A) (Muto et al., 2013) transgenic line in tectal glial cells and periventricular neurons from 2 dpf onwards. By employing a 2A sequence between the ntf3 and the RFP open reading frame, both proteins were produced from the same construct. Thereby Ntf3 overexpressing cells were marked by RFP expression (right upper panel) and we analyzed the arbors of single eGFPCaax positive RGCs at 5 (upper left panel) and 7 dpf (lower left panel) growing in RFP expressing optic tecta. RGCs grow more complex arbors with more branches when invading into the Ntf3 overexpressing tectal environment compared to control RGCs (A, left panel). Lower left panel = merge of ntf3-E2A-RFP expressing tectal cells and an eGFPCaax expressing RGC axon. Scale bars = 20 μm. D = dorsal, V = ventral, R = rostral, C = caudal. (D) Schematics illustrating the approach for analysis of single RGC arbors. While in control and dominant negative expression experiments, single RGCs were labeled (upper panel), in the Ntf3 overexpression situation, single membrane bound eGFP (eGFPCaax) labeled RGCs were growing into a tectum overexpressing Ntf3 (labeled by RFP expression, shown in magenta, lower panel). (E) Quantification of total branch length and number of branches at 5 dpf in single RGC arbors upon overexpression of the dominant negative ntrk3adN-GFP construct in single RGCs or overexpression of Ntf3 in tectal cells. Ntrk3adN-GFP expressing wild-type cells are significantly smaller and grow fewer branches at 5 dpf (p < 0.001). In both, kif5aa and blumenkohl mutant embryos, expression of ntrk3adN-GFP in single RGCs inhibits the overgrowth of the axonal arbor that is normally observed. The branch length is not different to the length in wild-type cells. Ntf3 overexpression in the tectum leads to increased axonal branch length and increased branch number in wild-type RGCs (p < 0.05) (n = 8, 23, 7, 8, 26).
Figure 7—figure supplement 1
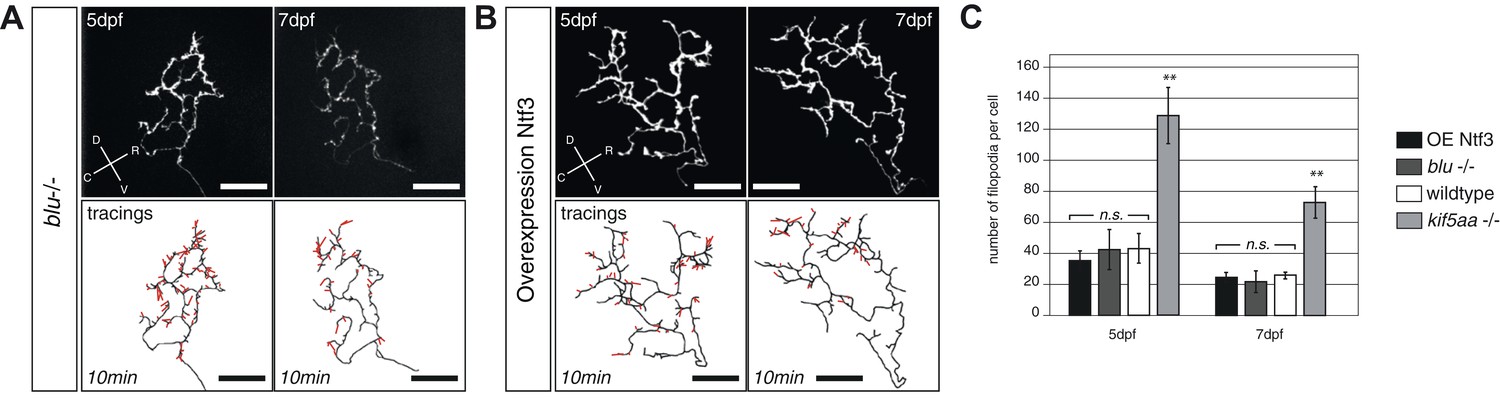
Blumenkohl mutant RGC arbors and RGC arbors growing into a Ntf3 overexpressing tectum do not show increased filopodia dynamics.
(A) Upper panel: Axonal arbor of a single blumenkohl mutant RGC at 5 and 7 dpf. (indicated by an arrow). D = dorsal, V = ventral, R = rostral, C = caudal. Lower panel: Tracings of an axonal arbor at time point zero. In red: Overlay of filopodia formed and retracted within 10 min (1 frame/2 min). Scale bars = 20 μm. (B) Upper panel: Axonal arbor of a single RGC axonal arbor growing into a Ntf3 overexpressing tectum (compare Figure 7) at 5 and 7 dpf. Lower panel: Tracing of an axonal arbor at time point zero. In red: Overlay of filopodia formed and retracted within 10 min (1 frame/2 min). Scale bars = 20 μm. (C) Quantification of filopodia numbers formed and retracted within 10 min per cell at 5 and 7 dpf. No increased rate of filopodia formation can be observed in blumenkohl mutant RGC arbors and arbors of RGCs growing into a Ntf3 overexpressing tectum while kif5aa mutant axonal arbors form and retract significantly more filopodias. Graphs for wild-type and kif5aa mutant RGC arbors are identical to Figure 7.
Figure 8 with 2 supplements

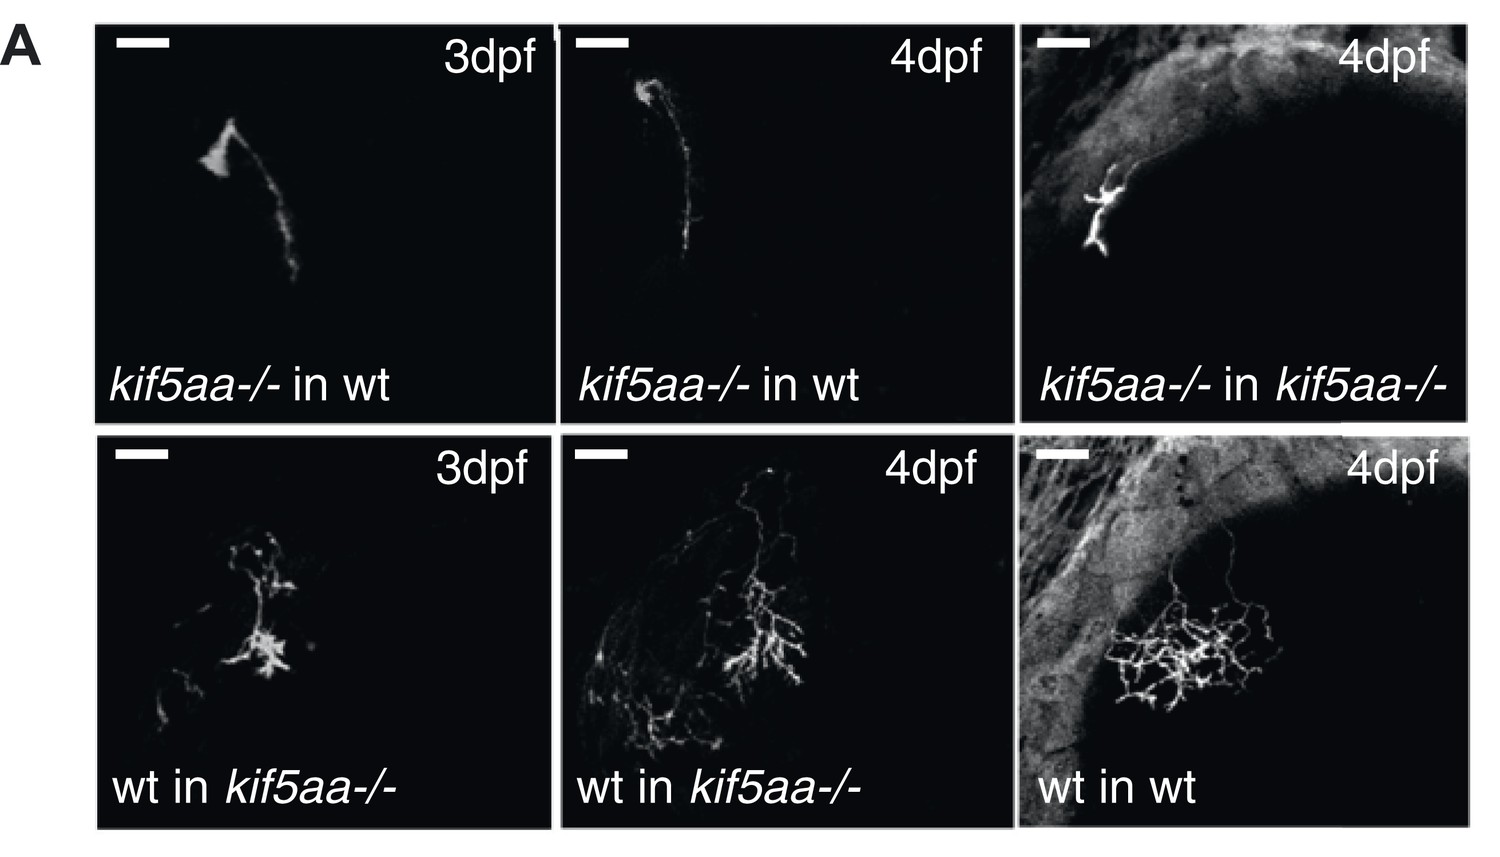
Transplantations confirm the growth promoting-effect in kif5aa mutant tecta.
(A) Representative pictures of single in vivo imaged RGC axons after blastula stage transplantions from wild-type donors into a wild-type tectum (left panel), from kif5aa mutants into a wild-type tectum (middle panel) or from a wild-type donor into a kif5aa mutant tectum (right panel). The same cell was analyzed at 5 dpf (upper panel) and 7 dpf (middle panel). Scale bars = 20 μm. Schematics of RGC arbor complexity and size in the lower panel. In orange: Ntf3 overexpressing kif5aa mutant tectum. D = dorsal, V = ventral, R = rostral, C = caudal. (B) Quantification of total branch length of transplanted RGC axons at 5 and 7 dpf. Kif5aa mutant cell arbors are significantly smaller than wild-type cell arbors when growing into a wild-type tectum (p < 0.01). Wild-type cells built larger arbors when growing into a kif5aa mutant tectum (p < 0.05) (5 dpf: n = 14, 35, 6; 7 dpf: n = 14, 19, 5). (C) Schematic illustrating growth behavior of RGC axons in wildtype (upper panel) and kif5aa mutant tecta (lower panel) and upon loss of TrkC signaling (middle panel). Wild-type RGCs start to grow into the wild-type neuropil at 3 dpf. They grow highly active filopodial protrusions and start to form complex axonal arbors. At 5 dpf they reach their final size and maintain their branch shape at 7 dpf. When TrkC signaling is blocked by overexpression of a dominant negative receptor (ntrk3adN-GFP), wild-type cells show a substantially reduced arbor complexity (middle panel). Kif5aa mutant RGC arbors show a delay of ingrowth into the tectal neuropil. This is followed by a period of highly active growth with abundant filopodia formation. This results in highly complex arbors at 7 dpf. The delay of RGC growth is cell autonomous (Figure 8—figure supplement 1). The lack of retinal input leads to an upregulation of ntf3 expression by tectal cells and constitutes a growth-promoting environment.
Figure 8—figure supplement 1
Phenotype of transplanted RGC arbors at early stages of development.
(A) Kif5aa mutant RGC arbors show a delay of ingrowth into the optic tectum compared to wild-type cells (right column). This delay is cell autonomous as mutant RGC axons also fail to invade their target tissue before 4 dpf when transplanted into a wild-type background (upper panel, middle, and left column). In contrary, wild-type cells when transplanted into a kif5aa mutant tectum grow into the neuropil from 3 dpf onwards (lower panel, middle, and left column). Scale bars = 20 μm.
Figure 8—figure supplement 2
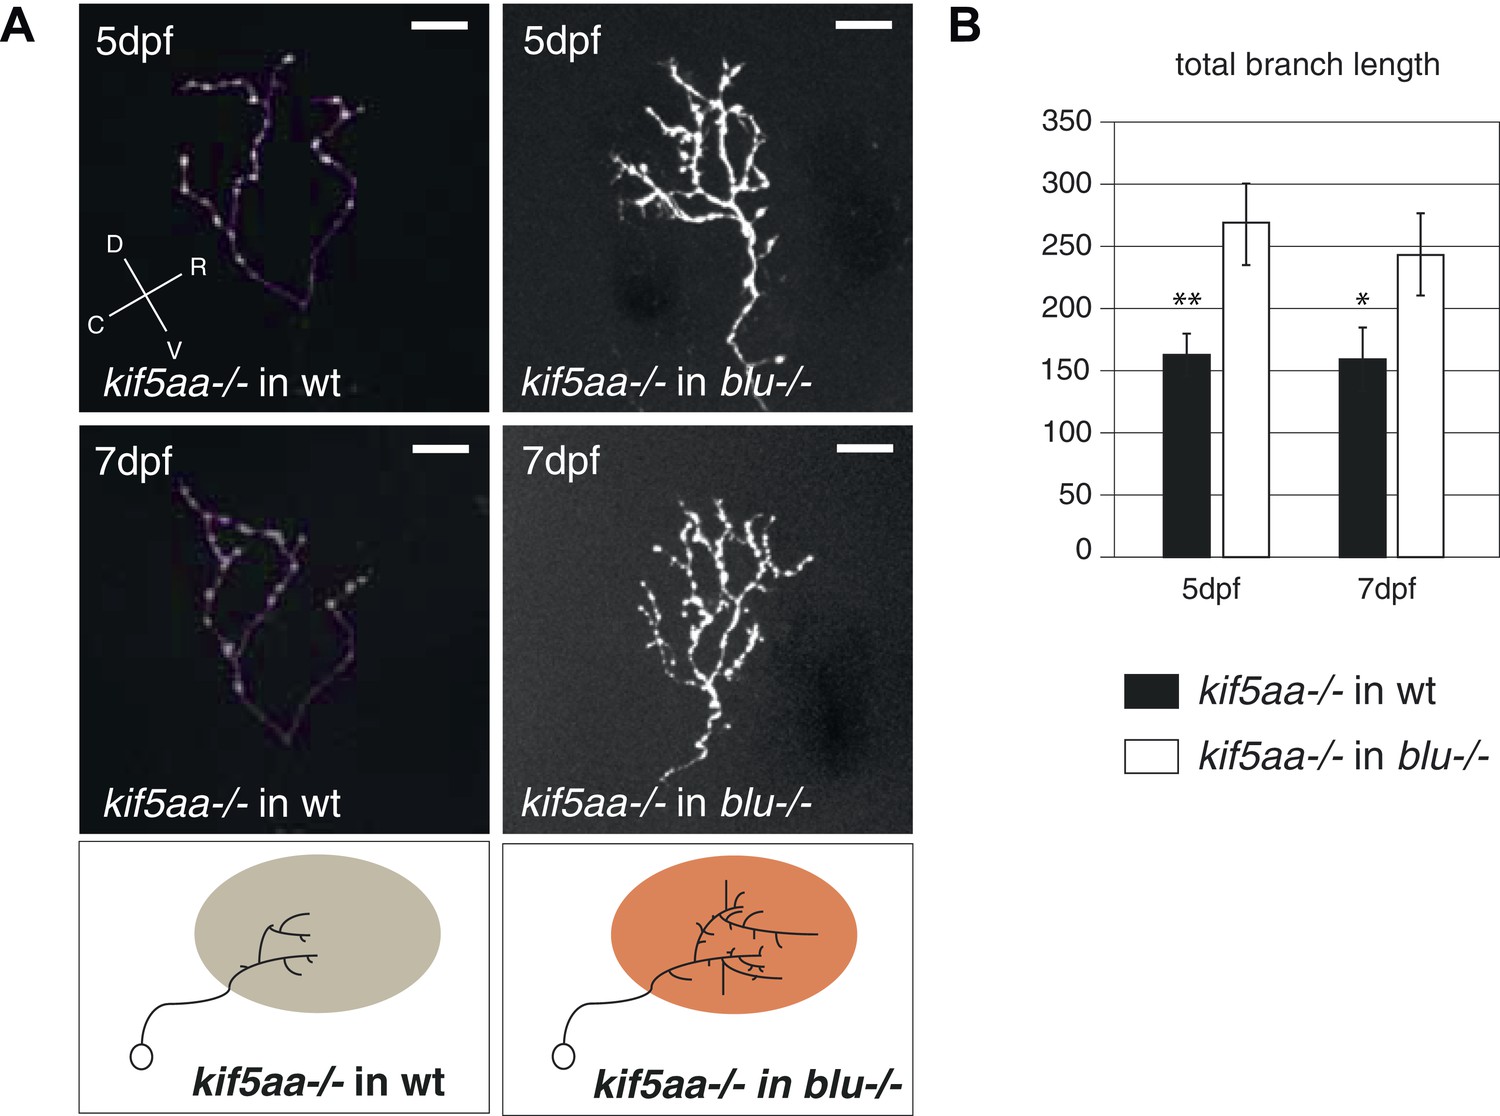
Transplantation of kif5aa mutant RGCs into a blumenkohl mutant acceptor leads to an increased growth compared to transplantation into a wild-type acceptor.
(A) Representative pictures of single in vivo imaged RGC axons after blastula stage transplantions from kif5aa mutant donors into a wild-type tectum (left panel) and from kif5aa mutants into a blumenkohl mutant tectum (right panel). The same cell was analyzed at 5 dpf (upper panel) and 7 dpf (middle panel). Scale bars = 20 μm. Schematics of RGC arbor complexity and size in the lower panel. In orange: Ntf3 overexpressing blumenkohl mutant tectum. D = dorsal, V = ventral, R = rostral, C = caudal. Pictures in the left panel are identical to Figure 8. (B) Quantification of total branch length of transplanted RGC axons at 5 and 7 dpf. The reduced size of kif5aa mutant axonal arbors when growing into a wild-type tectum is partially rescued when transplanted into a blumenkohl mutant environment (p < 0.05) (5 dpf: n = 35, 8; 7 dpf: n = 19, 8). The graph for kif5aa mutant cells into a wild-type host is identical to Figure 8.
Videos
Video 1
In vivo timelapse imaging of the optic tectum in a Tg(HuC:GCaMP5G) transgenic 5 dpf wild-type fish.
A wild-type larva was stimulated with a visual bar running from caudal to rostral through the visual field of the contralateral eye to the imaged optic tectum. Stimulus onset is indicated by a white circle in the top right corner of the image sequence. The movie is accelerated to a framerate of 40 frames/s.
Video 2
In vivo timelapse imaging of the optic tectum in Tg(HuC:GCaMP5G) transgenic 5 dpf kif5aa mutant embryos.
A kif5aa mutant larva was stimulated with a visual bar running from caudal to rostral through the visual field of the contralateral eye to the imaged optic tectum. Stimulus onset is indicated by a white circle in the top right corner of the image sequence. The movie is accelerated to a framerate of 40 frames/s.
Video 3
In vivo timelapse imaging of Synaptophysin-GFP containing clusters in RGC axonal segments.
Representative RGC axonal segment in a 5 dpf old wild-type larva. SypGFP labels synaptic clusters of different sizes that were grouped in small and middle-sized plus large vesicles. Compare Figure 5—figure supplements 1A,B for grouping and kymogram analysis.
Video 4
In vivo timelapse imaging of mitochondria in RGC axonal segments.
Representative RGC axonal segment in a 5 dpf old wild-type larva. Compare Figure 5—figure supplement 2B for kymogram analysis of mitochondria movements.
Additional files
-
Supplementary file 1
Description of zebrafish mutant and transgenic lines used in this study.
- https://doi.org/10.7554/eLife.05061.026
-
Supplementary file 2
Primers used in this study.
- https://doi.org/10.7554/eLife.05061.027
-
Source code 1
Source code for moving bar stimulus.
- https://doi.org/10.7554/eLife.05061.028
Download links
A two-part list of links to download the article, or parts of the article, in various formats.
Downloads (link to download the article as PDF)
Open citations (links to open the citations from this article in various online reference manager services)
Cite this article (links to download the citations from this article in formats compatible with various reference manager tools)
Deletion of a kinesin I motor unmasks a mechanism of homeostatic branching control by neurotrophin-3
eLife 4:e05061.
https://doi.org/10.7554/eLife.05061


