Architecture and dynamics of the autophagic phosphatidylinositol 3-kinase complex
- University of California, Berkeley, United States
- Howard Hughes Medical Institute, University of California, Berkeley, United States
- National Institutes of Health, United States
- Lawrence Berkeley National Laboratory, United States
Figures
Figure 1
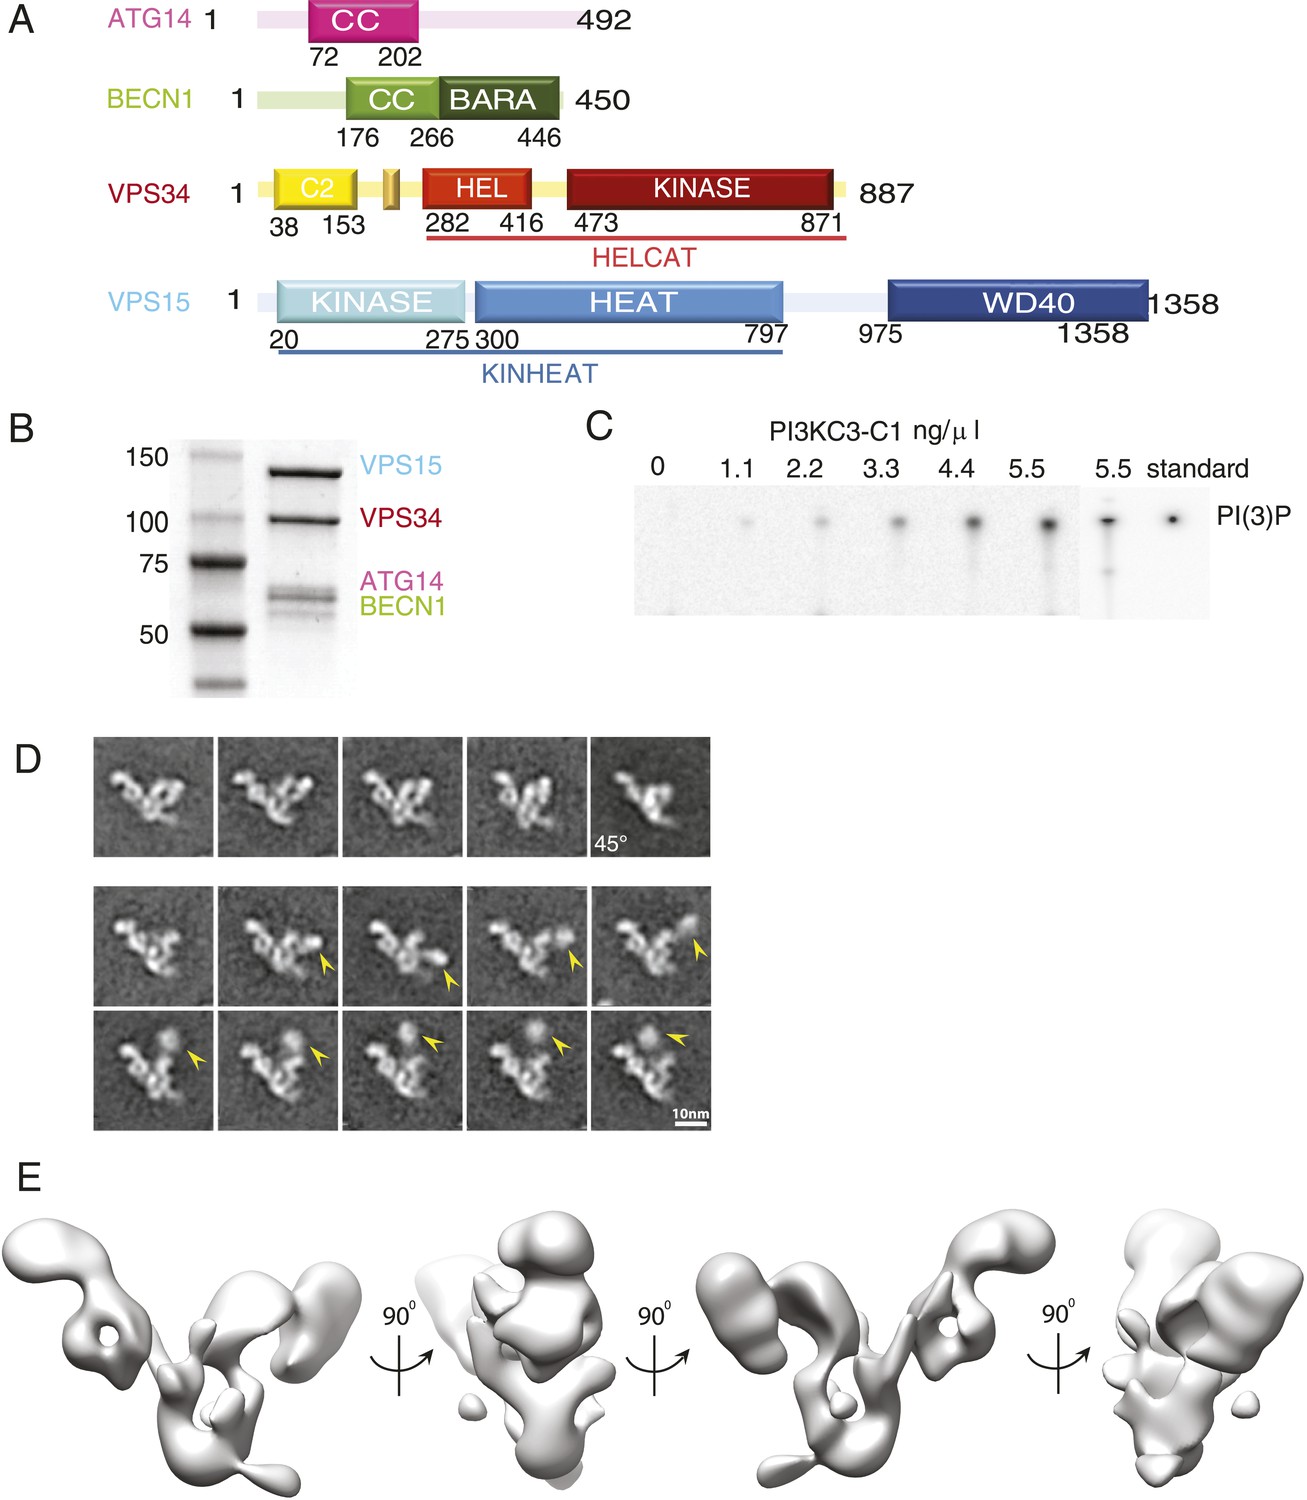
Reconstitution and 3D reconstruction of the PI3KC3-C1 complex.
(A) Domain structures of the four subunits of PI3KC3-C1. The small unlabeled yellow box between VPS34 C2 and helical domains is the CHIL motif, described below. (B) Purification of PI3KC3-C1. Coomassie-stained SDS-PAGE gel of purified PI3KC3-C1. (C) Thin-layer chromatography of radiolabeled PI(3)P generated by PI3KC3-C1 from PI and [γ-32 P] ATP. (D) Reference-free class averages of PI3KC3-C1, each containing ∼200 particles. The first row represents particles that were selected for the 3D reconstruction. The lower two rows represent particles excluded from the 3D reconstruction, the arrowhead indicating the position of a density dislodged from the main part of the complex. All class averages shown are calculated from data acquired on untilted grids, except the top right class average which is from 45° tilt. (E) 3D reconstruction calculated from ∼39,000 particles in four orientations and displayed at a threshold determined from subsequent docking analyses.
Figure 2
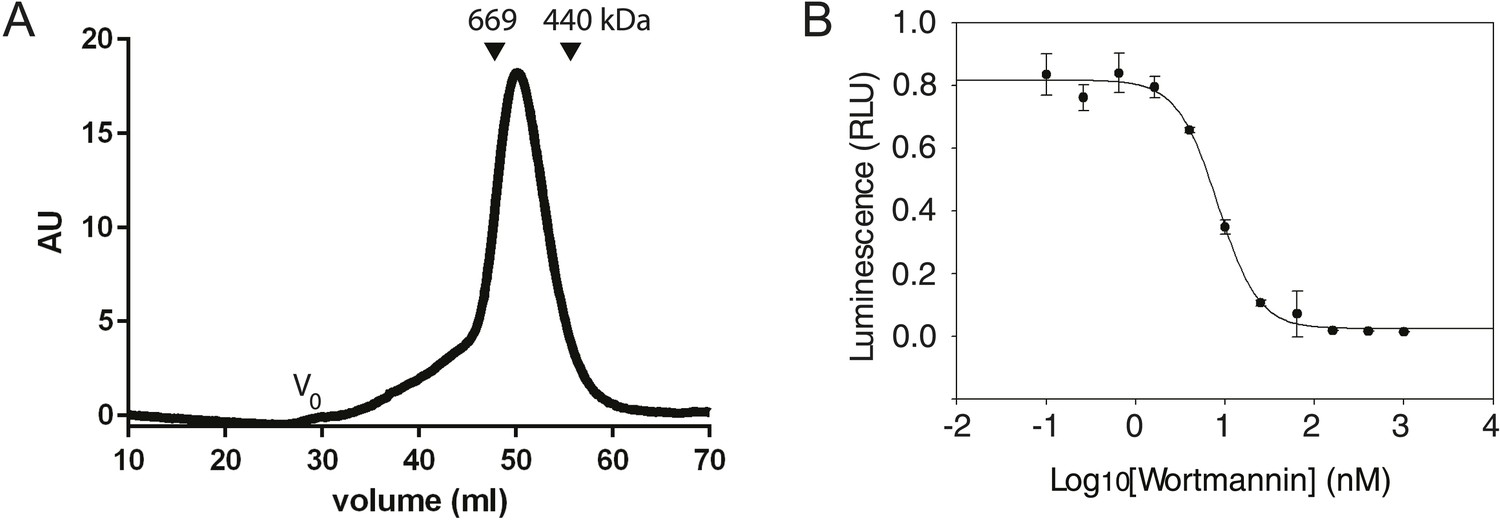
Characterization of the PI3KC3-C1 complex.
(A) Size-exclusion chromatography of PI3KC3-C1 showing that the complex elutes as a single peak well separated from the void volume (Vo). (B) ATP hydrolysis by PI3KC3-C1 is inhibited by wortmannin. RLU, relative luminescence units × 106.
Figure 3
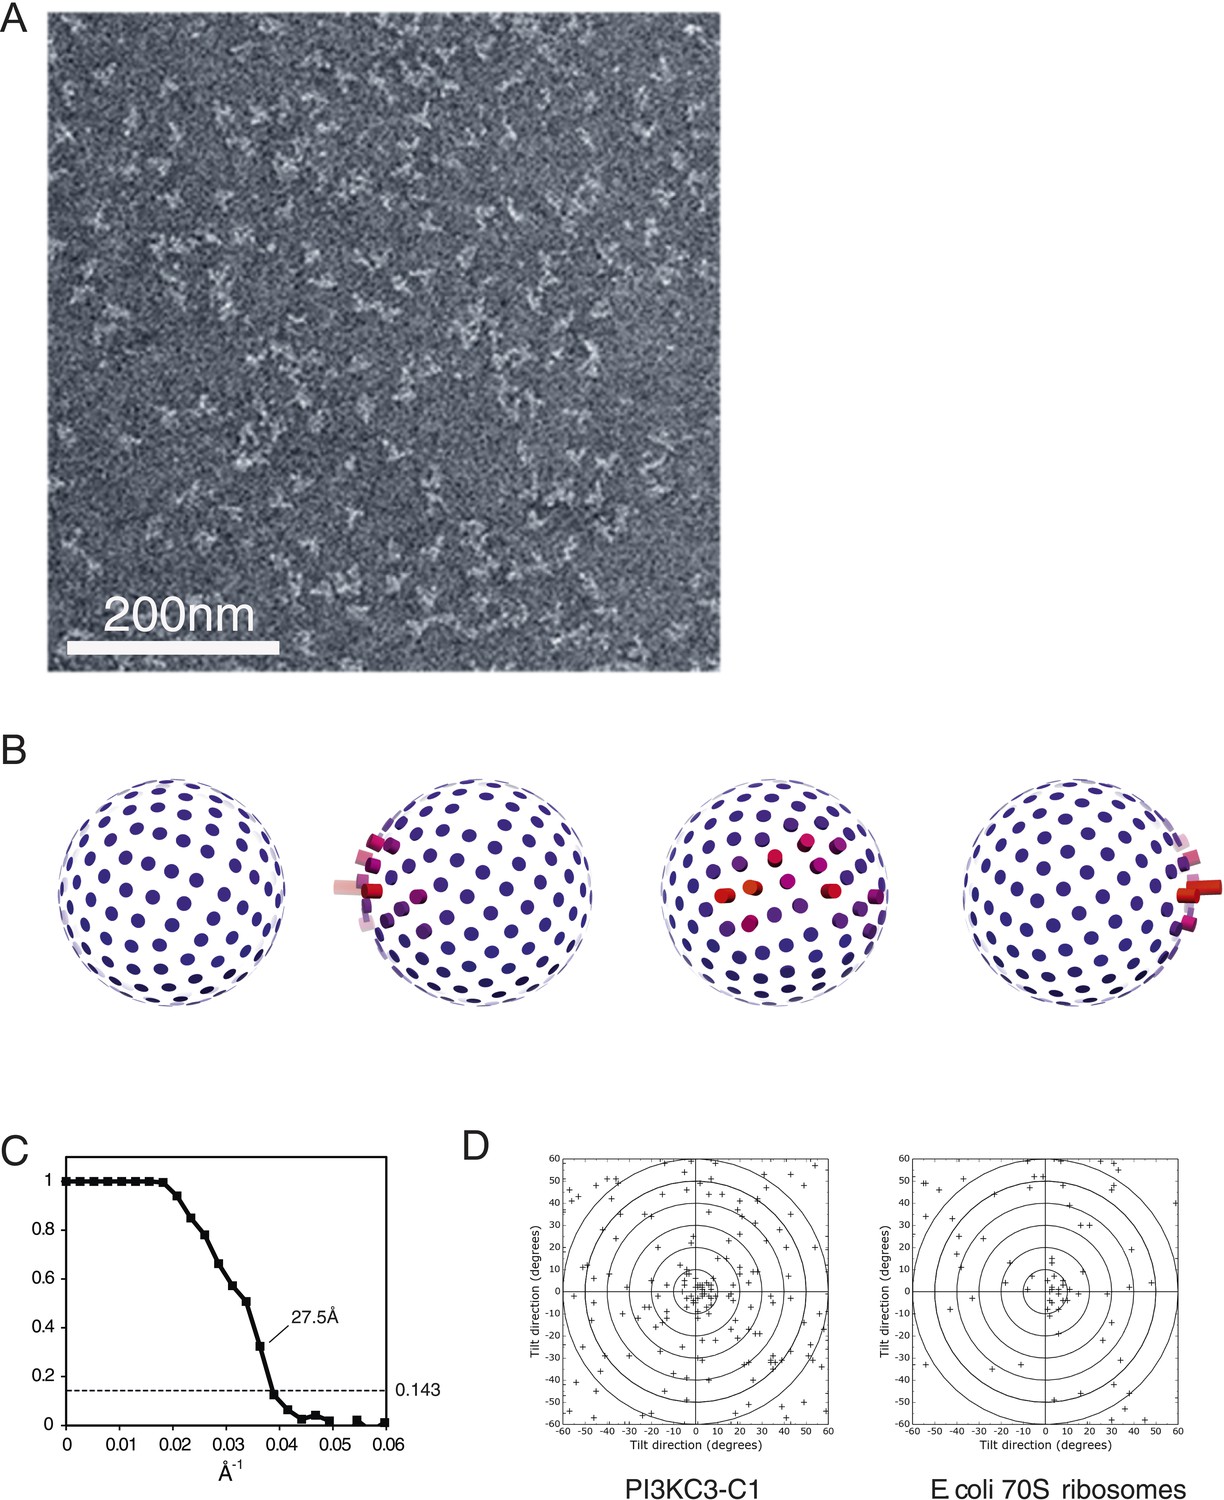
Electron microscopy of PI3KC3-C1.
(A) Representative unprocessed micrograph of PI3KC3-C1. (B) Euler angle distribution of particles used for the 3D reconstruction shown in Figure 1E. The views are the same as those shown in Figure 1E. Long/red bars mean many particles contributing to the view along that bar. (C) Gold-standard Fourier shell correlation (FSC) plot of the 3D reconstruction shown in Figure 1E. (D) Tilt-pair analysis to validate the absolute hand of the 3D reconstruction shown in Figure 1E. Plots calculated from image pairs acquired at 0° and 15° for PI3KC3-C1 (left panel) and as control for E. coli 70S ribosomes (right panel). The ribosome plot was calculated using a previously published map deposited in EMDB with accession code EMD-1849 (Agirrezabala et al., 2011).
Figure 4
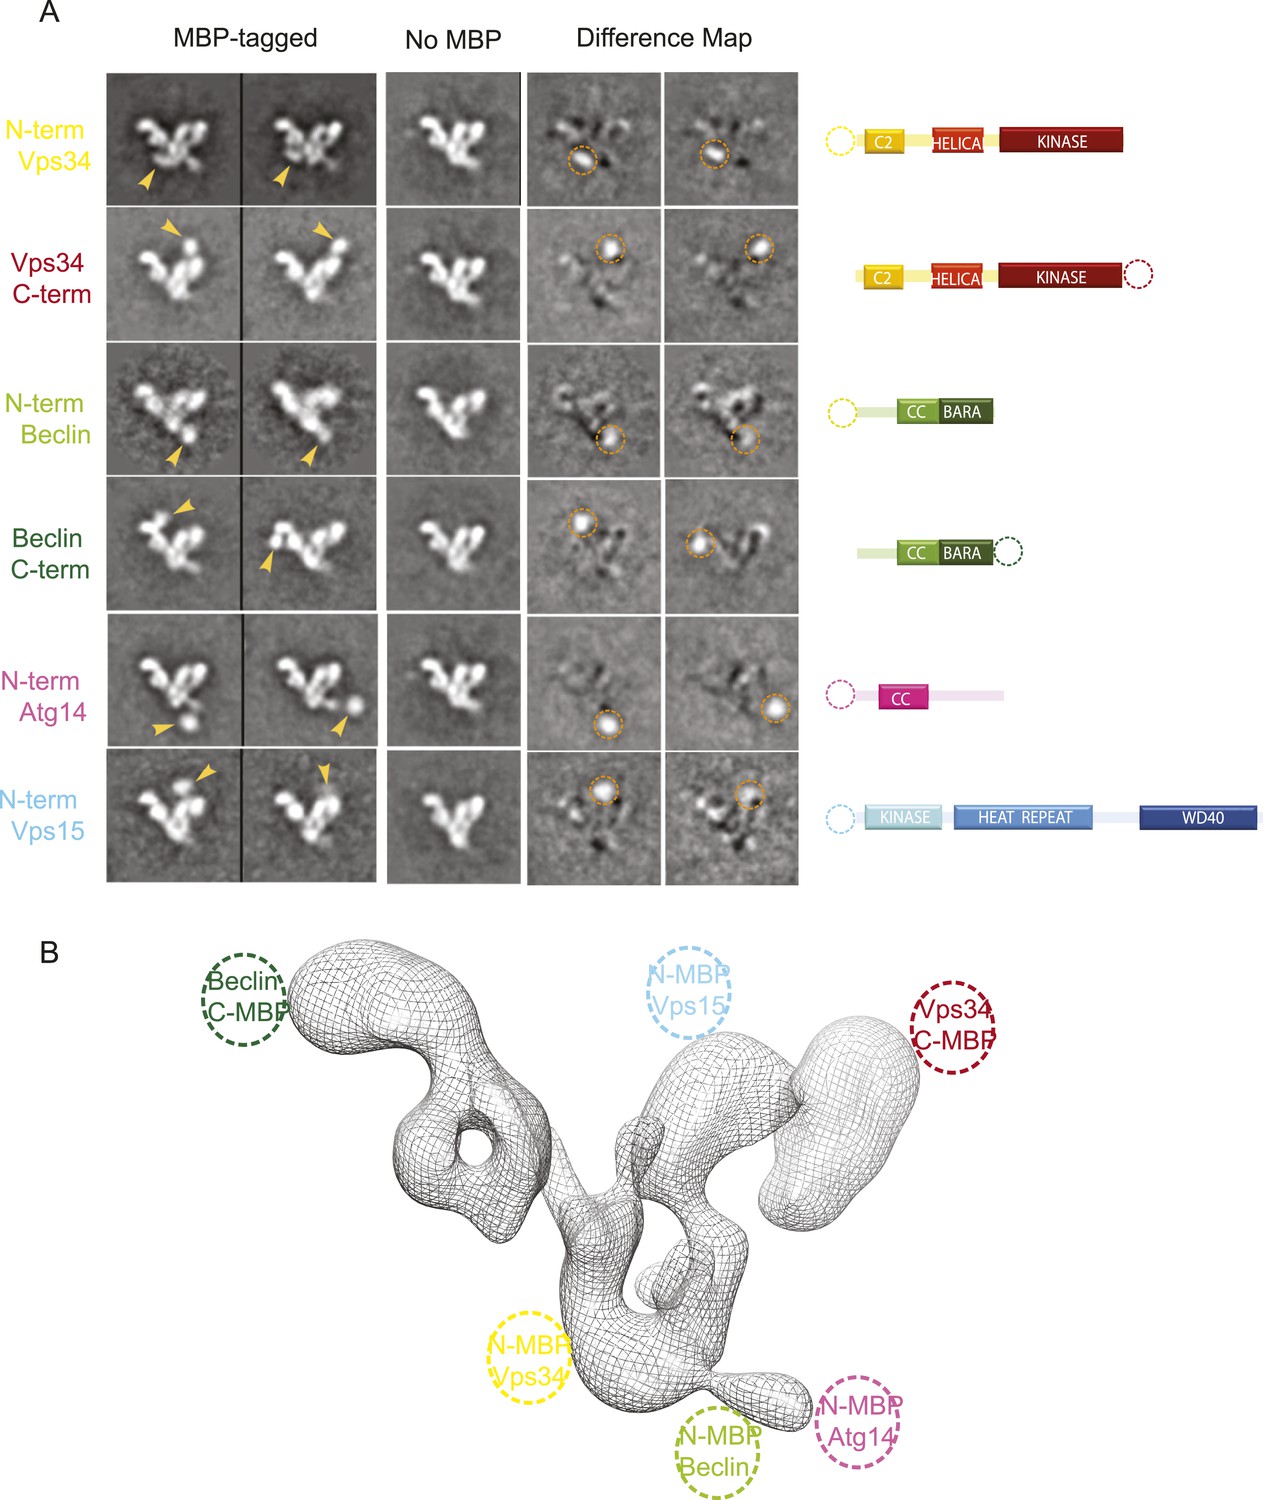
MBP-tagging identifies PI3KC3-C1 subunits.
(A) Six different MBP-tagged versions of the complex were used to identify the position of the different PI3KC3-C1 subunits. A cartoon diagram indicating the position of the MBP tags is shown on the right. The two left columns show the reference-free 2D class averages of the MBP-labeled samples and arrowhead highlights the MBP tag position. The middle column shows the corresponding class for the unlabeled sample. Two right columns show the difference map calculated by subtracting the unlabeled reference class from the labeled and the dotted circle represents the MBP density. (B) 3D reconstruction of the PI3KC3-C1 complex highlighting the position of the six MBP tags used for domain mapping.
Figure 5
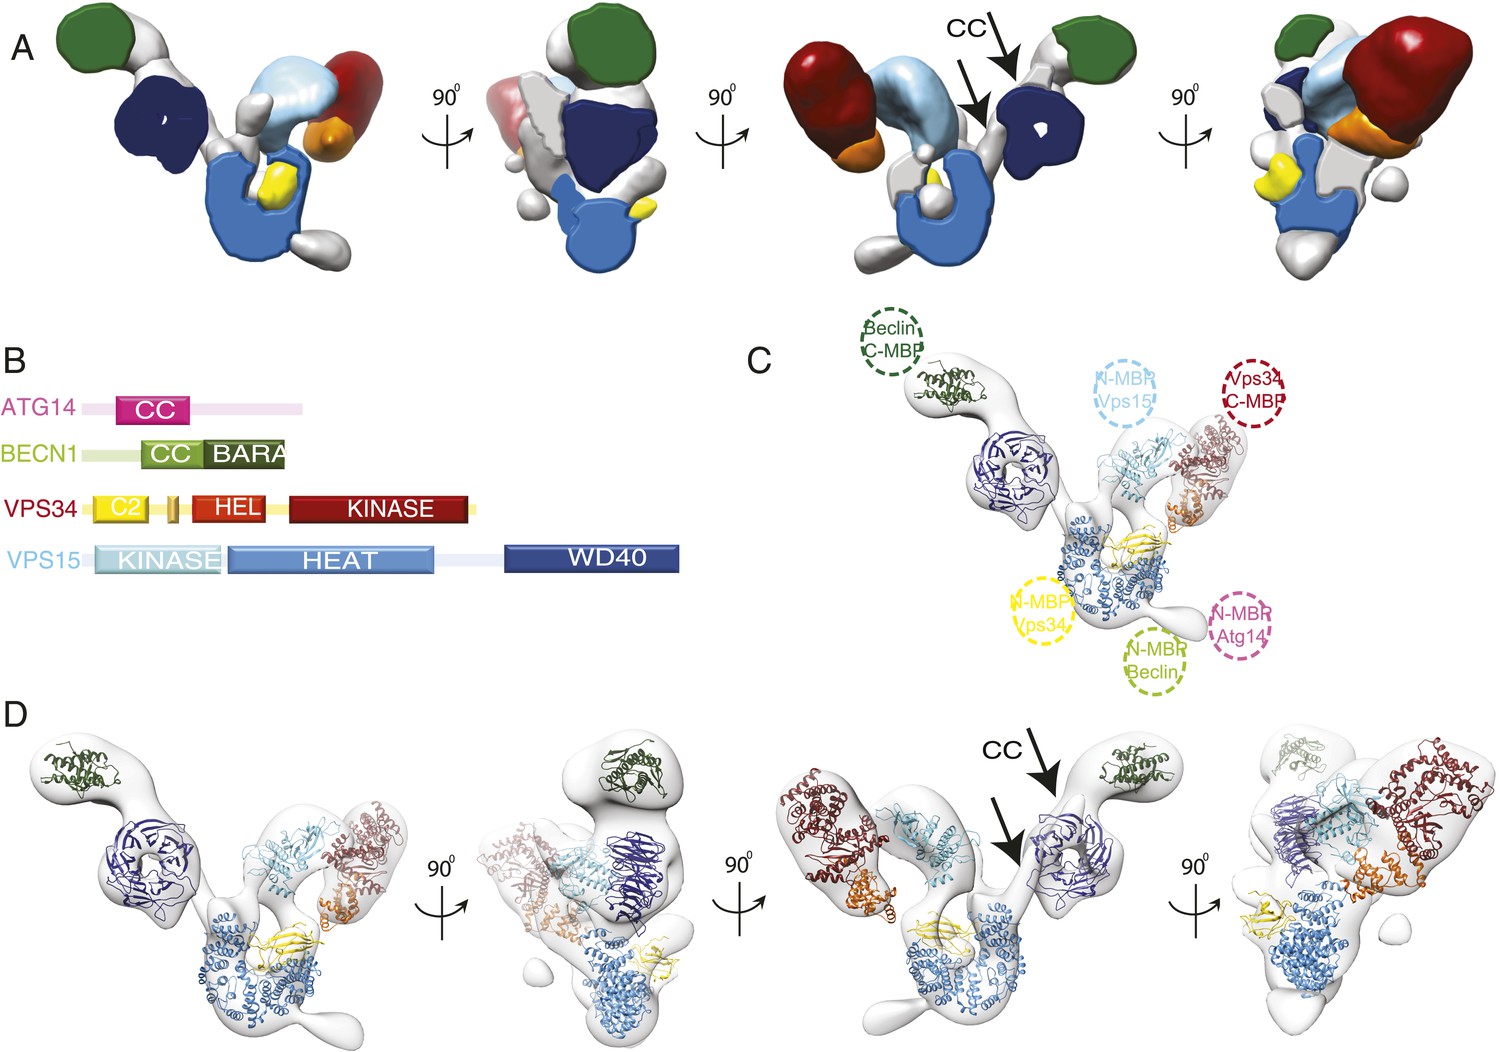
Subunit architecture of PI3KC3-C1.
(A) Segmented volume representation of the 3D reconstruction highlighting the different domains of the complex colored as shown in (B). Arrows indicate regions assigned to the BECN1-ATG14 coiled coil. (B) Domain structures of the four subunits of PI3KC3-C1. (C) 3D reconstruction of the complex with the docked structures shown in a ribbon representation. The MBP label positions are represented as dotted circles. (D) 3D reconstruction of the complex with the docked structures in ribbon representation in different rotations.
Figure 6
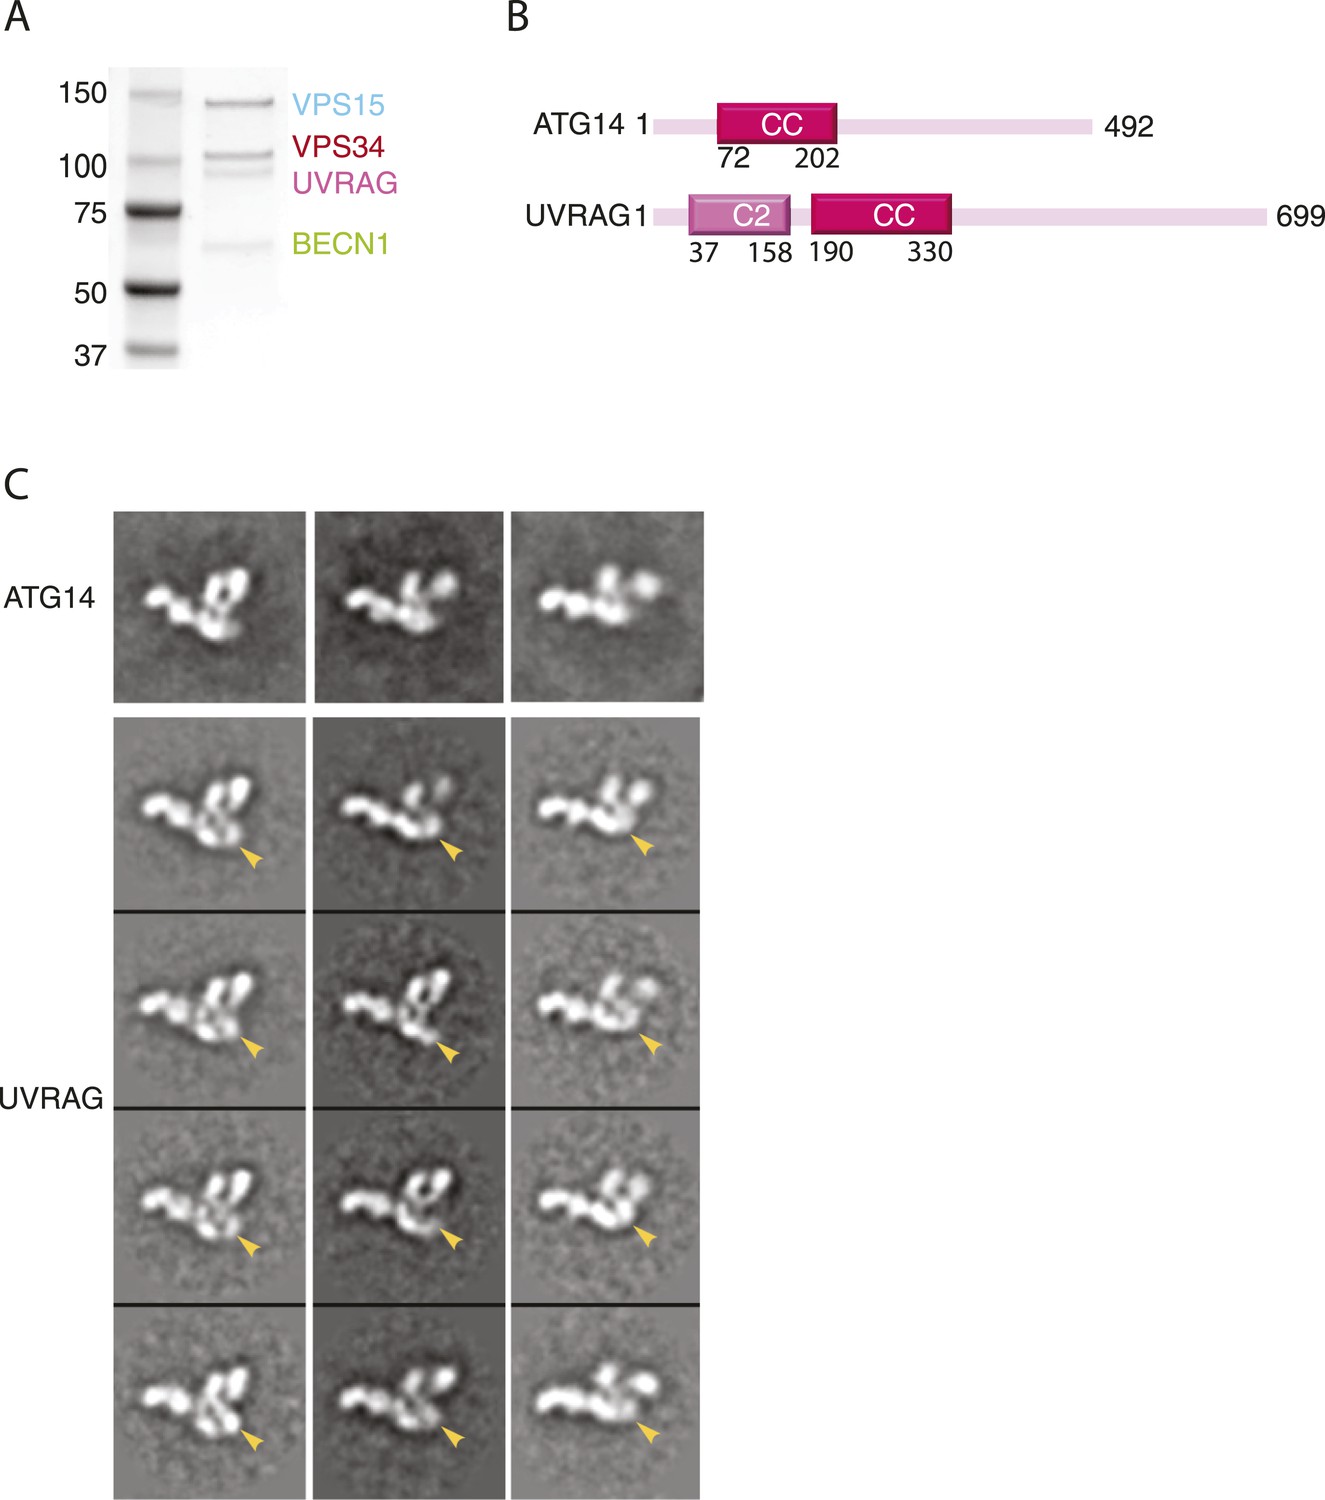
Reconstitution and EM analysis of PI3KC3-C2.
(A) Purification of PI3KC3-C2. Coomassie-stained SDS-PAGE gel of purified PI3KC3-C2. (B) Domain structures of ATG14 and UVRAG. (C) The top row shows the reference-free 2D class averages for the PI3KC3-C2 complex. The bottom four rows show the corresponding class averages of the PI3KC3-C2 and arrowhead highlights the additional density attributed to the UVRAG C2 domain.
Figure 7
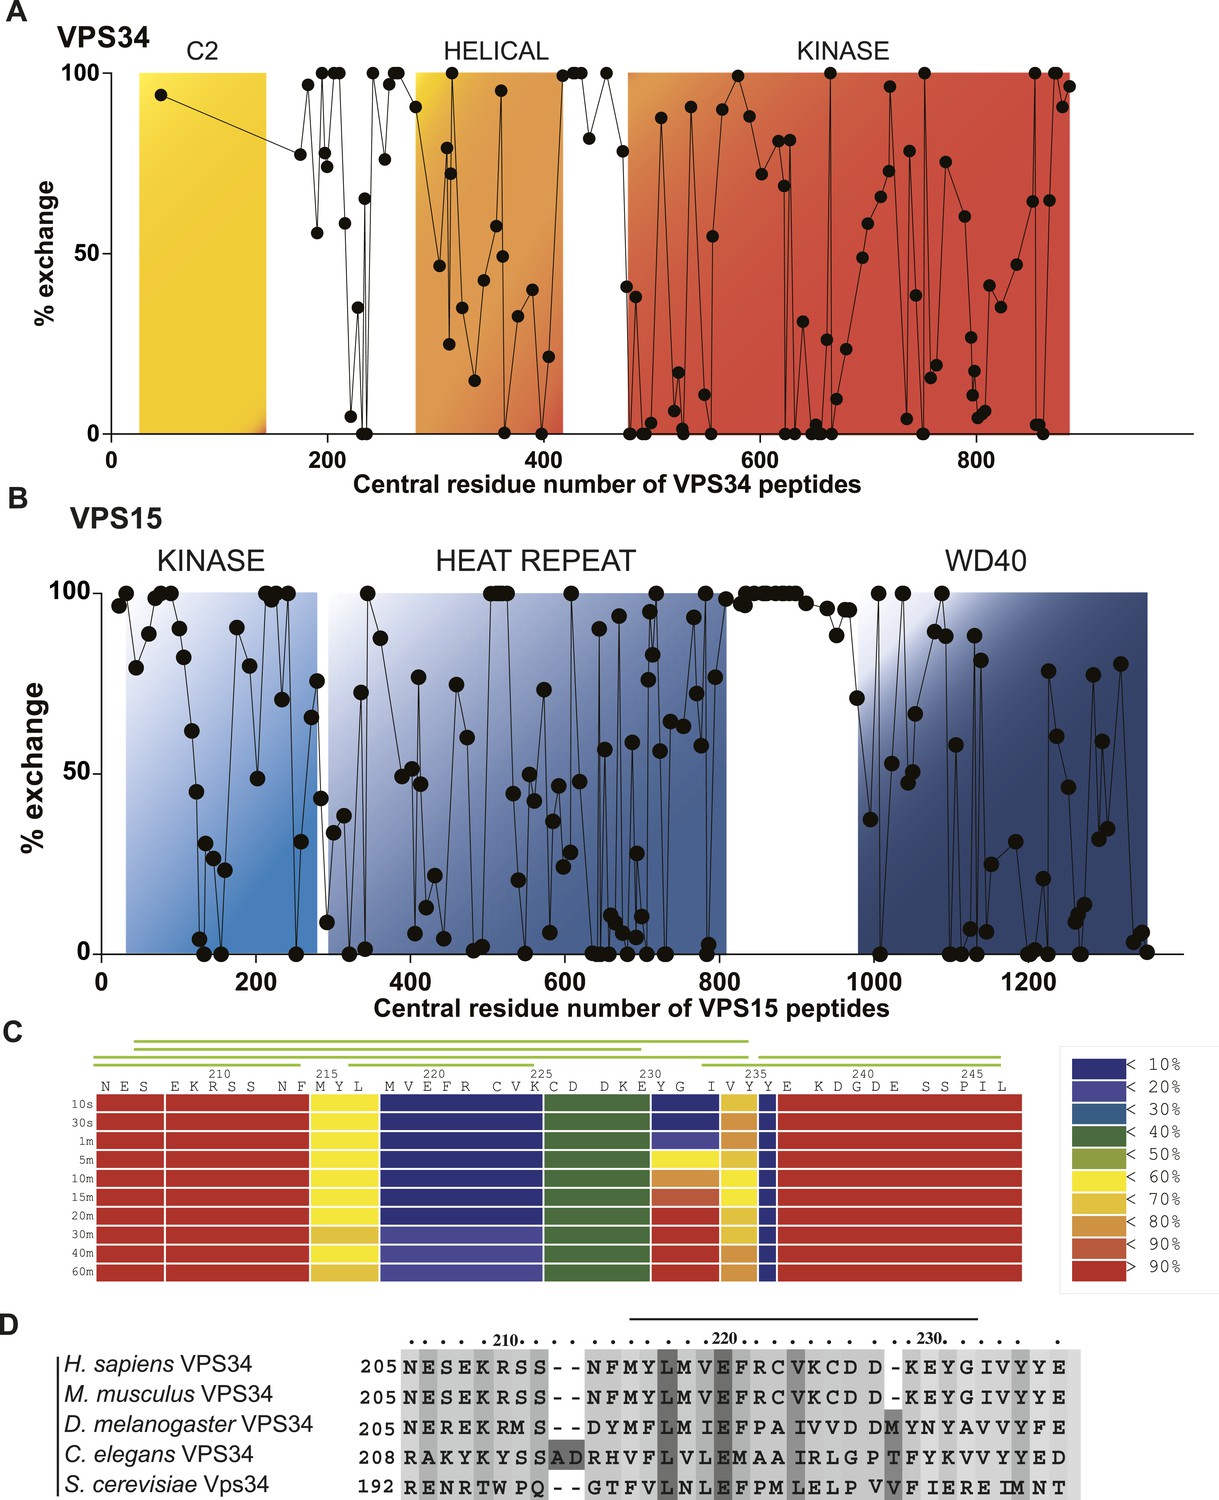
Local dynamics of PI3KC3-C1 assessed by hydrogen–deuterium exchange.
PI3KC3-C1 was incubated for 10 s in D2O. Percent deuterium incorporation plotted vs the central residue number of peptides from VPS34 (A) and VPS15 (B). (C) Percent change in deuteration for VPS34 region 205–247 across various time points (10 s to 1 hr). Green bars above refer to peptide coverage. (D) Conservation of the C2-Helix Internal Linker (CHIL) motif in VPS34.
Figure 8
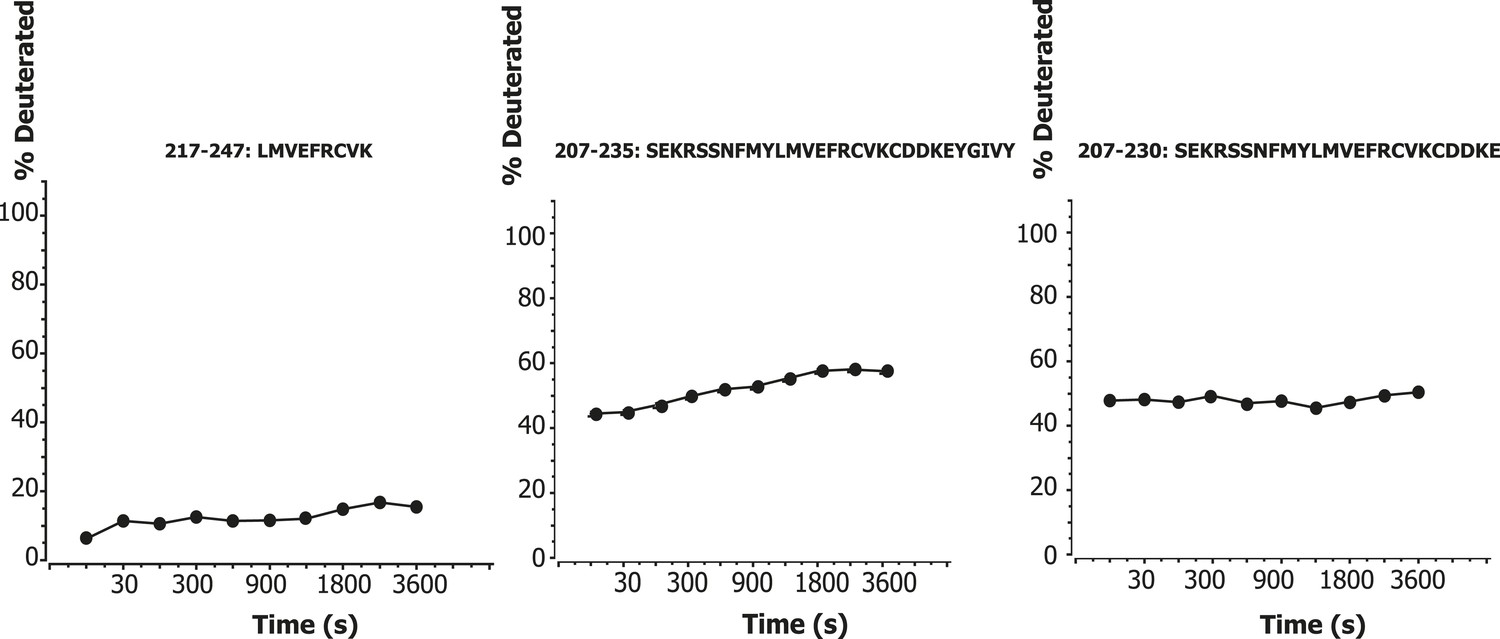
Time course of deuteration of CHIL motif peptides.
Hydrogen–deuterium incorporation as a function of time (10 s to 1 hr) for selected peptides in the CHIL motif of VPS34. The deuteration level of an individual peptide was determined via HDexaminer, and it was assumed that the first residue in a peptide is non-deuterated.
Figure 9
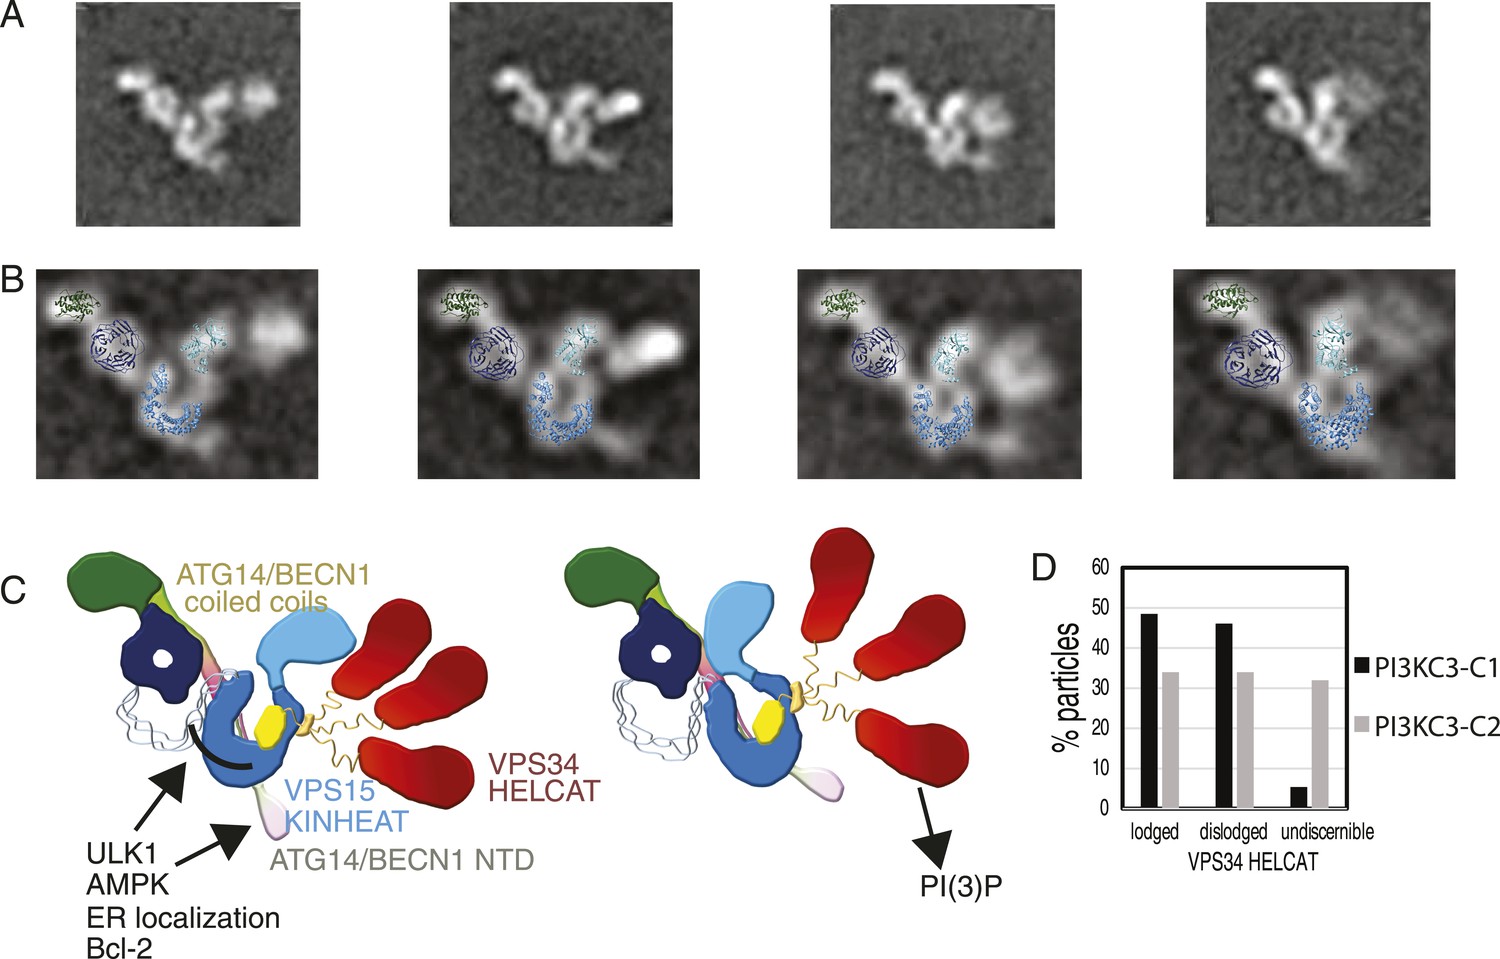
Global conformational changes of PI3KC3-C1.
(A) Representative class averages of the PI3KC3-C1 complex with the VPS15 KINHEAT in the open (far left) to closed (far right) conformation and the dynamic VPS35 HELCAT. (B) Class averages with docked VPS15 KINHEAT, VPS15 WD-40, and BECN1 BARA domains overlaid. (C) Schematic of the PI3KC3-C1 complex showing the open and closed conformations of the Vps15 KINHEAT and the dynamics of the Vps34 HELCAT. The VPS34 C2 domain is yellow and the CHIL motif is orange. (D) Percentage of well-resolved particles sorting into class averages with a lodged, dislodged, or undiscernible VPS34 HELCAT.
Videos
Video 1
Architecture of PI3KC3-C1.
A 360° rotation of the docked model shown in Figure 5D.
Video 2
Conformational changes of PI3KC3-C1.
A sequence of 2D class averages arranged according to the pivoting motion of VPS15, from open to more-closed. The sequence also shows several different lodged and dislodged states of VPS34 HELCAT (in no particular order).
Download links
A two-part list of links to download the article, or parts of the article, in various formats.
Downloads (link to download the article as PDF)
Open citations (links to open the citations from this article in various online reference manager services)
Cite this article (links to download the citations from this article in formats compatible with various reference manager tools)
Architecture and dynamics of the autophagic phosphatidylinositol 3-kinase complex
eLife 3:e05115.
https://doi.org/10.7554/eLife.05115


