Controlling fertilization and cAMP signaling in sperm by optogenetics
- Center of Advanced European Studies and Research, Germany
- Humboldt University of Berlin, Germany
Figures
Figure 1
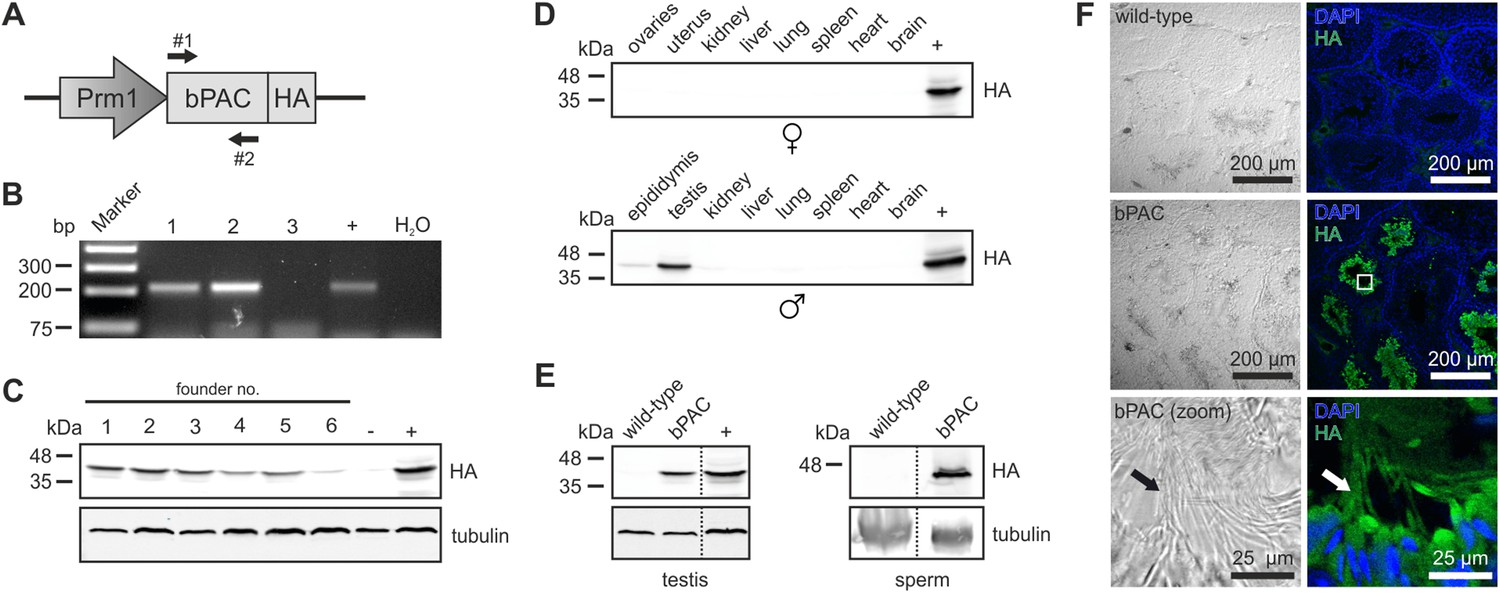
Characterization of the Prm1-bPAC mouse.
(A) Scheme of the Prm1-bPAC targeting vector. Expression of hemagglutinin (HA)-tagged bPAC is driven by the protamine 1 promoter (Prm1); arrows indicate the position of genotyping primers. (B) Genotyping by PCR. In Prm1-bPAC mice, a 213-bp fragment is amplified. The targeting vector served as a positive control (+). (C) Western blot analyzing bPAC-HA expression in testis lysates from different founder lines. Lysates from HEK cells expressing bPAC-HA served as positive control (+), wild-type testis lysates as negative control (−). (D) Western blot analyzing bPAC-HA expression in tissue lysates from male and female Prm1-bPAC mice. (E) Western blot analyzing bPAC-HA expression in testis and sperm. (F) Immunohistochemical analysis of bPAC-HA expression (left panel: transmission, right panel: fluorescence). Pictures at the bottom show a higher magnification (see white box). Sperm flagella are indicated (arrow). Cryosections of mouse testis were probed with anti-HA antibody and fluorescent secondary antibody (green), DNA was stained with DAPI (blue). Loading control for Western blots: β-tubulin.
-
Figure 1—source data 1
The Prm1-bPAC mouse model shows no change in fertility parameters.
Data are given as mean ± s.d.; n = number of experiments.
- https://doi.org/10.7554/eLife.05161.004
Figure 2
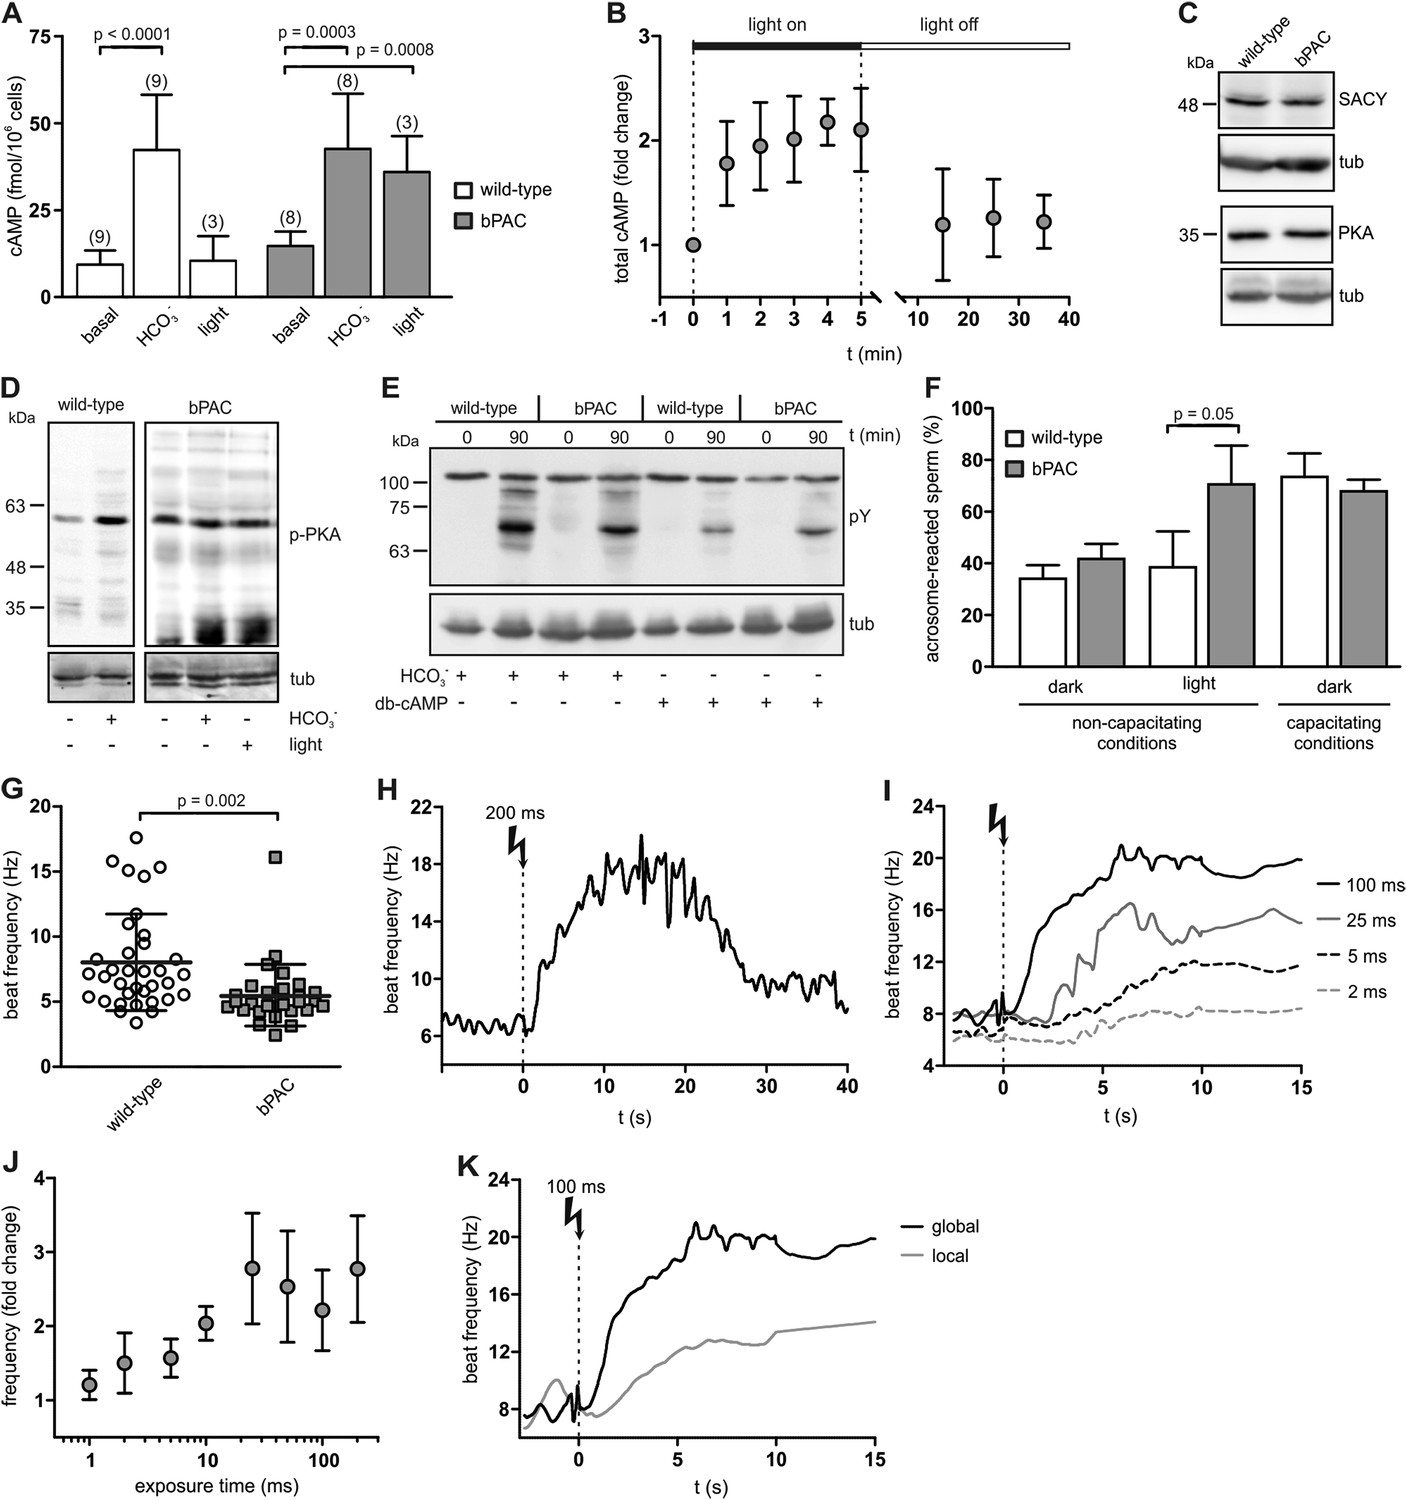
Manipulation of cAMP signaling and sperm motility by light.
(A) Light stimulation of bPAC sperm for 10 min increases cAMP levels. Stimulation of SACY activity with HCO3− (1 min) evokes the same response in wild-type and bPAC sperm. (B) cAMP levels in bPAC sperm during prolonged light stimulation and after switching off the light. (C) Western blot analyzing SACY and PKA expression in wild-type and bPAC sperm. (D) Phosphorylation of PKA targets in wild-type and bPAC sperm detected with an anti-phospho-(Ser/Thr) PKA substrate antibody (p-PKA). Wild-type sperm were stimulated with 25 mM HCO3−, bPAC sperm with HCO3− or light. (E) db-cAMP- (1 mM) and HCO3−-induced tyrosine phosphorylation in wild-type and bPAC sperm detected with an anti-phospho-tyrosine antibody (pY). (F) Acrosome-reaction assay. Percentage of sperm that has undergone the acrosome reaction under non-capacitating conditions (no HCO3−) before and after light-stimulation and under capacitating conditions (25 mM HCO3−). (G) Basal flagellar beat frequency in wild-type and bPAC sperm (individual values and mean ± s.d.). (H, I) Light-induced change in flagellar beat frequency of individual bPAC sperm. (J) Average change in flagellar beat frequency after light stimulation. (K) Change in flagellar beat frequency of bPAC sperm after global or local light stimulation of the flagellum for 100 ms; see also Video 3 and 4. Data are plotted as mean ± s.d.; (n) = number of experiments, n ≥ 5 if not stated otherwise; p values calculated using Student's t test. Loading control for Western blots: β-tubulin.
Figure 3
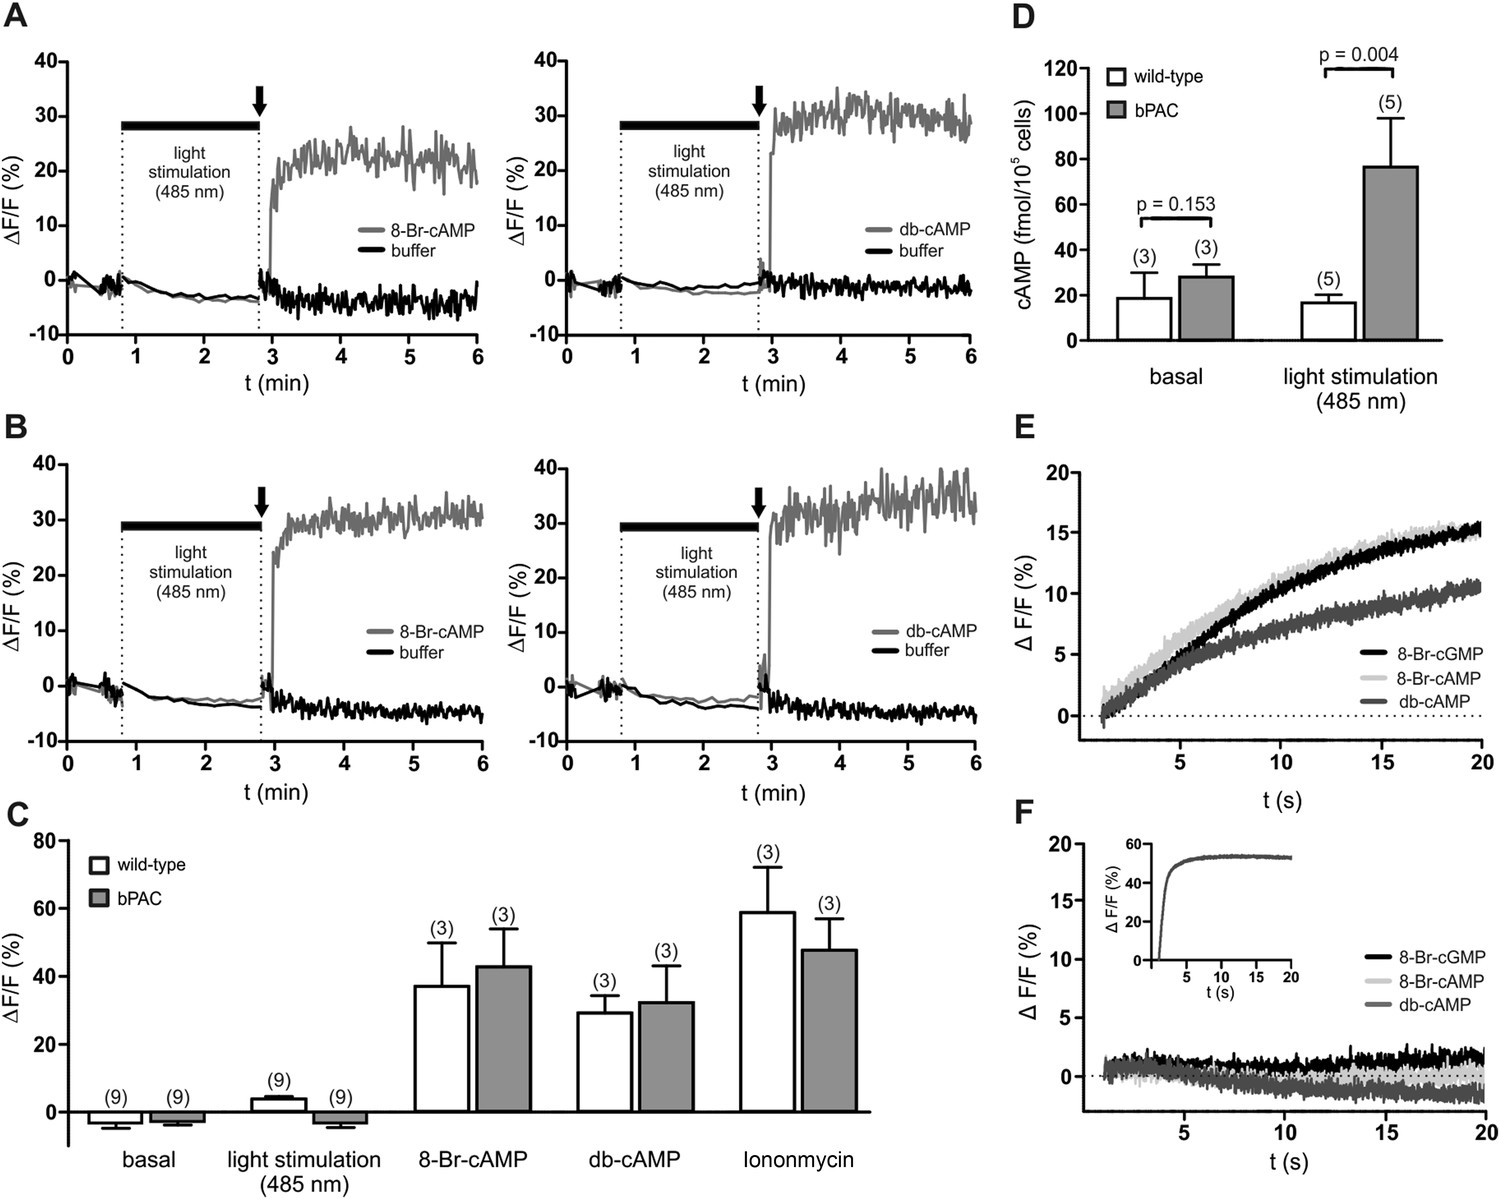
cAMP does not evoke a Ca2+ influx in mouse sperm.
(A, B) Ca2+ signals induced by 8-Br-cAMP (10 mM; left) and db-cAMP (10 mM; right) in wild-type (A) and bPAC sperm (B) loaded with the fluorescent Ca2+ indicator FluoForte. Arrows indicate the addition of compounds. Light stimulation does not evoke a Ca2+ signal. Signals were measured in 96 multi-well plates in a fluorescence plate reader. (C) Mean signals evoked by light stimulation, cyclic nucleotide analogs, and ionomycin. (D) Illumination according to the protocol in (A, B) stimulates cAMP synthesis in bPAC sperm. Data are plotted as mean ± s.d.; (n) = number of experiments; p values calculated using Student's t test. (E, F) Ca2+ signals of capacitated sperm induced by cyclic nucleotide analogs (10 mM) in wild-type (E) and CatSper-null (F) sperm loaded with the fluorescent Ca2+ indicator Cal-520 in a stopped-flow device. Inset in (F): ionomycin control (2 µM).
Figure 4
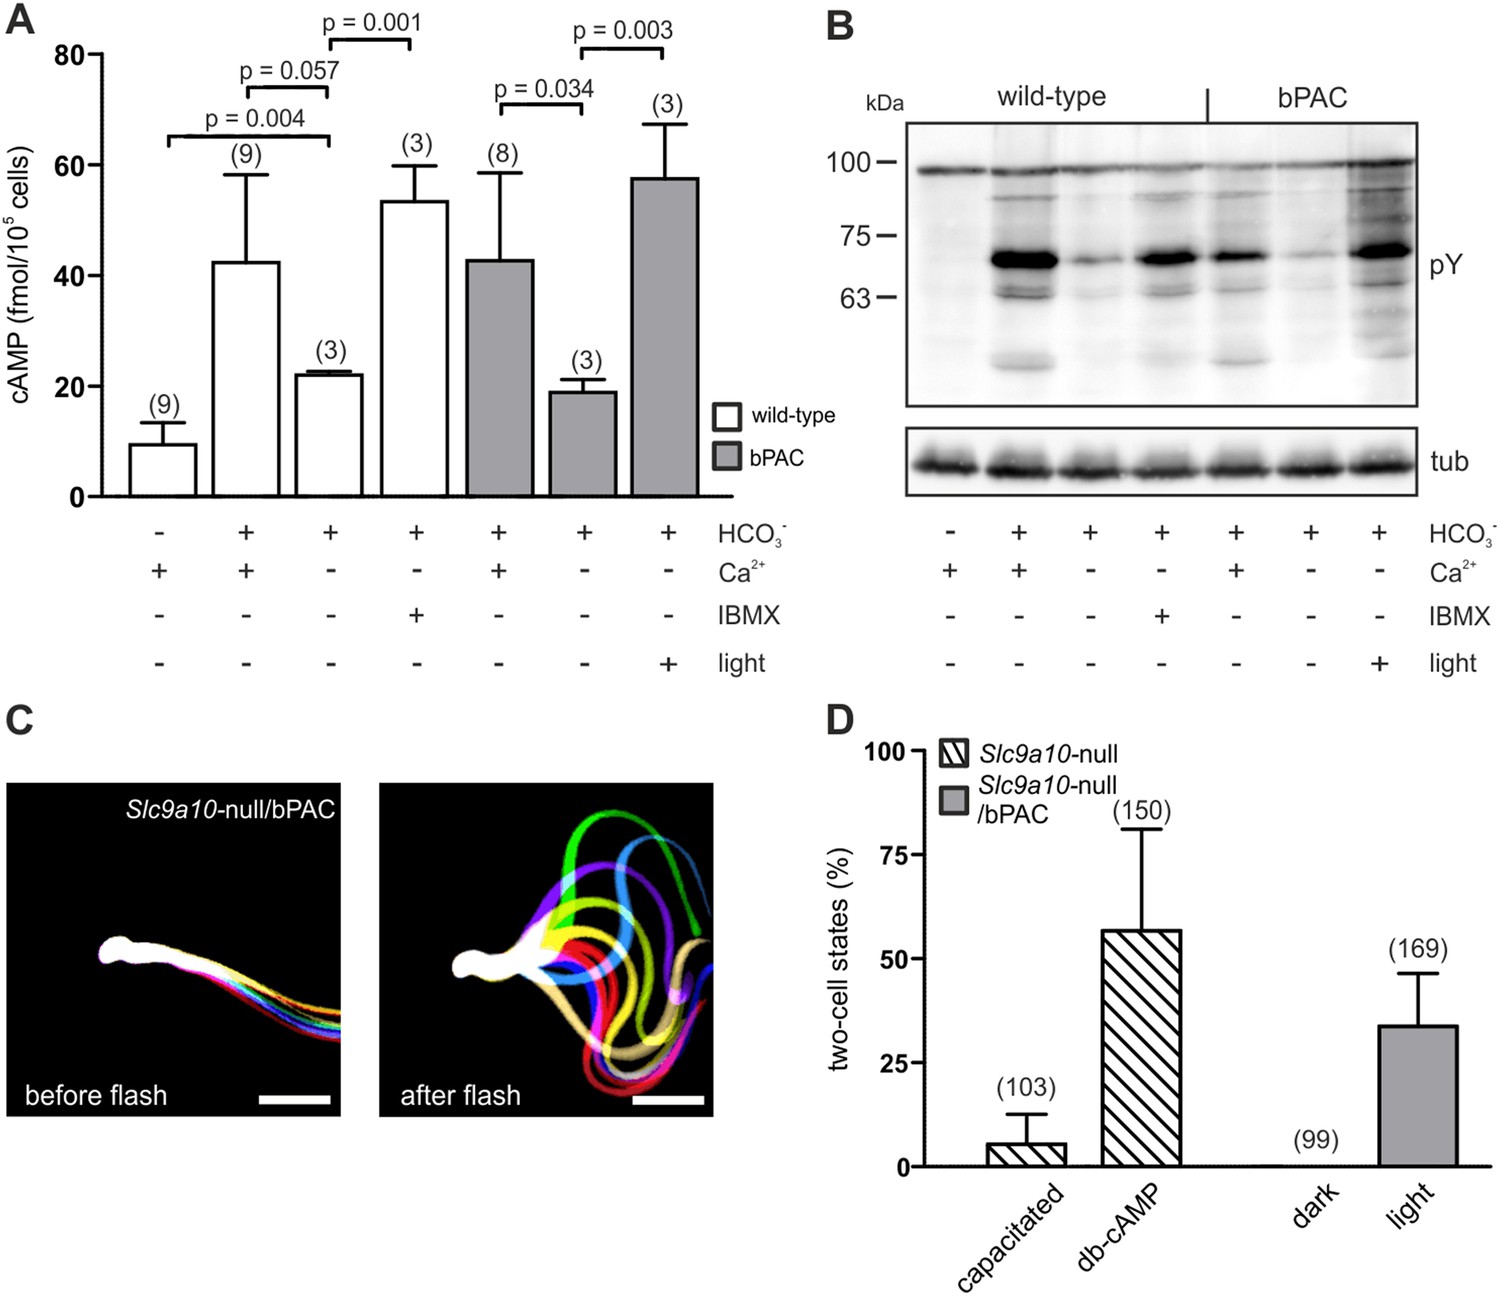
bPAC restores fertility in mice lacking functional SACY.
(A) Nominally Ca2+-free medium attenuates HCO3−-induced cAMP synthesis by SACY in wild-type and bPAC sperm. Inhibition of phosphodiesterases by IBMX in wild-type sperm and light stimulation in bPAC sperm increases cAMP levels without extracellular Ca2+. Data are plotted as mean ± s.d.; (n) = number of experiments; p values calculated using Student's t test. (B) In the absence of extracellular Ca2+, HCO3−-induced tyrosine phosphorylation (pY) is strongly attenuated. In bPAC sperm, light stimulation is sufficient to restore tyrosine phosphorylation. (C) Light stimulation restores flagellar beating of Slc9a10-null/bPAC sperm. Flagellar waveform of Slc9a10-null/bPAC sperm before (left) and after light stimulation (right). Successive, aligned, and superimposed images creating a ‘stop-motion’ image, illustrating one flagellar beating cycle. Scale bar: 30 µm. (D) Upon light stimulation, Slc9a10-null/bPAC sperm fertilize oocytes in vitro (mean ± s.d.; (n) = total number of oocytes from three independent experiments).
Videos
Video 1
Wild-type sperm before and after UV flash.
The cell was tethered to the glass surface by lowering the BSA concentration (0.3 mg/ml). The recording was performed using an epifluorescent microscope (IX71; Olympus) equipped with a dark-field condenser and a 10x objective (UPlanFL, NA 0.3; Olympus) and an additional 1.6× lenses. Frames were acquired at 200 fps using a CMOS camera (Dimax; PCO). Stimulation with UV light for 200 ms was achieved using a UV LED. For clarity, the video is played with 100 fps (half original speed).
Video 2
bPAC sperm before and after UV flash.
The recording was performed as described for Video 1.
Video 3
Local illumination of bPAC sperm.
The recording was performed as described for Video 1 using local illumination of the sperm flagellum for 100 ms; the video is played with 100 fps (half of the original speed). In this setting, the light flash is not visible and is, therefore, visualized with a circle. The analysis of the beat frequency is presented in Figure 2K.
Video 4
Local illumination of bPAC sperm.
Video 3 shown at higher intensity for the frames containing the light flash. This allows to visualize the light flash. The profile of the light flash is indicated in an inset. For clarity, the video speed was reduced to 10% of the frames containing the light flash.
Video 5
Slc9a10-null/bPAC sperm before and after UV flash.
The recording was performed as described for Video 1, but without the additional 1.6× magnification, an acquisition frequency of 90 fps, and 500 ms UV stimulation. The video is shown in real time.
Download links
A two-part list of links to download the article, or parts of the article, in various formats.
Downloads (link to download the article as PDF)
Open citations (links to open the citations from this article in various online reference manager services)
Cite this article (links to download the citations from this article in formats compatible with various reference manager tools)
Controlling fertilization and cAMP signaling in sperm by optogenetics
eLife 4:e05161.
https://doi.org/10.7554/eLife.05161


