Eye morphogenesis driven by epithelial flow into the optic cup facilitated by modulation of bone morphogenetic protein
Abstract
The hemispheric, bi-layered optic cup forms from an oval optic vesicle during early vertebrate eye development through major morphological transformations. The overall basal surface, facing the developing lens, is increasing, while, at the same time, the space basally occupied by individual cells is decreasing. This cannot be explained by the classical view of eye development. Using zebrafish (Danio rerio) as a model, we show that the lens-averted epithelium functions as a reservoir that contributes to the growing neuroretina through epithelial flow around the distal rims of the optic cup. We propose that this flow couples morphogenesis and retinal determination. Our 4D data indicate that future stem cells flow from their origin in the lens-averted domain of the optic vesicle to their destination in the ciliary marginal zone. BMP-mediated inhibition of the flow results in ectopic neuroretina in the RPE domain. Ultimately the ventral fissure fails to close resulting in coloboma.
https://doi.org/10.7554/eLife.05216.001eLife digest
The eye is our most important organ for sensing and recognizing our environment. In humans and other vertebrates, the eye forms from an outgrowth of the brain as the embryo develops. This outgrowth is called the optic vesicle and it is rapidly transformed into a cup-shaped structure known as the optic cup. Defects in this process prevent the optic cup from closing completely, which leads to a severe condition called Coloboma—one of the most frequent causes of blindness in children.
The optic cup has two distinct layers: the inside layer—known as the neuroretina—contains light sensitive cells and is surrounded by the other layer called the pigmented epithelium. It is thought that the neural retina is made from cells from the side of the optic vesicle that faces the lens, and the pigmented epithelium is formed by cells from the other side of the vesicle. This is a plausible explanation and is well accepted, but it cannot explain how the neuroretina can become five times larger as the cup forms.
Heermann et al. addressed this problem by using four-dimensional in vivo microscopy to follow individual cells as the optic cup forms in living zebrafish embryos. The experiments show that the neuroretina is made of cells from both sides of the optic vesicle. Cells from the back of the optic vesicle (furthest away from the lens) join the rest of the cells by moving around the outside rim of the cup.
Further experiments found that a signaling molecule called BMP—which is crucial to the normal development of the eye—controls the flow of cells around the developing optic cup. This factor needs to be carefully controlled during the development of the eye; when BMP activity was artificially increased, the flow of cells stopped, resulting in neuroretinal tissue developing in the wrong place (in the outer layer of the optic cup).
The experiments also reveal that the stem cells in the retina—which divide to produce new cells throughout the life of the zebrafish—originate from two distinct areas in the optic vesicle.
Heermann et al.'s findings challenge the textbook model of eye development by revealing that cells from both sides of the optic vesicle contribute to the neuroretina and that retinal stem cells originate from a specific place in the developing eye. A future challenge will be to understand how the movement of the cells into the neuroretina is coordinated to make a perfectly shaped eye.
https://doi.org/10.7554/eLife.05216.002Main Text
The bi-layered optic vesicles of vertebrates are formed through a bilateral evagination of the late prosencephalon. In teleosts, this process is driven by a migration of single cells that undergo a subsequent intercalation into the epithelium of the expanding optic vesicle (Rembold et al., 2006, England et al., 2006, Sinn and Wittbrodt, 2013, Ivanovitch et al., 2013). The oval optic vesicle develops into a hemispheric bi-layered optic cup through a process that involves major morphological transformations. A long-held view of this process proposes that the lens-averted epithelium of the optic vesicle differentiates into the retinal pigmented epithelium (RPE), while the epithelium facing the lens gives rise to the neuroretina, which subsequently bends around the developing lens (Chow and Lang, 2001; Fuhrmann, 2010; Walls, 1942). This neuroepithelial bending is driven by a basal constriction of lens-facing retinal progenitor cells (RPC) (Martinez-Morales et al., 2009) (Bogdanović et al., 2012), which ultimately reduces the space occupied by an individual RPC at the basal surface. However, we observed that this is accompanied by a 4.7-fold increase in the overall basal optic cup surface area (Figure 1A–C). To identify the cellular origin of this massive increase, we performed in vivo time-lapse microscopy in zebrafish at the corresponding stages, starting at 16.5 hpf (Figure 1D–L, Video 1), in a transgenic line expressing a membrane-coupled GFP in retinal stem and progenitor cells (Rx2::GFPcaax).

Neuroretinal surface increases during optic cup formation by epithelial flow.
(A) Scheme showing the orientation of the pictures presented in B–L. (B) Basal neuroretinal surface increases from early to late optic cup stage (dashed yellow lines). (C) Basal neuroretinal surface was measured in 3D (superimposed orange lines), although RPCs undergo basal constriction during optic cup formation, the surface increases 4.7 fold from early to late optic cup stage, (D–L) transition from optic vesicle to optic cup over time, shown at a ventral (D–F), a central (G–I), and a dorsal (J–L) level. The membrane localized GFP is driven by an rx2 promoter (rx2::GFPcaax), which is active in RPCs. The optic vesicle is bi-layered (D, G, J) with a prospective lens-facing (arrows in D and E) and a prospective lens-averted (arrowheads in D, G, J) epithelium, connected to the forebrain by the optic stalk (os in D), at a ventral level both are connected at the distal site (circle in D), at a central level both are connected distally and proximally (circles in G), notably the morphology of the lens-averted epithelium at a dorsal level is different from central and ventral levels (arrowhead in J). Over time at ventral and central levels (D–F and G–I, respectively), the lens-averted epithelium is being integrated into the forming optic cup (arrowheads in D, E, G, H, I and arrow in H). A patch of cells in the lens-averted domain gives rise to the RPE (asterisks in H and arrowhead in J, K), le: developing lens, os: optic stalk, B and D–L were derived from 4D imaging data starting at 16.5 hpf (D, G, J), one focal plane is presented as Video 1, scalebar in B and C = 50 µm.
(related to Figure 1) (control) Optic vesicle to optic cup transition visualized with rx2::GFPcaax (orientation as in Figure 1) (imaging starts at 16.5 hpf, framerate 1/15 min).
https://doi.org/10.7554/eLife.05216.004Strikingly, and in contrast to the former model (Chow and Lang, 2001; Fuhrmann, 2010; Walls, 1942), our analysis shows that almost the entire bi-layered optic vesicle gives rise to the neural retina (Figure 1D–I), with the marked exception of a small lens-averted patch (see below). The majority of the lens-averted epithelium (Figure 1D,G, between arrowheads) serves as a neuro-epithelial reservoir, which eventually is fully integrated into the lens-facing neuro-epithelium (Video 1). This occurs through a sheet-like flow of lens-averted cells into the forming optic cup (Figure 1E,H). This epithelial flow is independent of cell proliferation (Figure 2—figure supplement 1, Video 2) as demonstrated by aphidicolin treatment. The process is highly reminiscent of gastrulation movements and explains the marked increase of the lens-facing basal neuroretinal surface area. Notably, a small domain of the lens-averted epithelium exhibits a different morphology and behavior. As optic cup formation proceeds, this region flattens, enlarges, exhibits the morphological characteristics of RPE, and eventually ceases expressing RX2, a marker for retinal stem and early progenitor cells (Figure 1H, asterisks, Video 3, in between arrows).
(related to Figure 1 and Figure 2—figure supplement 1) Aphidicolin treated embryo. (imaging started at 17 hpf, framerate 1/10 min).
https://doi.org/10.7554/eLife.05216.005(related to Figure 1) (control) Optic vesicle to optic cup transition visualized by H2BGFP RNA into rx2::GFPcaax (orientation as in Figure 2), data derived from same imaging data as Video 4, 3D rendered. Arrows mark the border between future RPE and Neuroretina (imaging starts at 16.5 hpf, framerate 1/10 min).
https://doi.org/10.7554/eLife.05216.006Our data highlight that almost the entire optic vesicle contributes to the formation of the neural retina. This new perspective on optic cup formation raises the question of how the elongated oval optic vesicle is transformed into the hemispheric optic cup. We addressed this by 4D imaging of optic cup formation using a nuclear label (H2BGFP) (Figure 2A). We found, concomitant with lens formation, a prominent epithelial flow around the temporal perimeter of the forming optic cup. An involution of cells from the domain of the retinal pigmented epithelium (RPE) into the domain of the neuroretina had been proposed (Li et al., 2000). Such reorganization of the lens-averted and the lens-facing epithelia, affecting the temporal optic cup, has been subsequently described (Picker et al., 2009) and confirmed (Kwan et al., 2012). It was proposed that such ‘rim movements’ could occur around most of the optic vesicle circumference (Kwan et al., 2012).

Neuroepithelial flow drives morphological changes from optic vesicle to optic cup: the role of the optic fissure and the impact on the forming stem cell domain.
(A) Dorsal view on optic cup development over time visualized by mosaic nuclear GFP (H2BGFP) (data are derived from 4D imaging data started at 16.5 hpf, one optical section is provided as Video 4), while the lens-facing neuroepithelium is starting to engulf the developing lens (asterisk), the lens-averted epithelium is largely integrated into the lens-facing epithelium by flowing around the distal nasal and temporal rims (arrows). A white dotted line marks the border between lens-facing and lens-averted epithelium. (B) Scheme showing the key findings of A, the lens (asterisk) facing epithelium is marked with red bars. The lens-averted epithelium, which over time is integrated into the lens-facing epithelium is marked with green dots (except the cells at the edges are additionally marked with a yellow core). In between the last cells, which are integrated into the optic cup, the RPE will form in the lens averted domain. (C) shows the percentage of movements with a considerable share in dorso-ventral direction for the dorsal, central, and ventral area of the developing eye. In the ventral area of the eye, there is significantly more movement in the dorso-ventral axis, than in the central or dorsal area. (D) scheme demonstrating the optic vesicle to optic cup transition (lateral view). Notably, the morphological change from the elongated oval optic vesicle to the hemispheric optic cup is driven mainly by the ventral regions (arrows mark the orientation of epithelial flow) (C and D).
Our data confirm a flow around the temporal perimeter and additionally demonstrate epithelial flow around the nasal perimeter into the forming optic cup. We uncover that the direction of the epithelial flow primarily establishes two distinct neuroretinal domains (nasal and temporal) separated by the static dorsal and ventral poles of the forming eye (Figure 2D, Figure 3A). We use these poles as dorsal and ventral reference points throughout the manuscript. Importantly, the prominent rotation of the eye cup only occurs after the epithelial flow has ceased (24–36 hpf, Schmitt and Dowling, 1994).

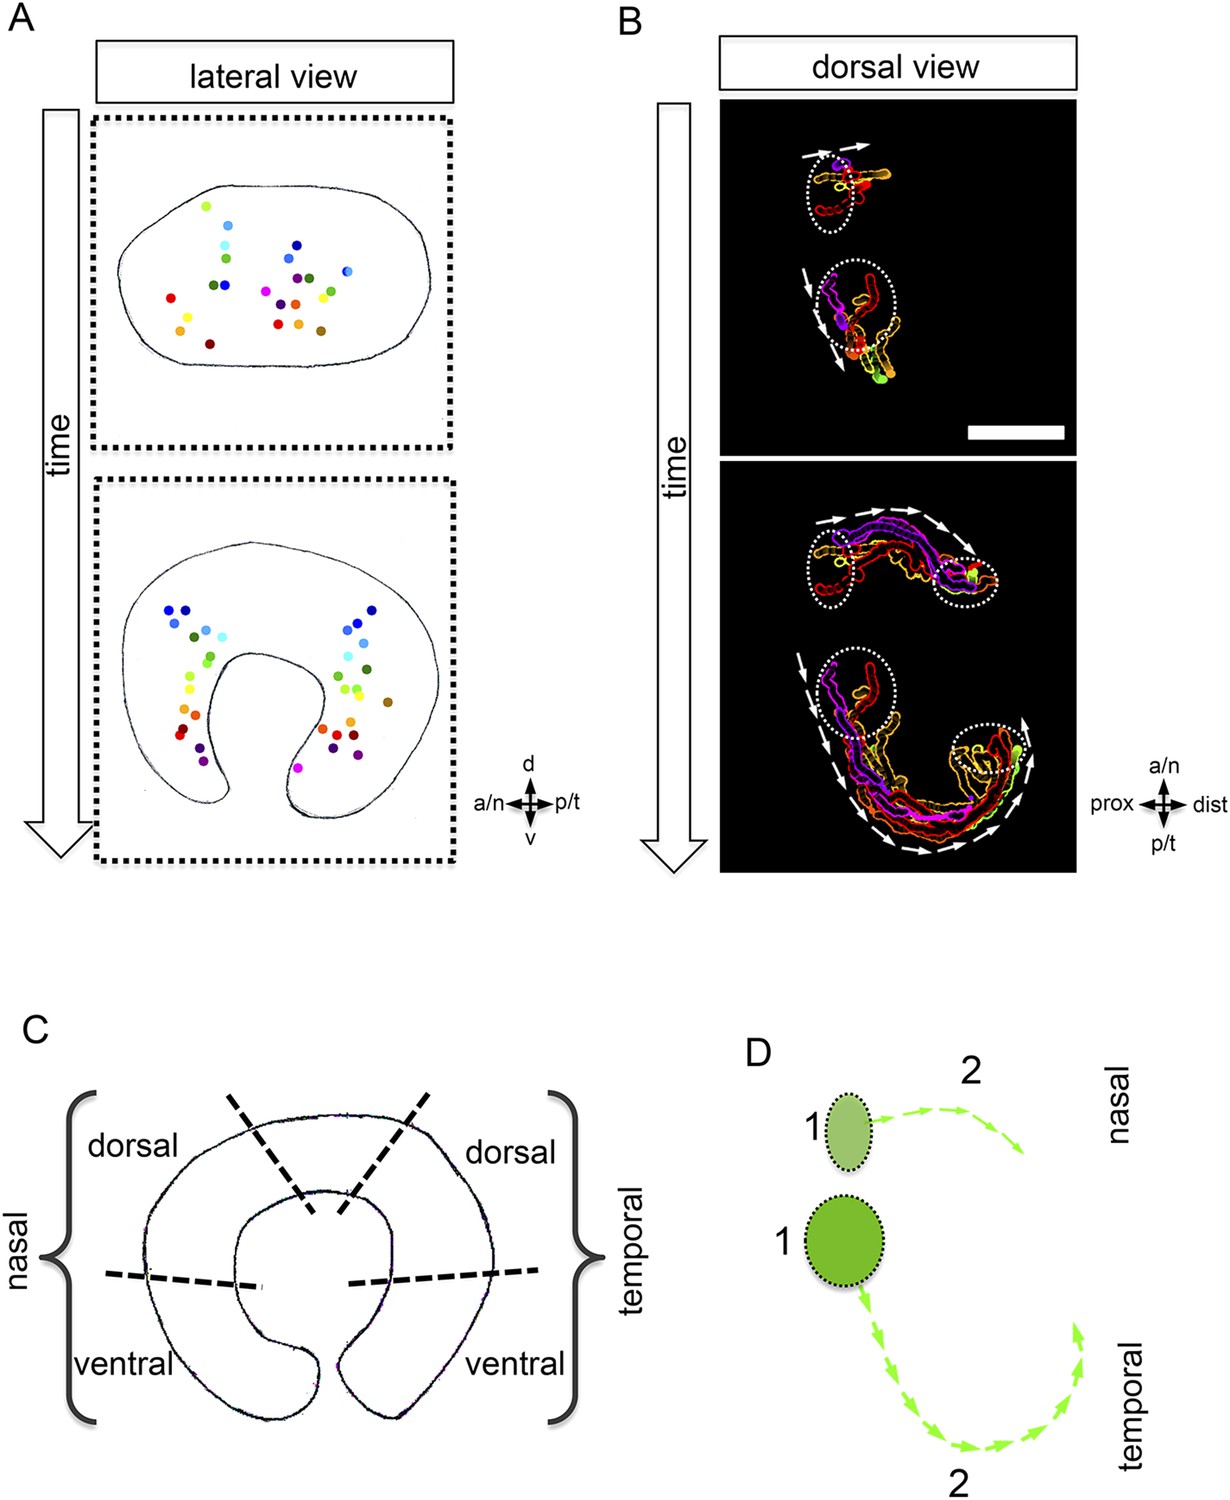
Development of the CMZ and quantification of the flow towards this domain.
(A) scheme of optic cup development (lateral view over time) including the results of nuclear tracking from the presumptive CMZ back in time to the lens-averted epithelium, remarkably two distinct domains became apparent within the lens-averted epithelium as the source for the presumptive CMZ. (B) Establishment of the presumptive CMZ domain (dorsal view), nuclear tracking of cells (maximum projection) from the lens-averted domain (encircled in upper picture) eventually residing in the forming CMZ (additionally encircled in lower picture), scalebar = 50 µm. (C) Scheme showing the optic cup from the lateral side. For quantification four domains were selected, nasal–dorsal, nasal–ventral, temporal–dorsal, and temporal–ventral. Note that the dorsal distal domain is only assembled secondarily and the ventral pole shows the optic fissure. (D) Based on differential effective distance, effective speed, and directionality, the migration distance was divided in two phases in the nasal and temporal domain, respectively.
The prospective RPE remains in the lens-averted domain and expands in conjunction with the bi-furcated flow of the neuroretina from the lens-averted into the lens-facing domain (Figure 2A,B, Video 3). To further address the transformation of the elongated, oval optic vesicle into the hemispheric optic cup, we quantified cellular movements along the dorso-ventral axis. We found that the most prominent movements leading to the extension in the dorsal ventral axis occurred in the ventral domain (Figure 2C). A key step in the formation of the ventral neuroretina is the formation of the optic fissure at the ventral pole of the optic vesicle. Lens-averted epithelium flows through this fissure into the forming optic cup to constitute the ventral neuroepithelium (Figure 2D). Taken together, we present a model of optic cup formation, driven by gastrulation-like epithelial flow from the lens-averted into the lens-facing epithelium of the forming optic cup. The epithelium flows in two domains around the temporal and nasal rim, respectively and through the optic fissure of the forming optic cup. Overall, this has far-reaching implications for different aspects of eye development. One is the establishment of the retinal stem cell niche in the ciliary marginal zone (CMZ) (Centanin et al., 2011), the distal rim of the optic cup/retina.
To address whether the CMZ domain originates from a mixed population of progenitor cells that have been ‘set aside’, or from a predefined coherent domain, we analyzed the transition from optic vesicle to optic cup in 3D over time (4D) (Video 4). By tracking individual cells, we identified the origin of the distal retinal domain, the future CMZ, as two distinct domains (nasal and temporal) within the lens-averted epithelium at the optic vesicle stage (Figure 3A,B, Video 5). Based on tracking information, we noticed distinct phases during the flow from the lens-averted domain towards the CMZ (Figure 3D). Although cells show high motility in an early phase (Figure 3D, 1), the directed flow is established only in a later phase (Figure 3D, 2), in which cells ultimately flow to the rim of the forming optic cup (Figure 3D).
(related to Figure 2) (control) Optic vesicle to optic cup transition visualized by H2BGFP RNA into rx2::GFPcaax (orientation as in Figure 2) (imaging starts at 16.5 hpf, framerate 1/10 min).
https://doi.org/10.7554/eLife.05216.010(related to Figure 2) (control) Optic vesicle to optic cup transition visualized by H2BGFP RNA into rx2::GFPcaax (orientation as in Figure 2), data as in video 4 with tracked cells (maximum projection) to the presumptive CMZ.
https://doi.org/10.7554/eLife.05216.011As indicated above, the dorsal pole of the optic vesicle remains static (Figure 2D). Thus, the presumptive dorsal CMZ domain either originates from the lens-facing neuroretina or, alternatively, is established secondarily at a later time point, like the ventral CMZ in the region of the optic fissure. The identification of lens-averted domains as the source of the future nasal and temporal CMZ is consistent with the hypothesis of a distinct origin of retinal stem cells. Our data support a scenario in which the entire optic vesicle is initially composed of stem cells that at the lens-facing side respond to a signal to take a progenitor fate.
We propose a tight coupling of morphogenesis with cell determination by inductive signals derived from the surface ectoderm to explain the successive spreading of retinal differentiation from the center to the periphery (Sinn and Wittbrodt, 2013). Accordingly, lens-averted stem cells might retain their stem cell fate because they are exposed to that signal at the latest point in time. An alternative hypothesis is that stemness might require an active process at the interface to the RPE; it is also possible that both scenarios are involved. Both scenarios are consistent with the expression pattern of rx2, which is initially found in the entire optic vesicle and subsequently is confined to the CMZ. Strikingly, rx2-positive cells of the CMZ represent multipotent retinal stem cells (Reinhardt, Centanin et al., submitted).
We demonstrated that cell motility and thus tissue fluidity are a prerequisite for neuroretinal flow. These characteristics are likely maintained through signaling, raising the question of which system might be involved. A likely candidate might be BMP, which has been linked to mobility in other tissues during development. In heart jogging, for example, BMP has an ‘antimotogenic’ effect (Veerkamp et al., 2013). BMP signaling is important for various aspects of vertebrate eye development such as the enhancement of RPE and the inhibition of optic cup/neuroretina development (Fuhrmann et al., 2000; Hyer et al., 2003; Müller et al., 2007; Steinfeld et al., 2013), the formation of the dorso-ventral axis (Behesti et al., 2006; Holly et al., 2014; Koshiba-Takeuchi et al., 2000; Sasagawa et al., 2002), and the induction of the optic fissure (Morcillo et al., 2006). Specific regions of the eye also seem to depend on the modulation of BMP signaling by the expression of a BMP antagonist (Sakuta et al., 2001, French et al., 2009).
We analyzed BMP signaling activity by assays based on the phosphorylation of the Smads 1/5/8 and the activation of a BMP signaling reporter (Laux et al., 2011). BMP signaling is mainly elevated in the temporal domain and to a lesser degree in the nasal domain of the optic vesicle (16.5hpf, Figure 4A,B,D,E). At 21.5 hpf BMP signaling is confined to the dorsal pole of the optic cup (Figure 4C,F). The transcriptional BMP sensor is activated with a delay and shows a more confined area of activity (compare Figure 4A–C to Figure 4D–F).

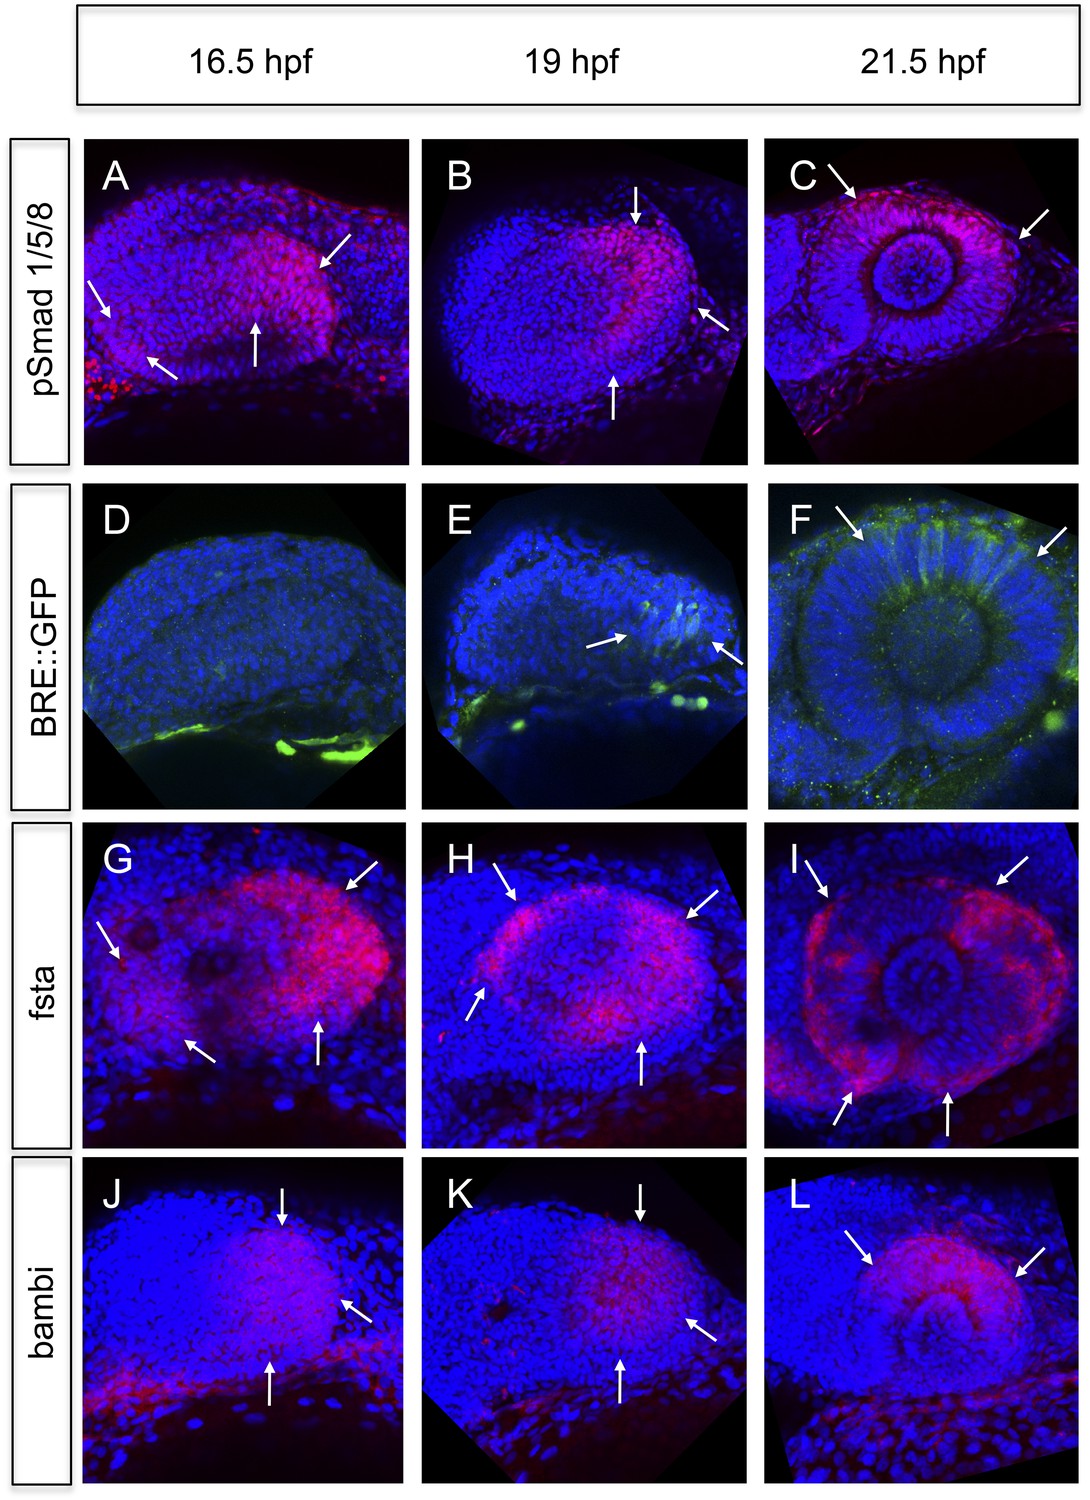
Analyses of BMP signaling and expression of BMP antagonists during development at 16.5 hpf, 19 hpf, and 21 hpf embryos are presented in a lateral view nasal left.
(A–C) pSmad 1/5/8 immunohistochemistry (red) and DAPI nuclear staining. Activated BMP signaling can be appreciated mainly in the temporal domain of the optic vesicle (arrows) (A–B) and in the dorsal domain of the optic cup (arrows) (C). At 16.5 hpf, a small domain of activated BMP signaling is visible in the nasal optic vesicle (arrows) (A). (D–F) Immunohistochemically enhanced BRE::GFP (green) and DAPI nuclear staining. Activated BMP signaling can be appreciated in the temporal late optic vesicle (arrows) (E) and the dorsal optic cup (arrows) (F). Hardly any activity can be detected in the optic vesicle at 16.5 hpf. Note the delay of activity in comparison to pSmad 1/5/8. (G–I) Whole mount in situ hybridizations with a fsta probe (Fast Red) and DAPI nuclear staining. In the optic vesicle as well as in the optic cup two domains (nasal and temporal) of fsta expression can be seen (arrows). (J–L) Whole mount in situ hybridizations with a bambia probe (Fast Red) and DAPI nuclear staining. Bambi expression can be seen in the temporal domain of the optic vesicle (arrows) (J–K) and in the dorsal domain of the optic cup (arrows) (L).
To address the means by which BMP activity is restricted, we analyzed the activity of prominent BMP antagonists follistatin a (fsta) (Thompson et al., 2005), and bambi (bambia) (French et al., 2009). Fsta was expressed in two domains, a nasal and a temporal domain (Figure 4G–I and Figure 5A), whereas bambi was only expressed in the temporal domain of the optic vesicle (Figure 4J,K) and the dorsal domain of the optic cup (Figure 4L). The regions of fsta expression correspond to the domains showing neuroretinal flow during optic cup formation.

BMP antagonism drives neuroepithelial flow during optic cup formation.
(A) whole mount in situ hybridization for fsta (NBT/BCIP) (17.5 hpf). (B) GFP expressed in the optic vesicle (arrows) of an rx2::GFPcaax zebrafish embryo (16.5 hpf), (C–D) GFP driven by the BRE and transmission/brightfield image for orientation. Strong GFP expression can be observed in the eye when BMP is driven under rx2 (arrows in D), whereas only mild GFP can be observed in controls (arrows in C). (E) Scheme showing the orientation of the pictures presented in F, (F) optic cup development over time of an rx2::BMP4 embryo. Cells are visualized by nuclear GFP (H2BGFP). A dotted line is indicating the border between lens-averted and lens-facing epithelium. Remarkably, the pan-ocular driven BMP resulted in persisting lens-averted domains. The data presented in F are derived from 4D imaging data (start at 16.6 hpf) one optical section is also presented as Video 6.
To address the importance of localized BMP signaling in wild-type embryos, we expressed BMP4 in the entire eye using an Rx2 proximal cis regulatory element (Figure 5B), which overrides the localized BMP antagonist in the optic vesicle and optic cup.
In BMP reporter fish (Laux et al., 2011), we addressed BMP signaling activity under control and experimental conditions. At the optic cup stage, moderate BMP signaling activity was observed in the dorsal retina of control fish (Figures 4F and 5C). The pan-ocular expression of BMP4 resulted in a strong response of the reporter, indicating pan-ocular BMP4 signaling (Figure 5D).
Strikingly resembling the BMP dependent ‘antimotogenic’ effect (Veerkamp et al., 2013), pan-ocular BMP expression arrested epithelial flow during optic cup formation. Time-lapse in vivo microscopy revealed that cells in the lens-averted part of the future neuroretina remained in the prospective RPE domain and did not contribute to the optic cup (Video 6 and 7). This ultimately resulted in an apparently ectopic domain of neuroretina that arose from a morphogenetic failure, rather than from a trans-differentiation of RPE (Figure 6D, Fig. 6—figure supplement 1,2,3, Videos 8,9,10). The severity of the phenotype correlated well with levels of fsta expression in the optic vesicle and was most prominent in the temporal domain of the optic vesicle. These findings highlight the importance of the modulation of BMP signaling for epithelial fluidity during the transformation from optic vesicle to optic cup. We propose that the repression of BMP signaling is crucial to mobilize the lens-averted retinal epithelium, causing it to flow and eventually constitute the neural retina to a large extent.
(related to Figure 4) (rx2::BMP4) Optic vesicle to optic cup transition visualized by H2BGFP RNA (orientation as in Figure 3) (imaging starts at 16.5 hpf, framerate 1/15 min).
https://doi.org/10.7554/eLife.05216.014(related to Figure 4) (rx2::BMP4) Optic vesicle to optic cup transition visualized by rx2::GFPcaax (orientation as in Figure 3) (imaging starts at 19 hpf, framerate 1/15 min).
https://doi.org/10.7554/eLife.05216.015
Impaired eye gastrulation results in coloboma.
(A–B) Membrane-localized GFP (rx2::GFPcaax) in a developing eye during optic fissure closure (A = early, B = late) (lateral view, derived from imaging data, (A) start at 24 hpf, (B) after 34 hr imaging at 22°C). Rx2 is expressed in retinal stem cells/RPCs (A) and after NR differentiation is additionally expressed in photoreceptors and Müller Glia (B) while its expression is maintained in retinal stem cells of the CMZ (Reinhardt and Centanin et al., submitted). The optic fissure margins are still undifferentiated (arrows in B), (C) developing eye of rx2::BMP4 fish (lateral view), membrane-localized GFP (rx2::GFPcaax, anti-GFP immunointensified), DAPI nuclear labeling and anti-laminin immunostaining, the optic fissure is visible, noteworthy the temporal retina is mis-shaped and folded into the RPE domain (best visible in DAPI, arrowheads), and located on a basal membrane (arrowheads in anti-laminin), especially the temporal optic fissure margin (arrowheads in GFPcaax) is located in the folded part of the temporal retina and not facing the optic fissure (arrows in GFPcaax) (24 hpf) (D–E) impaired optic fissure closure in rx2::BMP4 embryos over time at a proximal (E) and a distal (D) level. (Data obtained from 4D imaging of rx2 ::BMP4/ rx2::GFPcaax started at 21.5 hr. Data are also presented as Video 10.) Importantly, next to the affected temporal optic cup also the nasal optic cup is mis-folded (arrowheads in D). Remarkably, however, the nasal optic fissure margin extents into the optic fissure (dashed arrow in E) but the temporal optic fissure margin does not, likely being the result of the intense mis-bending of the temporal optic cup. This results in a remaining optic fissure (asterisk in E). (F–G) Brightfield images of variable phenotype intensities observed in rx2::BMP4 hatchlings.
Control to video 9, optic cup development recorded with rx2::GFPcaax (lateral view) (imaging starts at 20 hpf, framerate 1/10 min).
https://doi.org/10.7554/eLife.05216.021(rx2::BMP4) Optic cup development recorded with rx2::GFPcaax (lateral view) (imaging starts at 20 hpf, framerate 1/10 min).
https://doi.org/10.7554/eLife.05216.022Proximal domain of an rx2::BMP4 embryo showing an impaired optic fissure closure (orientation as in Figure 5E) (imaging starts at 21.5 hpf, framerate 1/10 min).
https://doi.org/10.7554/eLife.05216.023We further investigated the implications of impaired epithelial flow for subsequent steps of eye development (e.g., fate of the optic fissure). After initiation of neuroretinal differentiation in control embryos, the undifferentiated domains are restricted to the un-fused optic fissure margins and the forming CMZ. Both can be visualized by the expression of Rx2 (Figure 6A,B). The impairment of neuroretinal flow, however, resulted in a mis-organization of the optic fissure. Here, the undifferentiated Rx2-expressing domain was found at the ultimate tip of the lens-averted neuroretinal domain, which failed to flow into the optic cup and persisted in the prospective RPE (Figure 6C). As a result, the temporal optic fissure margin, in particular, failed to extend into the optic fissure (Figure 6D–E). This also holds true, but to a lesser extent, to the nasal optic fissure margin (Figure 6D). As a result, the two fissure margins cannot converge resulting in a persisting optic fissure, a coloboma. Macroscopically, the pan-ocular expression of BMP4 results in phenotypes including a ‘Plattauge’ (flat-eye) (Figure 6G), in which the ventral part of the eye is strongly affected and a milder phenotype (Figure 6F), in which the ventral retina develops, but with a persisting optic fissure.
It was previously shown that exposing the developing eye to high levels of ectopically applied BMP can cause dorsalization, concomitant with a loss of ventral cell identities (Behesti et al., 2006). This is likely the cause for coloboma (Behesti et al., 2006; Koshiba-Takeuchi et al., 2000, Sasagawa et al., 2002). Our data based on stable BMP4 expression (rx2::BMP4) in the entire optic vesicle, however, conclusively show that early BMP4 exposure arrests neuroepithelial flow, resulting in a morphologically affected ventral retina. The ventral expression of vax2 in optic cups of rx2::BMP4 embryos indicates the maintenance of ventral retinal fates and argues against early transdifferentiation/dorsalization induced by BMP (Figure 6—figure supplement 4). Remarkably, the remaining lens-averted domain of those embryos, which was ectopically localized and was not integrated into the optic cup, eventually differentiated into neuroretina (Figure 6—figure supplement 1), as indicated by the expression of vsx1 (Kimura et al., 2008; Shi et al., 2011; Vitorino et al., 2009) and vsx2 (formerly Chx10) (Vitorino et al., 2009). Notably, a localization of neuroretina within the RPE domain might be mistaken for an RPE to neuroretina trans-differentiation, as proposed for other phenotypes (Araki et al., 2002; Azuma et al., 2005; Sakaguchi et al., 1997, Bankhead et al., 2015).
Even in amniotes, the histological analyses of consecutive stages of optic cup development are best interpreted as epithelial flow that also enlarges the retinal surface. This can even be appreciated during in vitro optic cup formation using mammalian embryonic stem cells (Eiraku et al., 2011).
Taken together, our data clearly show that during optic vesicle to optic cup transformation, the lens-averted part of the optic vesicle is largely integrated into the lens-facing optic cup by flowing around the distal rim of the optic cup including the forming optic fissure. Our data have far-reaching implications on the generation of the retinal stem cell niche of teleosts, as the last cells flowing into the optic cup will eventually constitute the CMZ. We identify a part of the lens-averted epithelium as the primary source of the RPE. The arrest of neuroepithelial flow by the ‘antimotogenic’ effect of BMP (Veerkamp et al., 2013) results in coloboma and thus highlights the importance of the flow through the fissure for the establishment of the ventral optic cup.
It is unlikely that the bending of the neuroretina provides the motor for the epithelial flow; in the opo mutant no ectopic neuroretina can be found, indicating that the flow persists, even in the absence of optic cup bending (Bogdanović et al., 2012). Consequently, forces established outside the neuroretina are likely to drive the flow. One tissue potentially involved is the mono-layered-forming RPE. We speculate that this tissue contributes to the flow by changing its shape from a columnar to a flat epithelium, massively enlarging its surface (Figure 1J–K, Video 3). This remains an interesting point, in particular given that epithelial flow is maintained even if cell proliferation is inhibited in both neuroretina and RPE.
Materials and methods
Transgenic zebrafish and Injections
Request a detailed protocolBMP4 was cloned via directional Gateway from zebrafish cDNA into a pEntr D-TOPO (Invitrogen, Germany) vector with the following primers: forw: 5′ CACCGTCTAGGGATCCCTTGTTCTTTTTGCAGCCGCCACCATGATTCCTGGTAATCGAATGCTG 3′, rev: 5′ TTAGCGGCA GCCACACCCCTCGACCAC 3′.
The expression construct was assembled via a Gateway reaction using Tol2 destination vector containing a cmlc: GFP (Kwan et al., 2007), a 5′Entry vector containing an rx2 promoter (Martinez-Morales et al., 2009), the vector containing the BMP4 and a 3′Entry vector containing a pA sequence (Kwan et al., 2007). The construct was co-injected with mRNA encoding Tol2 transposase into the cytoplasm of zebrafish eggs at the one cell stage. Stable lines were preselected based on GFP expression in the heart (cmlc2::GFP), raised and validated in F1 and subsequent generations. Lines were maintained as closed stocks and crossed to other lines as indicated in the manuscript.
The rx2::GFPcaax construct was assembled with the 5′ and 3′ components described above and GFPcaax in the pEntr D-topo vector via Gateway (Invitrogen) and co-injected with mRNA encoding Tol2 transposase into the cytoplasm of zebrafish eggs at the one cell stage. Stable lines were preselected based on GFP expression in the heart (cmlc2::GFP), raised, and validated in F1 and subsequent generations. Lines were maintained as closed stocks and crossed to other lines as indicated in the manuscript.
The BRE::GFP zebrafish line (Laux et al., 2011) was kindly provided by Beth Roman. The Vsx1::GFP zebrafish line (Kimura et al., 2008; Shi et al., 2011; Vitorino et al., 2009) was kindly provided by Lucia Poggi. The Vsx2::RFP zebrafish line (Vitorino et al., 2009) was kindly provided by the lab of William Harris.
Where indicated RNA for H2BGFP (nuclear localized GFP) (37 ng/µl) was injected into 1–8 cell staged zebrafish embryos enabling 4D imaging of mosaically nuclear labeled zebrafish.
Drug treatment with aphidicolin
Request a detailed protocolZebrafish embryos were treated with aphidicolin (10 µg/ml, Serva, Germany) in order to inhibit cell proliferation. 12 embryos were treated with aphidicolin. 4D imaging was performed on one with an aphidicolin pretreatment of 5 hr. The efficacy of the treatment was addressed by analyzing nuclei in mitosis (positive for the expression of phospho-histone H3. At 21.5 hpf pHH3 positive nuclei were counted in central sections of four control (untreated embryos from the same batch) (average: 21) and experimental (average: 6) retinae, respectively.
Quantification of optic cup surface
Request a detailed protocolOptic cup surfaces were measured with the help of FIJI (ImageJ NIH software). The mean of the length of the measured lines (Figure 1C) of two adjacent optical sections was multiplied by the optical section interval.
Microscopy
Request a detailed protocolConfocal data of whole mount immunohistochemical stainings a Leica (Germany) SPE microscope was used. Samples were mounted in glass bottom dishes (MaTek, Ashland, MA). Olympus (Germany) stereomircoscope was used for recording brightfield images of rx2::BMP4 hatchlings and the overview of the expression of rx2::GFPcaax. For whole mount in situ data acquisition, a Zeiss (Germany) microscope was used. Time-lapse imaging was performed with a Leica SP5 setup which was upgraded to a multi photon microscope (Mai Tai laser, Spectra Physics, Germany). It was recorded in single photon modus and multi photon modus. For time-lapse imaging, embryos were embedded in 1% low melting agarose and covered with zebrafish medium, including tricaine for anesthesia. Left and right eyes were used and oriented to fit the standard dorsal view or view from the side.
Whole mount in situ hybridization
Request a detailed protocolWhole mount in situ hybridization was performed with probes for fsta bambia and vax2. The probes were selfmade. Sequences were amplified by PCR from zebrafish cDNA and subcloned into pGEMTeasy vector (Promega, Germany). In vitro transcription was performed with Sp6/T7 Polymerase. Hybridization was largely performed according to Quiring et al. (2004). The Probe bas visualized with NBT/BCIP (Roche, Switzerland) or Fast Red (Roche) as indicated.
Whole mount immunohistochemistry
Request a detailed protocolImmunohistochemistry was performed according to a standard whole mount immunohistochemistry protocol. Briefly, embryos/hatchlings were fixed, washed, bleached (KOH/H2O2 in PTW), and blocked (BSA [1%], DMSO [1%], Triton X-100 [0.1%], NGS [4%], PBS [1×]). In case of anti-pSmad 1/5/8 immunohistochemistry embryos were additionally treated with proteinase K (10 µg/ml, 16.5 hpf: 5 min, 19 hpf and 21.5 hpf: 6 min). Samples were incubated in primary antibody solution (anti-laminin, 1:50, Abcam, Germany) (anti-GFP 1:200, life technologies, Germany) (anti-dsRED, Clontech, Germany) (anti-pHH3, 1:100, Milipore, Germany) (anti-pSmad1/5/8, 1:25, Cell Signaling, Germany) in blocking solution. Samples were washed and incubated in secondary antibody solution (anti-rabbit Dylight, 1:300, anti-chicken Alexa 488, 1:300, Jackson, UK) with DAPI (stock: 2 µg/ml, 1:500) added. Consecutively, samples were washed and mounted for microscopy.
Quantification of dorso-ventral movement
Request a detailed protocolThe amount of movement in the dorso-ventral axis was quantified using a supervoxel based Optical Flow algorithm (Amat et al., 2013). The pixel wise output was visualized by applying a spherical coordinate system to the eye using a custom made ImageJ plugin (Source code 1: file plugin). The color coding is based on the sign of the polar angle theta and the sign of the azimuth angle phi, as well as on their respective combinations. The quantification was performed by counting the labeled pixels in an ImageJ macro (Source code 1: file macro).
Cell tracking
Request a detailed protocolCells were tracked manually using MtrackJ (Meijering et al., 2012) in Fiji (ImageJ) (Schindelin et al., 2012) back in 4D stacks to their original location or until lost. Only tracks with a significant length were used for the visualizations. Centered on the track cells are represented as spheres. Partially results are presented in a side view where the dorso-ventral axis originally represented as the z-axis has now become the y-axis. A factor of 10.5703 is introduced in order to adjust the data of the former z-axis to the other two axes. The color coding is done by choosing colors from an 8 bit lookup table and applying them from the dorsal to the ventral side based on the end of the track. Partially tracking results are presented as tailed spheres. The spheres are based on the tracking data using an average over the last three timepoints. The image is stretched in the z-axis using a factor of 10.5703, to adjust the scale to the x and y axes. Tails are created using a lookup table with 16 different shades per color. The respective shade is defined by the distance and difference in time between the recent position and the position on the tail.
References
-
Epithelia-mesenchyme interaction plays an essential role in transdifferentiation of retinal pigment epithelium of silver mutant quail: localization of {FGF} and related molecules and aberrant migration pattern of neural crest cells during eye rudiment forDevelopmental Biology 244:358–371.https://doi.org/10.1006/dbio.2002.0591
-
Multiple requirements of the focal dermal hypoplasia gene porcupine during ocular morphogenesisThe American Journal of Pathology 185:197–213.https://doi.org/10.1016/j.ajpath.2014.09.002
-
Fate restriction and multipotency in retinal stem cellsCell Stem Cell 9:553–562.https://doi.org/10.1016/j.stem.2011.11.004
-
Early eye development in vertebratesAnnual Review of Cell and Developmental Biology 17:255–296.https://doi.org/10.1146/annurev.cellbio.17.1.255
-
Extraocular mesenchyme patterns the optic vesicle during early eye development in the embryonic chickDevelopment 127:4599–4609.
-
Eye morphogenesis and patterning of the optic vesicleCurrent Topics in Developmental Biology 93:61–84.https://doi.org/10.1016/B978-0-12-385044-7.00003-5
-
Optic cup morphogenesis requires pre-lens ectoderm but not lens differentiationDevelopmental Biology 259:351–363.https://doi.org/10.1016/S0012-1606(03)00205-7
-
The Tol2kit: a multisite gateway-based construction kit for Tol2 transposon transgenesis constructsDevelopmental Dynamics 236:3088–3099.https://doi.org/10.1002/dvdy.21343
-
Dynamic analysis of BMP-responsive smad activity in live zebrafish embryosDevelopmental Dynamics 240:682–694.https://doi.org/10.1002/dvdy.22558
-
Methods for cell and particle trackingMethods Enzymol 504:183–200.https://doi.org/10.1016/B978-0-12-391857-4.00009-4
-
Large-scale expression screening by automated whole-mount in situ hybridizationMechanisms of Development 121:971–976.https://doi.org/10.1016/j.mod.2004.03.031
-
Fiji: an open-source platform for biological-image analysisNature Methods 9:676–682.https://doi.org/10.1038/nmeth.2019
-
Early eye morphogenesis in the zebrafish, Brachydanio rerioJournal of Comparative Neurology 344:532–542.https://doi.org/10.1002/cne.903440404
-
Vsx1 regulates terminal differentiation of type 7 ON bipolar cellsThe Journal of Neuroscience 31:13118–13127.https://doi.org/10.1523/JNEUROSCI.2331-11.2011
-
An eye on eye developmentMechanisms of Development 130:347–358.https://doi.org/10.1016/j.mod.2013.05.001
-
BookThe vertebrate eye and its adaptive radiationNew York London: Hafner Publishing Company 1963.
Decision letter
-
Tanya T WhitfieldReviewing Editor; University of Sheffield, United Kingdom
eLife posts the editorial decision letter and author response on a selection of the published articles (subject to the approval of the authors). An edited version of the letter sent to the authors after peer review is shown, indicating the substantive concerns or comments; minor concerns are not usually shown. Reviewers have the opportunity to discuss the decision before the letter is sent (see review process). Similarly, the author response typically shows only responses to the major concerns raised by the reviewers.
Thank you for sending your work entitled “Epithelial flow into the optic cup facilitated by suppression of BMP drives eye morphogenesis” for consideration at eLife. Your article has been favorably evaluated by Diethard Tautz (Senior editor) and three reviewers, one of whom, Tanya Whitfield, is a member of our Board of Reviewing Editors.
The Reviewing editor and the other reviewers discussed their comments before we reached this decision, and the Reviewing editor has assembled the following comments to help you prepare a revised submission.
While all three reviewers find the study interesting, there are some substantive reservations over the manuscript in its current form. A major criticism is the lack of citation and acknowledgement of previous literature. A number of papers have been suggested by the reviewers, all of which should be considered, cited and discussed carefully. In addition, the conclusions and interpretation of the findings should be adjusted to take full account of these earlier studies.
In addition, some further experimental work should be done to strengthen the manuscript. A fuller description, at multiple embryonic stages, of the BRE:GFP expression domains in the eye, and correlation with expression of both P–Smads and BMP inhibitors (fsta, bambi), is required. A later stage in situ showing vax2 expression following BMP overexpression should also be shown. If additional data (such as the origin of the stem cell compartment, or tracing the patch of lens-averted epithelium that forms the RPE) can be extracted from the existing movies (or generated with new ones), this information would be extremely valuable and would enhance the significance and novelty of the findings.
A number of other suggestions have been suggested by the reviewers to improve the manuscript, including adding more detail to the Experimental Procedures section and clarifying the data provided in the Table. It will be essential to provide accurate embryo staging and labeling throughout.
The full reviews are appended below.
Reviewer #1:
This is an interesting report documenting the cell movements that contribute to formation of the zebrafish neuroretina. The authors demonstrate that much of the retina derives from lens-averted epithelium, which moves round and into the lens-adjacent layer in directed movements of the cell sheet akin to gastrulation. These movements continue in the absence of cell proliferation, and account for the apparently paradoxical increase in surface area of the neuroretina, despite the decrease in apical surface area of individual cells in this tissue. It is proposed that a small patch of the lens-averted epithelium gives rise to the retinal pigmented epithelium (RPE).
Some of the imaging is spectacular and supports the conclusions of the paper well. However, there are also a number of deficits that should be addressed. These are listed below.
General points:
The authors place great importance on the retinal stem cell niche, but have no markers to show this population. Can they be visualised in some way?
They also place importance on the role of the developing RPE in driving the cell movements, but the cell movements of this layer are not described well at all, and the small patch of cells that is proposed to become the RPE is not identified or followed in any of the figures or movies. It will be important to show this to confirm the assertion that only a small patch of the lens-averted epithelium develops into the RPE.
Numbers and quantitation: more detail is needed throughout, e.g. for the phenotypes of 'variable expressivity' (eleventh paragraph) resulting from pan-ocular expression of BMP4.
Figures:
Scale bars are needed on the figures, especially on Figure 1B and C, where the surface area is estimated from linear dimensions drawn onto sections. The scale is needed to ensure the data shown in the figure panels match up with the values listed in the Table.
Stages/hours post fertilization should also be listed in the legend or directly on the panels for all figures.
Figure 1–figure supplement 1 should show a control (H2BGFP without aphidicolin). If this is provided by Figure 2A, there should be a reference to this figure in the legend to Figure 1–figure supplement 1, so that a comparison can be made. Are the small bright spots the dying cells? How many embryos were treated, and with what concentration of aphidicolin? This information does not appear to be provided anywhere. How was the block in cell proliferation confirmed? Was this by counting nuclei, or lack of mitotic figures?
Figure 4–figure supplement 1A, panel 2: This picture is not of publication quality, it is completely out of focus, with no morphological detail visible.
Figure 4–figure supplement 2: It would be helpful to show here a stage series, showing when the BMP reporter normally begins to be expressed in the eye, and how levels of expression compare with other areas of BMP activity in the embryo. Ideally, an additional confirmation of BMP activity, e.g. by P-Smad levels, should be shown; alternatively, more information about this transgenic line or a citation is needed in the Experimental Procedures.
Figure 5–figure supplement 1 merge: The box drawn in the first panel does not appear to correspond to the area shown in the enlargements.
Figure 5–figure supplement 4 needs repeating and improving. A control is needed to show expression levels in non-transgenic embryos. A higher power picture of the staining in the eye would be useful; the outline and arrows currently overlie the staining, making it difficult to see.
Experimental Procedures: More detail is needed for description of the transgenic lines. Are these already published? In which case, a citation is needed. If not published, more description of the constructs used is needed. A ZFIN reference should be given for each line, if available.
Immunohistochemistry: Not enough detail is given here for others to be able to replicate the experiments. What do the acronyms stand for, what dilutions of primary and secondary antibodies were used, and what concentrations of DAPI, DMSO, Triton, etc.?
Table:
The Table is difficult to understand. What are the numbers? Do they refer to measurements from a single embryo, or are they mean values from multiple embryos? (In which case, SEM or SD should be given). If from a single embryo, it is difficult to draw any firm conclusions from the data. In the text, phase 2 is described as a fast, smooth flow, but in all cases the effective speed shown during phase 2 in the table appears to be slower than the values shown for phase 1. The total distance moved in phase 2 needs to correlate with the distances shown on the figures, which is why scale bars on the figures are needed. It would be helpful to have a full stop instead of a comma for the decimal point, as 10,000 could be read as 'ten thousand'.
Movies:
The movies are very helpful, but more information is needed in the legends that describe these. What are the times over which they were taken, what was the frame rate, and what stage are the embryos? As for the figures, this information is needed to correlate with the values shown in the table, and should be given in the movie legends. Movie 8 is of lower quality and resolution than the others, and should be improved.
Reviewer #2:
This manuscript analyses the cell dynamics accompanying optic cup formation in the zebrafish and shows that cells in the “lens-averted” region of the optic vesicle are incorporated into the “lens-facing” region. It further shows that the inhibition of BMP is required for this process to occur efficiently. The study has interesting implications to understand the origin of optic cup domains. In addition, it provides a new interpretation for phenotypes that up to now had been interpreted as transdifferentiation of RPE into retina, and highlight the power of live imaging to provide an accurate interpretation of phenotypic outcomes. I consider the work a valuable contribution to our current knowledge on eye morphogenesis and patterning. However, I have important concerns with the way the significance of previous works analyzing this same process has been minimised by the authors, and with the interpretation of some of their observations.
The finding of optic vesicle cells ingressing into the future retinal layer from the prospective RPE layer is not new. It has been extensively described by Picker et al., PLoS Biology, 2009 and Kwan et al., Development, 2012. I disagree with the way the authors seem to remove significance from those papers, and I consider they should be appropriately cited. In particular, Picker et al. clearly and extensively showed that prior to optic cup formation, the optic vesicle is mostly formed by future retinal cells, and that the lens-averted layer of the primordium constitutes the origin of the temporal retinal domain.
This does not mean that I do not consider the current work valuable. The authors do provide a detailed analysis of the consequences this morphogenetic process has to understand the origin of different optic cup domains (in particular the CMZ and the RPE), and dissect part of the molecular mechanisms controlling it.
The authors state that follistatin is expressed in the temporal domain, yet their in-situ (Figure 4) clearly shows expression in the prospective dorsal portion of the optic vesicle. At early stages, the optic vesicle in zebrafish has not acquired its final disposition and temporal is located along the ventral portion of the optic vesicle. Follistatin expression is stronger at the distal-most region of the optic vesicle, both dorsal and ventral, which corresponds to prospective dorsal (see Veien et al., Development, 2008). Indeed, this would be more consistent with previous reports showing a requirement of differential BMP signalling along the dorso-ventral, and not the naso-temporal, axis.
In the same line with my first comment, I find the authors should be more rigorous with their citation of previous work. In the first sentence of their manuscript and based on a previous report from the authors from 2006, they state that optic vesicle evagination occurs by single cell migration. However, since then there have been additional papers analyzing dynamically this process and showing results that support alternative explanations for the active behaviours of eye field cells. These papers (England et al., Development, 2006 and Ivanovitch et al., Dev Cell, 2013) should be acknowledged, and the first statement softened.
Reviewer #3:
Given the involvement of BMP signaling in ocular patterning, it is exciting to find that overexpression of BMP can affect specific cell movements. The manuscript contains some interesting observations, but the authors have not adequately integrated their results with the existing literature. I have concerns about the conclusions and interpretations.
1) An anterior rotational movement characterized by Picker et al., 2009, is largely overlooked, but has significant implications for these analyses: what the authors refer to as the optic vesicle temporal domain (where fsta is expressed) gives rise to the dorsal domain (180° away from the optic fissure). Yet the authors describe the dorsal region as having notably less flow. Is this the prospective nasal region? Clarification, and placing these results in the context of previously characterized movements would be useful.
2) The authors show BRE reporter expression in the dorsal domain at optic cup stage. At least one other BMP inhibitor, bambi, is already known to be expressed in the prospective dorsal domain (first temporal, then dorsal) throughout optic cup development (French et al., 2009). The coincidence of BMP inhibitor expression and BRE reporter expression suggests a potential negative feedback loop, though BMP signaling is not completely abolished in the dorsal domain, based on phospho-Smad staining (French et al., 2009) and BRE reporter expression. Therefore, fsta expression (and expression of other BMP inhibitors) may not mark a zone of repressed BMP signaling, as the authors have proposed.
3) The authors argue that BMP overexpression driven by rx2 does not lead to fate changes in the eye, by demonstrating unchanged expression of vax2. However, the embryo appears to be ∼18 somite stage (this is a guess given the lack of staging)? This reviewer was under the impression that the rx2 promoter does not begin to induce transcription until ∼14 somite stage, therefore, it is unclear if vax2 expression would be altered in such a short time. A later in situ (prim–5) would be a better control, especially given strong induction of the BRE and later phenotypes. Any clarification on promoter activity and timing would be welcome.
4) The authors argue that there is no BMP activity in the early optic vesicle by using the BRE reporter line. Is it clear that this line reports all BMP activity? There is evidence that BMP signaling is active in the early optic vesicle: French et al., 2009, demonstrate strong phospho-Smad staining in the optic vesicle temporal region (which gives rise to the dorsal domain) at 6 and 10 somite stages.
5) Cell movement from lens-averted to lens-facing domain has previously been analyzed via live imaging (Picker et al., 2009), cell tracking and volume measurements (Kwan et al., 2012). A novel finding would be when such flow ceases, thereby defining the definitive stem cell compartment; this was never demonstrated previously. The authors' movies are likely to contain that information, as the last embryo in Figure 2A appears older than prim–5, based on lens morphology.
6) Embryo ages (somite stages or hours post fertilization) are lacking throughout the manuscript, making it difficult to place these movements in context of other known events.
https://doi.org/10.7554/eLife.05216.025Author response
While all three reviewers find the study interesting, there are some substantive reservations over the manuscript in its current form. A major criticism is the lack of citation and acknowledgement of previous literature. A number of papers have been suggested by the reviewers, all of which should be considered, cited and discussed carefully. In addition, the conclusions and interpretation of the findings should be adjusted to take full account of these earlier studies.
In addition, some further experimental work should be done to strengthen the manuscript. A fuller description, at multiple embryonic stages, of the BRE:GFP expression domains in the eye, and correlation with expression of both P–Smads and BMP inhibitors (fsta, bambi), is required. A later stage in situ showing vax2 expression following BMP overexpression should also be shown. If additional data (such as the origin of the stem cell compartment, or tracing the patch of lens-averted epithelium that forms the RPE) can be extracted from the existing movies (or generated with new ones), this information would be extremely valuable and would enhance the significance and novelty of the findings.
A number of other suggestions have been suggested by the reviewers to improve the manuscript, including adding more detail to the Experimental Procedures section and clarifying the data provided in the Table. It will be essential to provide accurate embryo staging and labeling throughout.
The full reviews are appended below.
Reviewer #1:
This is an interesting report documenting the cell movements that contribute to formation of the zebrafish neuroretina. The authors demonstrate that much of the retina derives from lens-averted epithelium, which moves round and into the lens-adjacent layer in directed movements of the cell sheet akin to gastrulation. These movements continue in the absence of cell proliferation, and account for the apparently paradoxical increase in surface area of the neuroretina, despite the decrease in apical surface area of individual cells in this tissue. It is proposed that a small patch of the lens-averted epithelium gives rise to the retinal pigmented epithelium (RPE).
Some of the imaging is spectacular and supports the conclusions of the paper well. However, there are also a number of deficits that should be addressed. These are listed below.
General points:
The authors place great importance on the retinal stem cell niche, but have no markers to show this population. Can they be visualised in some way?
This is a very interesting aspect that we have elaborated further in the revised manuscript. The retina specific homeobox transcriptions factor Rx2 in fact represents a marker for retinal stem cells at the relevant stages of the manuscript (see attached manuscript by Reinhardt, Centanin et al., submitted elsewhere). It is initially expressed in all cells of the evaginated optic vesicle (likely stem cells) and as development proceeds is limited to the CMZ. At later stages (once the retinal cell types enter terminal differentiation after the completion of optic cup formation) its expression is additionally found in Müller Glia cells and photoreceptors. The stem cells of the neuroretina and the Retinal Pigmented Epithelium (RPE) are located within the CMZ. Using an inducible CRE based lineage analysis we show in the accompanying manuscript that Rx2 cells of the CMZ represent stem cells. An individual Rx2 positive cell is multipotent and gives rise to all retinal cell types (Reinhardt, Centanin et al., submitted). This is now explicitly stated in the revised version of the manuscript where we refer to rx2 as retinal stem cell marker. The submitted manuscript of Reinhardt, Centanin et al. has been attached.
They also place importance on the role of the developing RPE in driving the cell movements, but the cell movements of this layer are not described well at all, and the small patch of cells that is proposed to become the RPE is not identified or followed in any of the figures or movies. It will be important to show this to confirm the assertion that only a small patch of the lens-averted epithelium develops into the RPE.
This is an important point, and we thank the referee for this comment. In the revised version of the manuscript we now put emphasis on the developing RPE. We use two features to identify early RPE: The absence of Rx2 expression as well as the specific flat morphology of the RPE cells (and nuclei). Using those criteria we follow the edge of the RPE, best visualized in Movie 3. We show the developing RPE in between the arrows, which mark the border of RPE. In addition, Figure 1J-L is highlighting the change in cell shape the RPE precursors undergo, concomitant with their loss of Rx2 expression (between asterisks in Figure 1H).
We have taken care to clearly state these important points in the revised manuscript.
Numbers and quantitation: more detail is needed throughout, e.g. for the phenotypes of 'variable expressivity' (eleventh paragraph) resulting from pan-ocular expression of BMP4.
The referee is right. Our statements were misleading and the variability was due to genetic variability in the analyzed lines. We had initially mentioned the variable expressivity to indicate a graded activity of BMP4, which however was apparently not fully explained.
In order to avoid that confusion we now only focus on one phenotypic class and have removed the misleading term from the revised manuscript.
Figures:
Scale bars are needed on the figures, especially on Figure 1B and C, where the surface area is estimated from linear dimensions drawn onto sections. The scale is needed to ensure the data shown in the figure panels match up with the values listed in the Table.
Scalebars have been added to the figures, which were used for quantitation.
Stages/hours post fertilisation should also be listed in the legend or directly on the panels for all figures.
Information about the developmental stages has been added to the figure legends.
Figure 1–figure supplement 1 should show a control (H2BGFP without aphidicolin). If this is provided by Figure 2A, there should be a reference to this figure in the legend to Figure 1–figure supplement 1, so that a comparison can be made.
The new figure (Figure 2–figure supplement 1) presenting this data is connected to Figure 2, which is showing the control data. As requested we have put a reference to the corresponding figure legend.
Are the small bright spots the dying cells? How many embryos were treated, and with what concentration of aphidicolin? This information does not appear to be provided anywhere. How was the block in cell proliferation confirmed? Was this by counting nuclei, or lack of mitotic figures?
The referee is right, we also believe that the small bright spots represent condensed nuclei of apoptotic cells. Notably this is not affecting the described neuroretinal flow. We added the necessary information regarding the aphidicolin treatment in the revised manuscript.
Briefly, we pretreated for 5 hours before imaging with a concentration of 10µg/ml (Serva, cat:13696) 12 embryos. One of those was subjected to in vivo time-lapse analysis.
The efficacy of the treatment was addressed by analyzing nuclei in mitosis (positive for the expression of phospho-histone H3. At 21.5 hpf pHH3 positive nuclei were counted in central sections of four control (average: 21) and experimental (average: 6) retinae respectively. We have now included the anti-pHH3 immunohistochemical stainings to the revised manuscript (Figure 2–figure supplement 1) showing the aphidicolin mediated inhibition of cell proliferation.
Figure 4–figure supplement 1A, panel 2: This picture is not of publication quality, it is completely out of focus, with no morphological detail visible.
Figure 4–figure supplement 2: It would be helpful to show here a stage series, showing when the BMP reporter normally begins to be expressed in the eye, and how levels of expression compare with other areas of BMP activity in the embryo. Ideally, an additional confirmation of BMP activity, e.g. by P-Smad levels, should be shown; alternatively, more information about this transgenic line or a citation is needed in the Experimental Procedures.
The referee is right and we have restructured that entire part also in response to the general request and the comments of the other referees. Figure 4–figure supplement 1A has been removed. Instead we show a new Figure 4 which represents the dynamics of fsta and bambi expression along with indicators for BMP activity (anti-pSmad 1/5/8 immunohistochemical stainings and BRE::GFP expression) at relevant stages for optic cup formation. The BRE:GFP zebrafish have been provided by Beth Roman. The original paper (Laux et al., 2011) has (and had) been cited. The combination of BMP signaling modulators fsta and bambi with indicators for BMP activity at the key stages of the vesicle to cup transition now provides all necessary evidence at a glance. The text and figure legends have been revised accordingly.
Figure 5–figure supplement 1 merge: The box drawn in the first panel does not appear to correspond to the area shown in the enlargements.
We have taken care that the box moved perfectly corresponds to the close up, thanks for pointing this out.
Figure 5–figure supplement 4 needs repeating and improving. A control is needed to show expression levels in non-transgenic embryos. A higher power picture of the staining in the eye would be useful; the outline and arrows currently overlie the staining, making it difficult to see.
We followed the referee’s advice and repeated the entire series of in situs of vax2 on wild type and rx2::BMP4 embryos. Incorporating the suggestions of the other referees we now show embryos at a later stage (28 hpf) to address the potential impact of ectopic BMP4 on ventral patterning of the retina (Figure 6–figure supplement 4). We show the eyes of control and rx2::BMP4 embryos from different angles (lateral and ventral). The expression of vax2 in the ventral part of the retina persists even under conditions of BMP expression in the entire optic vesicle. This indicates that the observed morphological alterations observed under those conditions are not due to a miss-patterning of the ventral retina but can rather be attributed to the antimotogenic effect of BMP4. We have taken care to place arrows and outline outside of the staining.
Experimental Procedures: More detail is needed for description of the transgenic lines. Are these already published? In which case, a citation is needed. If not published, more description of the constructs used is needed. A ZFIN reference should be given for each line, if available.
This is an important point. All published transgenic lines were properly referenced in the submitted version and are as well in the revised version. All of the components of the lines generated in the context of this manuscript are referenced in detail in the experimental procedures section of the revised manuscript. The details are found in the revised experimental procedures.
Immunohistochemistry: Not enough detail is given here for others to be able to replicate the experiments. What do the acronyms stand for, what dilutions of primary and secondary antibodies were used, and what concentrations of DAPI, DMSO, Triton, etc.?
We have taken care that the information now presented allows full reproduction of the experiments. The relevant information is provided in the experimental procedures section of the revised manuscript.
Table:
The Table is difficult to understand. What are the numbers? Do they refer to measurements from a single embryo, or are they mean values from multiple embryos? (In which case, SEM or SD should be given). If from a single embryo, it is difficult to draw any firm conclusions from the data. In the text, phase 2 is described as a fast, smooth flow, but in all cases the effective speed shown during phase 2 in the table appears to be slower than the values shown for phase 1. The total distance moved in phase 2 needs to correlate with the distances shown on the figures, which is why scale bars on the figures are needed. It would be helpful to have a full stop instead of a comma for the decimal point, as 10,000 could be read as 'ten thousand'.
The referee is right, the table is difficult to understand. It reflects the attempt to provide quantitation of the movies to allow a more intuitive perception of the situation. Apparently that attempt failed. Since the table does not provide any information that is not also provided by the movies and it appears more confusing than enlightening, we have decided to remove it from the manuscript to enhance the clarity of our arguments. We thank the referee for pointing out this problem.
Movies:
The movies are very helpful, but more information is needed in the legends that describe these. What are the times over which they were taken, what was the frame rate, and what stage are the embryos? As for the figures, this information is needed to correlate with the values shown in the table, and should be given in the movie legends. Movie 8 is of lower quality and resolution than the others, and should be improved.
We now provide the information requested for each of the movie files in the revised version of the manuscript. Movie 8 (Movie 10 in the revised manuscript) represents imaging deep inside the optic cup. It has been taken under the same imaging settings as all the other movies. Due to scattering of the overlying tissue the quality could only be partially improved. This improved movie is now provided as revised Movie 10.
Reviewer #2:
This manuscript analyses the cell dynamics accompanying optic cup formation in the zebrafish and shows that cells in the “lens-averted” region of the optic vesicle are incorporated into the “lens-facing” region. It further shows that the inhibition of BMP is required for this process to occur efficiently. The study has interesting implications to understand the origin of optic cup domains. In addition, it provides a new interpretation for phenotypes that up to now had been interpreted as transdifferentiation of RPE into retina, and highlight the power of live imaging to provide an accurate interpretation of phenotypic outcomes. I consider the work a valuable contribution to our current knowledge on eye morphogenesis and patterning. However, I have important concerns with the way the significance of previous works analyzing this same process has been minimised by the authors, and with the interpretation of some of their observations.
The finding of optic vesicle cells ingressing into the future retinal layer from the prospective RPE layer is not new. It has been extensively described by Picker et al., PLoS Biology, 2009 and Kwan et al., Development, 2012. I disagree with the way the authors seem to remove significance from those papers, and I consider they should be appropriately cited. In particular, Picker et al. clearly and extensively showed that prior to optic cup formation, the optic vesicle is mostly formed by future retinal cells, and that the lens-averted layer of the primordium constitutes the origin of the temporal retinal domain.
We fully agree with the referee that Picker et al., as well as Kwan et al., described flow over the distal rim of the developing optic cup and are sorry for not adequately pointing that out in the initial version. It was never our intention not to acknowledge these findings or to remove significance from them.
In the revised version of the manuscript we substantially extended this paragraph to give full credit to previous research. We added the reference to a paper published before Picker et al. and Kwan et al. speculating about such a flow (Li et al., 2000). Importantly the flow in the temporal domain was then shown by Picker et al. and confirmed by Kwan et al. The nasal flow was not demonstrated and the connection of flow to the origin of the optic fissure had not been addressed before. The aspect of the dorsal pole, showing no flow, had also not been noted before.
This does not mean that I do not consider the current work valuable. The authors do provide a detailed analysis of the consequences this morphogenetic process has to understand the origin of different optic cup domains (in particular the CMZ and the RPE), and dissect part of the molecular mechanisms controlling it.
We thank the referee for this supportive statement and hope that our changes have clarified the issue.
The authors state that follistatin is expressed in the temporal domain, yet their in-situ (Figure 4) clearly shows expression in the prospective dorsal portion of the optic vesicle. At early stages, the optic vesicle in zebrafish has not acquired its final disposition and temporal is located along the ventral portion of the optic vesicle. Follistatin expression is stronger at the distal-most region of the optic vesicle, both dorsal and ventral, which corresponds to prospective dorsal (see Veien et al., Development, 2008). Indeed, this would be more consistent with previous reports showing a requirement of differential BMP signalling along the dorso-ventral, and not the naso-temporal, axis.
We agree with the referee that this is an important issue. Since the orientation of the vesicle and the localization of BMP activity with respect to the expression of BMP modulators was also brought up by the other referees we now provide a new Figure 4 for further clarification. We added more data showing the expression of fsta, bambi, as well as phosopho SMAD and the active BMP sensor at different developmental stages (please see revised Figure 4).
The point of eye rotation, which has been described in zebrafish does not pose a problem for the relative annotation of expression patterns during eye cup formation.
In a manuscript of Schmitt and Dowling (1994) two important phases of “eye rotation” have been described, a slight early rotation (10-12SS) and a more intense rotation at a later phase (24-36 hpf). Our analysis clearly shows that the neuroretinal flow described in our manuscript starts after the first, slight rotation and has already ceased before onset of the intense rotation of the optic cup (24 to 36 hpf, Schmitt and Dowling, 1994). We describe the formation of the optic fissure by retinal flow in between the two phases of eye rotations. This is in line with the timing of development described by Schmitt and Dowling (1994).
In the paper by Veien et al., the analyses started at an earlier developmental stage than our analyses likely addressing the first phase of “eye rotation”. As described above, the neuroretinal flow described in our manuscript occurs in between the rotational stages. Thus the relative positions remain stable in the phase of eye formation we are discussing here. Therefore all the patterns described are not apparently affected by the known phases of eye rotation. Our analysis furthermore indicates that expression patterns are dynamic with respect to transcriptional control and are therefore of limited value for linking fates and position (compare the expression of fsta and bambi in Figure 4).
With respect to the impact of the modulation of BMP signaling in the nasal and temporal domain the new Figure 4 now provides compelling expression data that fully support the hypothesis presented in the manuscript (please see the revised Figure 4).
In the same line with my first comment, I find the authors should be more rigorous with their citation of previous work. In the first sentence of their manuscript and based on a previous report from the authors from 2006, they state that optic vesicle evagination occurs by single cell migration. However, since then there have been additional papers analyzing dynamically this process and showing results that support alternative explanations for the active behaviours of eye field cells. These papers (England et al., Development, 2006 and Ivanovitch et al., Dev Cell, 2013) should be acknowledged, and the first statement softened.
It was not our intention not to acknowledge previous work. Although this aspect is only part of our Introduction, we extended this paragraph and cited the mentioned papers. We have tried to present a synthesis of the not so different perspectives promoted by the respective authors.
Reviewer #3:
Given the involvement of BMP signaling in ocular patterning, it is exciting to find that overexpression of BMP can affect specific cell movements. The manuscript contains some interesting observations, but the authors have not adequately integrated their results with the existing literature. I have concerns about the conclusions and interpretations.
1) An anterior rotational movement characterized by Picker et al., 2009, is largely overlooked, but has significant implications for these analyses: what the authors refer to as the optic vesicle temporal domain (where fsta is expressed) gives rise to the dorsal domain (180° away from the optic fissure). Yet the authors describe the dorsal region as having notably less flow. Is this the prospective nasal region? Clarification, and placing these results in the context of previously characterized movements would be useful.
We thank the referee for this comment. We realized that this issue needs further clarification. In the paper of Schmitt and Dowling (1994) two important phases of “eye rotation” have been described, one slight rotation (10-12SS) and a more intense rotation at a later phase (24-36 hpf).
Our analysis clearly show that the neuroretinal flow, which we describe, starts after the first, slight rotation and has already ceased before onset of the intense rotation of the optic cup (24 to 36 hpf, Schmitt and Dowling, 1994). Further, based on our 4D data we describe the formation of the fissure by the retinal flow, in between the two phases of eye rotations. This is in line with the timing of development described by Schmitt and Dowling (1994). However, our 4D data clearly show a different developmental process behind the formation of the optic fissure.
Importantly Picker et al. started their analyses at 10SS, therefore including at least the first phase of “eye rotation”. It is also important to consider the axis of the developing eye in relation to the axis of the body. Especially the heavy rotation of the optic cup aligns the axis of the eye and the axis of the body at this late developmental stage. With respect to the onset of neuroretinal flow, the dorsal and ventral poles relate to the optic vesicle and later define also the axis of the eye. However, as described above, the axis of the eye is only later aligned to the axis of the zebrafish body.
Based on our 4D analysis of the eye it is apparent that gene expression patterns are of limited value as cell/tissue fate markers (please compare the expression patterns of bambia to fsta in the revised Figure 4).
For addressing the neuroretinal flow by the expression of the BMP antagonists, their expression pattern at the optic vesicle stage are of importance. Here especially the expression pattern of fsta can explain the modulation of BMP signaling in the nasal and temporal domain facilitating the neuroretinal flow (please see the revised Figure 4).
2) The authors show BRE reporter expression in the dorsal domain at optic cup stage. At least one other BMP inhibitor, bambi, is already known to be expressed in the prospective dorsal domain (first temporal, then dorsal) throughout optic cup development (French et al., 2009). The coincidence of BMP inhibitor expression and BRE reporter expression suggests a potential negative feedback loop, though BMP signaling is not completely abolished in the dorsal domain, based on phospho-Smad staining (French et al., 2009) and BRE reporter expression. Therefore, fsta expression (and expression of other BMP inhibitors) may not mark a zone of repressed BMP signaling, as the authors have proposed.
We are thankful for this comment. We included the BMP antagonist bambi into our analyses and noted the strikingly overlapping patterns of BMP signaling activity and bambi expression (revised Figure 4). The referee is right in stating that bambi is not totally antagonizing BMP signaling but rather is modulating it or may be even modulated by it. With bambi alone it would be hard to explain the modulation of BMP signaling to facilitate the neuroretinal flow. However, fsta shows a different expression pattern (please see the revised Figure 4), able to explain the facilitation of the flow nicely.
3) The authors argue that BMP overexpression driven by rx2 does not lead to fate changes in the eye, by demonstrating unchanged expression of vax2. However, the embryo appears to be ∼18 somite stage (this is a guess given the lack of staging)? This reviewer was under the impression that the rx2 promoter does not begin to induce transcription until ∼14 somite stage, therefore, it is unclear if vax2 expression would be altered in such a short time. A later in situ (prim–5) would be a better control, especially given strong induction of the BRE and later phenotypes. Any clarification on promoter activity and timing would be welcome.
In situ hybridizations with a vax2 probe have been added (Figure 6–figure supplement 4). This figure shows the staining of control vs. rx2::BMP4 embryos at a later developmental stage (28 hpf). Although the vax2 domain is smaller in the rx2::BMP4 embryos, compared to the controls, it is not absent. Hence, the reason for the arrested flow (16.5–21.5) is unlikely an early mis-differentiation of the ventral domain.
4) The authors argue that there is no BMP activity in the early optic vesicle by using the BRE reporter line. Is it clear that this line reports all BMP activity? There is evidence that BMP signaling is active in the early optic vesicle: French et al., 2009, demonstrate strong phospho-Smad staining in the optic vesicle temporal region (which gives rise to the dorsal domain) at 6 and 10 somite stages.
We agree with the referee and included next to the analysis of BRE::GFP anti-pSmad 1/5/8 immunohistochemical stainings, both at different developmental stages (Figure 4). Notably the BMP signaling reporter shows a delay of activity, which can be explained by its nature as a transcriptional reporter. This suggests that BMP signaling still is active. This is in favour of a modulative action of the BMP antagonists rather than a total block. We thank the referees for this comment.
5) Cell movement from lens-averted to lens-facing domain has previously been analyzed via live imaging (Picker et al., 2009), cell tracking and volume measurements (Kwan et al., 2012). A novel finding would be when such flow ceases, thereby defining the definitive stem cell compartment; this was never demonstrated previously. The authors' movies are likely to contain that information, as the last embryo in Figure 2A appears older than prim–5, based on lens morphology.
We agree with the referee that Picker et al., as well as Kwan et al., described flow over the distal rim of the developing optic cup. It was not our intention not to acknowledge these findings. We extended the paragraph discussing this point in the revised version of the manuscript. In addition we added a reference to an additional manuscript speculating about such a flow (Li et al., 2000) even before Picker and Kwan.
The flow in the temporal domain was then shown by Picker et al. and confirmed by Kwan et al. The nasal flow was not demonstrated and the flow with respect to the origin of the optic fissure was not addressed before. The aspect of the dorsal pole, showing no flow, was also neither described nor addressed before.
Regarding the forming stem cell compartment (CMZ), this was part of our analyses. We describe the origin of the cells, which eventually reside in the CMZ domain, by tracking them backwards in 4D (Figure 3, Movie 5).
6) Embryo ages (somite stages or hours post fertilization) are lacking throughout the manuscript, making it difficult to place these movements in context of other known events.
The developmental stages of embryos have been added to the figure legends.
https://doi.org/10.7554/eLife.05216.026Article and author information
Author details
Funding
Deutsche Forschungsgemeinschaft (DFG/ Molecular mechanisms regulating optic fissure closure)
- Kerstin Krieglstein
- Joachim Wittbrodt
European Research Council (ERC) (Advanced Grant (AdG), LS3, ERC-2011-ADG)
- Joachim Wittbrodt
The funders had no role in study design, data collection and interpretation, or the decision to submit the work for publication.
Acknowledgements
We want to thank Karin Schumacher for generously providing space for finishing the work on this manuscript, Lea Schertel for excellent technical assistance, members of the Wittbrodt lab for material (P Haas and A Schmidt for the rx2: GFP construct and zebrafish line, B Höckendorf and M Stemmer for H2BGFP mRNA, B Höckendorf for FIJI related input) and constructive stimulating feedback, B Roman for the BRE: GFP zebrafish, William Harris for the vsx2: RFP zebrafish line and Lucia Poggi for making the vsx1: GFP zebrafish line available. We also want to thank Russ Hodge for valuable input on editing the manuscript. LS is recipient of a fellowship from the Hartmut-Hoffman-Berling International Graduate School (HBIGS). This work was supported by the Deutsche Forschungsgemeinschaft (JW, KK, SL) and the ERC (JW).
Reviewing Editor
- Tanya T Whitfield, University of Sheffield, United Kingdom
Version history
- Received: October 17, 2014
- Accepted: January 26, 2015
- Version of Record published: February 24, 2015 (version 1)
Copyright
© 2015, Heermann et al.
This article is distributed under the terms of the Creative Commons Attribution License, which permits unrestricted use and redistribution provided that the original author and source are credited.
Metrics
-
- 4,647
- Page views
-
- 666
- Downloads
-
- 66
- Citations
Article citation count generated by polling the highest count across the following sources: Scopus, Crossref, PubMed Central.
Download links
Downloads (link to download the article as PDF)
Open citations (links to open the citations from this article in various online reference manager services)
Cite this article (links to download the citations from this article in formats compatible with various reference manager tools)
Further reading
-
- Developmental Biology
- Neuroscience
Development of the nervous system depends on signaling centers – specialized cellular populations that produce secreted molecules to regulate neurogenesis in the neighboring neuroepithelium. In some cases, signaling center cells also differentiate to produce key types of neurons. The formation of a signaling center involves its induction, the maintenance of expression of its secreted molecules, and cell differentiation and migration events. How these distinct processes are coordinated during signaling center development remains unknown. By performing studies in mice, we show that Lmx1a acts as a master regulator to orchestrate the formation and function of the cortical hem (CH), a critical signaling center that controls hippocampus development. Lmx1a co-regulates CH induction, its Wnt signaling, and the differentiation and migration of CH-derived Cajal–Retzius neurons. Combining RNAseq, genetic, and rescue experiments, we identified major downstream genes that mediate distinct Lmx1a-dependent processes. Our work revealed that signaling centers in the mammalian brain employ master regulatory genes and established a framework for analyzing signaling center development.
-
- Developmental Biology
- Evolutionary Biology
Cephalochordates and tunicates represent the only two groups of invertebrate chordates, and extant cephalochordates – commonly known as amphioxus or lancelets – are considered the best proxy for the chordate ancestor, from which they split around 520 million years ago. Amphioxus has been an important organism in the fields of zoology and embryology since the 18th century, and the morphological and genomic simplicity of cephalochordates (compared to vertebrates) makes amphioxus an attractive model for studying chordate biology at the cellular and molecular levels. Here we describe the life cycle of amphioxus, and discuss the natural histories and habitats of the different species of amphioxus. We also describe their use as laboratory animal models, and discuss the techniques that have been developed to study different aspects of amphioxus.